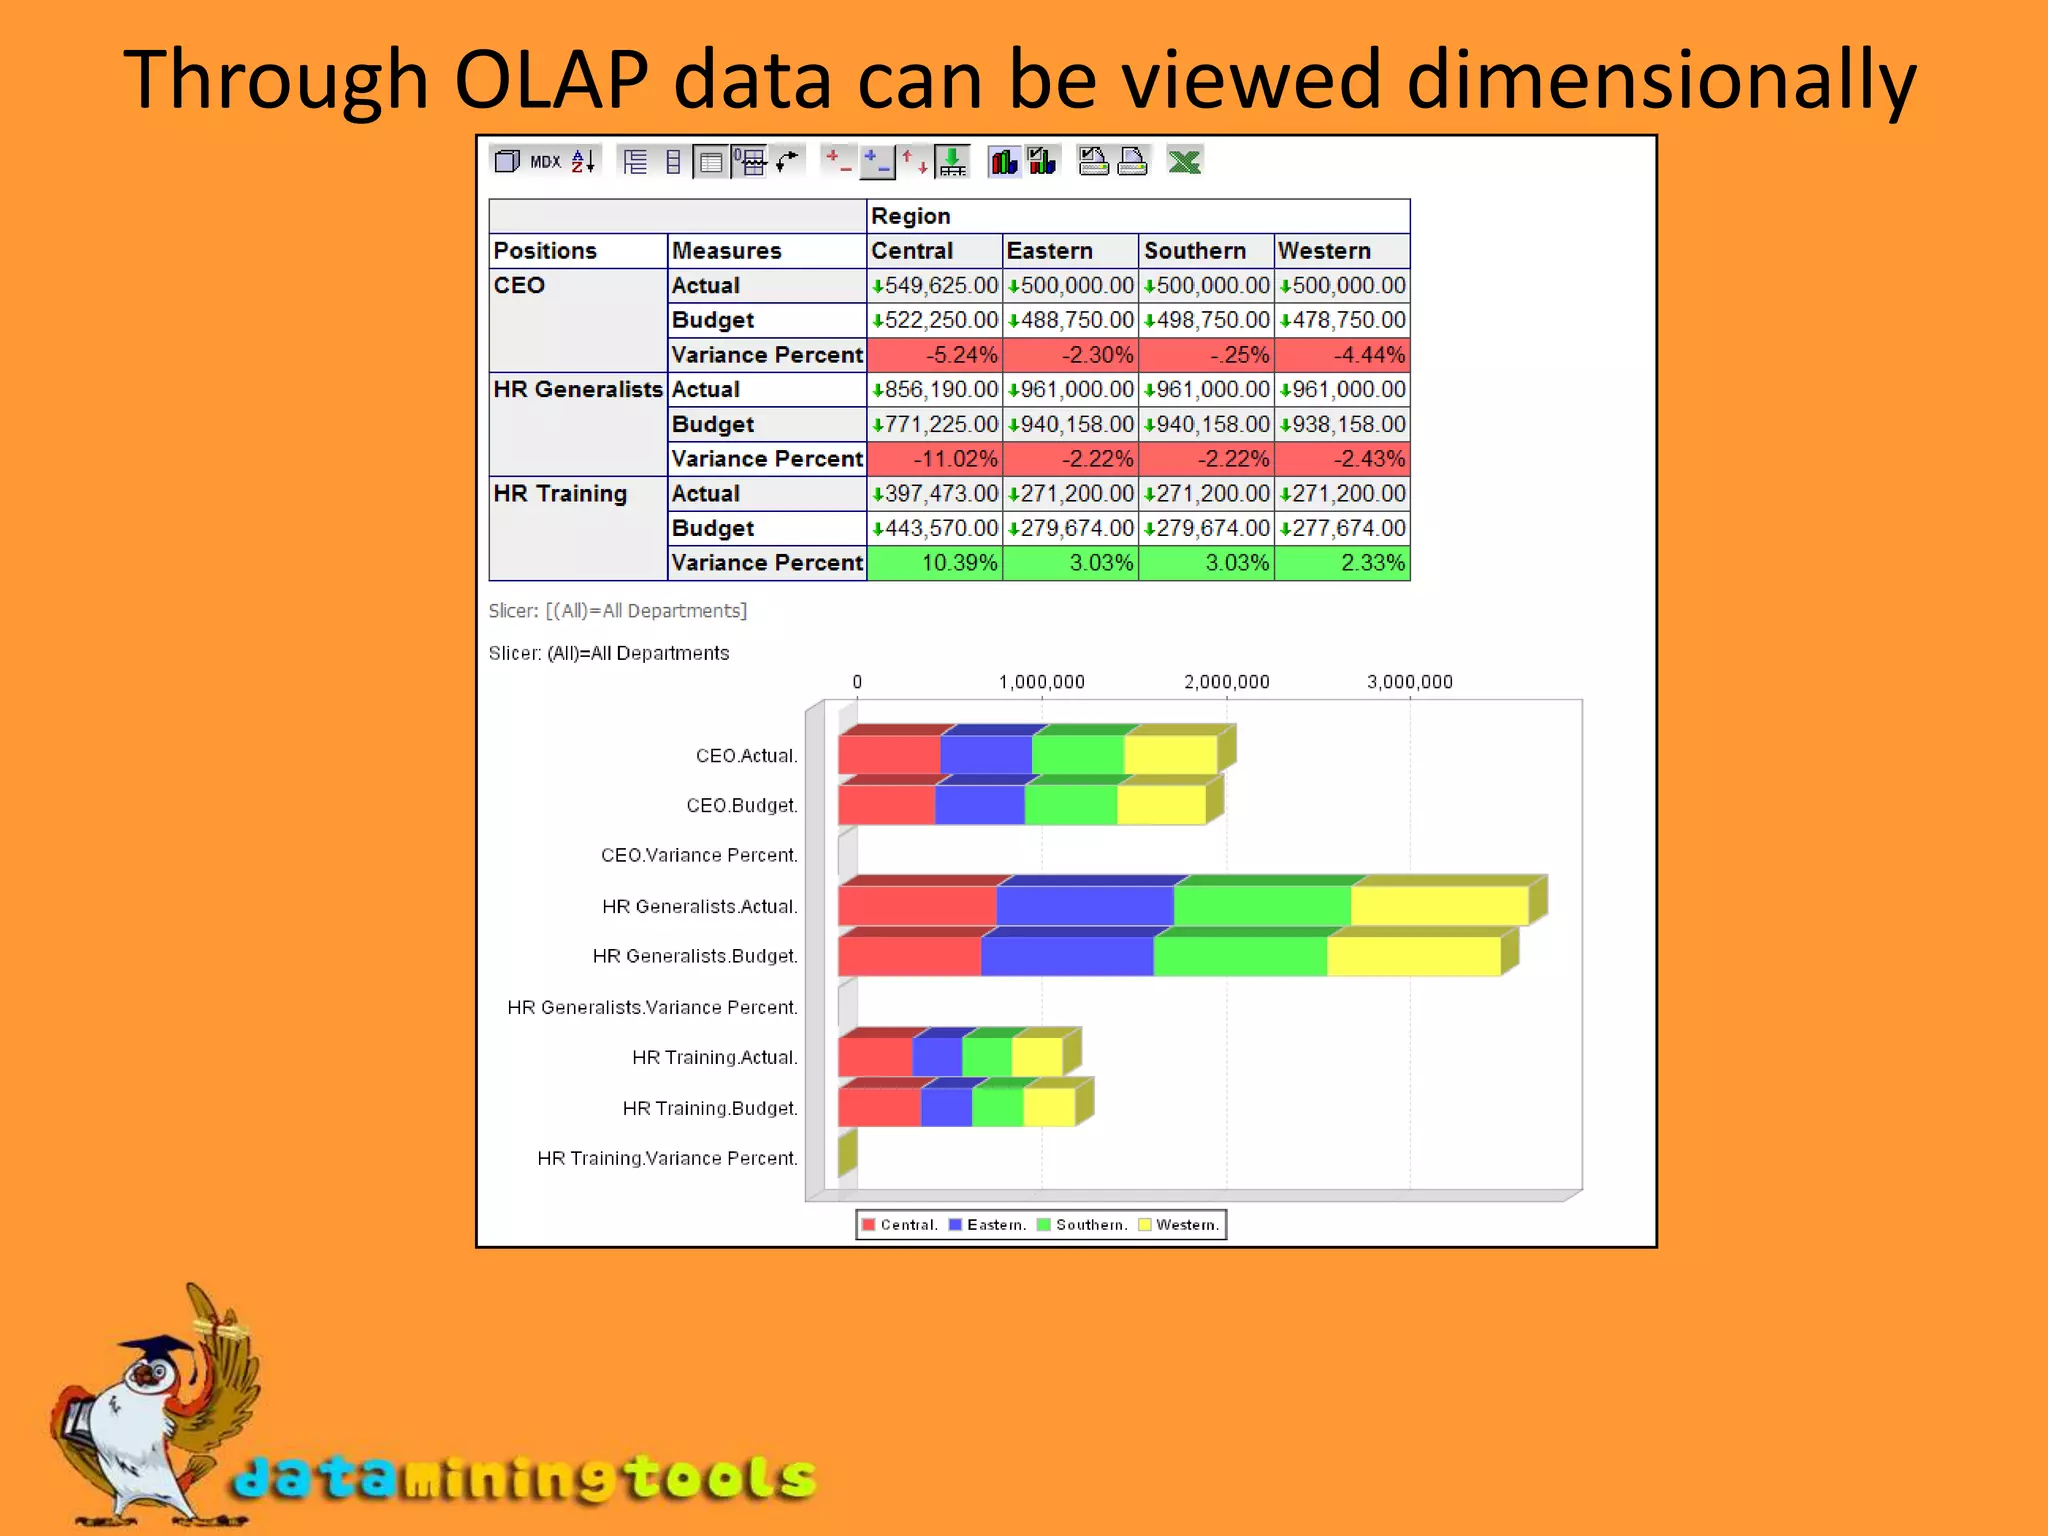
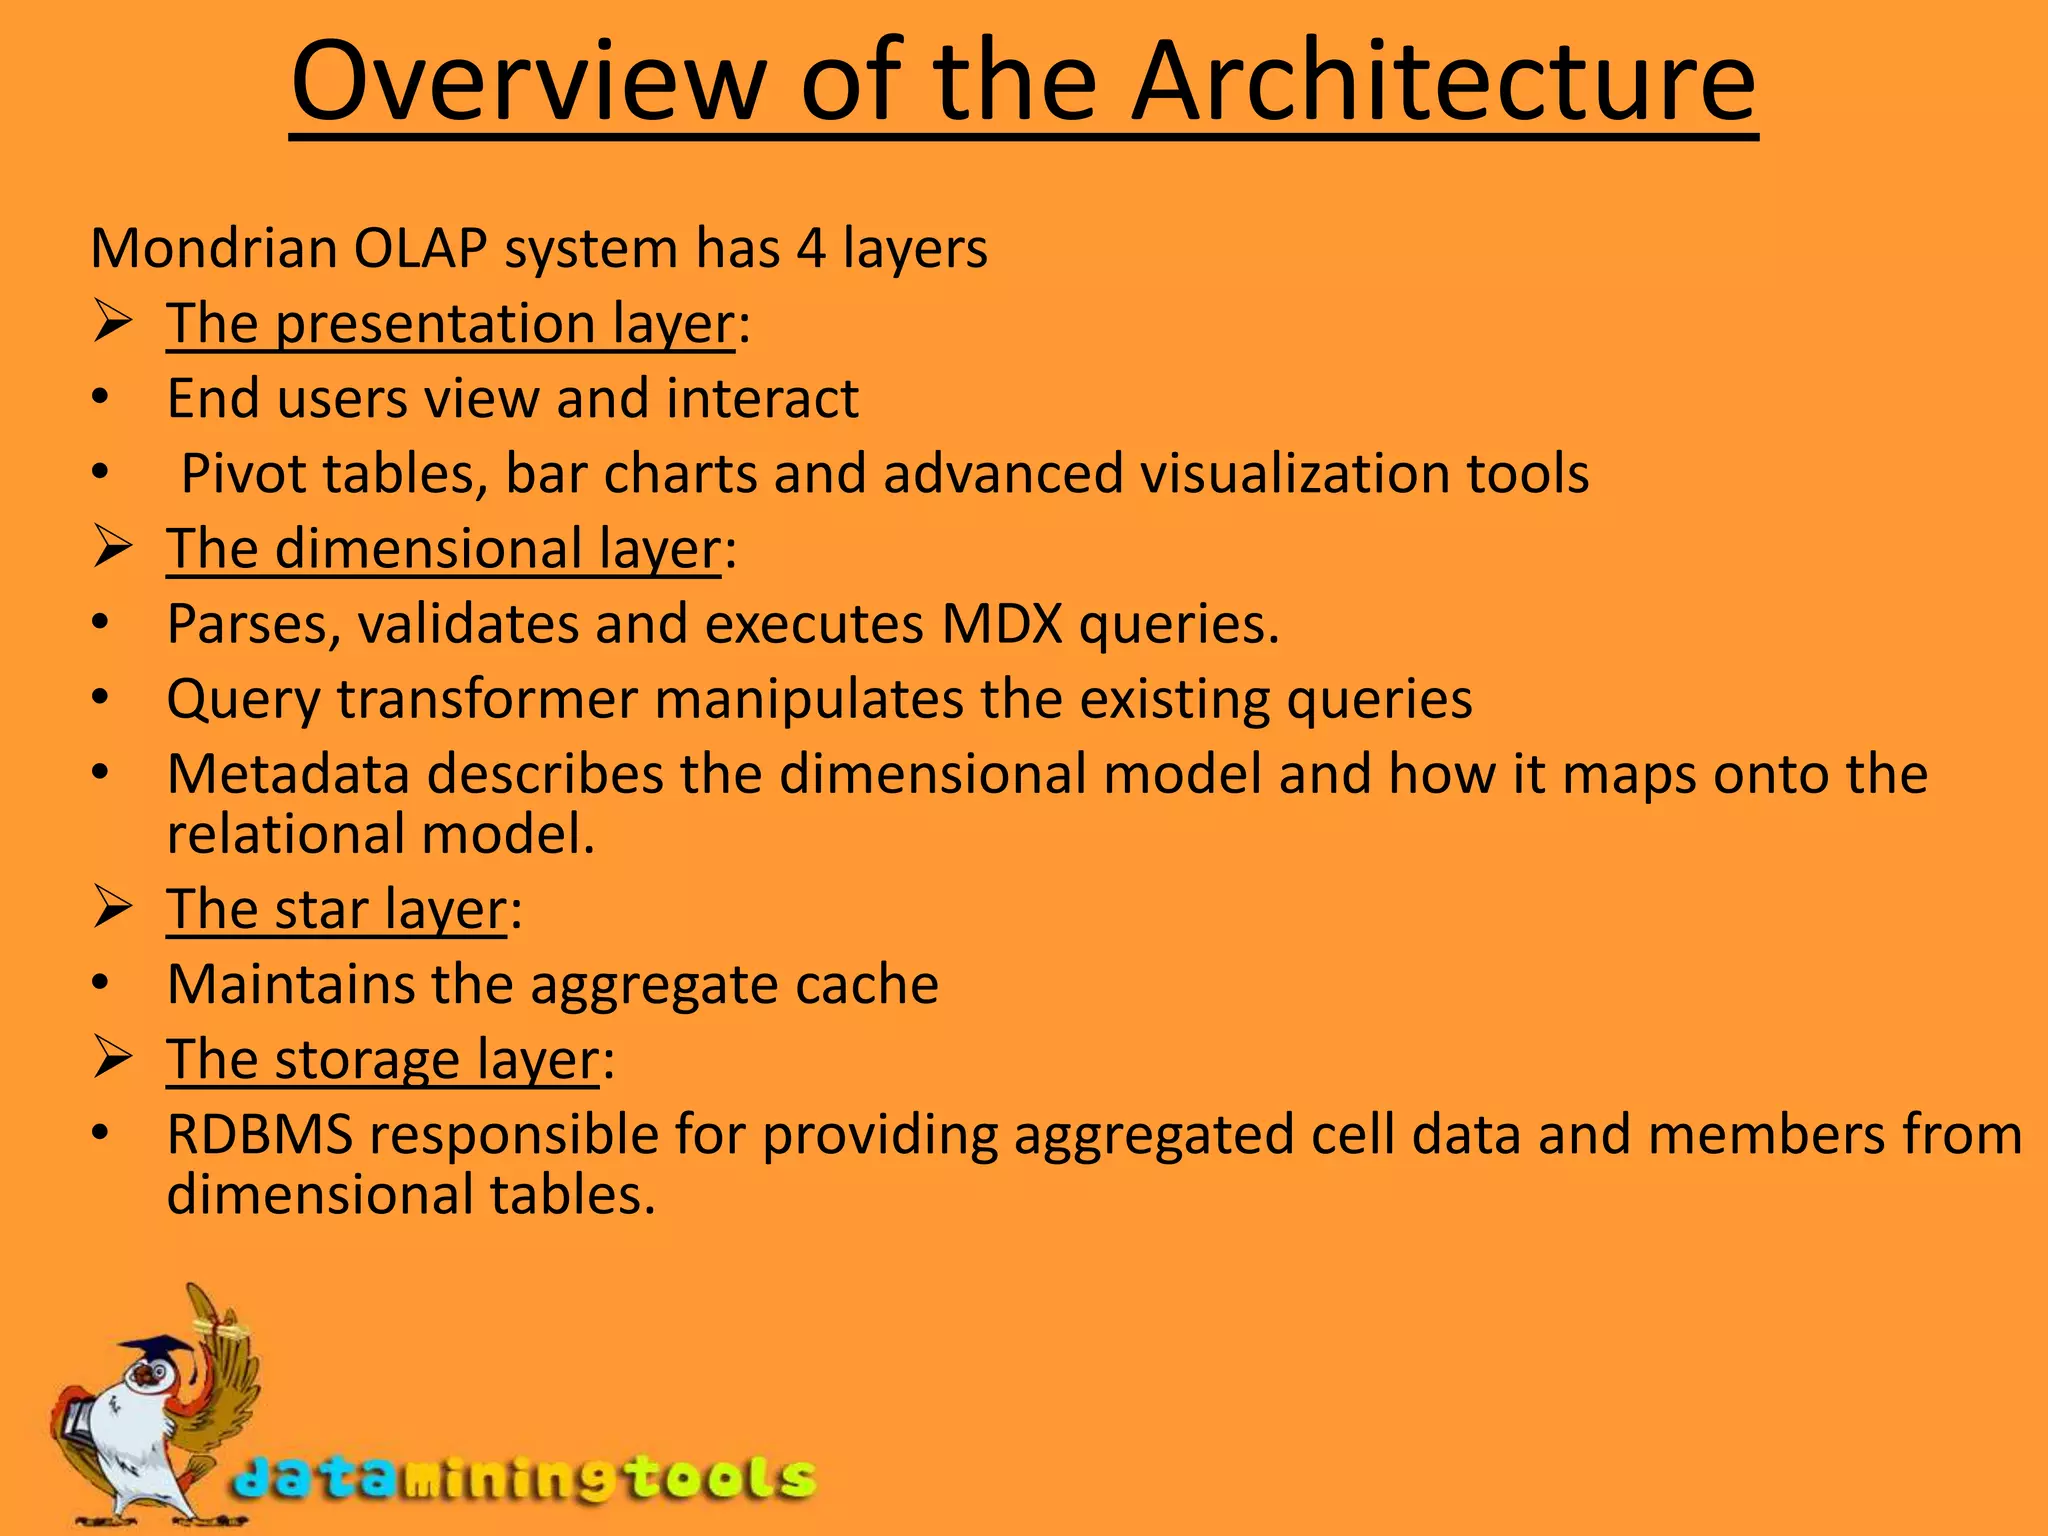
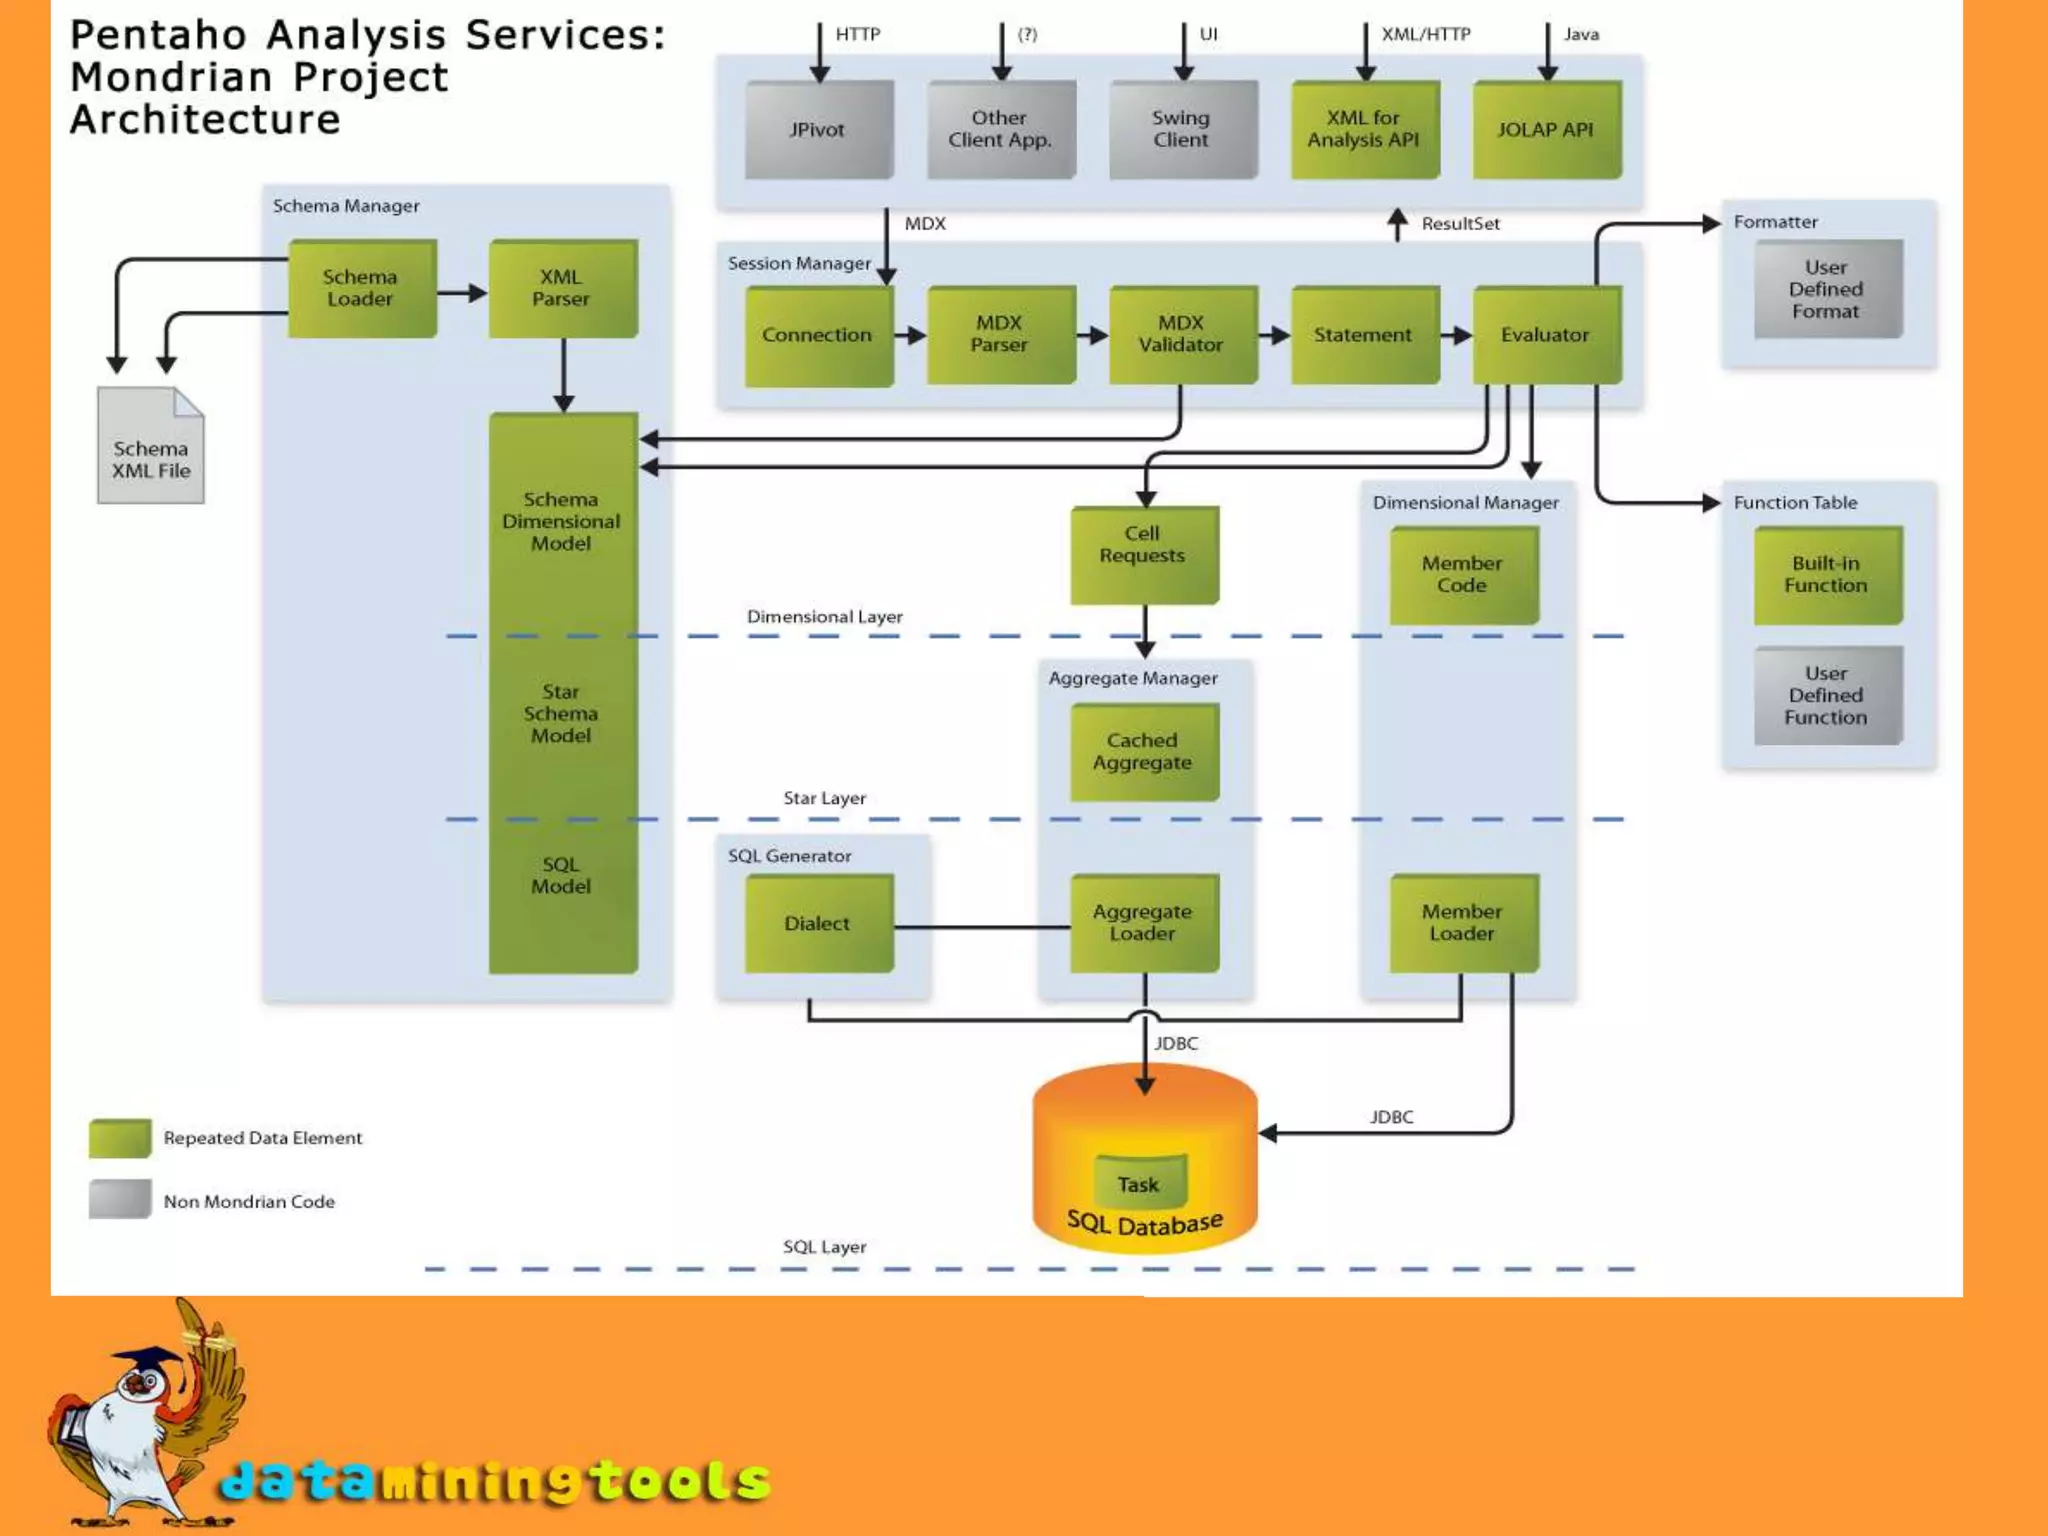
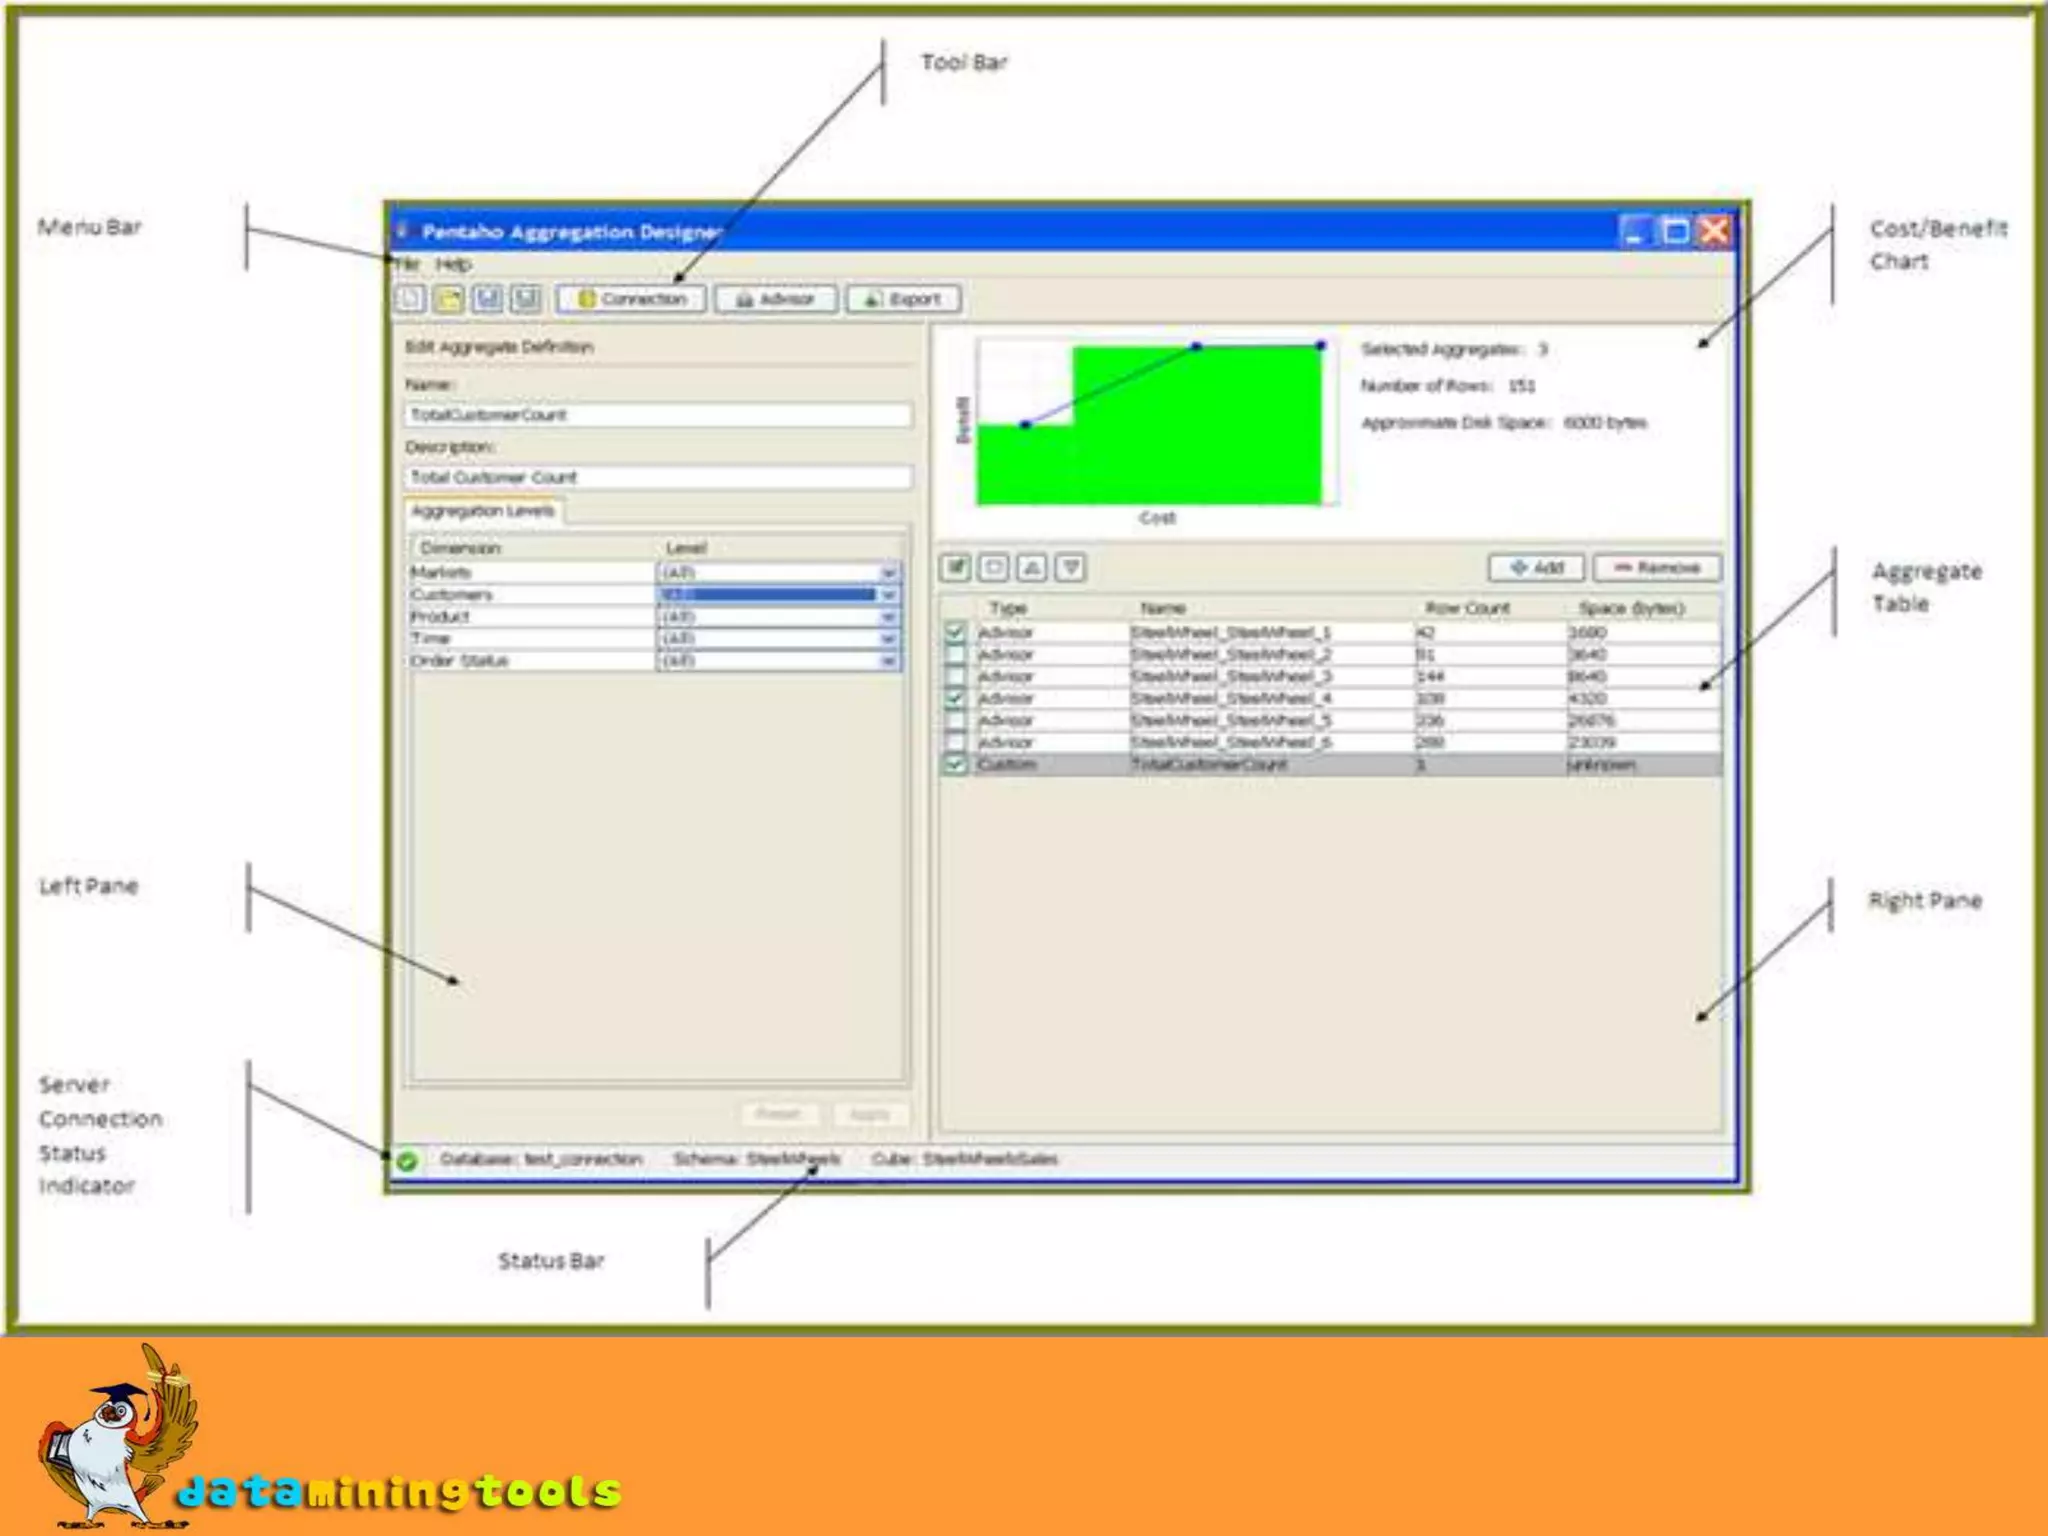
Pentaho Analysis provides interactive data analysis capabilities through components like the BI server, client tools, and Mondrian OLAP engine. It allows users to analyze data warehouses across dimensions like time, product, and customer. Key functionality includes an interactive web interface, scheduling, and sharing analysis views. Mondrian in particular provides fast response times, automated aggregation, and support for any JDBC data source through its OLAP capabilities like drilling and slicing.
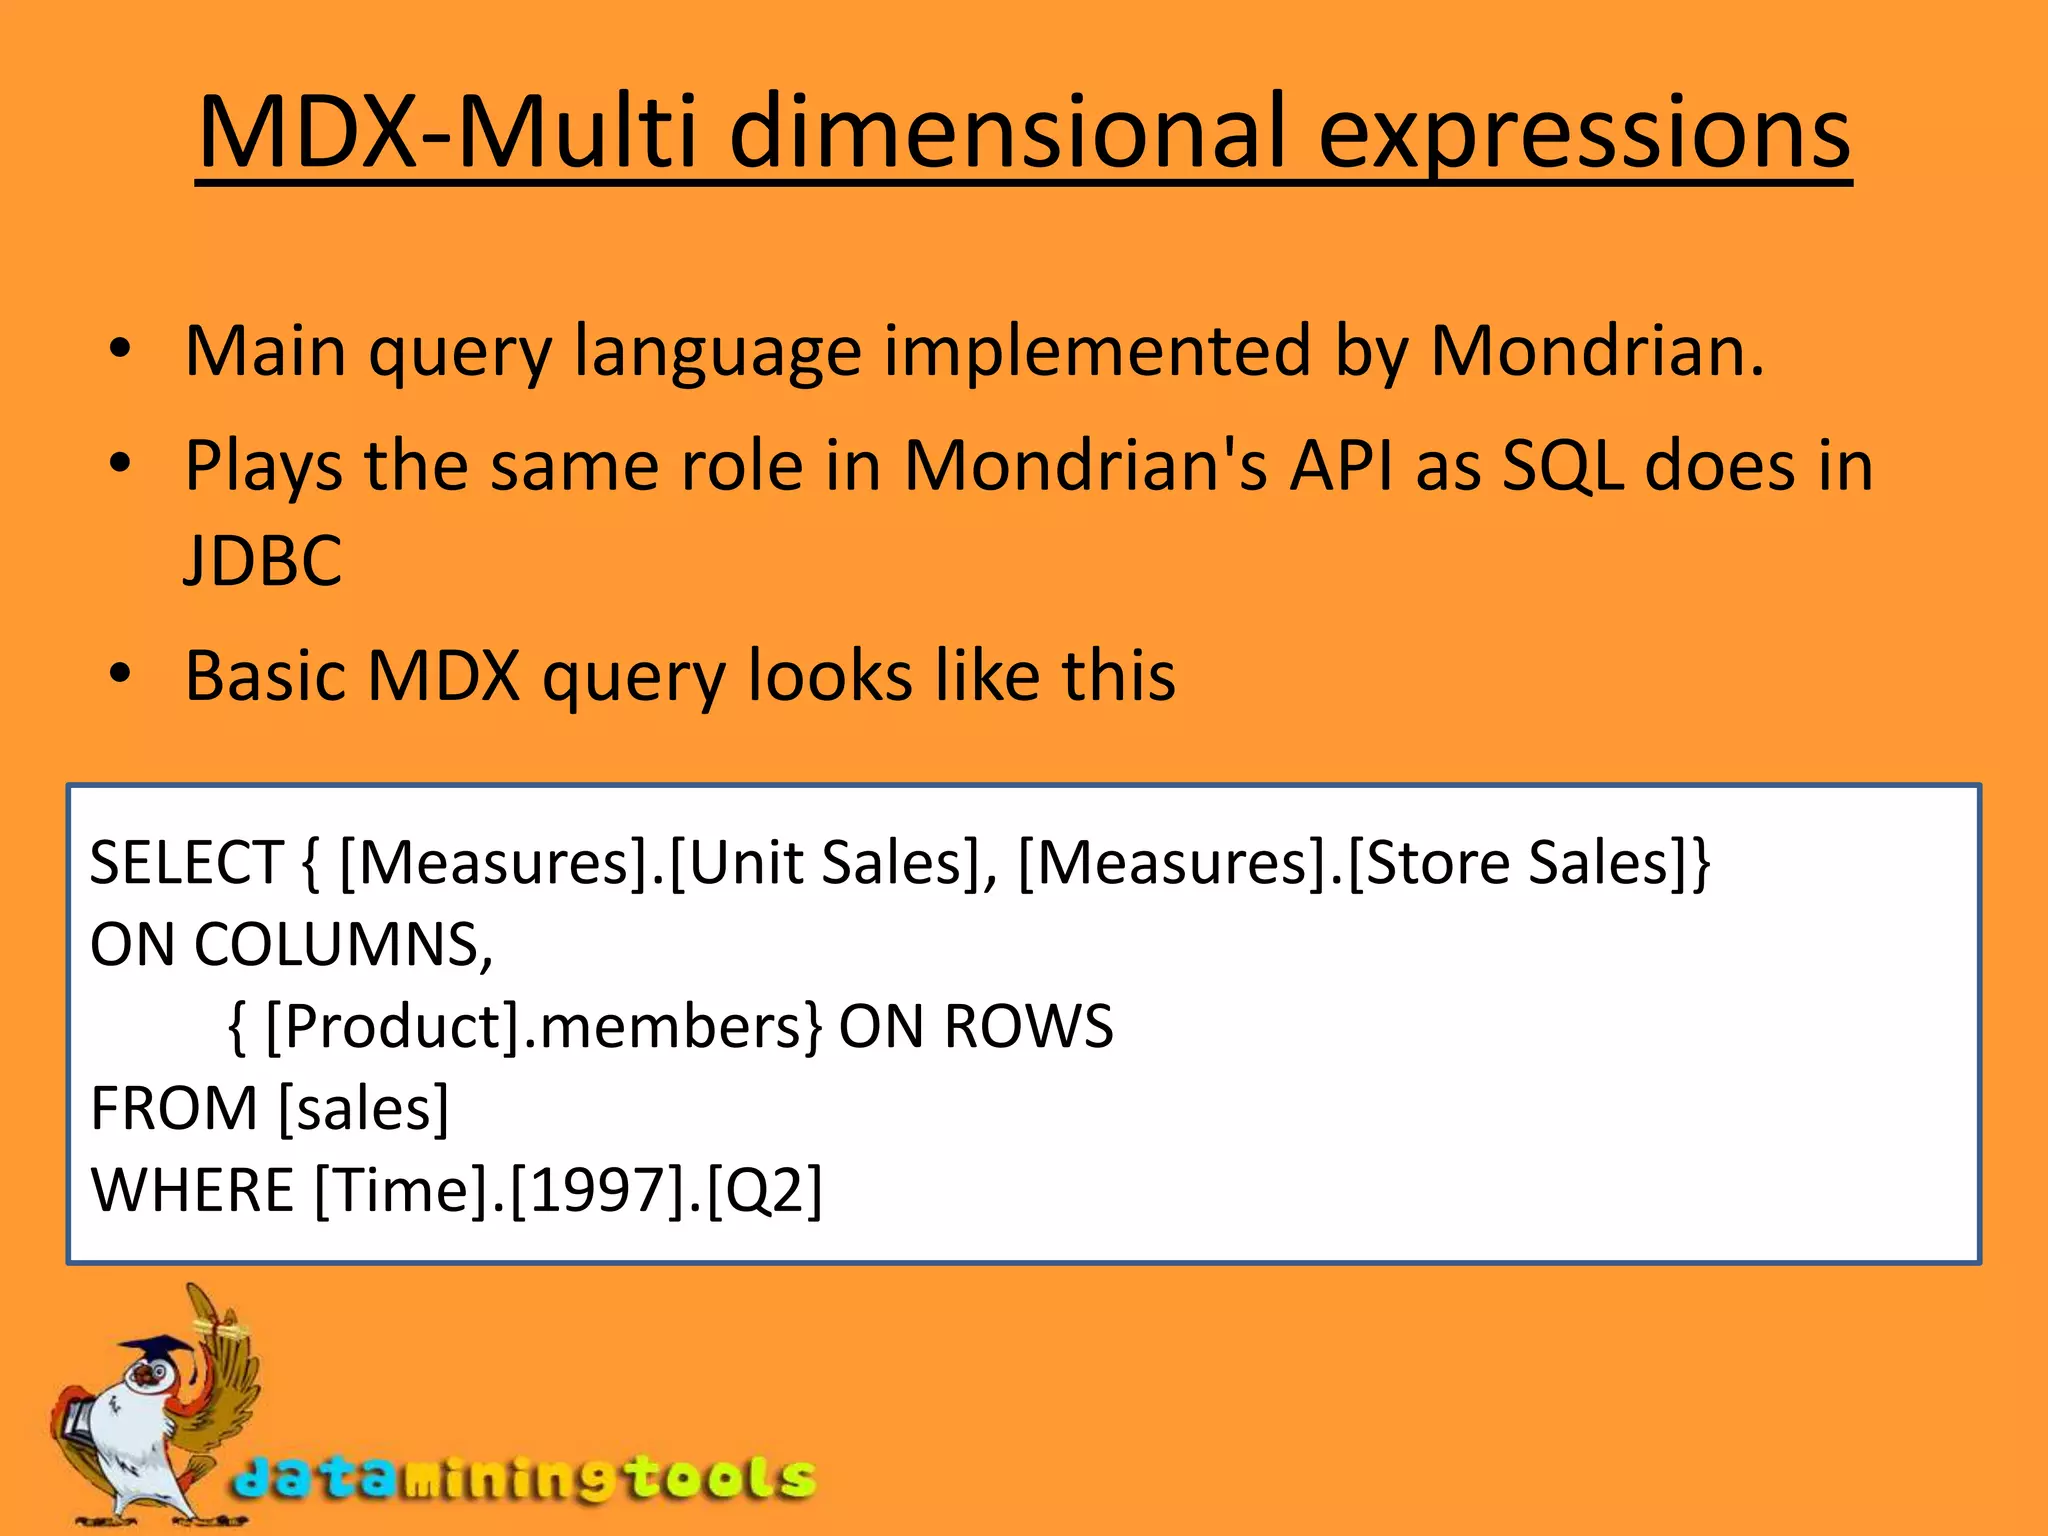
![MDX and XML/AMDX-Multi dimensional expressionsMain query language implemented by Mondrian.Plays the same role in Mondrian's API as SQL does in JDBCBasic MDX query looks like thisSELECT { [Measures].[Unit Sales], [Measures].[Store Sales]}ON COLUMNS, { [Product].members} ON ROWSFROM [sales]WHERE [Time].[1997].[Q2]](https://image.slidesharecdn.com/introductiontopentahoanalysis-100123100619-phpapp01/75/Introduction-To-Pentaho-Analysis-13-2048.jpg)


![Vibe Coding vs. Spec-Driven Development [Free Meetup]](https://cdn.slidesharecdn.com/ss_thumbnails/vibecodingvsspecdrivendevelopment-251209105622-43f455e7-thumbnail.jpg?width=640&height=640&fit=bounds)
