Effective range free localization scheme for wireless sensor networkijmnct
Location aware sensors can be used in many areas such as military and civilian applications. Wireless
Sensor Networks help to identify the accurate location of the event. In this paper a cost effective schema for
localization has been proposed. It uses two beacon nodes to identify the location of unknown nodes. It
also uses flooding and estimating method to accurately identify the location of other nodes. Available area
is divided into zones and beacons are provided for each zone. Beacon nodes are placed in appropriate
locations normally two in a zone to provide location information. Using the two nodes location of unknown
nodes can be calculated accurately.
NETWORK PERFORMANCE ENHANCEMENT WITH OPTIMIZATION SENSOR PLACEMENT IN WIRELES...ijwmn
From one side, sensor manufacturing technology and from other side wireless communication technology
improvement has an effect on the growth and deployment of Wireless Network Sensor (WSN). The
appropriate performance of WSN has abundant necessity which has dependent on the different parameters
such as optimize sensor placement and structure of network sensor. The optimized placement in WSN not
only would optimize number of sensors, but also help to reach to the more precise information. Therefore
different solutions are proposed to reduce cost and increase life time of sensor networks that most of them
are concentrated in the field of routing and information transmission. In this paper, places which they need
new sensors placement or sensor movements are determined and then with applying these changes,
performance of WSN will calculate. To achieve the optimum placement, the network should evaluate
precisely and effective criteria on the performance should extract. Therefore the criteria should be ranked
and after weighting with using AHP algorithms, with use of Geographical Information System (GIS), these
weighted criteria will combined and in the locations which WSN doesn’t have enough performance, new
sensor placement will create. New proposed method, improve 21.11% performance of WSN with sensor
placement in the low performance locations. Also the number of added sensor is 26.09% which is lowest
number of added sensors in comparison with other methods.
International Journal of Engineering and Science Invention (IJESI)inventionjournals
International Journal of Engineering and Science Invention (IJESI) is an international journal intended for professionals and researchers in all fields of computer science and electronics. IJESI publishes research articles and reviews within the whole field Engineering Science and Technology, new teaching methods, assessment, validation and the impact of new technologies and it will continue to provide information on the latest trends and developments in this ever-expanding subject. The publications of papers are selected through double peer reviewed to ensure originality, relevance, and readability. The articles published in our journal can be accessed online.
An Efficient Approach for Multi-Target Tracking in Sensor Networks using Ant ...ijsrd.com
Multi-Target Tracking for Sensor Networks using Ant Colony Optimization is proposed in this paper. The proposed approach uses ant colony optimization technique that composed of both dynamic and mobile nodes. While mobile nodes are used for optimizing the target tracking, dynamic nodes ensure the total coverage of the network. As a result, the performance of the Wireless Sensor Networks with multi-target tracking on mobility nodes will improve. While improving the performance of the wireless sensor networks, automatically minimum distance will be travelled by the nodes, thereby decreasing the energy consumption of the mobility nodes. This is achieved by selecting the optimal path by searching each path of the existing network. The software should check whether any chance of collision and if it is happening, then how to avoid it by providing a minimum delay for finding the optimal path. For finding the prediction of each node to reach the optimal path different methods should be applied, like k-means and random selection. The experimental results show that Object tracking with prediction mechanism is much better than without prediction mechanism.
Spectral analysis of remotely sensed images provide the required information accurately even for small
targets. Hence Hyperspectral imaging is being used which follows the technique of dividing images into
bands. These Hyperspectral images find their applications in agriculture, biomedical, marine analysis, oil
seeps detection etc. A Hyperspectral image contains many spectra, one for each individual point on the
sample’s surface and in this project the required target on the Hyperspectral image is going to be detected
and classified. Hyperspectral remote sensing image classification is a challenging problem because of its
high dimensional inputs, many class outputs and limited availability of reference data. Therefore some
powerful techniques to improve the accuracy of classification are required. The objective of our project is
to reduce the dimensionality of the Hyperspectral image using Principal Component Analysis followed by
classification using Neural Network. The project is to be implemented using MATLAB.
SENSOR SELECTION SCHEME IN TEMPERATURE WIRELESS SENSOR NETWORKijwmn
In this paper, we propose a novel energy efficient environment monitoring scheme for wireless sensor
networks, based on data mining formulation. The proposed adapting routing scheme for sensors for
achieving energy efficiency from temperature wireless sensor network data set. The experimental
validation of the proposed approach using publicly available Intel Berkeley lab Wireless Sensor Network
dataset shows that it is possible to achieve energy efficient environment monitoring for wireless sensor
networks, with a trade-off between accuracy and life time extension factor of sensors, using the proposed
approach.
An Overview of Localization Methods for Multi-Agent SystemsIJERA Editor
Localization of multi-agent systems is a fundamental requirement for multi-agent systems to operate and cooperate properly. The problem of localization can be divided into two categories; one in which a-priori information is available and the second where the global position is to be ascertained without a-priori information. This paper gives a comprehensive survey of localization techniques that exist in the literature for both the categories with the objectives of knowing the current state-of-the-art, helping in selecting the proper approach in a given scenario and promoting research in this area. A detailed description of methods that exist in the literature are provided in considerable detail. Then these methods are compared, and their weaknesses and strengths are discussed. Finally, some future research recommendations are drawn out of this survey
Cooperative Spectrum Sensing Technique Based on Blind Detection MethodINFOGAIN PUBLICATION
Spectrum sensing is a key task for cognitive radio. Our motivation is to increase the probability of detection of spectrum sensing in cognitive radio. The spectrum-sensing algorithms are proposed based on the statistical methods like EVD,CVD of a covariance matrix. In this Two test statistics are then extracted from the sample covariance matrix. The decision on the signal presence is made by comparing the two test statistics.The Detection probability and the associated threshold are found based on the statistical theory. In this paper, we study the collaborative sensing as a means to improve the performance of the proposed spectrum sensing technique and show their effect on cooperative cognitive radio network. Simulations results and performances evaluation are done in Matlab and the results are tabulated.
International Journal of Engineering Research and Applications (IJERA) is an open access online peer reviewed international journal that publishes research and review articles in the fields of Computer Science, Neural Networks, Electrical Engineering, Software Engineering, Information Technology, Mechanical Engineering, Chemical Engineering, Plastic Engineering, Food Technology, Textile Engineering, Nano Technology & science, Power Electronics, Electronics & Communication Engineering, Computational mathematics, Image processing, Civil Engineering, Structural Engineering, Environmental Engineering, VLSI Testing & Low Power VLSI Design etc.
NOISE REMOVAL TECHNIQUES FOR MICROWAVE REMOTE SENSING RADAR DATA AND ITS EVAL...cscpconf
Microwave Remote Sensing data acquired by a RADAR sensor such as SAR(Synthetic Aperture Radar) is affected by a peculiar kind of noise called speckle. This noise not only renders the
data ineffective for classification, texture analysis, segmentation etc. which are used for image analysis purposes, but also degrades the overall contrast and radiometric quality of the image. Here we discuss the various noise removal techniques which have been widely used by scientists all over the world. Different filtering methods have their pros and cons, and no single method can give the most satisfactory result. In order to circumvent those issues, better and better methods are being attempted. One of the recent methods is that based on Wavelet technique. This paper discusses the denoising techniques based on Wavelets and the results from some of those methods. The relative merits and demerits of the filters and their evaluation is also done.
Noise removal techniques for microwave remote sensing radar data and its eval...csandit
Microwave Remote Sensing data acquired by a RADAR sensor such as SAR(Synthetic Aperture
Radar) is affected by a peculiar kind of noise called speckle. This noise not only renders the
data ineffective for classification, texture analysis, segmentation etc. which are used for image
analysis purposes, but also degrades the overall contrast and radiometric quality of the image.
Here we discuss the various noise removal techniques which have been widely used by scientists
all over the world. Different filtering methods have their pros and cons, and no single method
can give the most satisfactory result. In order to circumvent those issues, better and better
methods are being attempted. One of the recent methods is that based on Wavelet technique.
This paper discusses the denoising techniques based on Wavelets and the results from some of
those methods. The relative merits and demerits of the filters and their evaluation is also done.
Error bounds for wireless localization in NLOS environmentsIJECEIAES
An efficient and accurate method to evaluate the fundamental error bounds for wireless sensor localization is proposed. While there already exist efficient tools like Cram ` erRao lower bound (CRLB) and position error bound (PEB) to estimate error limits, in their standard formulation they all need an accurate knowledge of the statistic of the ranging error. This requirement, under Non-Line-of-Sight (NLOS) environments, is impossible to be met a priori. Therefore, it is shown that collecting a small number of samples from each link and applying them to a non-parametric estimator, like the gaussian kernel (GK), could lead to a quite accurate reconstruction of the error distribution. A proposed Edgeworth Expansion method is employed to reconstruct the error statistic in a much more efficient way with respect to the GK. It is shown that with this method, it is possible to get fundamental error bounds almost as accurate as the theoretical case, i.e. when a priori knowledge of the error distribution is available. Therein, a technique to determine fundamental error limits–CRLB and PEB–onsite without knowledge of the statistics of the ranging errors is proposed.
PERFORMANCE ASSESSMENT OF ANFIS APPLIED TO FAULT DIAGNOSIS OF POWER TRANSFORMER ecij
Continuous monitoring of Power transformer is very much essential during its operation. Incipient faults inside the tank and winding insulation needs careful attention. Traditional ratio methods and Duval triangle can be employed to diagnose the incipient faults. Many times correct diagnosis due to the
borderline problems and the existence of multiple faults may not be possible. Artificial intelligence (AI) techniques could be the best solution to handle the non linearity and complexity in the input data. In the proposed work, adaptive neuro fuzzy inference system (ANFIS), is utilized to deal with 9 incipient fault conditions including healthy condition of power transformer with sufficient DGA transformer oil samples. Comparison of the diagnosis performance of both the methods of ANFIS and the feasibility pertaining to the problem is presented. Diagnosis error in classifying the oil samples and the network structure are the main considerations of the present study.
Support Recovery with Sparsely Sampled Free Random Matrices for Wideband Cogn...IJMTST Journal
The main objective of this project is to design an eigenvalue-based compressive SOE technique using asymptotic random matrix theory. In this project, investigating blind sparsity order estimation (SOE) techniques is an open research issue. To address this, this project presents an eigenvalue-based compressive SOE technique using asymptotic random matrix theory. Finally, this project propose a technique to estimate the sparsity order of the wideband spectrum with compressive measurements using the maximum eigenvalue of the measured signal's covariance matrix. .
Detecting minor genetic variants has become essential to cancer
and infectious disease management. Many have turned to next
generation sequencing to fill this need given the common
perception that the limit of detection (LOD) for Sanger sequencing
is somewhere between 15% to 25%1,2,3. We have discovered a
software algorithmic solution to reduce this detection limit to 5%
and have demonstrated detection at even lower allele frequencies.
Standard Sanger sequencing protocols can be used and the
method can generate the familiar electropherogram data display
with noise substantially reduced. This opens up an alternative for
detecting low level somatic variants.
The key observation that enabled this development is that the noise
underlying Sanger sequencing fluorescence data (traces) appears
to be highly correlated to the primary sequence in the data. Figure
1 shows the electropherograms from two different samples: the
control sample has the same primary sequence as the test sample
which contains a few minor variants.
Trend removal from raman spectra with local variance estimation and cubic spl...csijjournal
Trend removal is an important problem in most communication systems. Here, we show a proposed
algorithm for trend (background) removal from Raman Spectra by merging local variance estimation and
cubic spline interpolation methods. We found that Raman spectrum does not need a smoothing process to
remove trend from noisy signals. Employing this technique results in more speedy and noiseless systems
than other techniques that use wavelet transformation to suppress noise.
TREND REMOVAL FROM RAMAN SPECTRA WITH LOCAL VARIANCE ESTIMATION AND CUBIC SPL...csijjournal
Trend removal is an important problem in most communication systems. Here, we show a proposed algorithm for trend (background) removal from Raman Spectra by merging local variance estimation and cubic spline interpolation methods. We found that Raman spectrum does not need a smoothing process to remove trend from noisy signals. Employing this technique results in more speedy and noiseless systems than other techniques that use wavelet transformation to suppress noise
Trend Removal from Raman Spectra With Local Variance Estimation and Cubic Spl...csijjournal
Abstract
Trend removal is an important problem in most communication systems. Here, we show a proposed algorithm for trend (background) removal from Raman Spectra by merging local variance estimation and cubic spline interpolation methods. We found that Raman spectrum does not need a smoothing process to remove trend from noisy signals. Employing this technique results in more speedy and noiseless systems than other techniques that use wavelet transformation to suppress noise.
Keywords
Raman spectroscopy, Background correction method, Local variance, Cubic spline interpolation.
TREND REMOVAL FROM RAMAN SPECTRA WITH LOCAL VARIANCE ESTIMATION AND CUBIC SPL...csijjournal
Trend removal is an important problem in most communication systems. Here, we show a proposed algorithm for trend (background) removal from Raman Spectra by merging local variance estimation and cubic spline interpolation methods. We found that Raman spectrum does not need a smoothing process to remove trend from noisy signals. Employing this technique results in more speedy and noiseless systems than other techniques that use wavelet transformation to suppress noise.
AN EFFICIENT WAVELET BASED FEATURE REDUCTION AND CLASSIFICATION TECHNIQUE FOR...ijcseit
This research paper proposes an improved feature reduction and classification technique to identify mild and severe dementia from brain MRI data. The manual interpretation of changes in brain volume based on visual examination by radiologist or a physician may lead to missing diagnosis when a large number of MRIs are analyzed. To avoid the human error, an automated intelligent classification system is proposed
which caters the need for classification of brain MRI after identifying abnormal MRI volume, for the diagnosis of dementia. In this research work, advanced classification techniques using Support Vector Machines based on Particle Swarm Optimisation and Genetic algorithm are compared. Feature reduction
by wavelets and PCA are analysed. From this analysis, it is observed that the proposed classification of SVM based PSO is found to be efficient than SVM trained with GA and wavelet based feature reduction technique yields better results than PCA.
AN EFFICIENT WAVELET BASED FEATURE REDUCTION AND CLASSIFICATION TECHNIQUE FOR...ijcseit
This research paper proposes an improved feature reduction and classification technique to identify mild
and severe dementia from brain MRI data. The manual interpretation of changes in brain volume based on
visual examination by radiologist or a physician may lead to missing diagnosis when a large number of
MRIs are analyzed. To avoid the human error, an automated intelligent classification system is proposed
which caters the need for classification of brain MRI after identifying abnormal MRI volume, for the
diagnosis of dementia. In this research work, advanced classification techniques using Support Vector
Machines based on Particle Swarm Optimisation and Genetic algorithm are compared. Feature reduction
by wavelets and PCA are analysed. From this analysis, it is observed that the proposed classification of
SVM based PSO is found to be efficient than SVM trained with GA and wavelet based feature reduction
technique yields better results than PCA.
Non-parametric Vertical Box Algorithm for Detecting Amplitude Information in ...CSCJournals
Vertical boxes algorithm (VBA) for non-cooperative automatic discrimination between digital signals with amplitude information (AI) from those without AI is presented. The problem is not new and several solutions have been proposed. Unlike them VBA needs no information about propagation conditions and the received signal parameters. No SNR and noise distribution assumptions are made, no carrier frequency and no thresholds are required. The only assumption made is the symbol rate interval which may be as wide as desired. The signal is considered only in the time domain. VBA also distinguishes between some other classes of signals.
LASSO MODELING AS AN ALTERNATIVE TO PCA BASED MULTIVARIATE MODELS TO SYSTEM W...mathsjournal
Principal component analysis (PCA) is a widespread and widely used in various areas of science such as bioinformatics, econometrics, and chemometrics among others. Once that PCA is based in the eigenvalues and the eigenvectors which are a very weak approach to high dimension systems with degrees of sparsity and in these situations the PCA is no longer a recommended procedure. Sparsity is very common in near infrared spectroscopy due to the large number of spectra required and the water absorption broad bands what makes these spectra very similar and with heavy sparsity in matrix dataset, demoting the precision and accuracy, in the multivariate modeling and within projections of data matrix in smaller dimensions. To overcoming these shortcomings the LASSO, a not PCA based method, model was applied to a NIR spectra dataset from Biodiesel and its performance was, statistically, compared with traditional multivariate modeling such as PCR and PLSR.
LASSO MODELING AS AN ALTERNATIVE TO PCA BASED MULTIVARIATE MODELS TO SYSTEM W...mathsjournal
Principal component analysis (PCA) is a widespread and widely used in various areas of science such as
bioinformatics, econometrics, and chemometrics among others. Once that PCA is based in the
eigenvalues and the eigenvectors which are a very weak approach to high dimension systems with
degrees of sparsity and in these situations the PCA is no longer a recommended procedure. Sparsity is
very common in near infrared spectroscopy due to the large number of spectra required and the water
absorption broad bands what makes these spectra very similar and with heavy sparsity in matrix dataset,
demoting the precision and accuracy, in the multivariate modeling and within projections of data matrix
in smaller dimensions. To overcoming these shortcomings the LASSO, a not PCA based method, model
was applied to a NIR spectra dataset from Biodiesel and its performance was, statistically, compared
with traditional multivariate modeling such as PCR and PLSR.
Hybrid optimization of pumped hydro system and solar- Engr. Abdul-Azeez.pdffxintegritypublishin
Advancements in technology unveil a myriad of electrical and electronic breakthroughs geared towards efficiently harnessing limited resources to meet human energy demands. The optimization of hybrid solar PV panels and pumped hydro energy supply systems plays a pivotal role in utilizing natural resources effectively. This initiative not only benefits humanity but also fosters environmental sustainability. The study investigated the design optimization of these hybrid systems, focusing on understanding solar radiation patterns, identifying geographical influences on solar radiation, formulating a mathematical model for system optimization, and determining the optimal configuration of PV panels and pumped hydro storage. Through a comparative analysis approach and eight weeks of data collection, the study addressed key research questions related to solar radiation patterns and optimal system design. The findings highlighted regions with heightened solar radiation levels, showcasing substantial potential for power generation and emphasizing the system's efficiency. Optimizing system design significantly boosted power generation, promoted renewable energy utilization, and enhanced energy storage capacity. The study underscored the benefits of optimizing hybrid solar PV panels and pumped hydro energy supply systems for sustainable energy usage. Optimizing the design of solar PV panels and pumped hydro energy supply systems as examined across diverse climatic conditions in a developing country, not only enhances power generation but also improves the integration of renewable energy sources and boosts energy storage capacities, particularly beneficial for less economically prosperous regions. Additionally, the study provides valuable insights for advancing energy research in economically viable areas. Recommendations included conducting site-specific assessments, utilizing advanced modeling tools, implementing regular maintenance protocols, and enhancing communication among system components.
Saudi Arabia stands as a titan in the global energy landscape, renowned for its abundant oil and gas resources. It's the largest exporter of petroleum and holds some of the world's most significant reserves. Let's delve into the top 10 oil and gas projects shaping Saudi Arabia's energy future in 2024.
Welcome to WIPAC Monthly the magazine brought to you by the LinkedIn Group Water Industry Process Automation & Control.
In this month's edition, along with this month's industry news to celebrate the 13 years since the group was created we have articles including
A case study of the used of Advanced Process Control at the Wastewater Treatment works at Lleida in Spain
A look back on an article on smart wastewater networks in order to see how the industry has measured up in the interim around the adoption of Digital Transformation in the Water Industry.
Student information management system project report ii.pdfKamal Acharya
Our project explains about the student management. This project mainly explains the various actions related to student details. This project shows some ease in adding, editing and deleting the student details. It also provides a less time consuming process for viewing, adding, editing and deleting the marks of the students.
Water scarcity is the lack of fresh water resources to meet the standard water demand. There are two type of water scarcity. One is physical. The other is economic water scarcity.
Immunizing Image Classifiers Against Localized Adversary Attacksgerogepatton
This paper addresses the vulnerability of deep learning models, particularly convolutional neural networks
(CNN)s, to adversarial attacks and presents a proactive training technique designed to counter them. We
introduce a novel volumization algorithm, which transforms 2D images into 3D volumetric representations.
When combined with 3D convolution and deep curriculum learning optimization (CLO), itsignificantly improves
the immunity of models against localized universal attacks by up to 40%. We evaluate our proposed approach
using contemporary CNN architectures and the modified Canadian Institute for Advanced Research (CIFAR-10
and CIFAR-100) and ImageNet Large Scale Visual Recognition Challenge (ILSVRC12) datasets, showcasing
accuracy improvements over previous techniques. The results indicate that the combination of the volumetric
input and curriculum learning holds significant promise for mitigating adversarial attacks without necessitating
adversary training.
Final project report on grocery store management system..pdfKamal Acharya
In today’s fast-changing business environment, it’s extremely important to be able to respond to client needs in the most effective and timely manner. If your customers wish to see your business online and have instant access to your products or services.
Online Grocery Store is an e-commerce website, which retails various grocery products. This project allows viewing various products available enables registered users to purchase desired products instantly using Paytm, UPI payment processor (Instant Pay) and also can place order by using Cash on Delivery (Pay Later) option. This project provides an easy access to Administrators and Managers to view orders placed using Pay Later and Instant Pay options.
In order to develop an e-commerce website, a number of Technologies must be studied and understood. These include multi-tiered architecture, server and client-side scripting techniques, implementation technologies, programming language (such as PHP, HTML, CSS, JavaScript) and MySQL relational databases. This is a project with the objective to develop a basic website where a consumer is provided with a shopping cart website and also to know about the technologies used to develop such a website.
This document will discuss each of the underlying technologies to create and implement an e- commerce website.
2. P. Du et al.
2
tion by pattern matching in the wavelet space. Transforming into
the wavelet space and making use of the additional shape informa-
tion present in the wavelet coefficients can greatly enhance the
effective SNR. As a result, the CWT-based method can detect
weak peaks but maintain a low overall false positive rate.
The second difficulty of peak detection comes from the follow-
ing observation: the width and height of ‘true’ MS peaks can vary
a great deal in the same spectrum, for instance, peaks at high m/z
value regions are usually wider and have a lower amplitude. In
addition, the shape of a peak can be altered due to the overlap of
multiple peaks and noise. Thus, fixed pattern matching, like some
matched filtering (Andreev, et al., 2003) and deconvolution algo-
rithms (Vivo-Truyols, et al., 2005), will usually fail. The wavelet
transformation provides a method for resolving these problems and
has been widely used in signal processing and bioinformatics for
multi-scale analysis of DNA sequence (Nilanjan Dasgupta, et al.),
protein sequence (Lio and Vannucci, 2000), and microarray tempo-
ral profile (Klevecz and Murray, 2001). In proteomics research, the
wavelet transformation has been used for denoising (Coombes, et
al., 2005) and feature extraction (Qu, et al., 2003; Randolph,
2005). Lange et al. (2006) recently proposed using the CWT in
peak detection and peak parameter estimation. Their idea is first
decomposing the spectrum into small segments, and then using the
CWT at a certain scale to detect peaks and estimate peak parame-
ters. However, it is not easy to select the right CWT scales for
different segments of a spectrum before analyzing the data.
In order to build a robust pattern matching method, we also ap-
plied the CWT in MS peak detection. In contrast to the algorithm
proposed by (Lange, et al., 2006), we directly apply the CWT over
the raw spectrum and utilize the information over the 2-D CWT
coefficients matrix, which provides additional information on how
the CWT coefficients change over scales. By visualizing the 2-D
CWT coefficients as a false color image, the ridges in the image
can be correlated with the peaks in the MS spectrum, and this pro-
vides an easy visualization technique for assessing the quality of
the data and the ability of the method to resolve peaks. Therefore,
instead of directly detecting peaks in the MS spectrum, the algo-
rithm identifies ridges in the 2-D CWT coefficient matrix and util-
izes these coefficients to determine the effective SNR and to iden-
tify peaks. By identifying peaks and assigning SNR in the wavelet
space, the issues surrounding the baseline correction and data are
both removed, since these preprocessing steps are not required.
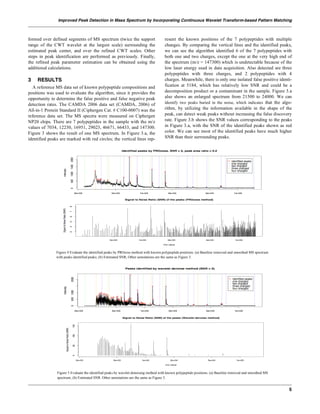
As presented below, the algorithm was evaluated with MS spec-
tra with known polypeptide compositions and positions. Compari-
sons with other two peak detection algorithms are also presented.
The results show that for these spectra the CWT-based peak detec-
tion algorithm provides lower false negative identification rates
and is more robust to noise than the other algorithms.
2 METHODS
In this section, we will briefly introduce the CWT, describe the
algorithm for identifying the ridges over the 2-D CWT coeffi-
cients, and define the SNR in the wavelet space. Finally, we spec-
ify a robust rule set for peak identification.
2.1 Continuous Wavelet Transform (CWT)
Wavelet transformation methods can be categorized as the Dis-
crete Wavelet Transform (DWT) or the CWT. The DWT operates
over scales and positions based on the power of two. It is non-
redundant, more efficient and is sufficient for exact reconstruction.
As a result, the DWT is widely used in data compression and fea-
ture extraction. The CWT allows wavelet transforms at every scale
with continuous translation. The redundancy of the CWT makes
the information available in peak shape and peak composition of
MS data more visible and easier to interpret. The change in the
CWT coefficients over different scales provides additional infor-
mation for pattern matching. In addition, there is no requirement
for an orthogonal wavelet in the CWT. The CWT is widely used in
pattern matching, such as discontinuity and chirp signal detection
(Carmona, et al., 1998). Mathematically, the CWT can be repre-
sented as (Daubechies, 1992):
!
C(a,b) = s(t)"a,b (t)dt
R
# , "a,b (t) =
1
a
"(
t $ b
a
), a % R+
${0}, b % R
[1]
where
!
s(t) is the signal,
!
a is the scale,
!
b is the translation,
!
"(t) is the
mother wavelet,
!
"a,b (t) is the scaled and translated wavelet, and C is the 2-
D matrix of wavelet coefficients.
Intuitively, the wavelet coefficients reflect the pattern matching
between the signal
!
s and
!
"a,b (t). Higher coefficients indicate better
matching. By changing the scale a ,
!
"a,b (t) can match the patterns
at different scales without invoking more complicated nonlinear
curve fitting.
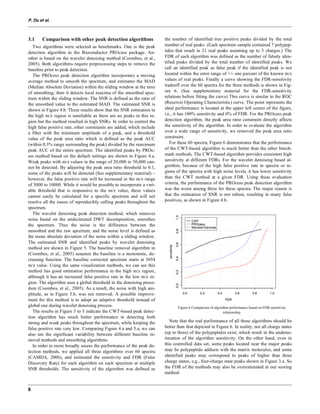
For peak detection, we exam-
ine the effect of changes in the
width and height of peaks by the
scaled and translated wavelet
!
"a,b (t) . In order to get better
performance, the wavelet should
have the basic features of a peak,
which includes approximate
symmetry and one major posi-
tive peak. In this work, we se-
lected the Mexican Hat wavelet
as the mother wavelet in the analysis (Daubechies, 1992). The
Mexican Hat wavelet (Figure 1) is proportional to the second de-
rivative of the Gaussian probability density function. The effective
support range of Mexican Hat wavelet is [-5, 5]. The Mexican Hat
wavelet without scaling (
!
a =1) provides the best matches for the
peaks with the width of about two sample intervals, as shown in
Figure 1. With the wavelet scale increased to
!
a1
, the peaks with
bigger width,
!
2a1
, provide the best matches. For the peaks in a MS
spectrum, the corresponding CWT coefficients at each scale have a
local maximum around the peak center. Starting from scale
!
a =1,
the amplitude of the local maximum gradually increases as the
CWT scale increases, reaches a maximum when the scale best
matches the peak width, and gradually decreases later. In the 3-D
space, this is just like a ridge if we visualize the 2-D CWT coeffi-
cients with the amplitude of the CWT coefficients as the third di-
mension. It transforms the peak detection problem into finding
ridges over the 2-D CWT coefficient matrix, a problem that is less
susceptible to local minima and more robust to changes in coeffi-
cients in the search space. The peak width can be estimated based
on the CWT scale corresponding to the maximum point on the
ridge. And the maximum CWT coefficient on the ridge is ap-
proximately proportional to the AUC (Area Under Curve) of the
peak within the wavelet support region. AUC is the canonical way
to identify the strength of a peak in spectral analysis. By looking at
2
Figure 1 Mexican Hat wavelet
3. Improved Peak Detection in Mass Spectrum by Incorporating Continuous Wavelet Transform-based Pattern Matching
3
the ridge in the wavelet space, additional information about the
shape and distribution of a putative peak can be obtained.
2.2 Removal of the baseline
With the adoption of the CWT-based pattern matching, peak de-
tection can be directly applied over the raw data without preproc-
essing steps, including the baseline removal. Suppose each peak in
the raw data,
!
Praw(t), can be represented as:
!
Praw (t) = P(t) + B(t) + C,
!
t " [t1,t2] [2]
where
!
P(t) is the real peak,
!
B(t) is the baseline function with 0 mean,
!
C
is a constant, and
!
[t1,t2] is the support region of the peak.
Based on equation [1], we can calculate the CWT coefficients of
the peak:
!
C(a,b) = P(t)"a,b (t)dt
R
# + B(t)"a,b (t)dt
R
# + C"a,b (t)dt
R
#
[3]
where
!
"a,b
is the scaled and translated wavelet function.
As we assume the baseline is slow changing and monotonic in
the peak support region, the baseline of the peak can be locally
approximated as a constant C plus an odd function B(t) defined in
the peak support region and with the peak center as the original
point. Because the wavelet function
!
"a,b
has a zero mean, the third
term in equation [3] will be zero. For symmetric wavelet function,
like Mexican Hat wavelet, the second term will also approximately
be zero. Thus, only the term with real peak P(t) is left in equation
[3]. That is to say, as long as the baseline is slowly changing and
locally monotonic in the peak support region, it will be automati-
cally removed in calculating the CWT coefficients.
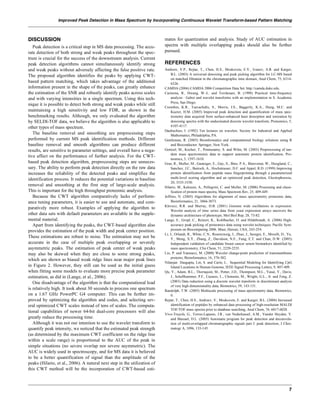
2.3 Peak identification process
Figure 2 shows an example of the peak identification process. In
order to provide a better visual image, we performed the CWT at
33 scale levels (from 1 to 64 at an interval of 2) directly over the
raw MS spectrum. A segment of the computed 2-D CWT coeffi-
cients are shown in false color in Figure 2.b. The yellow color
represents the high amplitude, and green represents low. We can
clearly identify the ridges in the 2-D CWT coefficients matrix
corresponding to the peaks in the raw spectrum (Figure 2.a). The
major peaks correspond to long and high ridges, while the small
peaks correspond to short and low ridges. This provides a visual
indication of peaks using ridges with different heights and lengths.
Identify the ridges by linking the local maxima
The ridges can be identified by linking the local maxima of
CWT coefficients at each scale level. First, the local maxima at
each scale are detected. The identification of local maxima is simi-
lar to the method used in the PROcess R package in Bioconductor
(www.bioconductor.org) (Gentleman, 2005). A sliding window is
used, whose size is proportional to the wavelet support region at
the scale. The next step is to link these local maxima as lines,
which represent the ridges we are trying to identify.
Suppose the 2-D CWT coefficient matrix is
!
N " M, where N is
the number of CWT scales, and M is the length of the MS spec-
trum. The procedure of ridge identification is:
(1) Initialize the ridge lines based on the local maxima points
identified at the largest scale, i.e., row
!
n (
!
n = N) in the
CWT coefficient matrix, and set the initial gap number of
ridge lines as 0;
Figure 2 Peak identification process based on CWT. (a) The raw MS spectrum. (b) The CWT coefficient image (yellow repre-
sents high amplitude, green represents low.) (c) The identified ridge lines based on CWT coefficient image. The colors of the
dots represent the relative strength of the CWT coefficients. Blue represents high (the maximum CWT coefficients in the picture)
and yellow represents close to zero.
4. P. Du et al.
4
(2) For each ridge line with its gap number less than a certain
threshold, search the nearest maximum point at the next
adjacent scale, row
!
n "1 in the coefficient matrix. The
maximum allowed distance between the nearest points
should be less than the sliding window size at that scale
level. If there is no closest point found, the gap number of
the ridge line is increased by one, or else the gap number
is set to zero;
(3) Save the ridge lines having gap number larger than the
threshold and remove them from the searching list;
(4) For the maxima points not linked to the points at the upper
level, they will be initiated as new ridge lines;
(5) Repeat steps 2 to 4, until it reaches the smallest scale row
!
n =1 in the CWT coefficient matrix.
The identified ridge lines are shown in Figure 2.c. The colors of
the dots represent the relative strength of the coefficients. Blue
represents high (the maximum CWT coefficients in the picture)
and yellow represents close to zero. Comparing Figure 2.b and c,
we can see a high degree of correlation.
Definition of the Signal to Noise Ratio (SNR)
Before defining the SNR in the wavelet space, signal and noise
must be defined first. Based on the assumption that the real MS
peaks have an instrument-specific characteristic shape, the signal
strength of a peak is defined as the maximum CWT coefficient on
the ridge line within a certain scale range. As for the noise, we
assume that it is composed of positive or negative peaks with very
narrow width. Since the baseline drift has been removed by the
transformation into the wavelet space, the CTW coefficients at the
smallest scale
!
(a =1) are a good estimate of the noise level. The
local noise level of a peak is defined as the 95-percentage quantile
of the absolute CWT coefficient values
!
(a =1) within a local win-
dow surrounding the peak. A minimum noise level can be provided
to avoid the noise level close to zero, which could happen when
some region is very smooth. Thus, the SNR is defined as the ratio
of the estimated peak signal strength and the local noise level of
the peak.
Identify the peaks based on the ridge lines
Three rules are defined to identify the major peaks:
(1) The scale corresponding to the maximum amplitude on the
ridge line, which is proportional to the width of the peak,
should be within a certain range;
(2) The SNR should be larger than a certain threshold;
(3) The length of ridge lines should be larger than a certain
threshold;
Usually, there are small peaks around the major peaks, which are
commonly assigned as polypeptide adducts with the matrix mole-
cules. These peaks have shorter ridge lines than the major strong
peaks. By reducing the threshold of rule 3 in the surrounding area
of major peaks, the small surrounding peaks can be easily identi-
fied. The proposed algorithm provides an option to do this. The
algorithm also allows changing the threshold in rule 1 and 3 over
the m/z value, which can better reflect the peak width changing
over the m/z value.
The proposed algorithm provides two options to estimate the
peak position. One way is following the ridge line from high scale
to the small scale, the position at some small scale estimates the
position of the peak maximum; another way is to estimate the peak
centroid position based on the maximum CWT coefficient within
certain scale range on the ridge line. The first method provides the
results similar with other conventional peak detection algorithms.
While the peak center estimation usually is more consistent over
multiple spectra. In Figure 2.a, the identified peaks with the default
setting are marked as red circles at the peak maxima position,
which also include the nearby small peaks of the strong peaks.
Refine the peak parameter estimation
For the computational efficiency, peak identification is based on
the CWT coefficients at selected scales. As a result, only the ap-
proximate peak strength, peak width and peak center position can
be estimated. If a better estimate of peak parameters is required,
the CWT needs to be performed over refined scales. Since we have
already estimated the approximate peak parameters, for each iden-
tified peak, additional calculations of CWT only need to be per-
Figure 3 Evaluate the identified peaks of CWT-based algorithm with known polypeptide positions. (a) Raw MS spectrum with peaks identified by
CWT-based algorithm marked with red circles. Vertical dotted lines indicate the location of known polypeptides with different charge number; (b)
SNR of the peaks calculated in CWT-based algorithm with identified peaks plotted as red.
5. Improved Peak Detection in Mass Spectrum by Incorporating Continuous Wavelet Transform-based Pattern Matching
5
formed over defined segments of MS spectrum (twice the support
range of the CWT wavelet at the largest scale) surrounding the
estimated peak center, and over the refined CWT scales. Other
steps in peak identification are performed as previously. Finally,
the refined peak parameter estimation can be obtained using the
additional calculations.
3 RESULTS
A reference MS data set of known polypeptide compositions and
positions was used to evaluate the algorithm, since it provides the
opportunity to determine the false positive and false negative peak
detection rates. The CAMDA 2006 data set (CAMDA, 2006) of
All-in-1 Protein Standard II (Ciphergen Cat. # C100-0007) was the
reference data set. The MS spectra were measured on Ciphergen
NP20 chips. There are 7 polypeptides in the sample with the m/z
values of 7034, 12230, 16951, 29023, 46671, 66433, and 147300.
Figure 3 shows the result of one MS spectrum. In Figure 3.a, the
identified peaks are marked with red circles; the vertical lines rep-
resent the known positions of the 7 polypeptides with multiple
changes. By comparing the vertical lines and the identified peaks,
we can see the algorithm identified 6 of the 7 polypeptides with
both one and two charges, except the one at the very high end of
the spectrum (m/z = 147300) which is undetectable because of the
low laser energy used in data acquisition. Also detected are three
polypeptides with three charges, and 2 polypeptides with 4
charges. Meanwhile, there is only one isolated false positive identi-
fication at 5184, which has relatively low SNR and could be a
decomposition product or a contaminant in the sample. Figure 3.a
also shows an enlarged spectrum from 21500 to 24000. We can
identify two peaks buried in the noise, which indicates that the algo-
rithm, by utilizing the information available in the shape of the
peak, can detect weak peaks without increasing the false discovery
rate. Figure 3.b shows the SNR values corresponding to the peaks
in Figure 3.a, with the SNR of the identified peaks shown as red
color. We can see most of the identified peaks have much higher
SNR than their surrounding peaks.
Figure 5 Evaluate the identified peaks by wavelet denoising method with known polypeptide positions. (a) Baseline removed and smoothed MS
spectrum; (b) Estimated SNR. Other annotations are the same as Figure 3.
Figure 4 Evaluate the identified peaks by PROcess method with known polypeptide positions. (a) Baseline removed and smoothed MS spectrum
with peaks identified peaks; (b) Estimated SNR; Other annotations are the same as Figure 3.
6. P. Du et al.
6
3.1 Comparison with other peak detection algorithms
Two algorithms were selected as benchmarks. One is the peak
detection algorithm in the Bioconductor PROcess package. An-
other is based on the wavelet denoising method (Coombes, et al.,
2005). Both algorithms require preprocessing steps to remove the
baseline prior to peak detection.
The PROcess peak detection algorithm incorporates a moving
average method to smooth the spectrum, and estimates the MAD
(Median Absolute Deviation) within the sliding window at the time
of smoothing; then it detects local maxima of the smoothed spec-
trum within the sliding window. The SNR is defined as the ratio of
the smoothed value to the estimated MAD. The estimated SNR is
shown in Figure 4.b. These results show that the SNR estimation in
the high m/z region is unreliable as there are no peaks in this re-
gion but the method resulted in high SNRs. In order to control the
high false positive rate, other constraints are added, which include
a filter with the minimum amplitude of a peak, and a threshold
value of the peak area ratio which is defined as the peak AUC
(within 0.3% range surrounding the peak) divided by the maximum
peak AUC of the entire spectrum. The identified peaks by PROc-
ess method based on the default settings are shown in Figure 4.a.
Weak peaks with m/z values in the range of 20,000 to 50,000 can-
not be detected. By adjusting the peak area ratio threshold to 0.1,
some of the peaks will be detected (See supplementary material) –
however, the false positive rate will be increased in the m/z range
of 3000 to 10000. While it would be possible to incorporate a vari-
able threshold that is responsive to the m/z value, these values
cannot easily be calculated for a specific spectrum and will not
resolve all the issues of reproducibly calling peaks throughout the
spectrum.
The wavelet denoising peak detection method, which removes
noise based on the undecimated DWT decomposition, smoothes
the spectrum. Thus the noise is the difference between the
smoothed and the raw spectrum, and the noise level is defined as
the mean absolute deviation of the noise within a sliding window.
The estimated SNR and identified peaks by wavelet denoising
method are shown in Figure 5. The baseline removal algorithm in
(Coombes, et al., 2005) assumes the baseline is a monotonic, de-
creasing function. The baseline corrected spectrum starts at 3054
m/z value. Using the same visualization methods, we can see this
method has good estimation performance in the high m/z region,
although it has an increased false positive rate in the low m/z re-
gion. The algorithm uses a global threshold in the denoising proce-
dure (Coombes, et al., 2005). As a result, the noise with high am-
plitude, as in Figure 5.b, was not removed. A possible improve-
ment for this method is to adopt an adaptive threshold instead of
global one during wavelet denoising process.
The results in Figure 3 to 5 indicate the CWT-based peak detec-
tion algorithm has much better performance in detecting both
strong and weak peaks throughout the spectrum, while keeping the
false positive rate very low. Comparing Figure 4.a and 5.a, we can
also see the significant variability between different baseline re-
moval methods and smoothing algorithms.
In order to more broadly assess the performance of the peak de-
tection methods, we applied all three algorithms over 60 spectra
(CAMDA, 2006), and estimated the sensitivity and FDR (False
Discovery Rate) for each algorithm on each spectrum at multiple
SNR thresholds. The sensitivity of the algorithm was defined as
the number of identified true positive peaks divided by the total
number of real peaks. (Each spectrum sample contained 7 polypep-
tides that result in 21 real peaks assuming up to 3 charges.) The
FDR of each algorithm was defined as the number of falsely iden-
tified peaks divided by the total number of identified peaks. We
call an identified peak as false peak if the identified peak is not
located within the error range of +/- one percent of the known m/z
values of real peaks. Finally a curve showing the FDR-sensitivity
tradeoff over the 60 spectra for the three methods is shown in Fig-
ure 6. (See supplementary material for the FDR-sensitivity
relations before fitting the curve) This curve is similar to the ROC
(Receiver Operating Characteristic) curve. The point represents the
ideal performance is located at the upper left corner of the figure,
i.e., it has 100% sensitivity and 0% of FDR. For the PROcess peak
detection algorithm, the peak area ratio constraint directly affects
the sensitivity of the algorithm. In order to evaluate the algorithm
over a wide range of sensitivity, we removed the peak area ratio
constraint.
For these 60 spectra, Figure 6 demonstrates that the performance
of the CWT-based algorithm is much better than the other bench-
mark methods. The CWT-based algorithm provides consistent high
sensitivity at different FDRs. For the wavelet denoising based al-
gorithm, because of the high false positive rate in spectra or re-
gions of the spectra with high noise levels, it has lower sensitivity
than the CWT method at a given FDR. Using these evaluation
criteria, the performance of the PROcess peak detection algorithm
was the worst among three for these spectra. The major reason is
that the estimation of SNR is not robust, resulting in many false
positives, as shown in Figure 4.b.
Note that the real performance of all these algorithms should be
better than that depicted in Figure 6. In reality, not all charge states
(up to three) of the polypeptides exist, which result in the underes-
timation of the algorithm sensitivity. On the other hand, even in
this controlled data set, some peaks located near the major peaks
may be polypeptide adducts with the matrix molecules, and some
identified peaks may correspond to peaks of higher than three
charge states, e.g., four-charge state peaks shown in Figure 3.a. So
the FDR of the methods may also be overestimated in our scoring
method.
Figure 6 Comparison of algorithm performance based on FDR-sensitivity
relationship.
7. Improved Peak Detection in Mass Spectrum by Incorporating Continuous Wavelet Transform-based Pattern Matching
7
DISCUSSION
Peak detection is a critical step in MS data processing. The accu-
rate detection of both strong and weak peaks throughout the spec-
trum is crucial for the success of the downstream analysis. Current
peak detection algorithms cannot simultaneously identify strong
and weak peaks without adversely affecting the false positive rate.
The proposed algorithm identifies the peaks by applying CWT-
based pattern matching, which takes advantage of the additional
information present in the shape of the peaks, can greatly enhance
the estimation of the SNR and robustly identify peaks across scales
and with varying intensities in a single spectrum. Using this tech-
nique it is possible to detect both strong and weak peaks while still
maintaining a high sensitivity and low FDR, as shown in the
benchmarking results. Although, we only evaluated the algorithm
by SELDI-TOF data, we believe the algorithm is also applicable to
other types of mass spectrum.
The baseline removal and smoothing are preprocessing steps
performed by current MS peak identification methods. Different
baseline removal and smooth algorithms can produce different
results, are sensitive to parameter settings, and overall have a nega-
tive affect on the performance of further analysis. For the CWT-
based peak detection algorithm, preprocessing steps are unneces-
sary. The ability to perform peak detection directly on the raw data
increases the reliability of the detected peaks and simplifies the
identification process. It reduces the potential variations in baseline
removal and smoothing at the first step of large-scale analysis.
This is important for the high throughput proteomic analysis.
Because the CWT algorithm comparatively lacks of perform-
ance tuning parameters, it is easier to use and automate, and com-
paratively more robust. Examples of applying the algorithm to
other data sets with default parameters are available in the supple-
mental material.
Apart from identifying the peaks, the CWT-based algorithm also
provides the estimation of the peak width and peak center position.
These estimations are robust to noise. The estimation may not be
accurate in the case of multiple peak overlapping or severely
asymmetric peaks. The estimation of peak center of weak peaks
may also be skewed when they are close to some strong peaks,
which are shown as biased weak ridge lines near major peak lines
in Figure 2. However, they still can be used as the initial guess
when fitting some models to evaluate more precise peak parameter
estimation, as did in (Lange, et al., 2006).
One disadvantage of the algorithm is that the computational load
is relatively high. It took about 30 seconds to process one spectrum
on a 1.67 GHz PowerPC G4 computer. This can be further im-
proved by optimizing the algorithm and codes, and selecting sev-
eral optimized CWT scales instead of tens of scales. The computa-
tional capabilities of newer 64-bit dual-core processors will also
greatly reduce the processing time.
Although it was not our intention to use the wavelet transform to
quantify peak intensity, we noticed that the estimated peak strength
(as determined by the maximum CWT coefficient on the ridge line
within a scale range) is proportional to the AUC of the peak in
simple situations (no severe overlap nor severe asymmetric). The
AUC is widely used in spectroscopy, and for MS data it is believed
to be a better quantification of signal than the amplitude of the
peaks (Hilario, et al., 2006). A natural next step in the utilization of
this CWT method will be the incorporation of CWT-based esti-
mates for quantization and analysis. Study of AUC estimation in
spectra with multiple overlapping peaks should also be further
pursued.
REFERENCES
Andreev, V.P., Rejtar, T., Chen, H.S., Moskovets, E.V., Ivanov, A.R. and Karger,
B.L. (2003) A universal denoising and peak picking algorithm for LC-MS based
on matched filtration in the chromatographic time domain, Anal Chem, 75, 6314-
6326.
CAMDA (2006) CAMDA 2006 Competition Data Set. http://camda.duke.edu.
Carmona, R., Hwang, W.-L. and Torrâesani, B. (1998) Practical time-frequency
analysis : Gabor and wavelet transforms with an implementation in S. Academic
Press, San Diego.
Coombes, K.R., Tsavachidis, S., Morris, J.S., Baggerly, K.A., Hung, M.C. and
Kuerer, H.M. (2005) Improved peak detection and quantification of mass spec-
trometry data acquired from surface-enhanced laser desorption and ionization by
denoising spectra with the undecimated discrete wavelet transform, Proteomics, 5,
4107-4117.
Daubechies, I. (1992) Ten lectures on wavelets. Society for Industrial and Applied
Mathematics, Philadelphia, PA.
Gentleman, R. (2005) Bioinformatics and computational biology solutions using R
and Bioconductor. Springer, New York.
Gentzel, M., Kocher, T., Ponnusamy, S. and Wilm, M. (2003) Preprocessing of tan-
dem mass spectrometric data to support automatic protein identification, Pro-
teomics, 3, 1597-1610.
Gras, R., Muller, M., Gasteiger, E., Gay, S., Binz, P.A., Bienvenut, W., Hoogland, C.,
Sanchez, J.C., Bairoch, A., Hochstrasser, D.F. and Appel, R.D. (1999) Improving
protein identification from peptide mass fingerprinting through a parameterized
multi-level scoring algorithm and an optimized peak detection, Electrophoresis,
20, 3535-3550.
Hilario, M., Kalousis, A., Pellegrini, C. and Muller, M. (2006) Processing and classi-
fication of protein mass spectra, Mass Spectrom Rev, 25, 409-449.
Jeffries, N. (2005) Algorithms for alignment of mass spectrometry proteomic data,
Bioinformatics, 21, 3066-3073.
Klevecz, R.R. and Murray, D.B. (2001) Genome wide oscillations in expression.
Wavelet analysis of time series data from yeast expression arrays uncovers the
dynamic architecture of phenotype, Mol Biol Rep, 28, 73-82.
Lange, E., Gropl, C., Reinert, K., Kohlbacher, O. and Hildebrandt, A. (2006) High-
accuracy peak picking of proteomics data using wavelet techniques. Pacific Sym-
posium on Biocomputing 2006. Maui, Hawaii, USA, 243-254.
Li, J., Orlandi, R., White, C.N., Rosenzweig, J., Zhao, J., Seregni, E., Morelli, D., Yu,
Y., Meng, X.Y., Zhang, Z., Davidson, N.E., Fung, E.T. and Chan, D.W. (2005)
Independent validation of candidate breast cancer serum biomarkers identified by
mass spectrometry, Clin Chem, 51, 2229-2235.
Lio, P. and Vannucci, M. (2000) Wavelet change-point prediction of transmembrane
proteins, Bioinformatics, 16, 376-382.
Nilanjan Dasgupta, Lin, S. and Carin, L. Sequential Modeling for Identifying CpG
Island Locations in Human Genome, IEEE Signal Processing Letters, 9, 407-409.
Qu, Y., Adam, B.L., Thornquist, M., Potter, J.D., Thompson, M.L., Yasui, Y., Davis,
J., Schellhammer, P.F., Cazares, L., Clements, M., Wright, G.L., Jr. and Feng, Z.
(2003) Data reduction using a discrete wavelet transform in discriminant analysis
of very high dimensionality data, Biometrics, 59, 143-151.
Randolph, T.W. (2005) Multiscale processing of mass spectrometry data, Biometrics,
0.
Rejtar, T., Chen, H.S., Andreev, V., Moskovets, E. and Karger, B.L. (2004) Increased
identification of peptides by enhanced data processing of high-resolution MALDI
TOF/TOF mass spectra prior to database searching, Anal Chem, 76, 6017-6028.
Vivo-Truyols, G., Torres-Lapasio, J.R., van Nederkassel, A.M., Vander Heyden, Y.
and Massart, D.L. (2005) Automatic program for peak detection and deconvolu-
tion of multi-overlapped chromatographic signals part I: peak detection, J Chro-
matogr A, 1096, 133-145.