Download to read offline


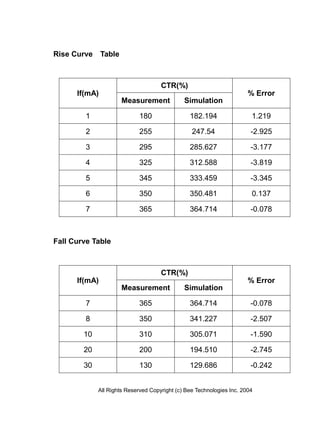


The document presents a comprehensive device modeling report for a photocoupler component, specifically the part number PC356NT manufactured by Sharp Bee Technologies Inc. It includes detailed specifications and characteristics, including diode and BJT model parameters, simulation results, and comparison tables for forward and reverse current behaviors, as well as switching characteristics. Various simulation results show the accuracy and performance metrics, with attention given to current transfer ratio and saturation characteristics.


