Download to read offline


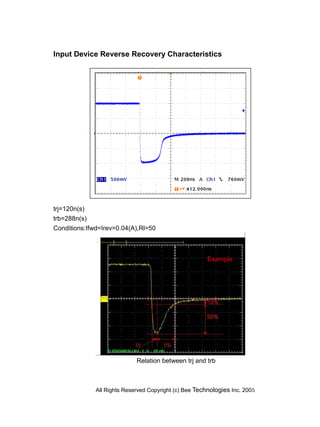


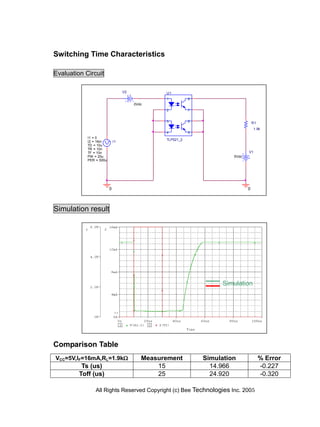

The document presents a detailed modeling report for the TLP521-2 photocoupler, manufactured by Toshiba, including various electrical characteristics and modeling parameters for devices like diodes and bipolar junction transistors. It contains simulation results, evaluation circuits, and comparison tables for input device characteristics, current transfer ratios, and switching times. The content also includes measurement vs. simulation data for different operating conditions and associated percentage errors.


