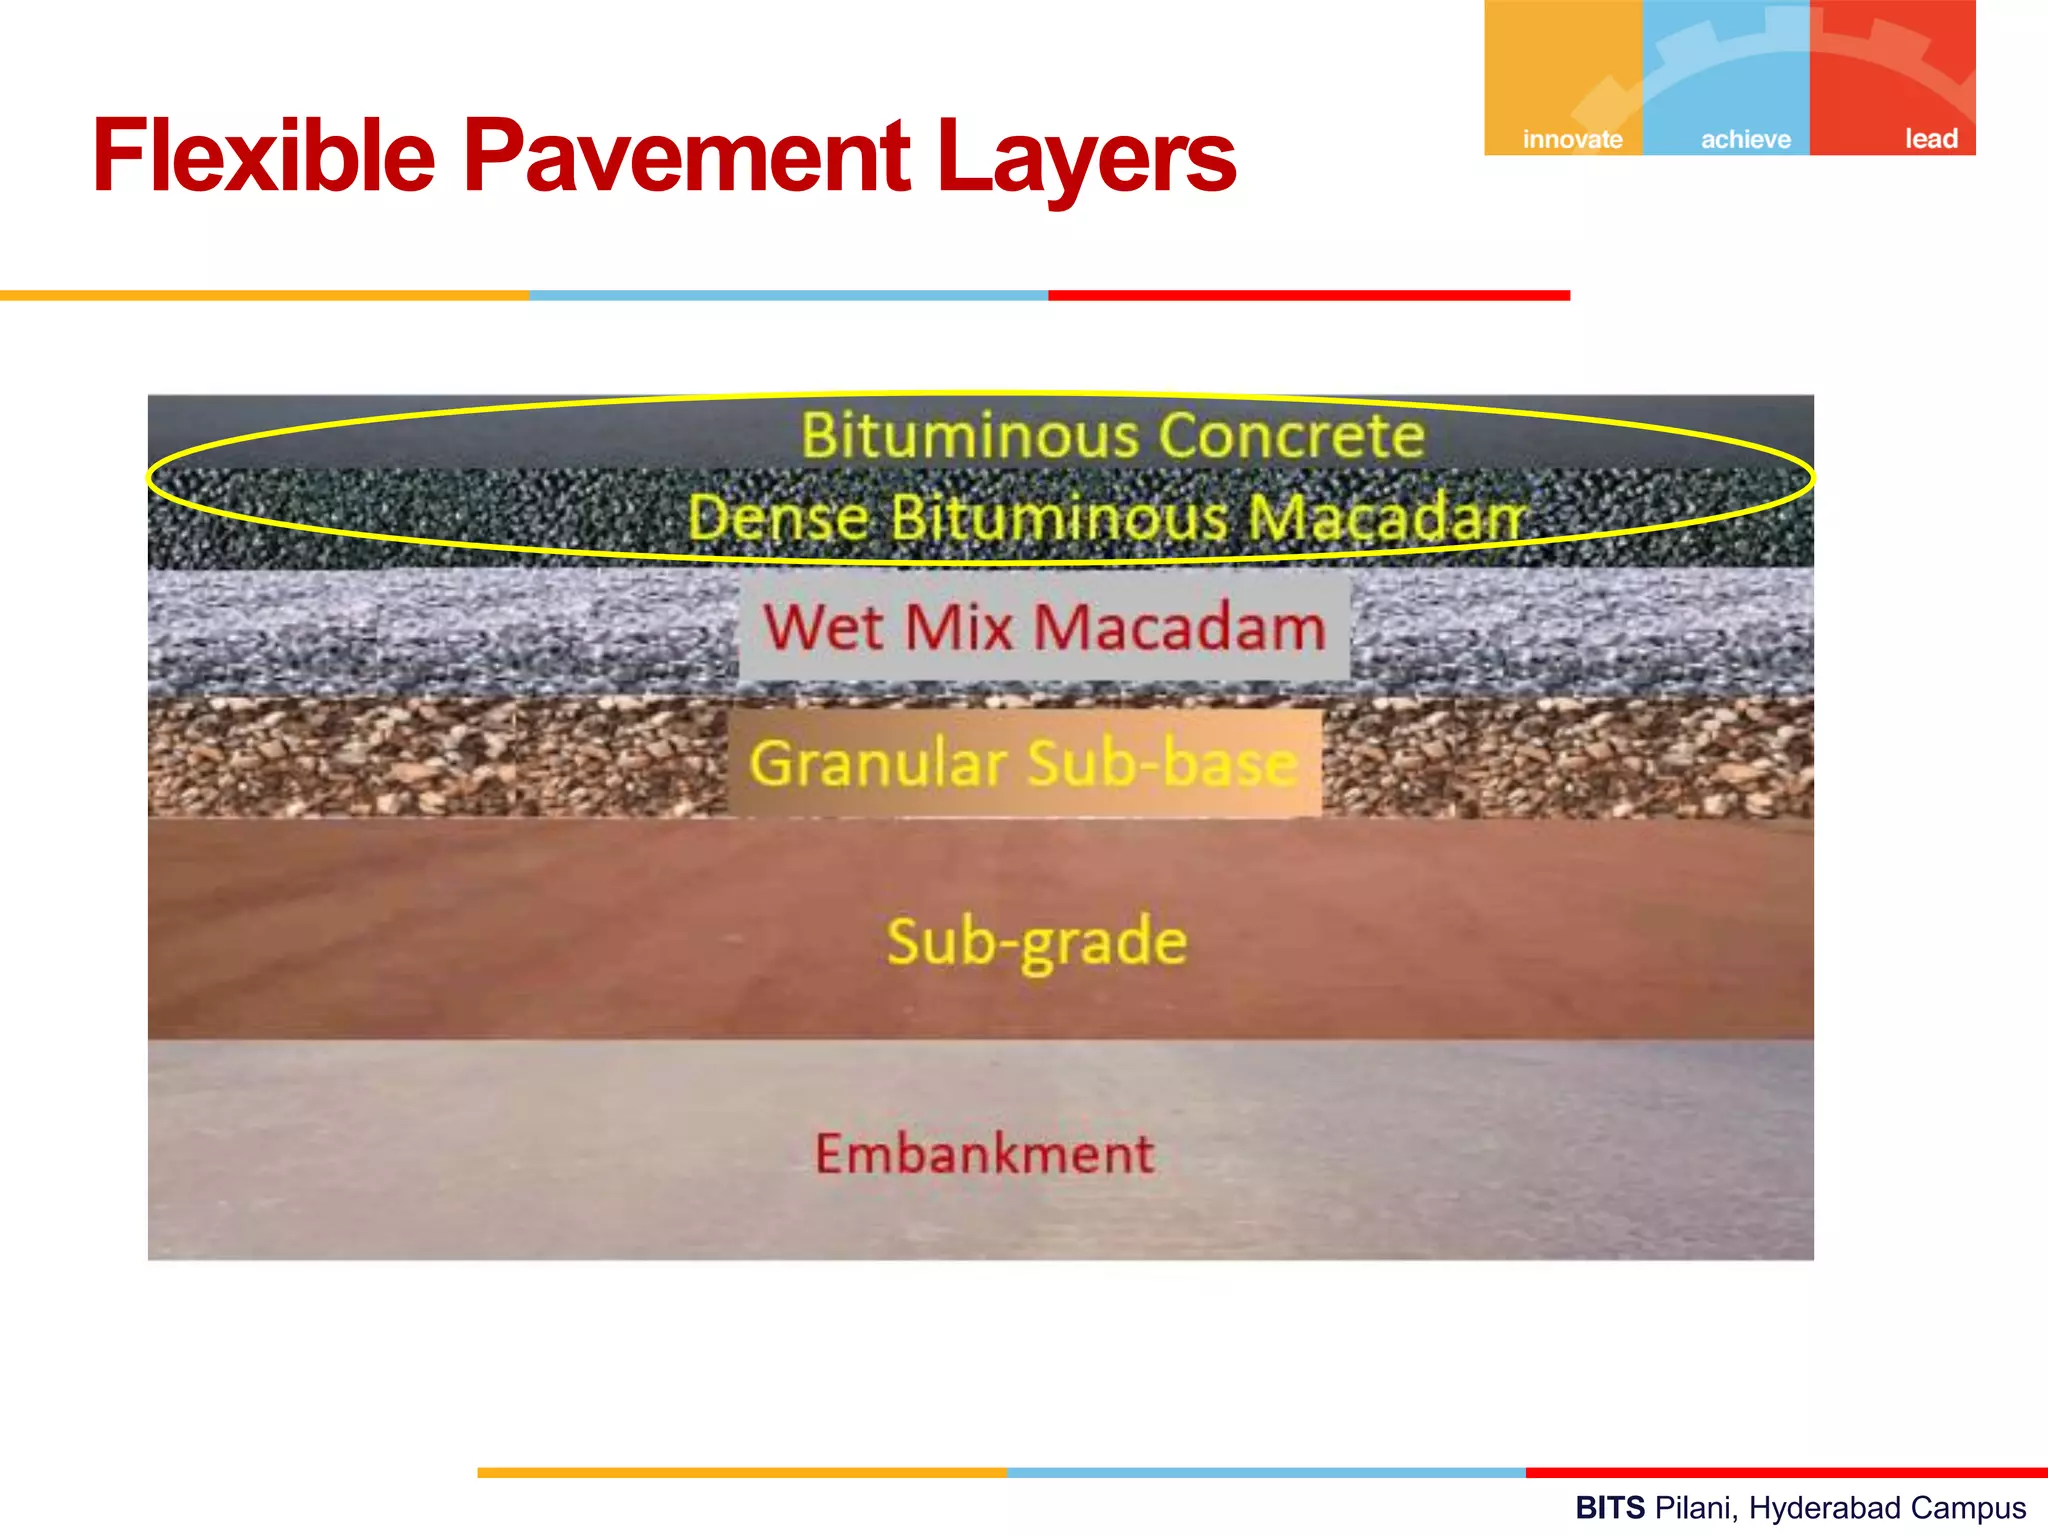
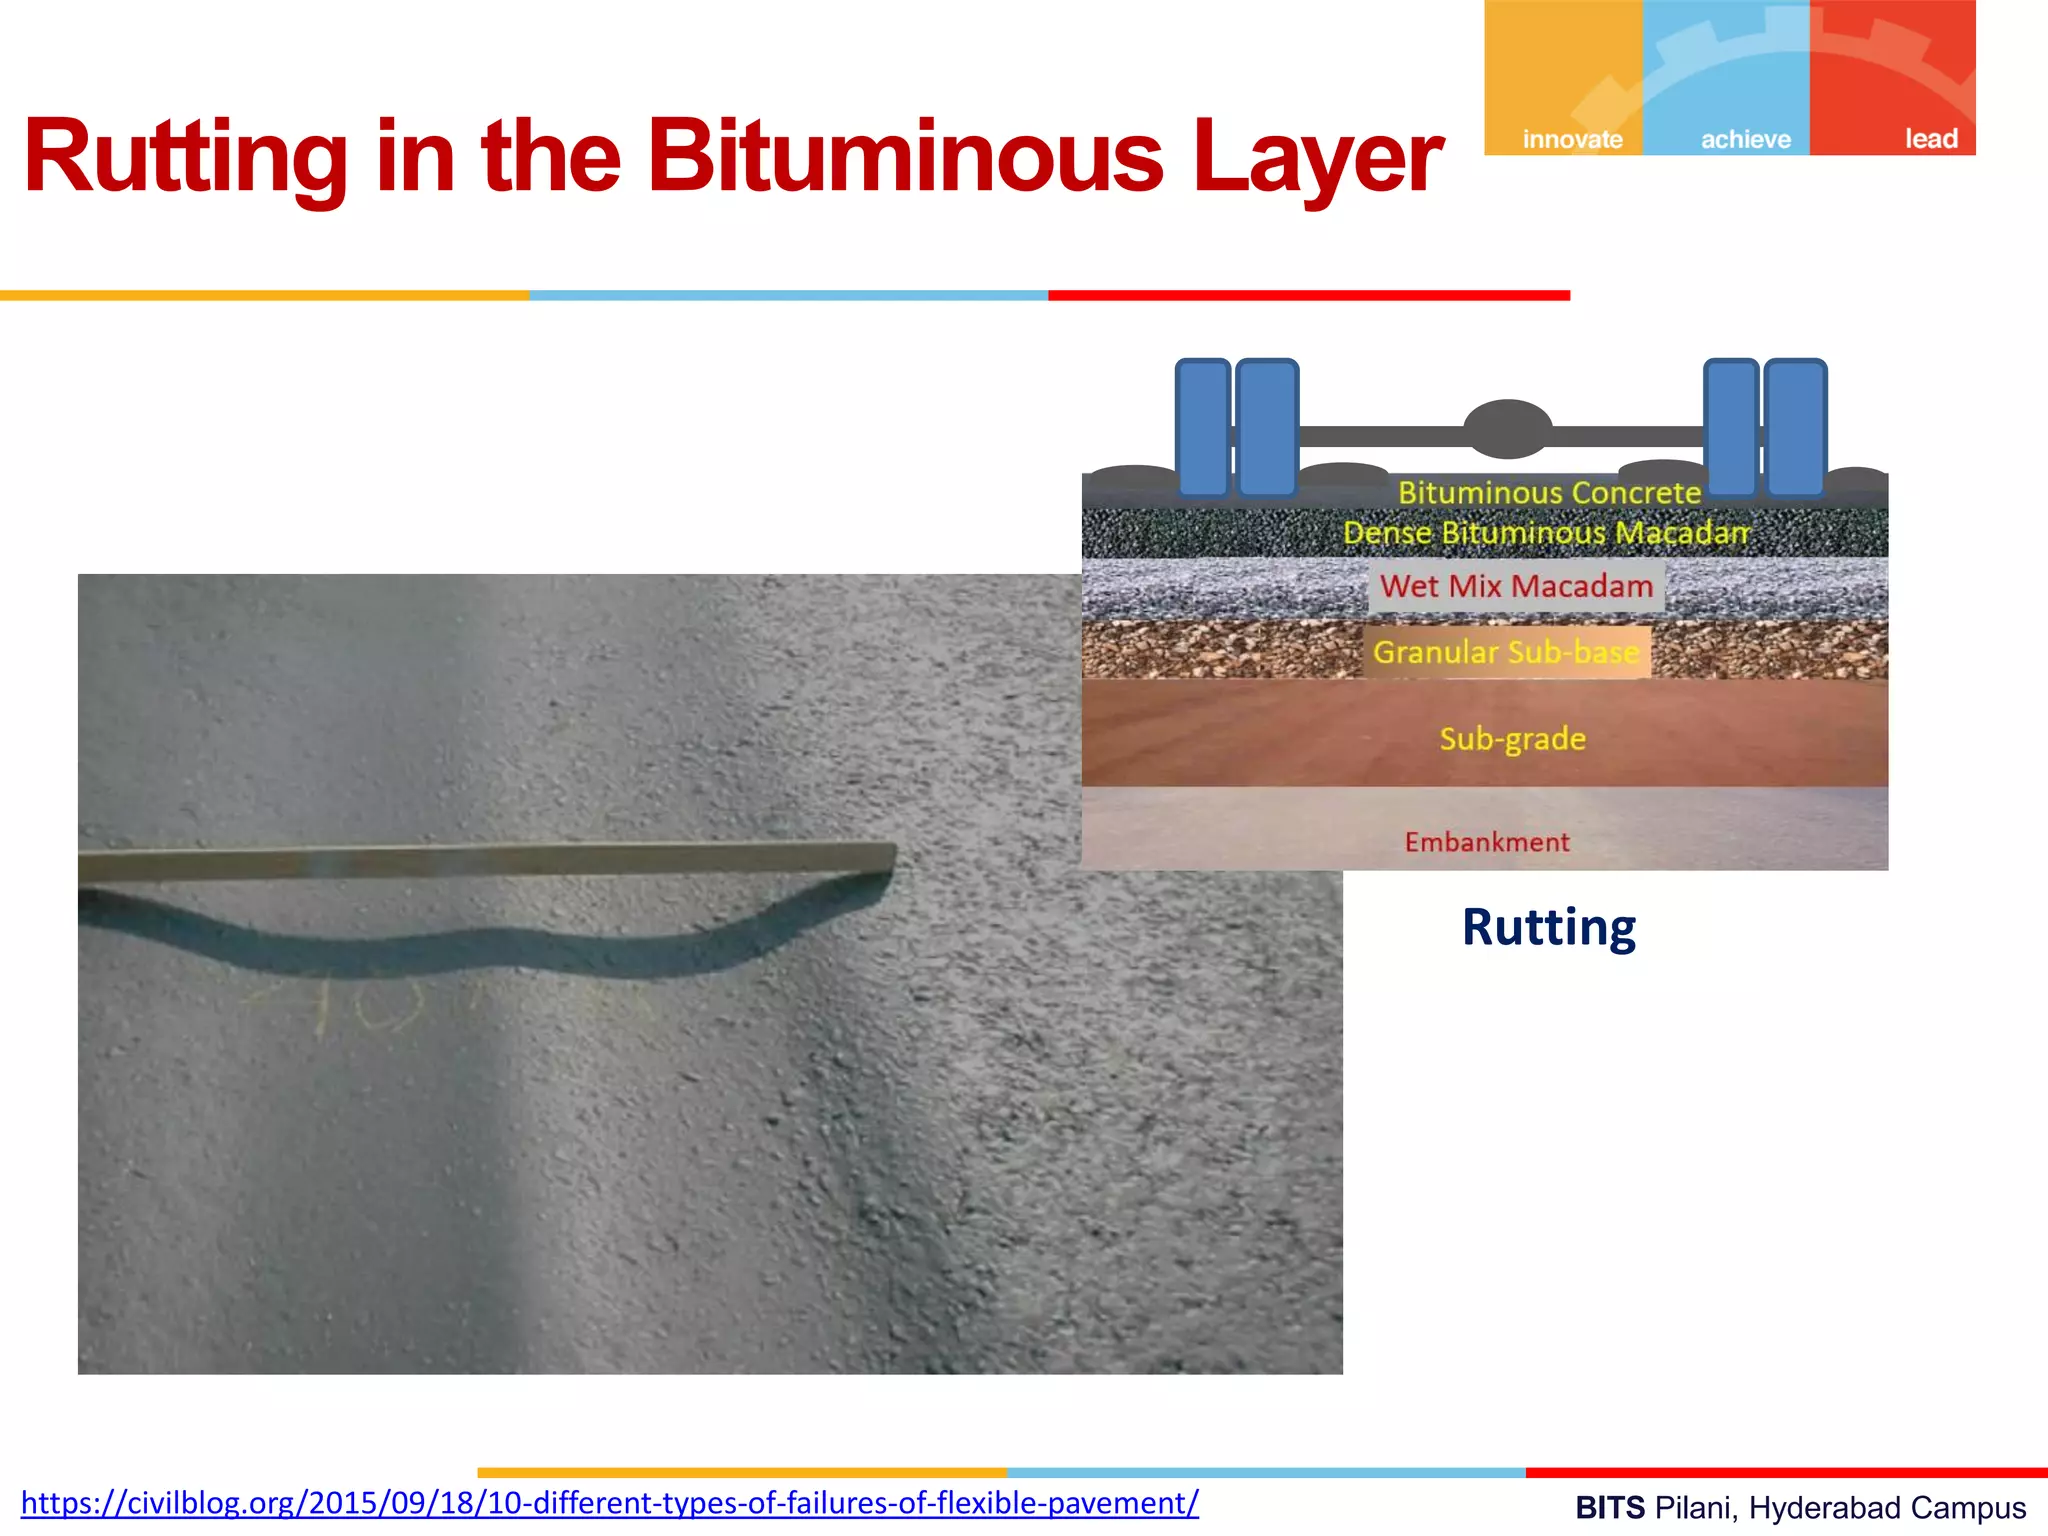
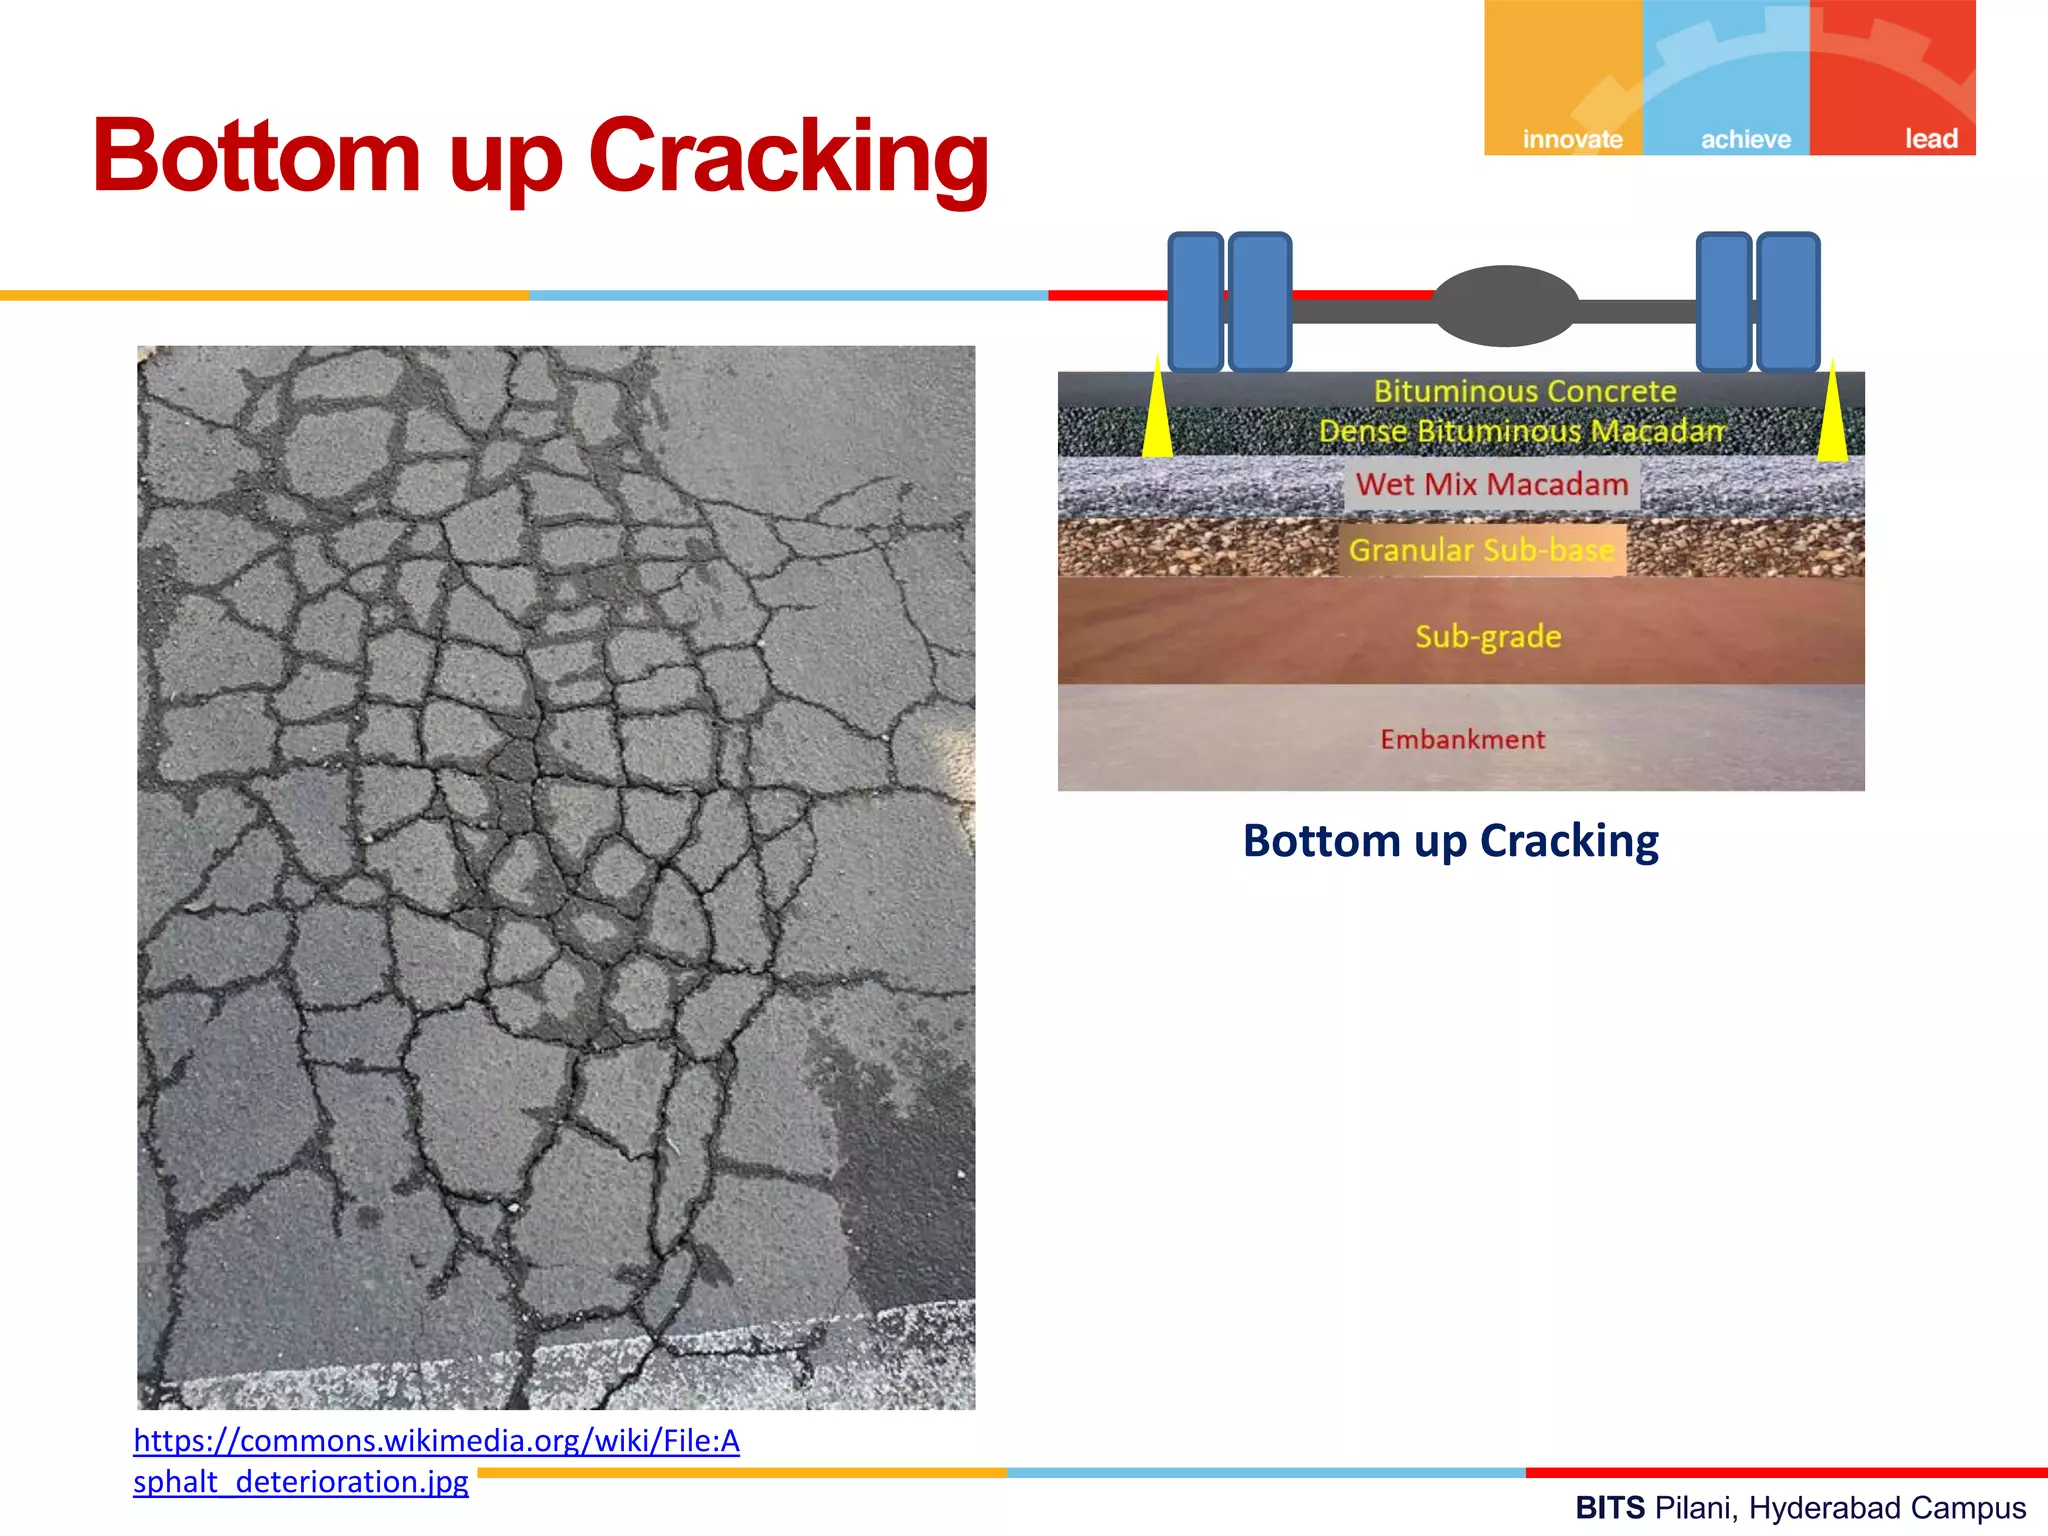
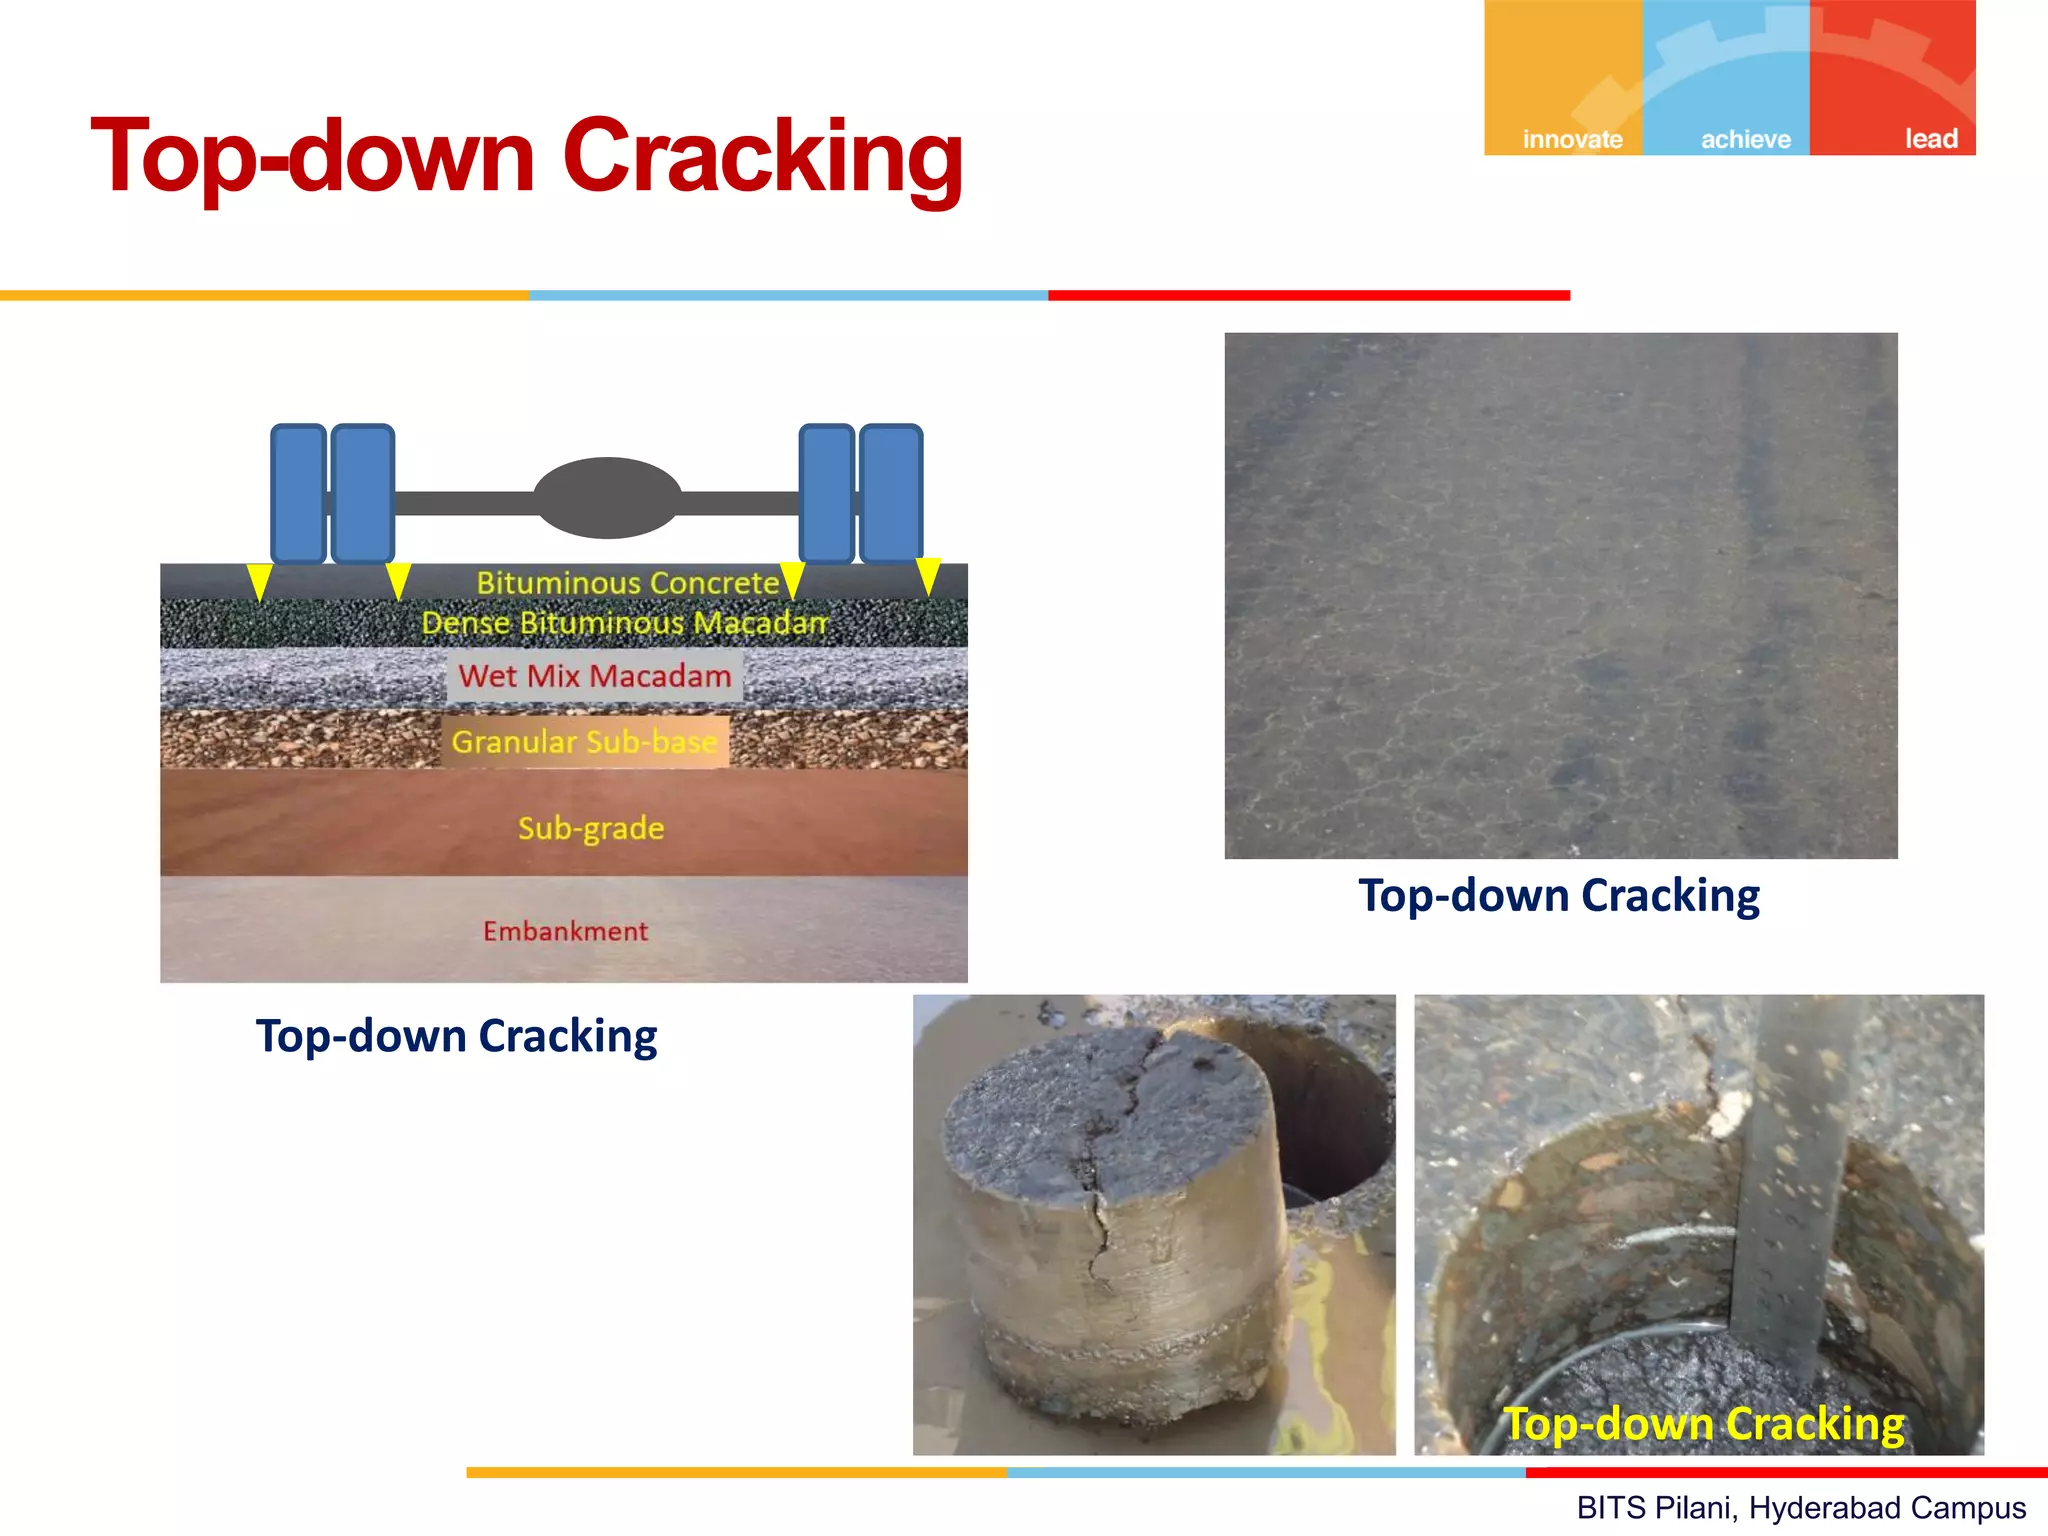
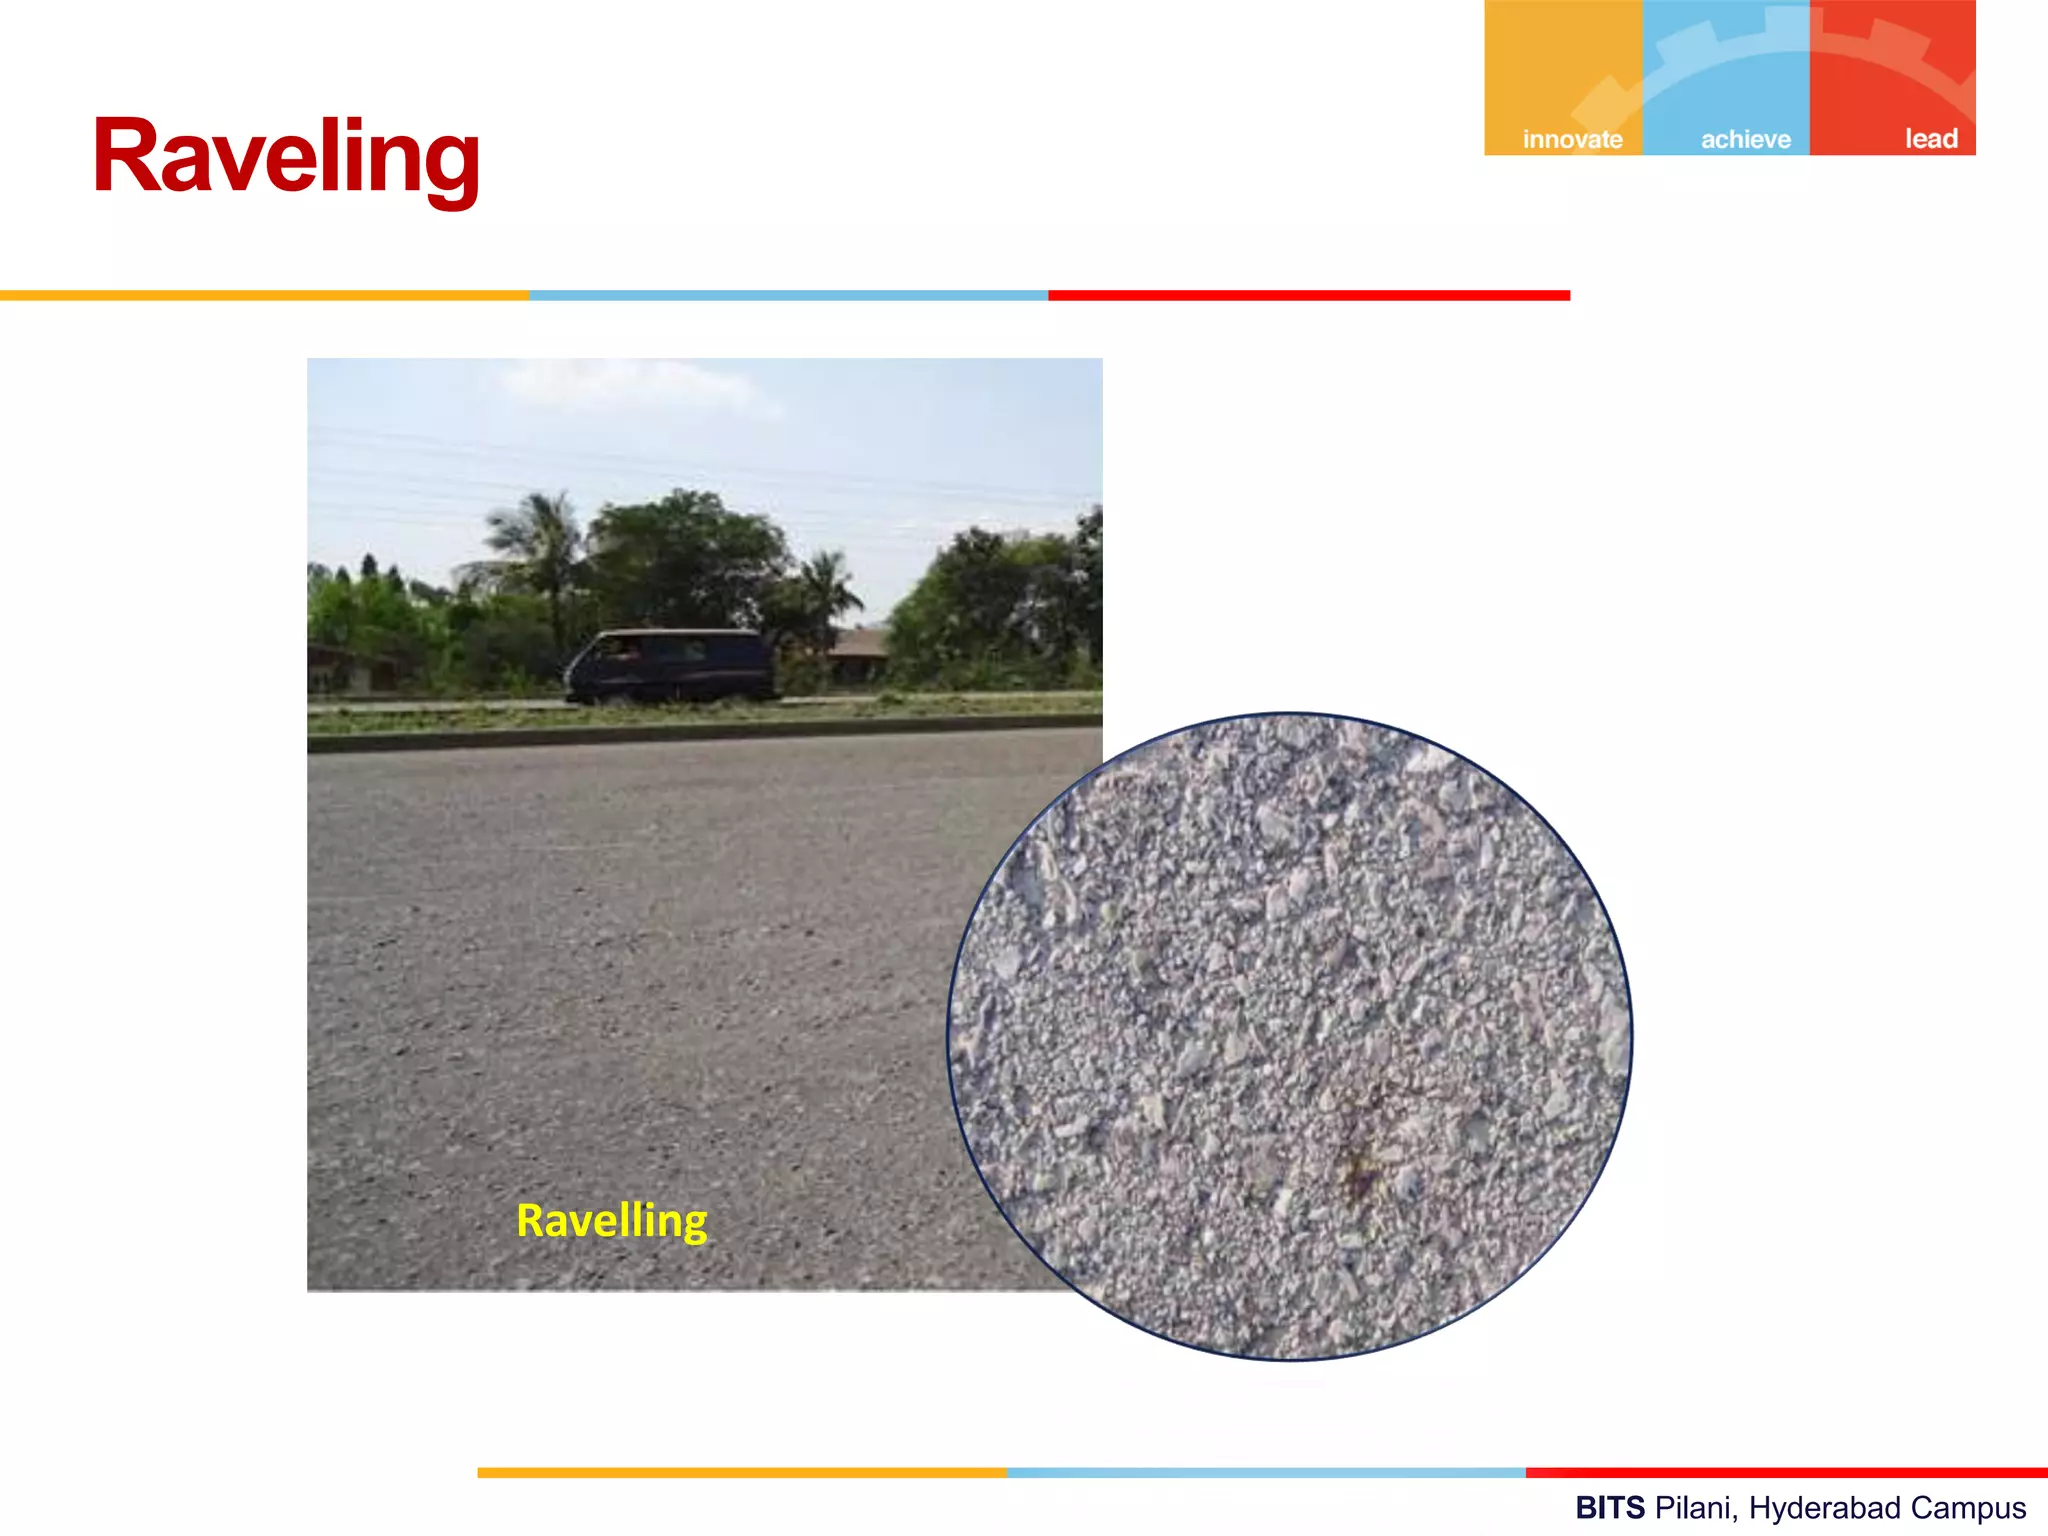
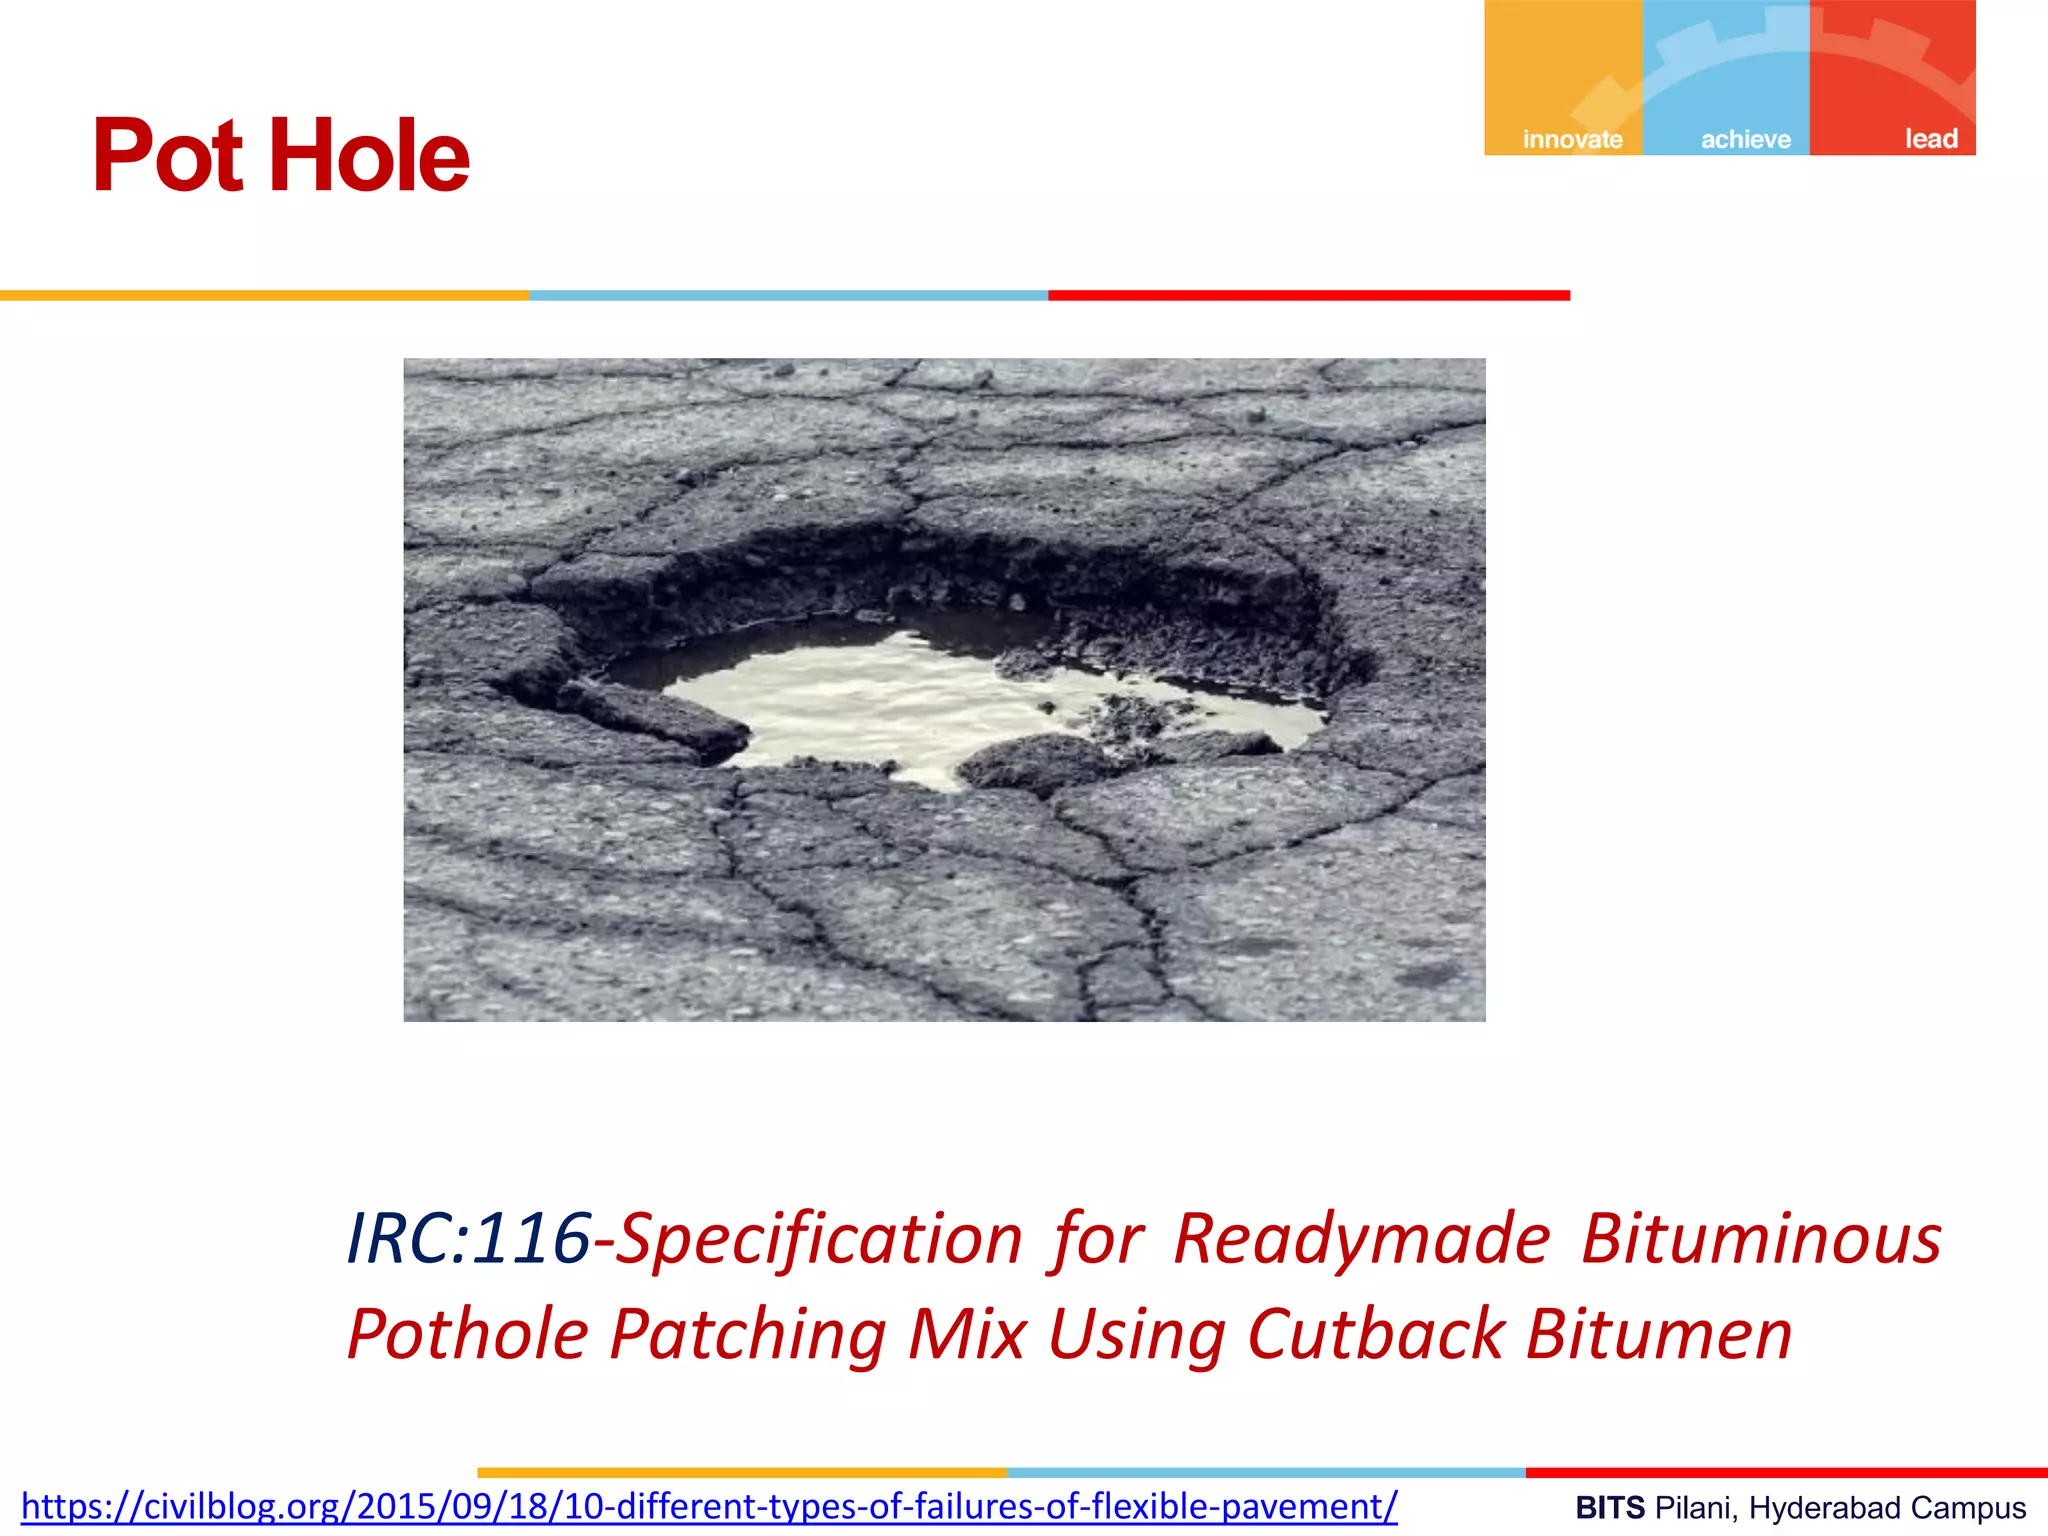
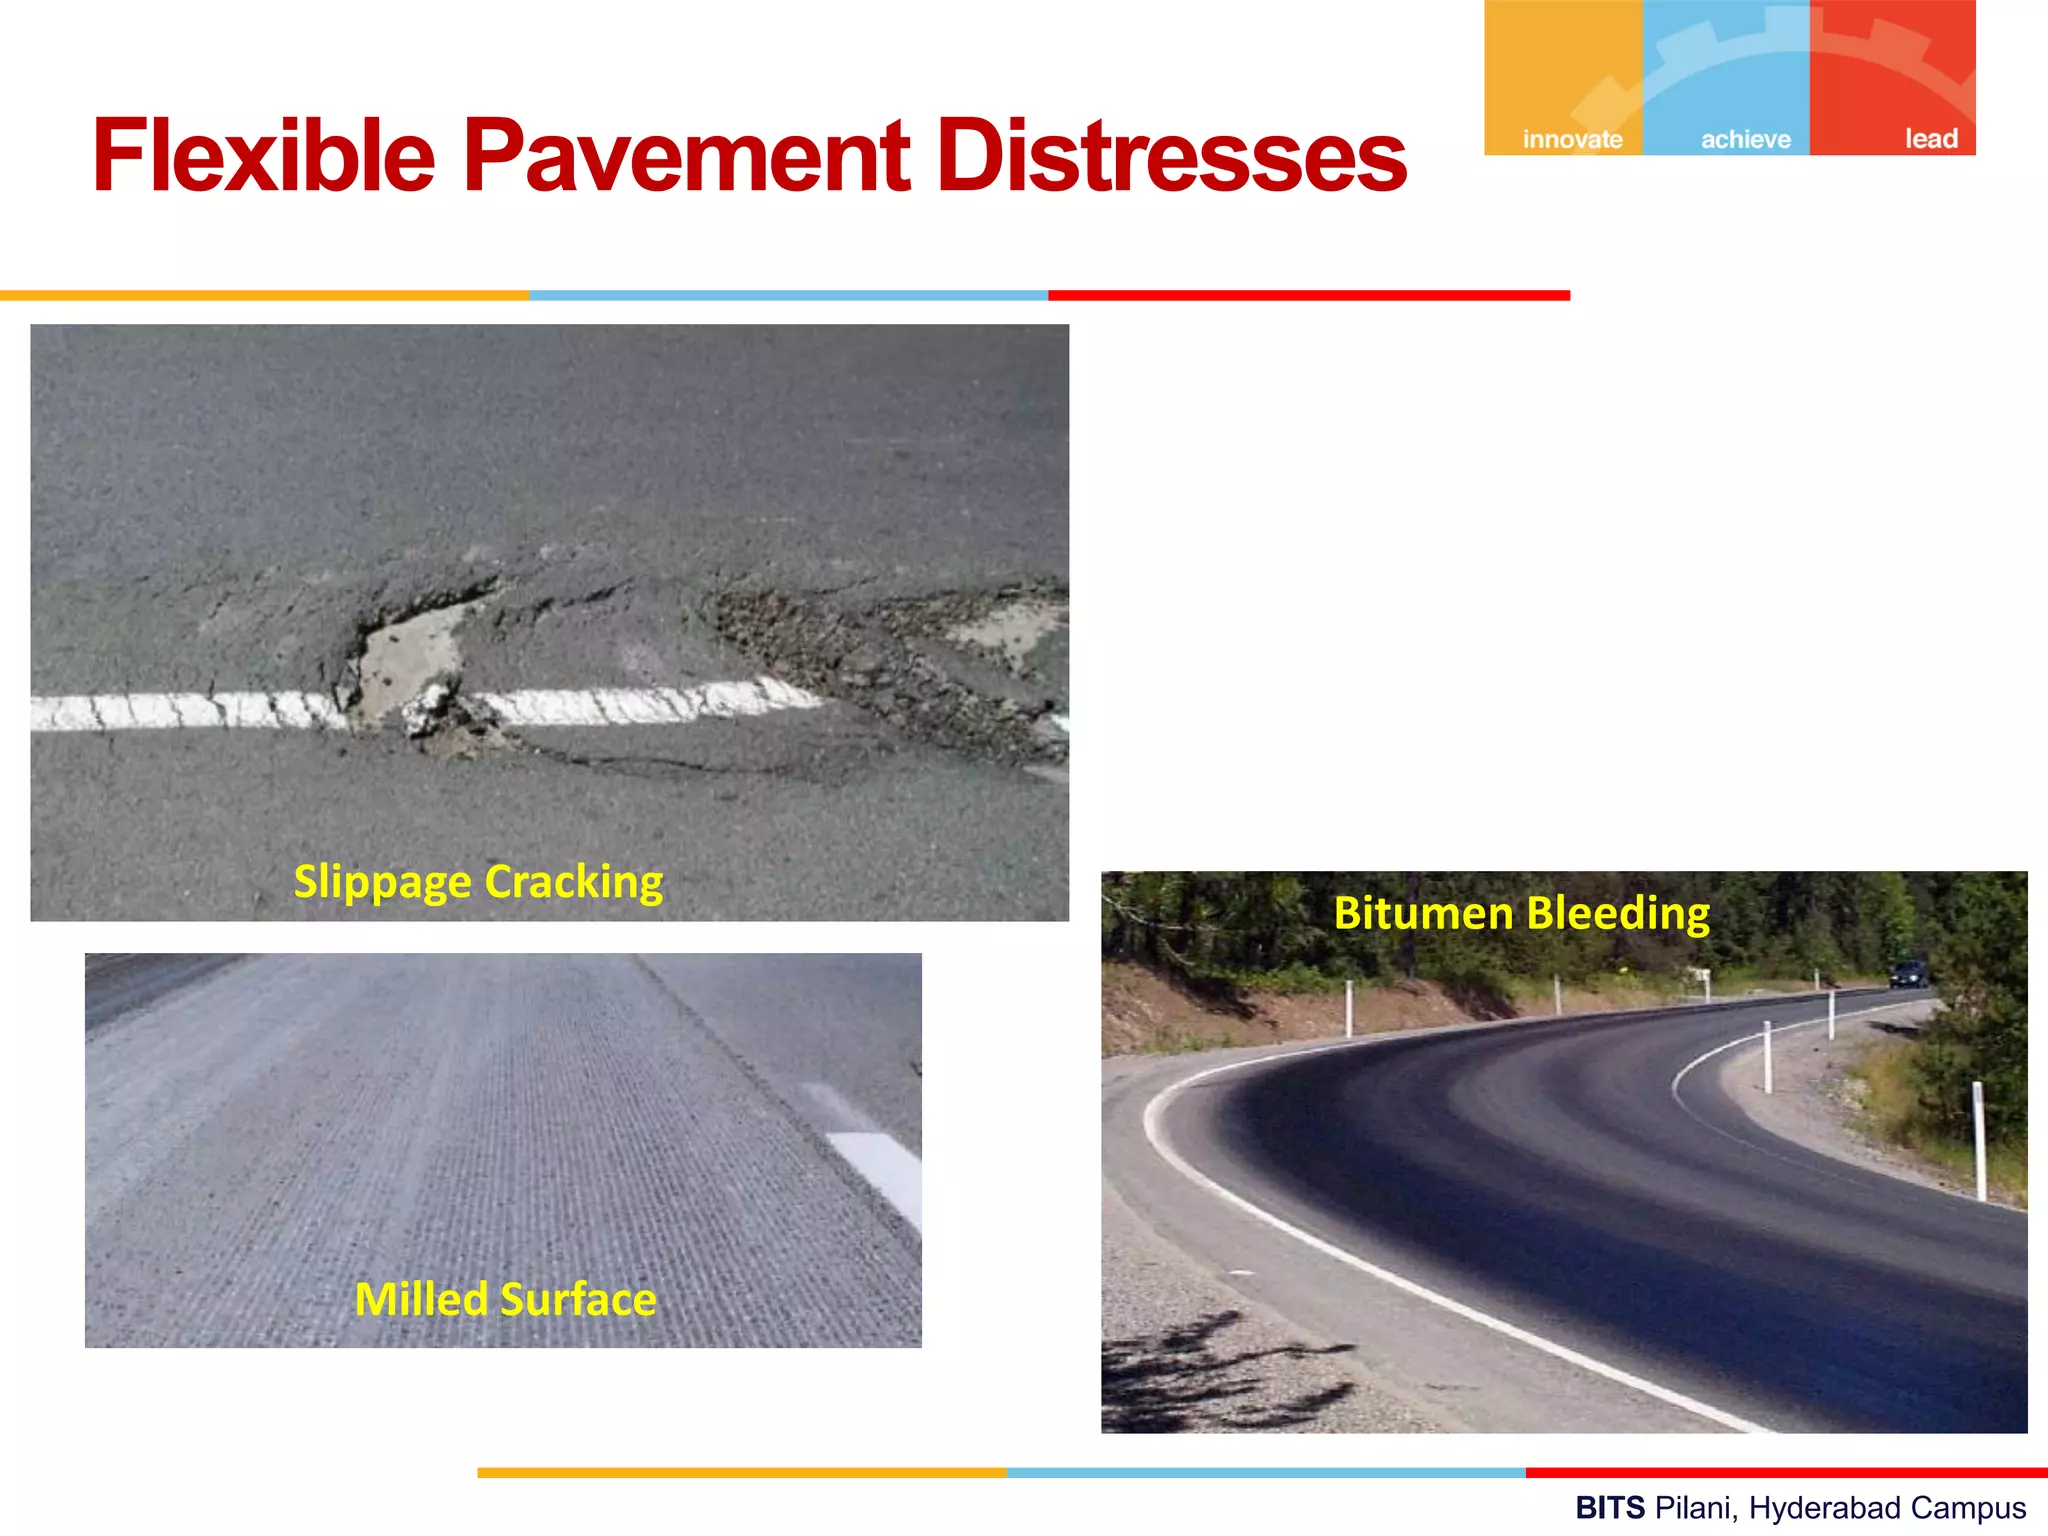
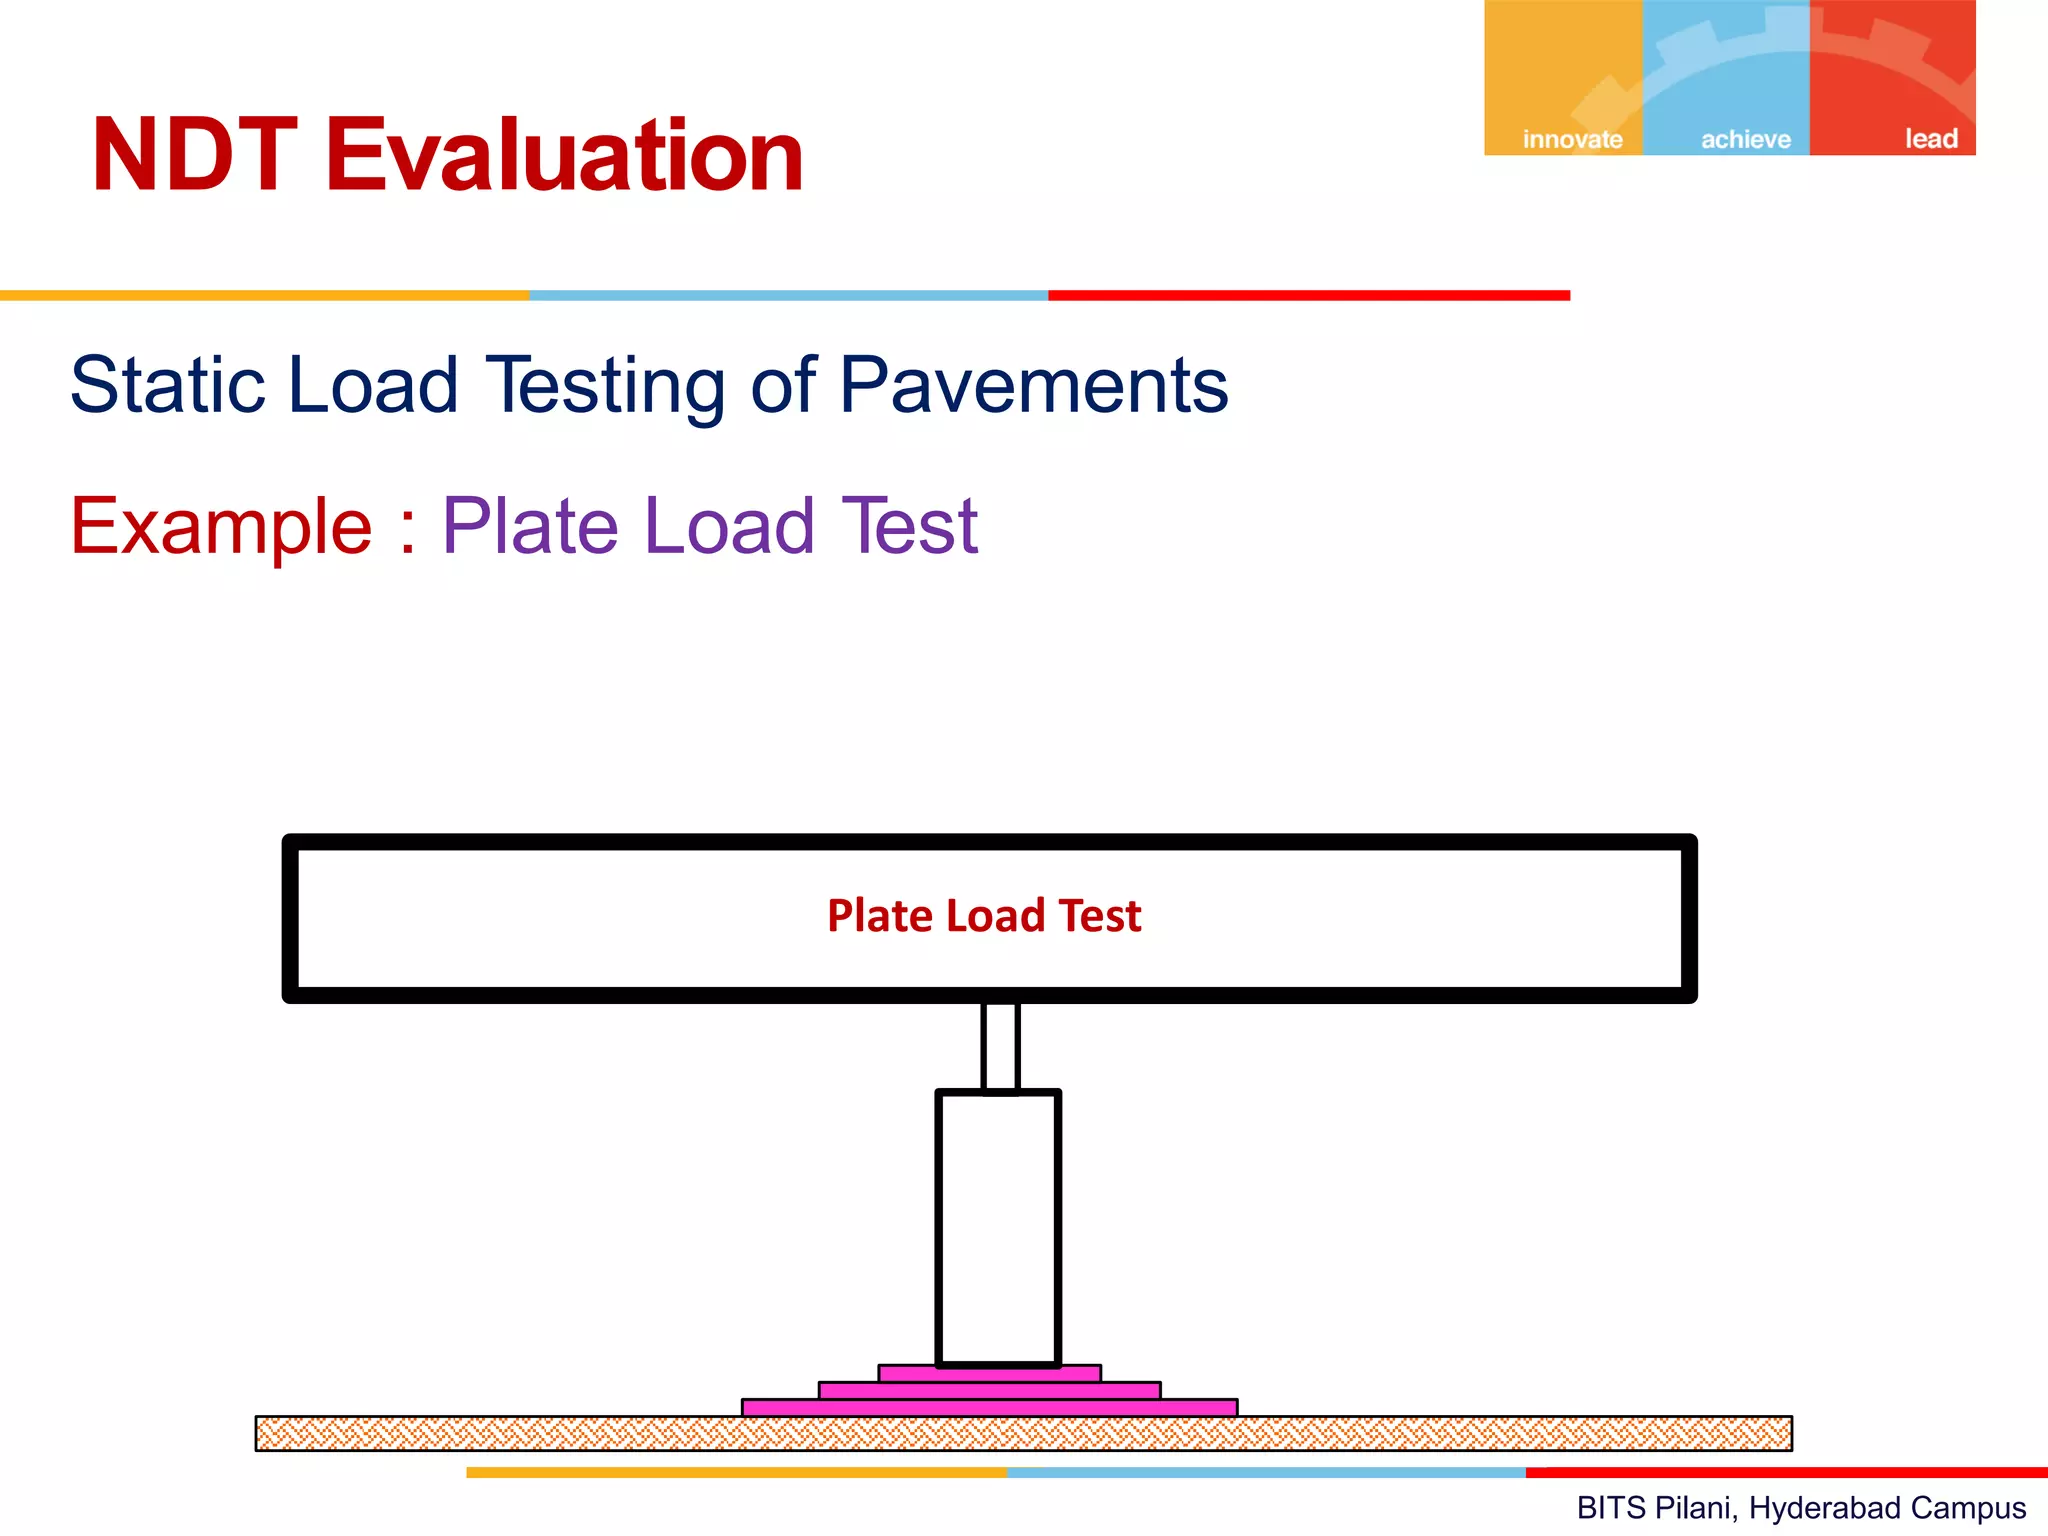
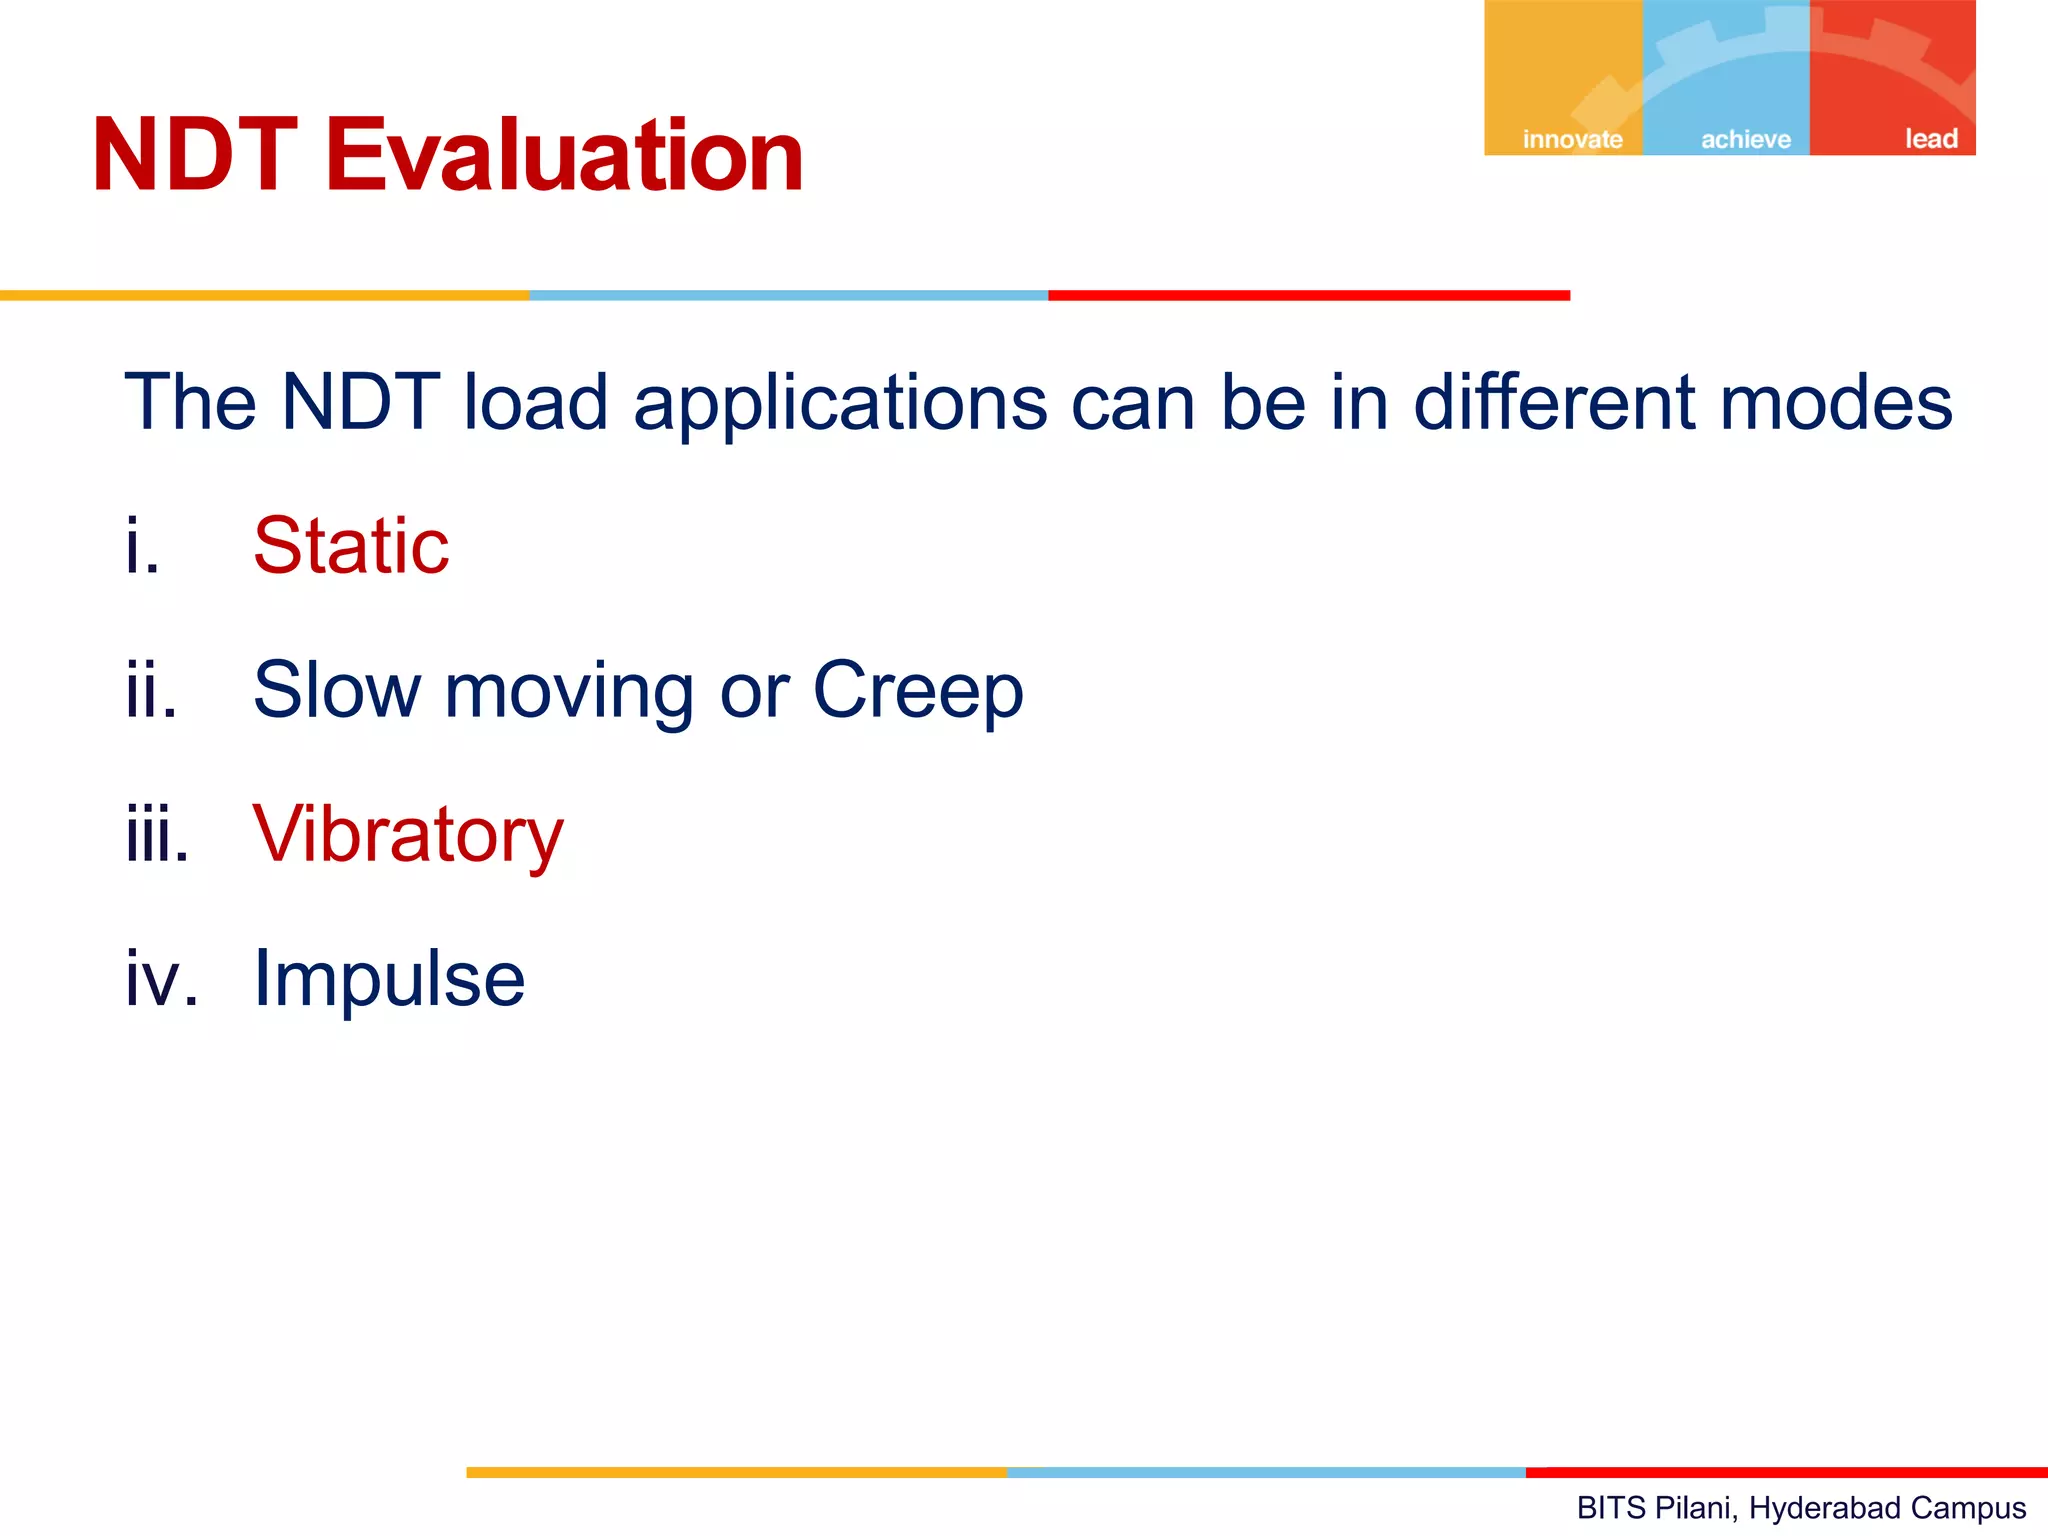
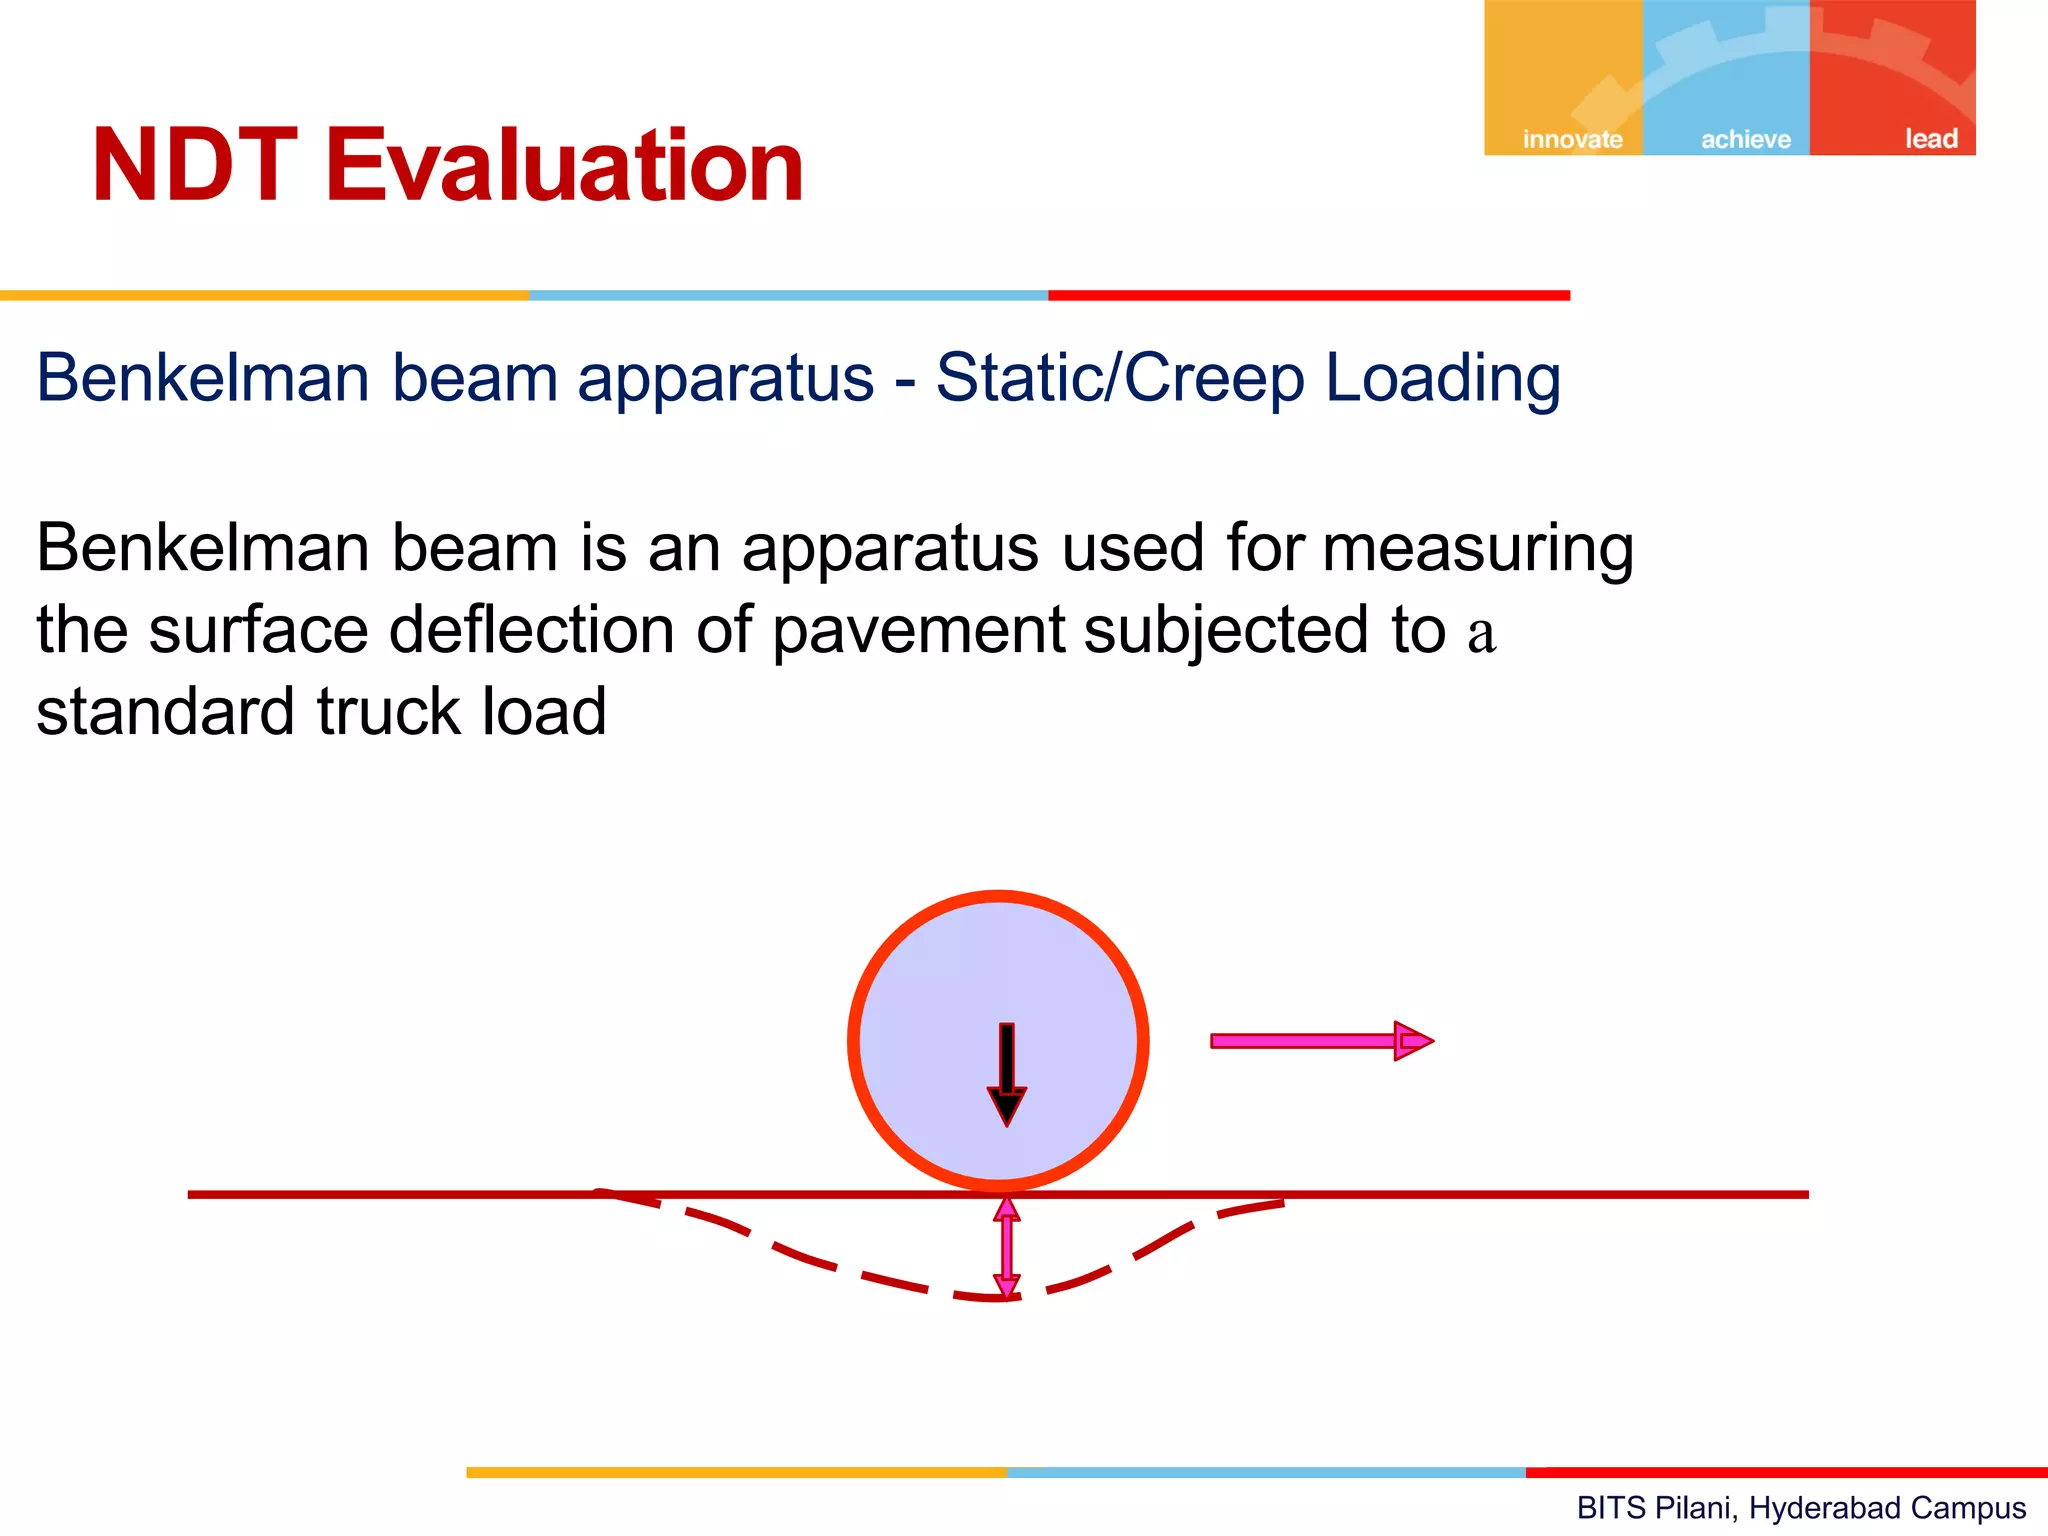
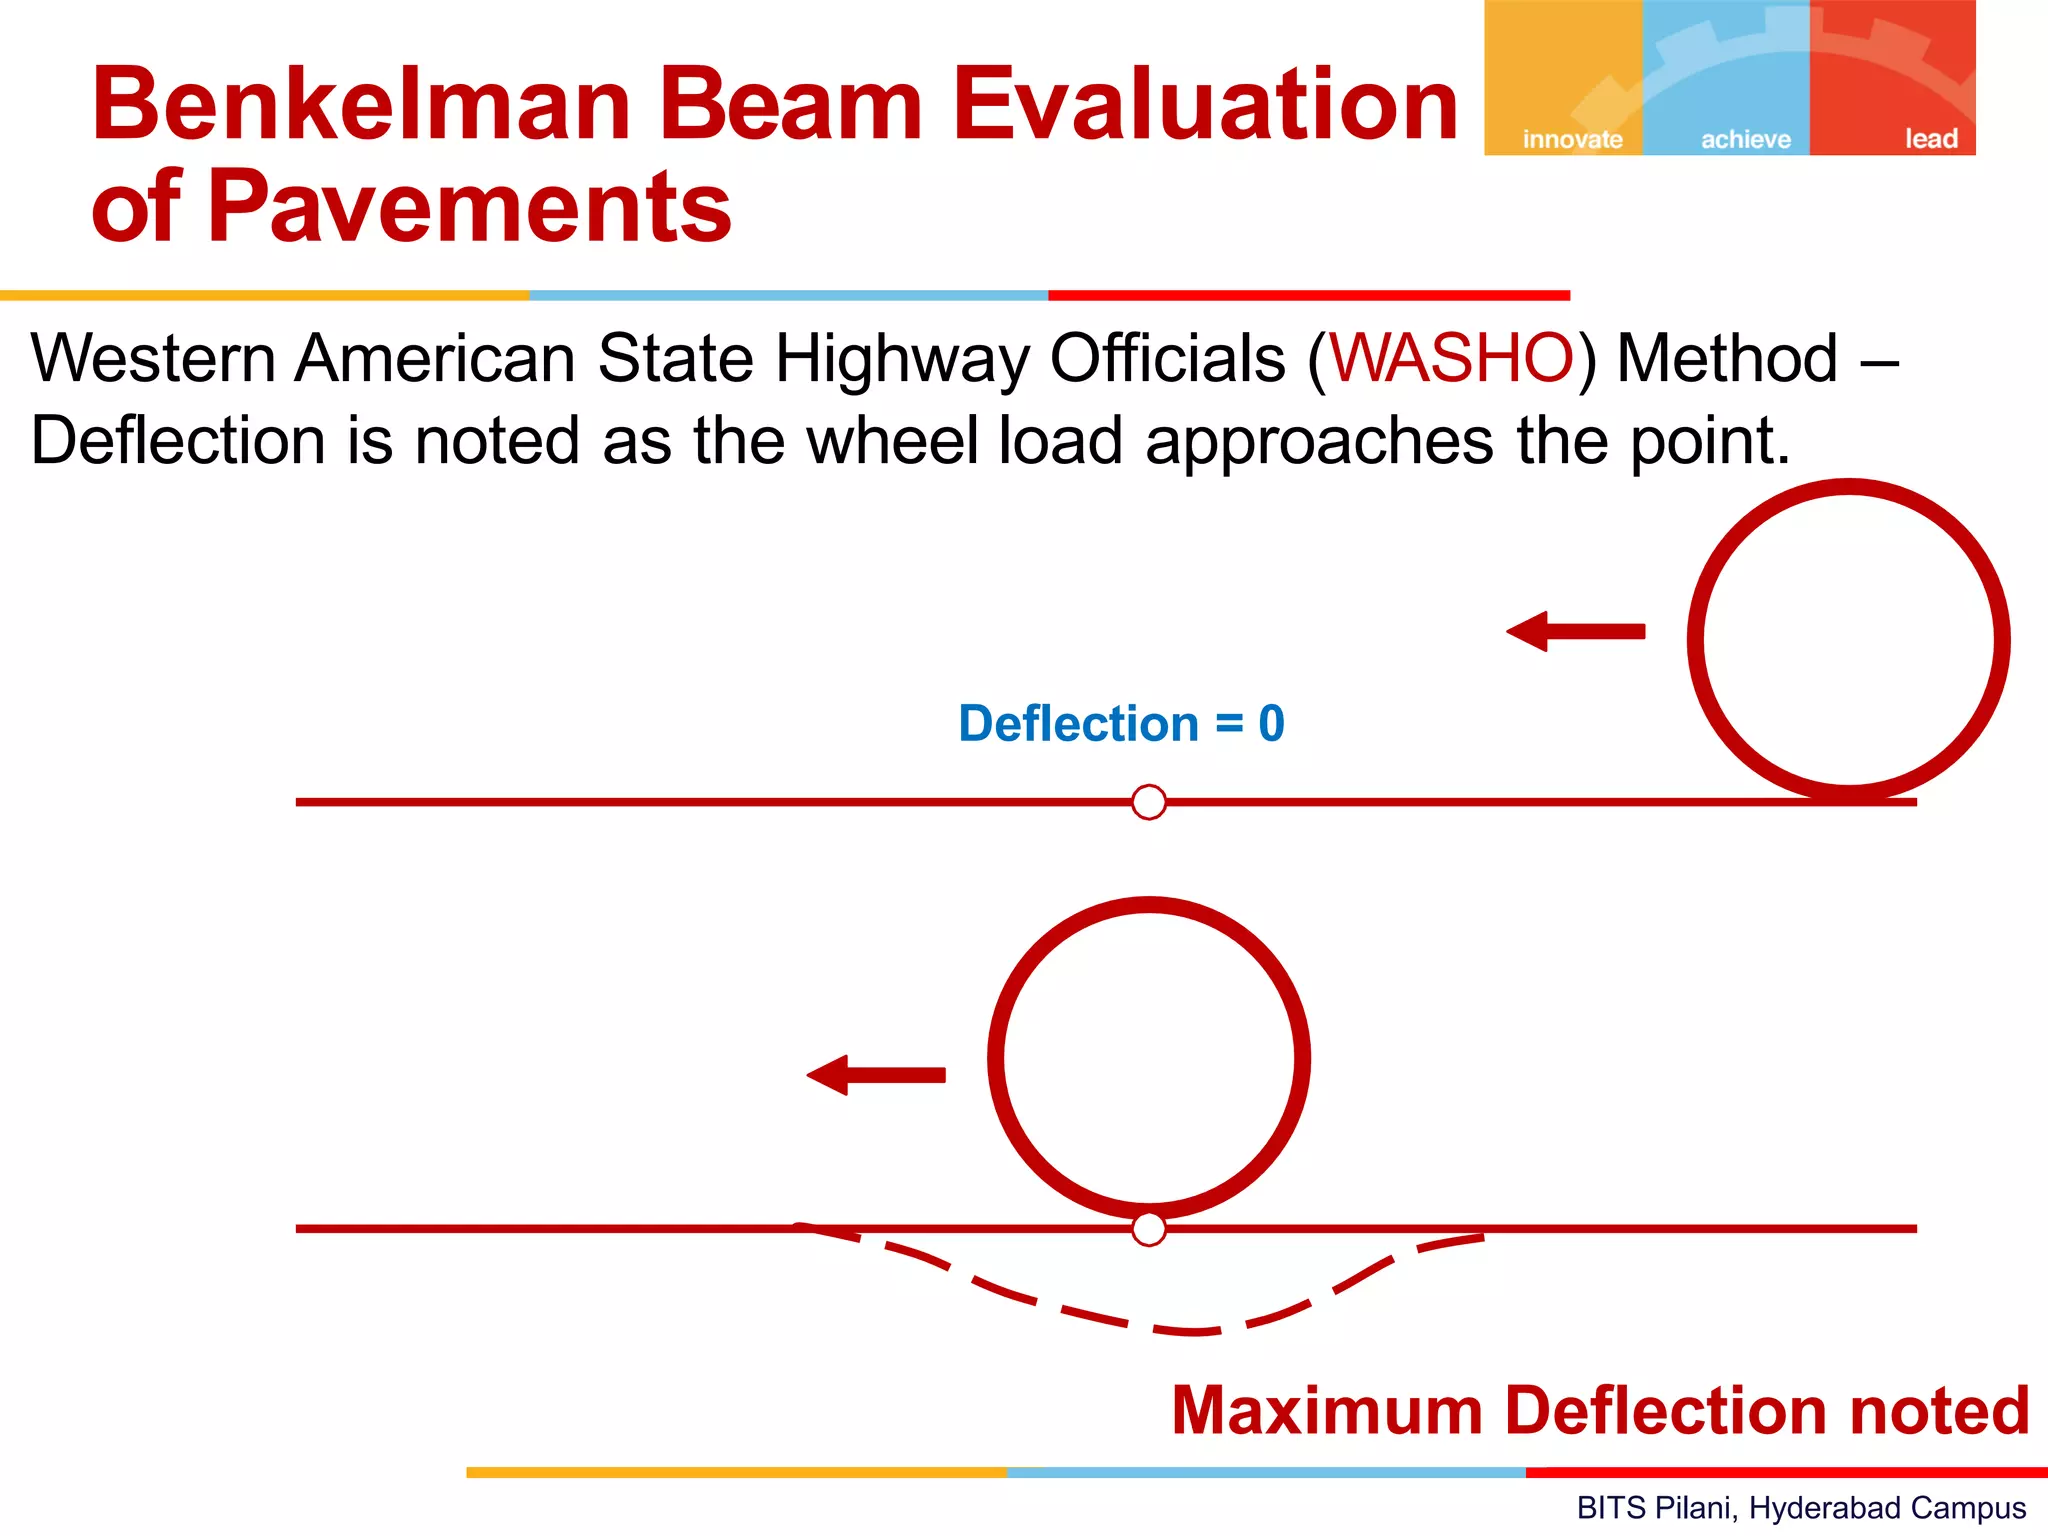
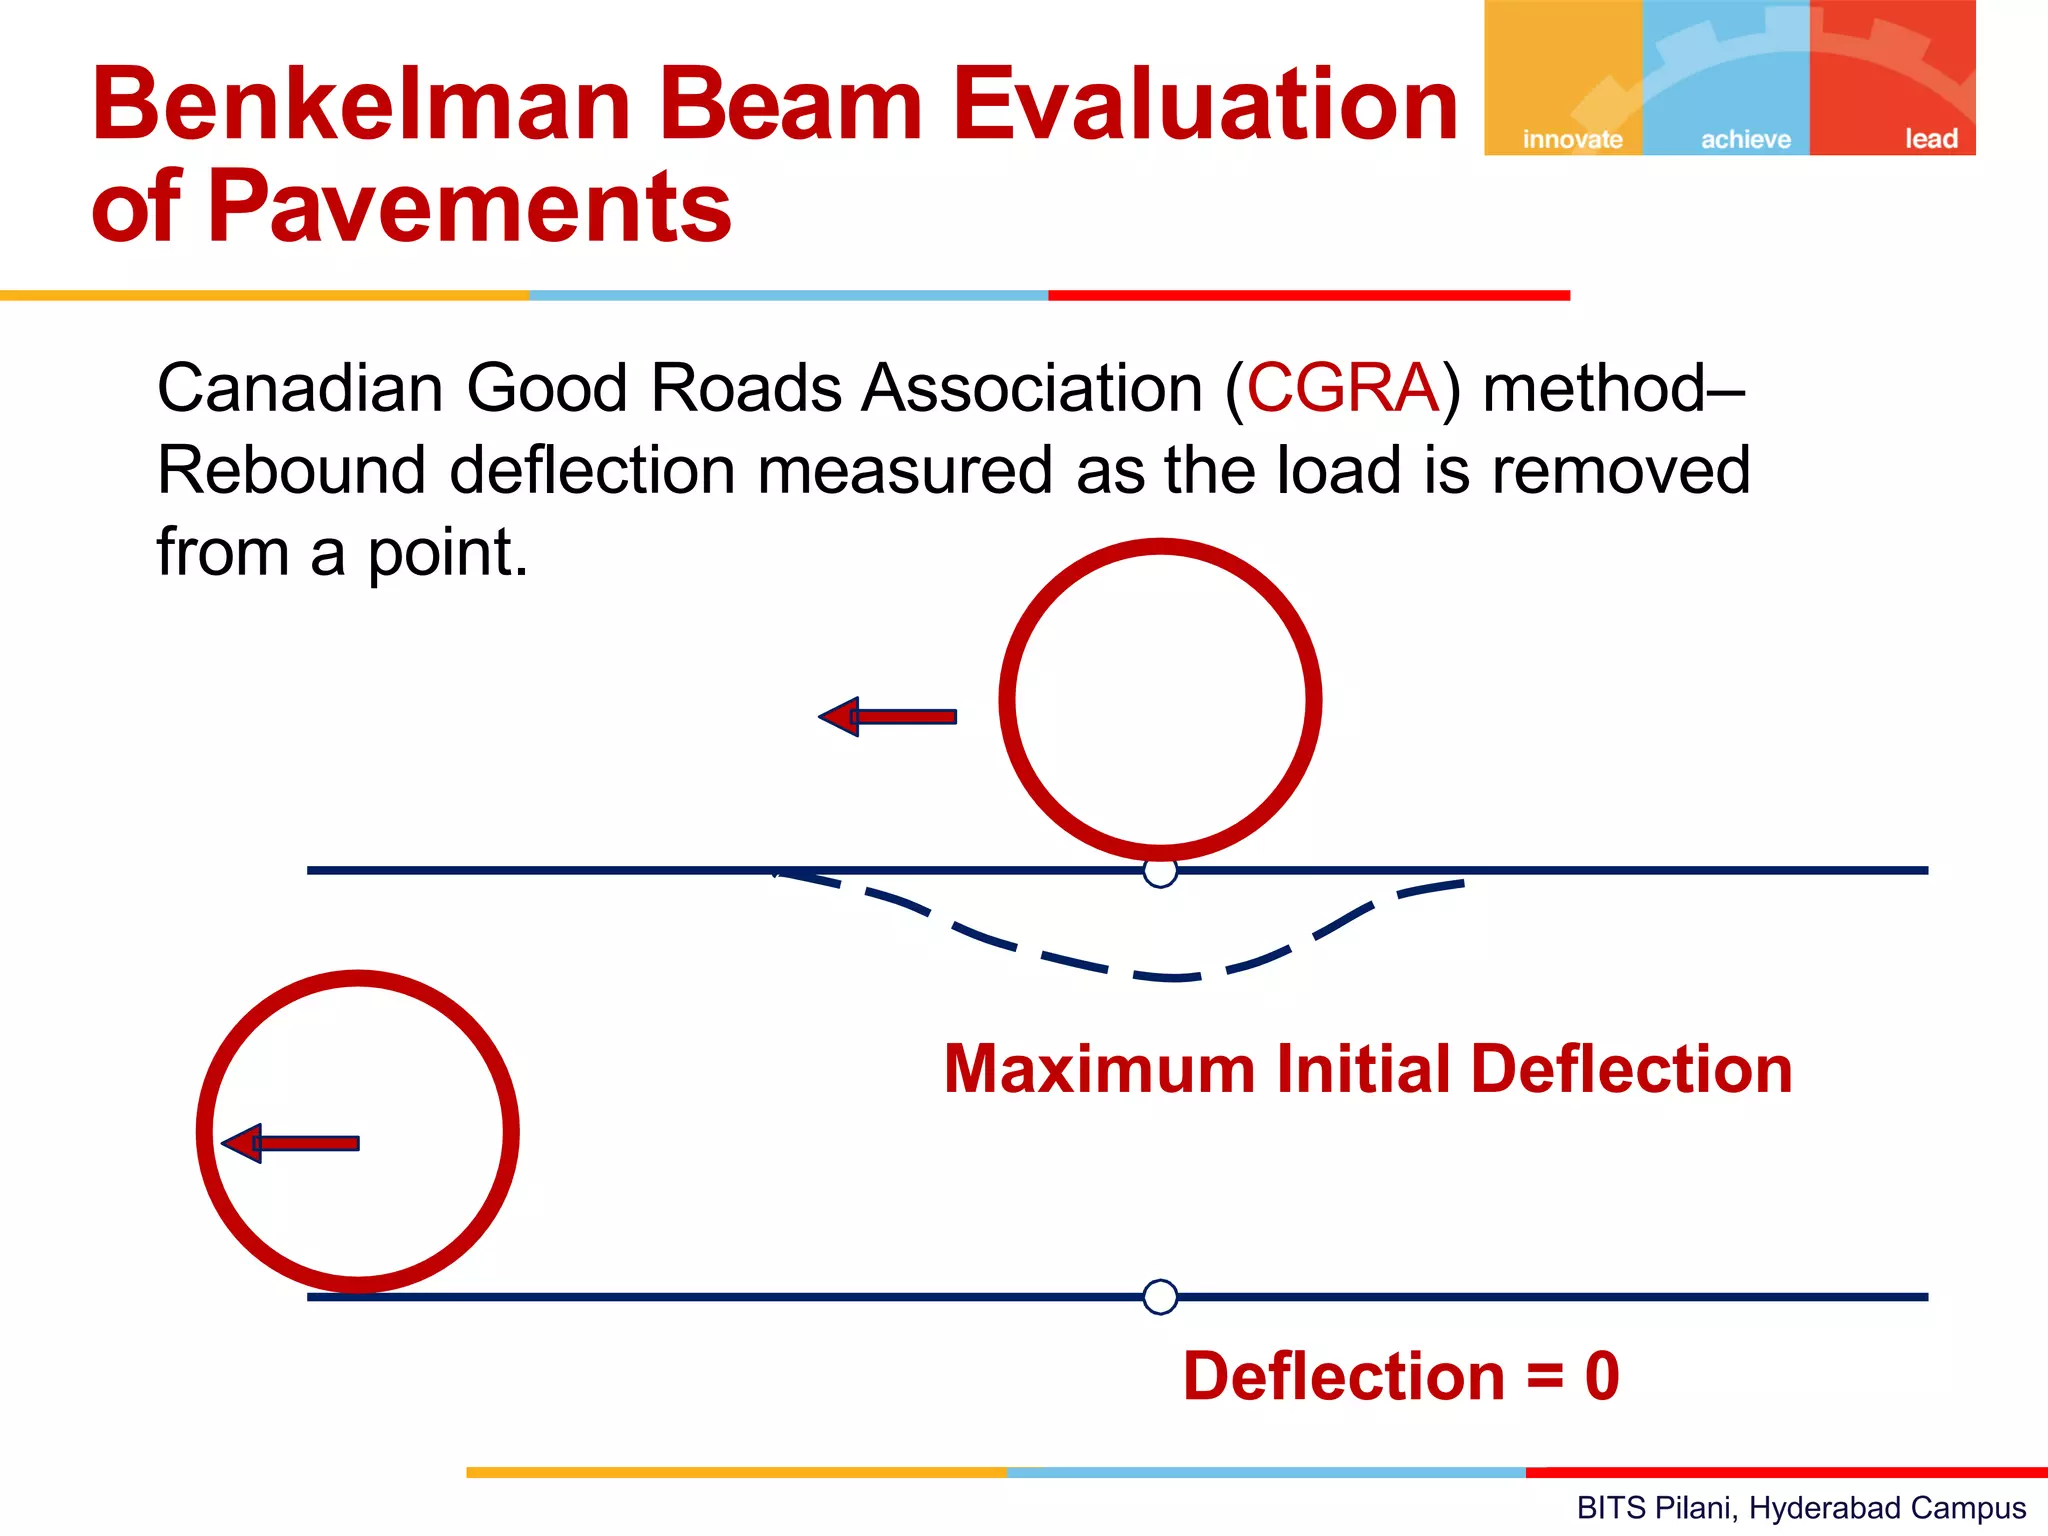
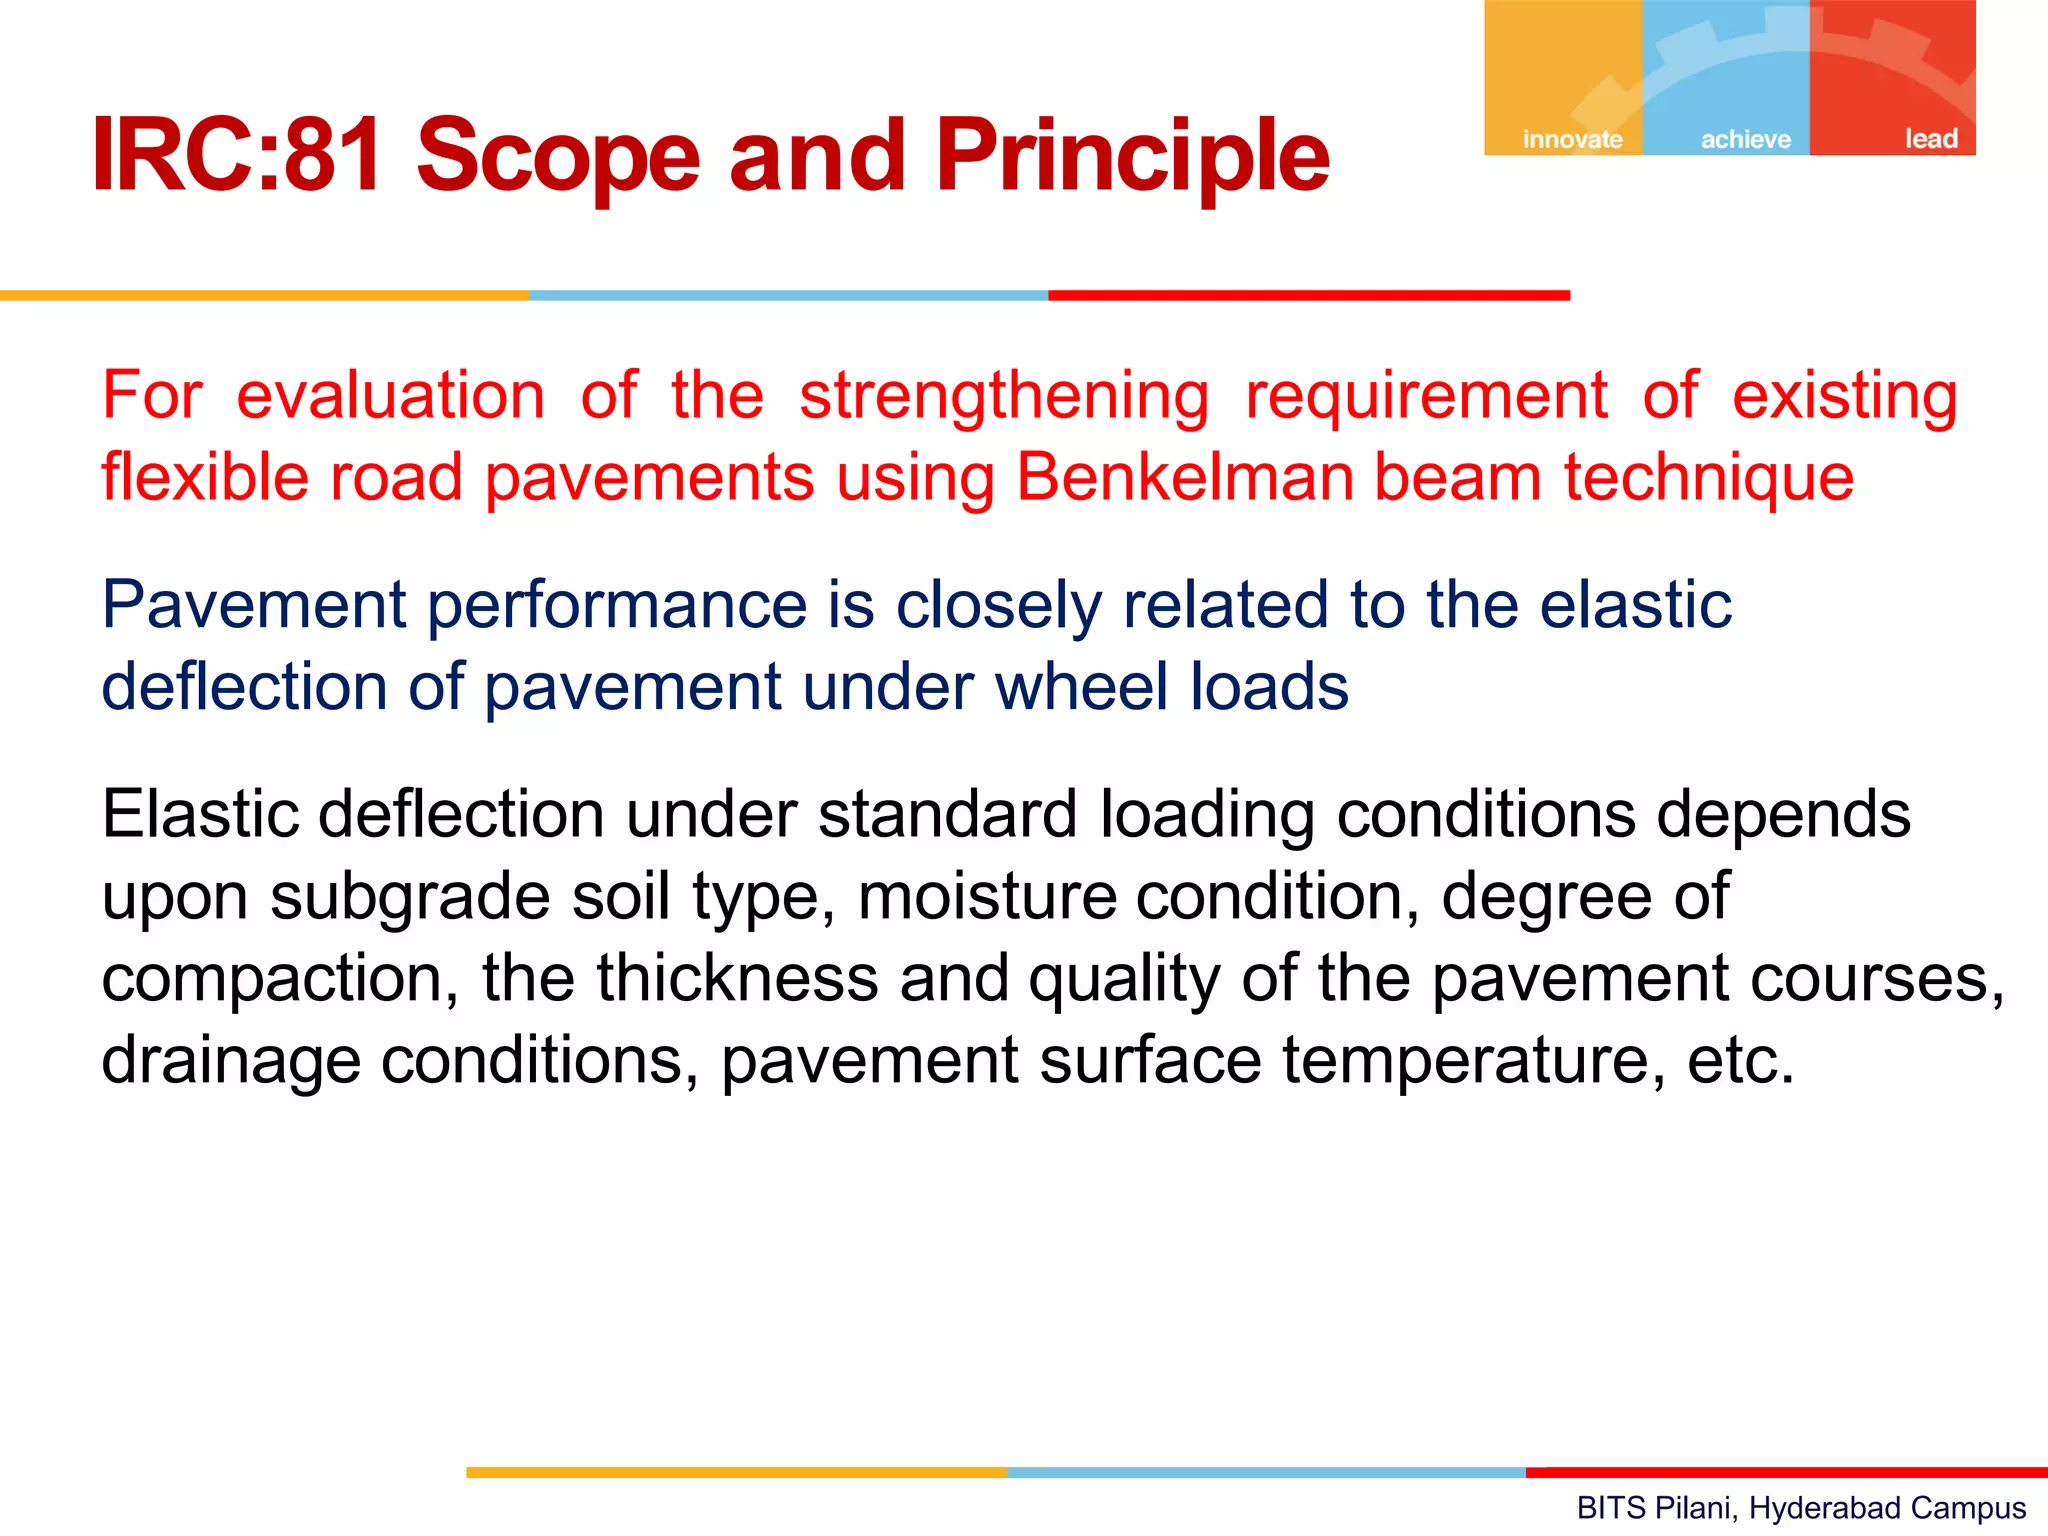
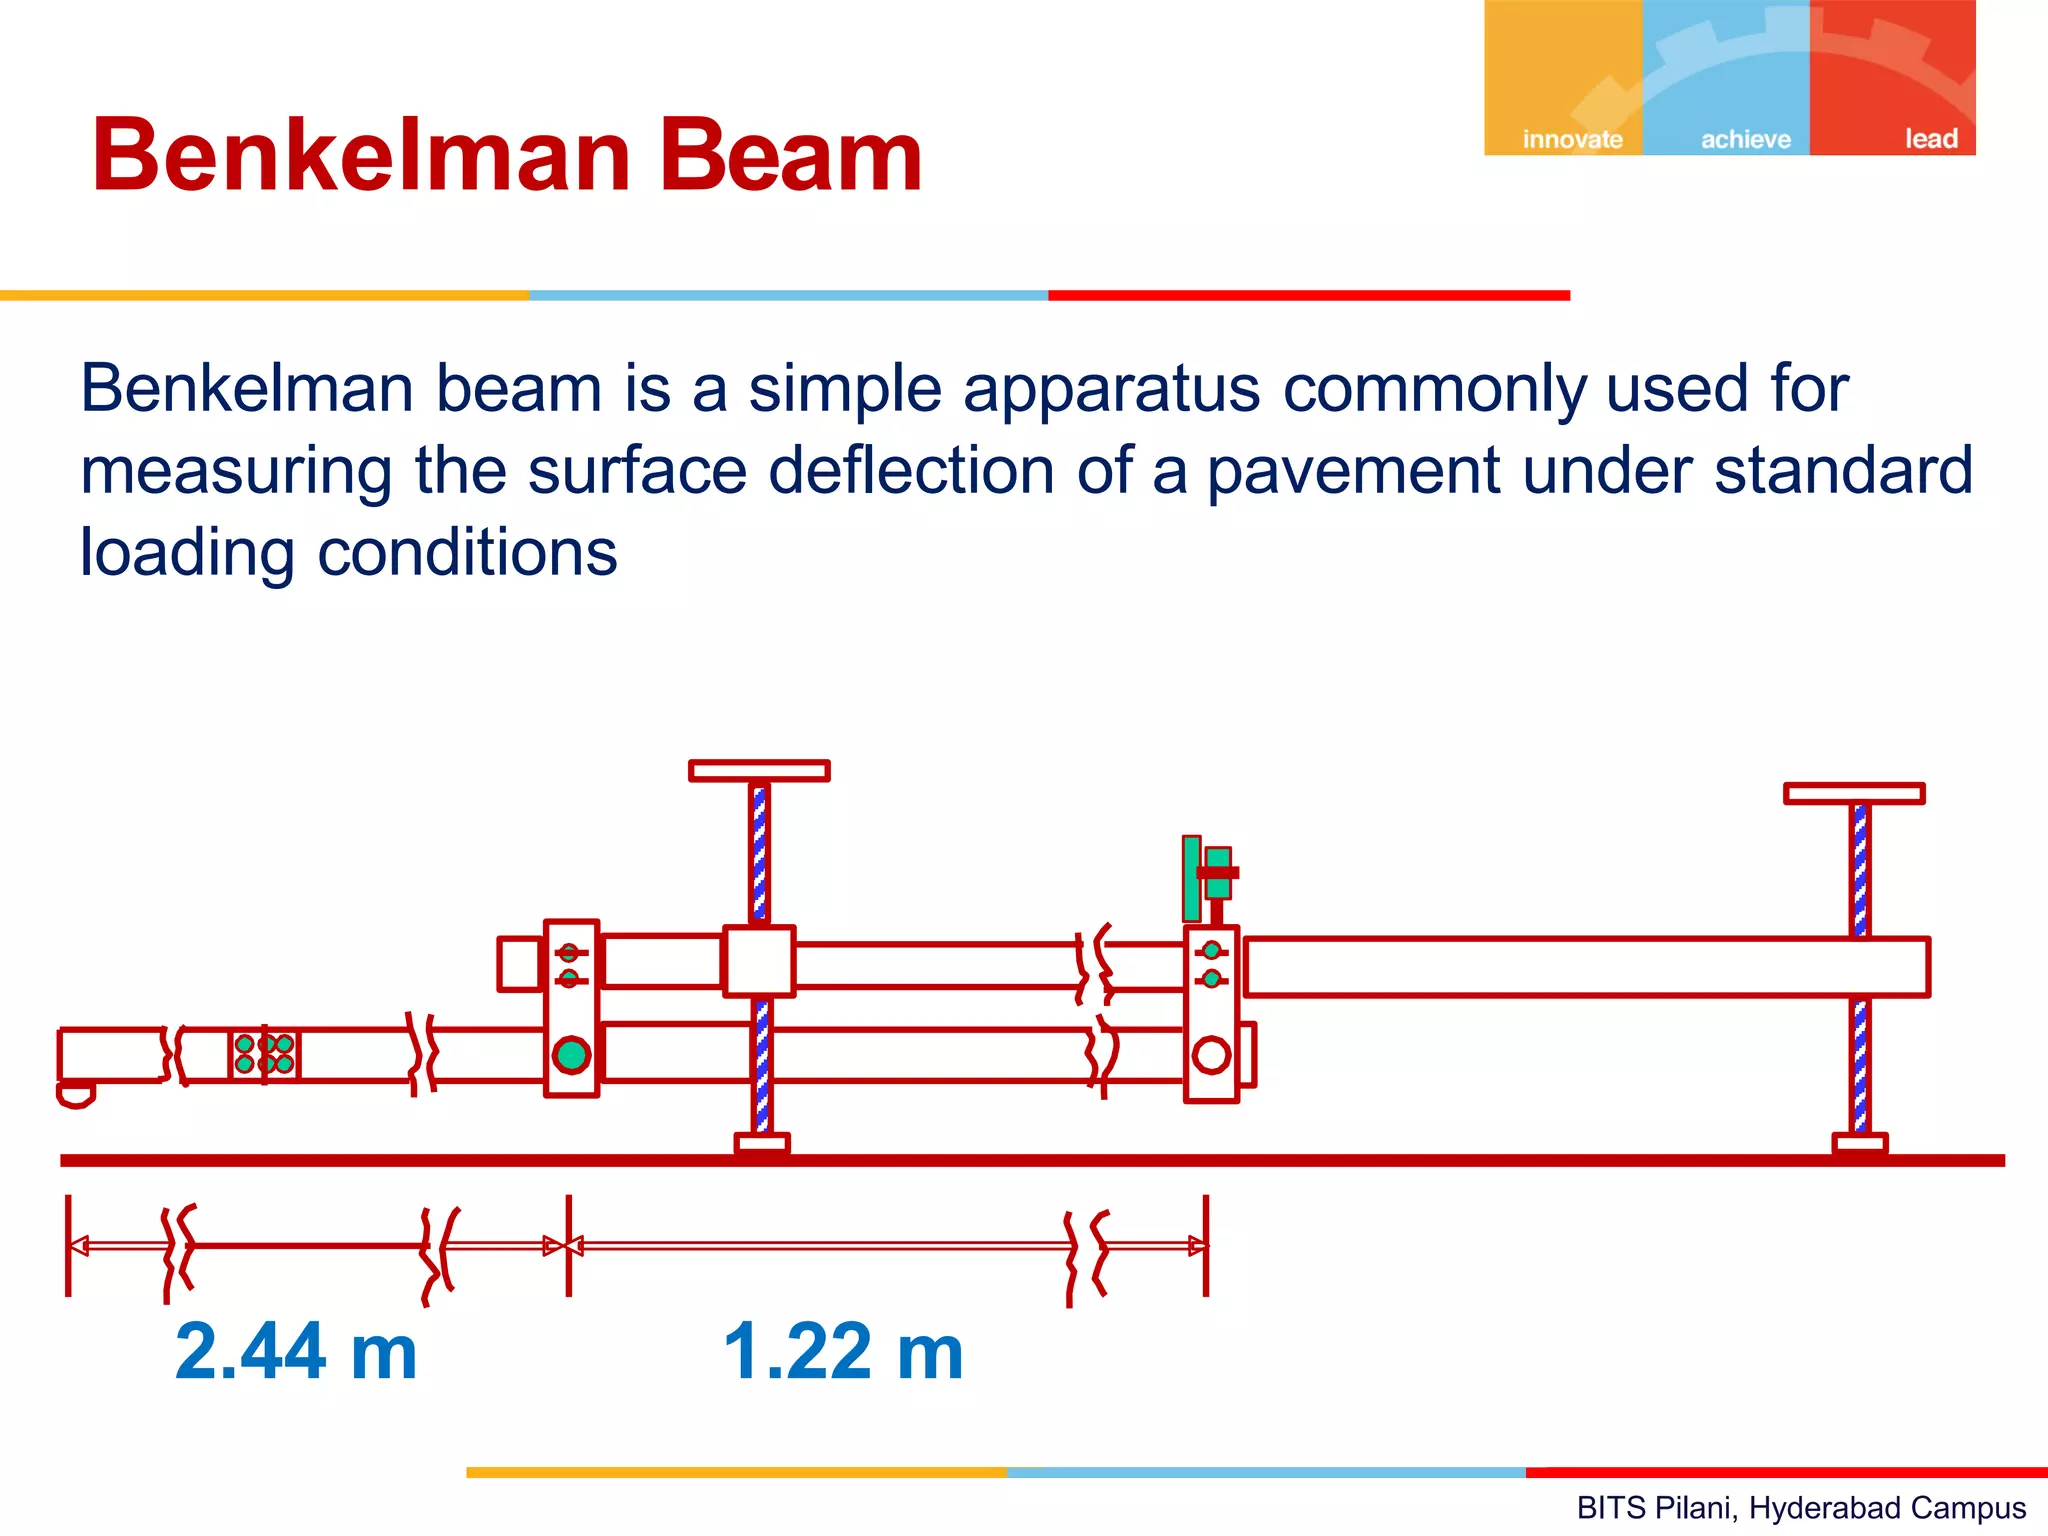
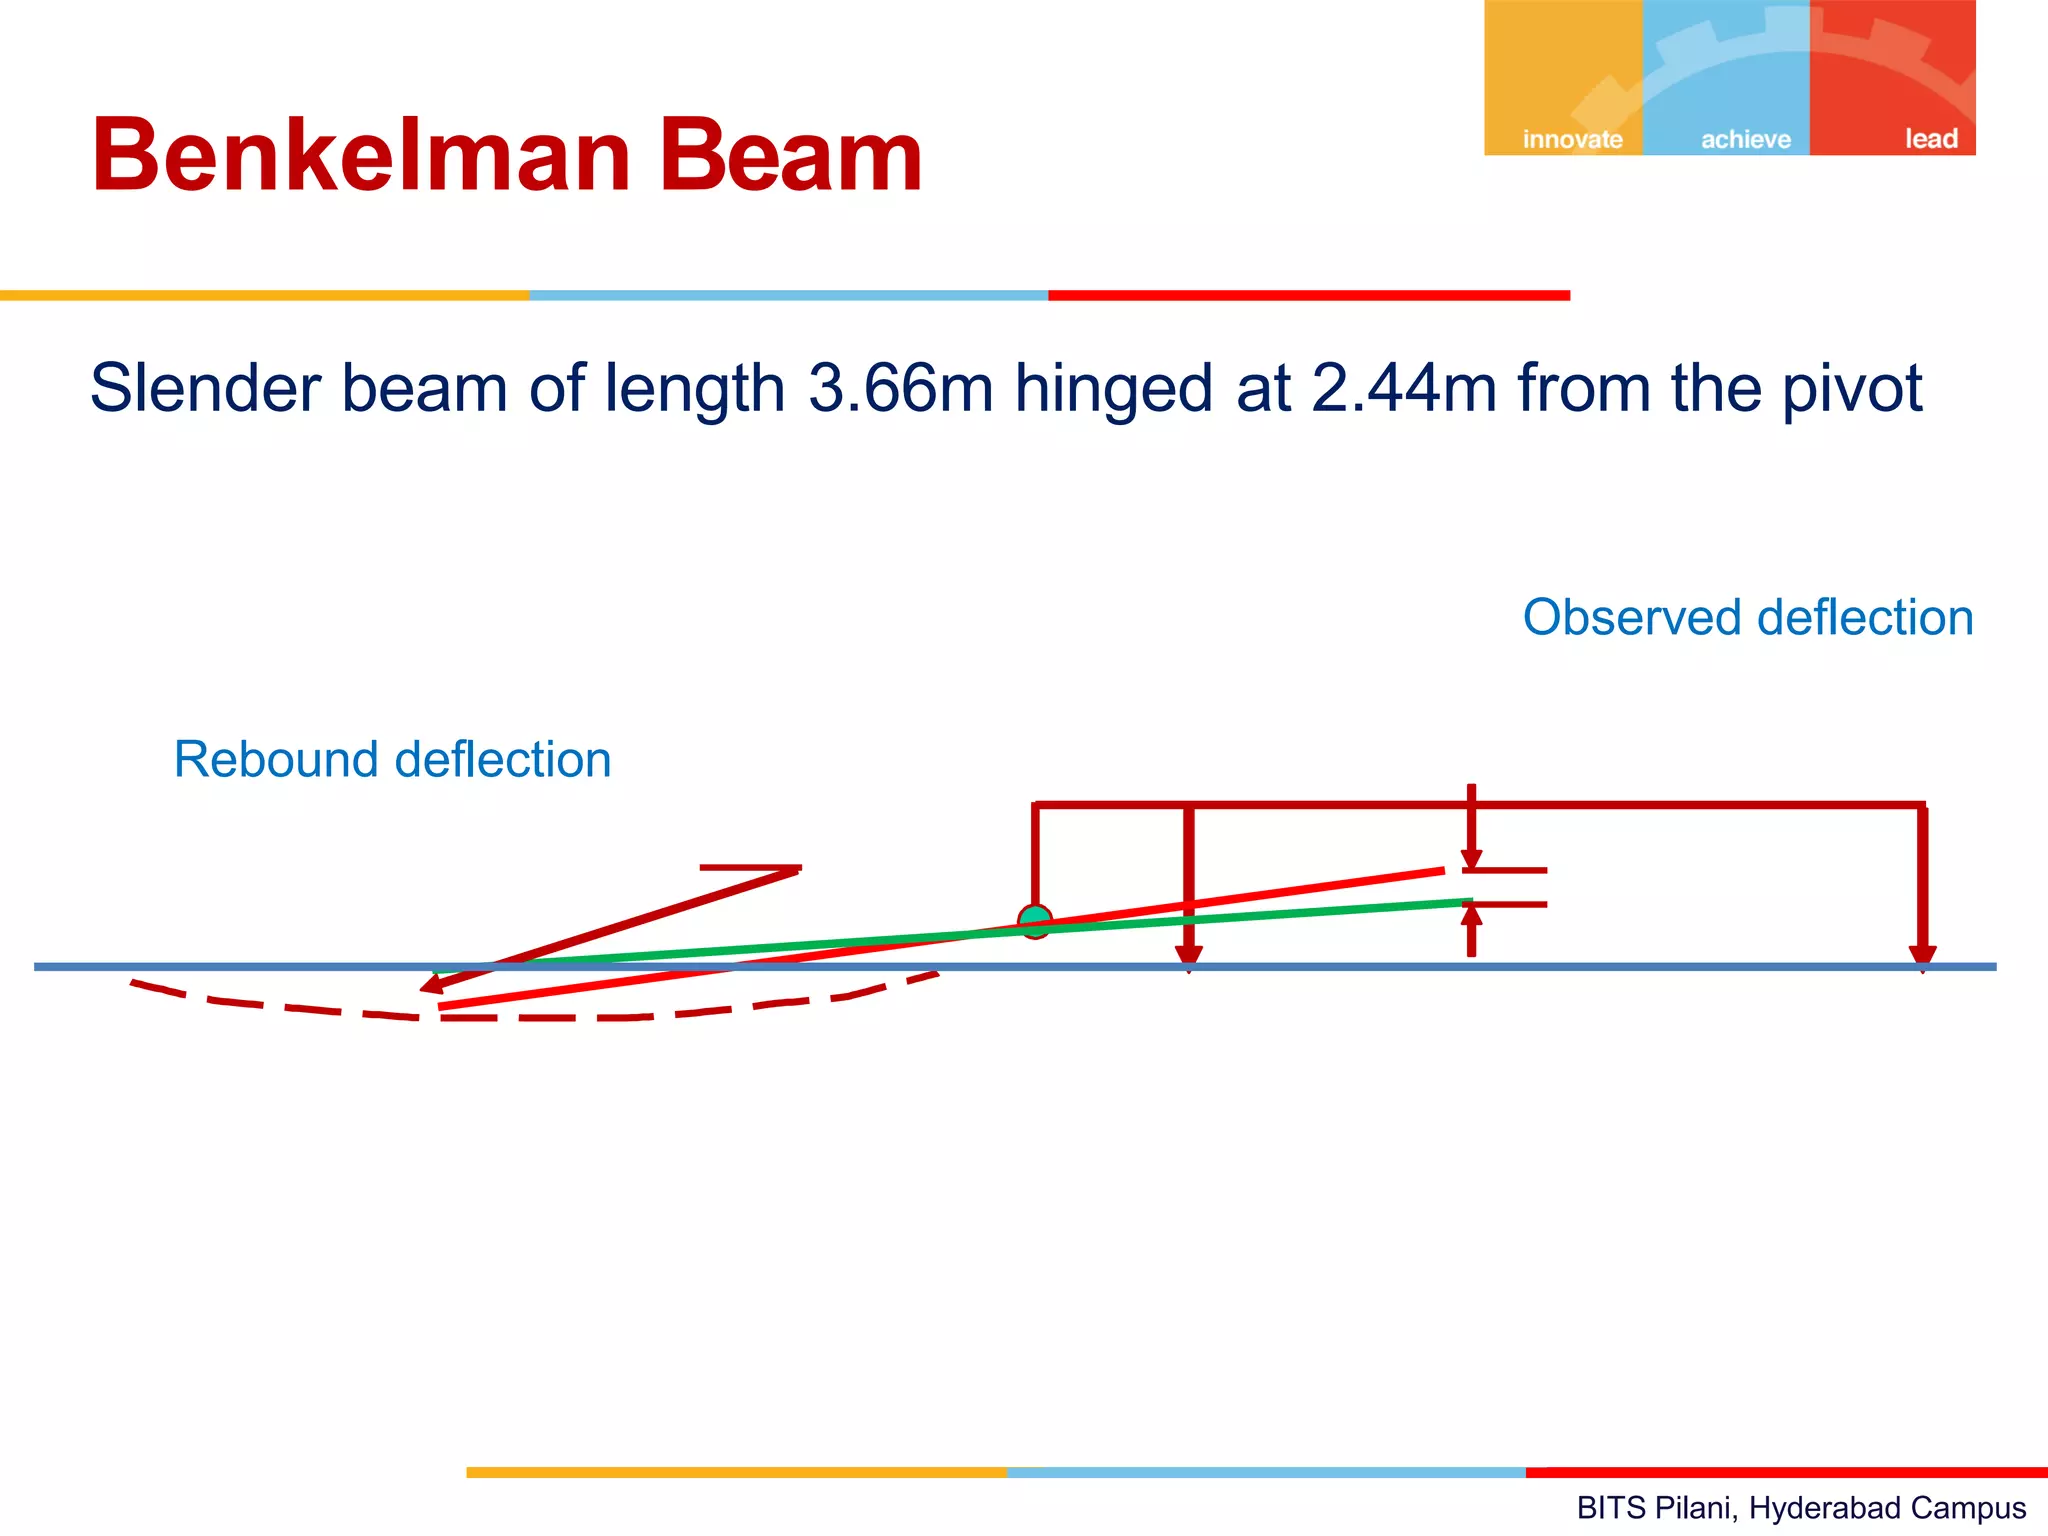
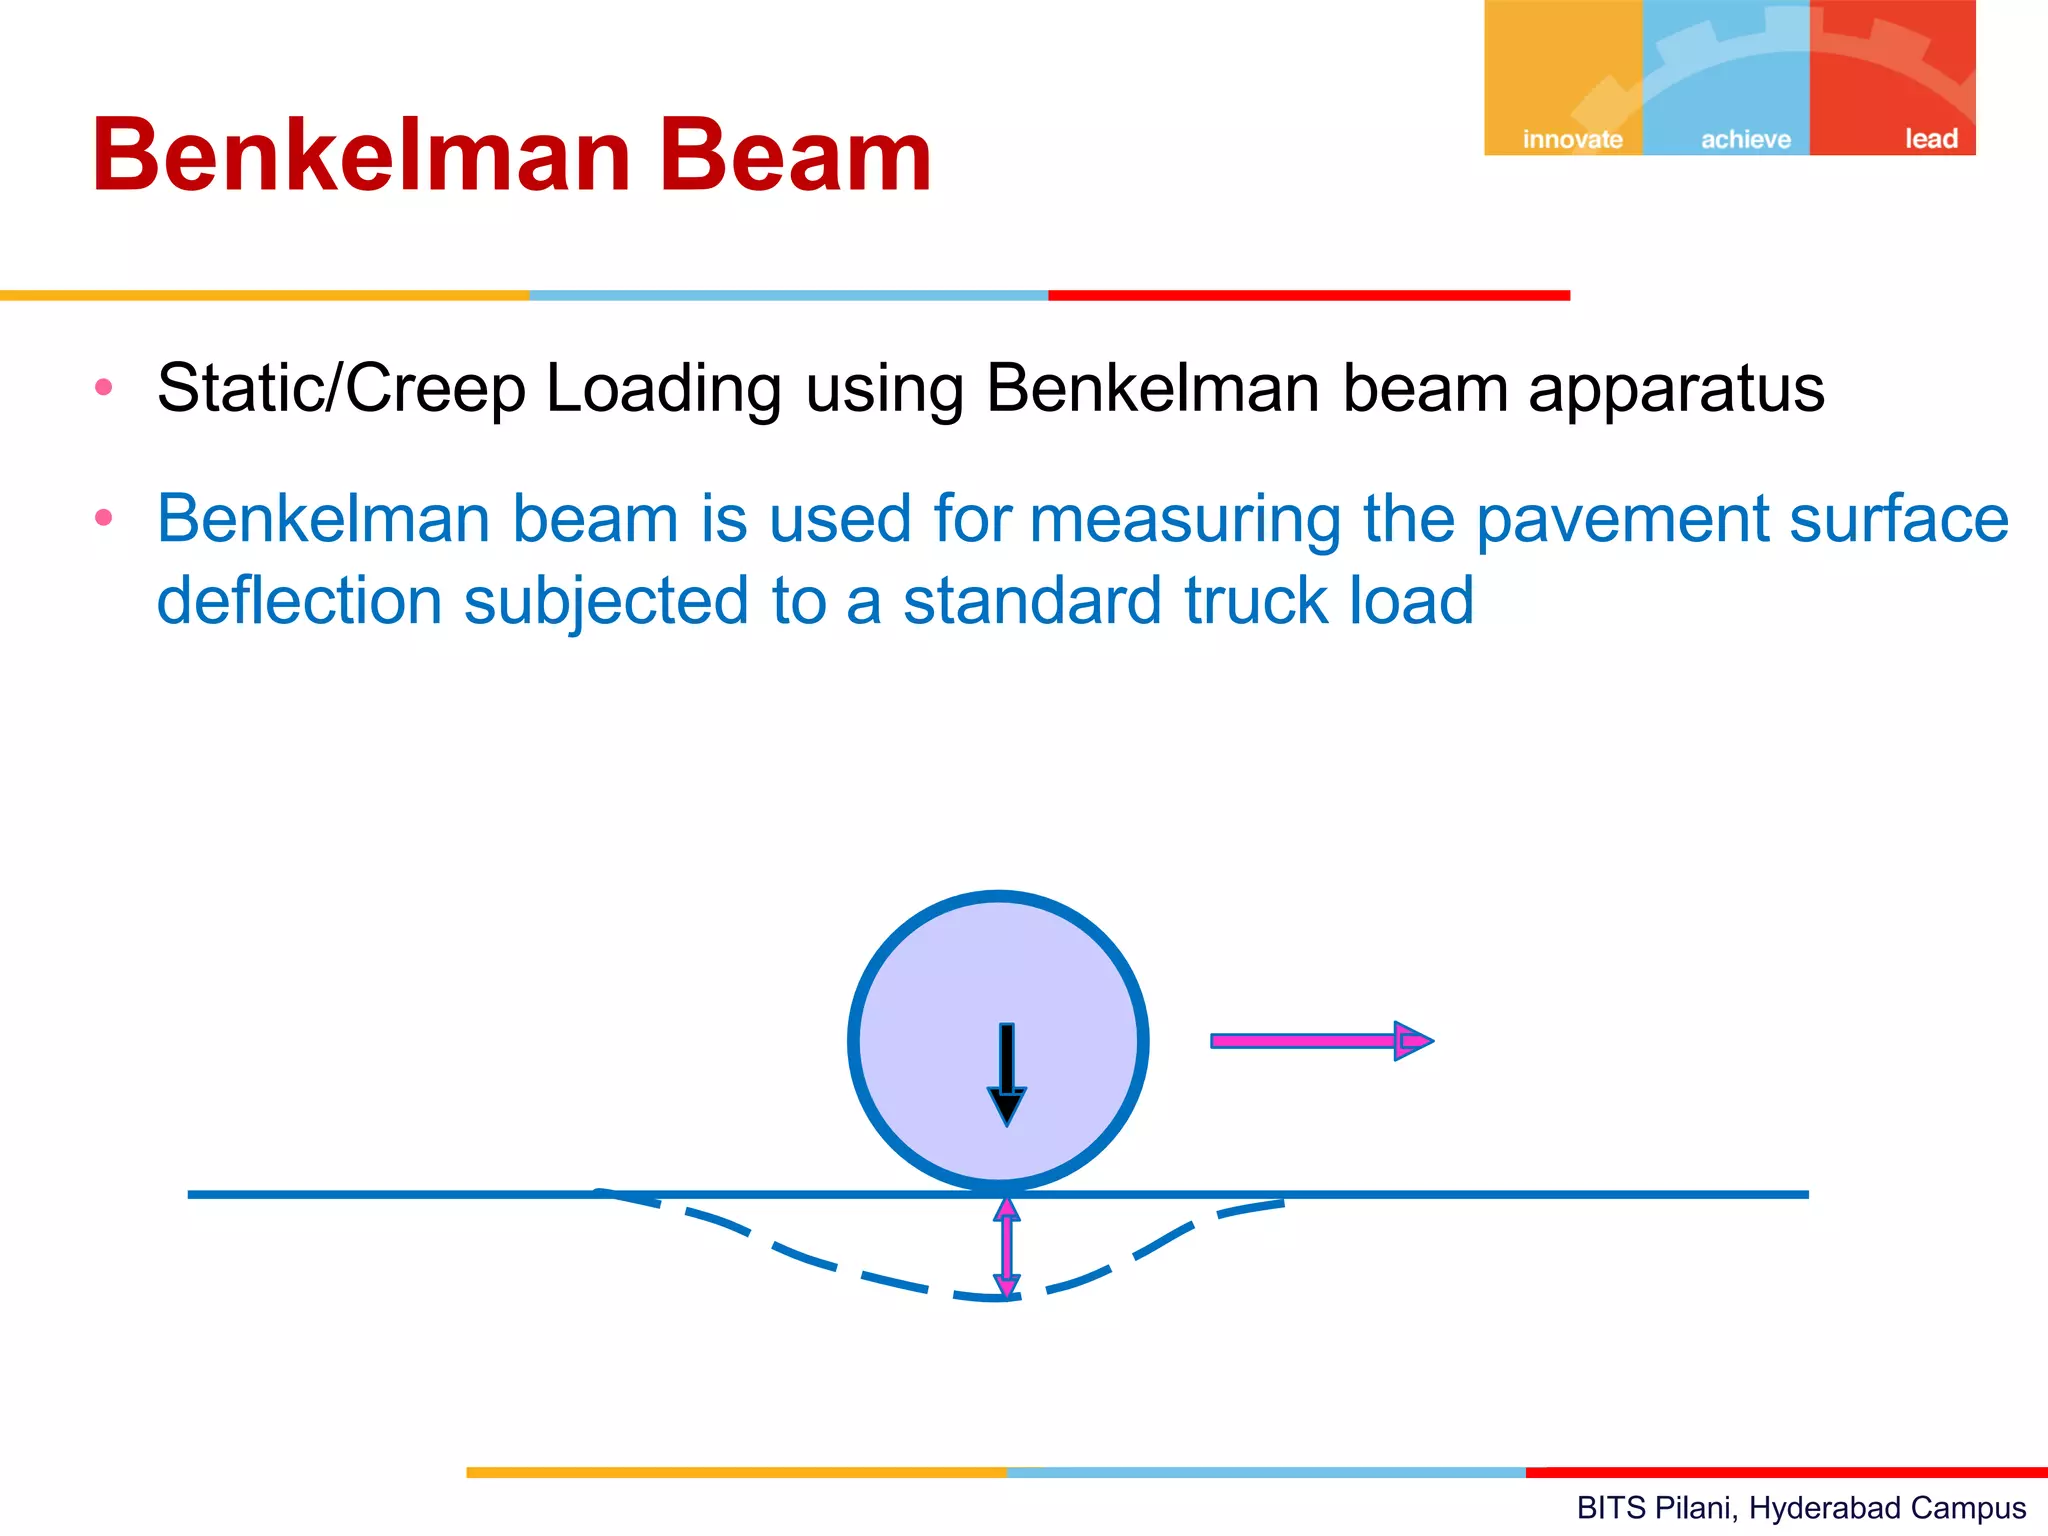
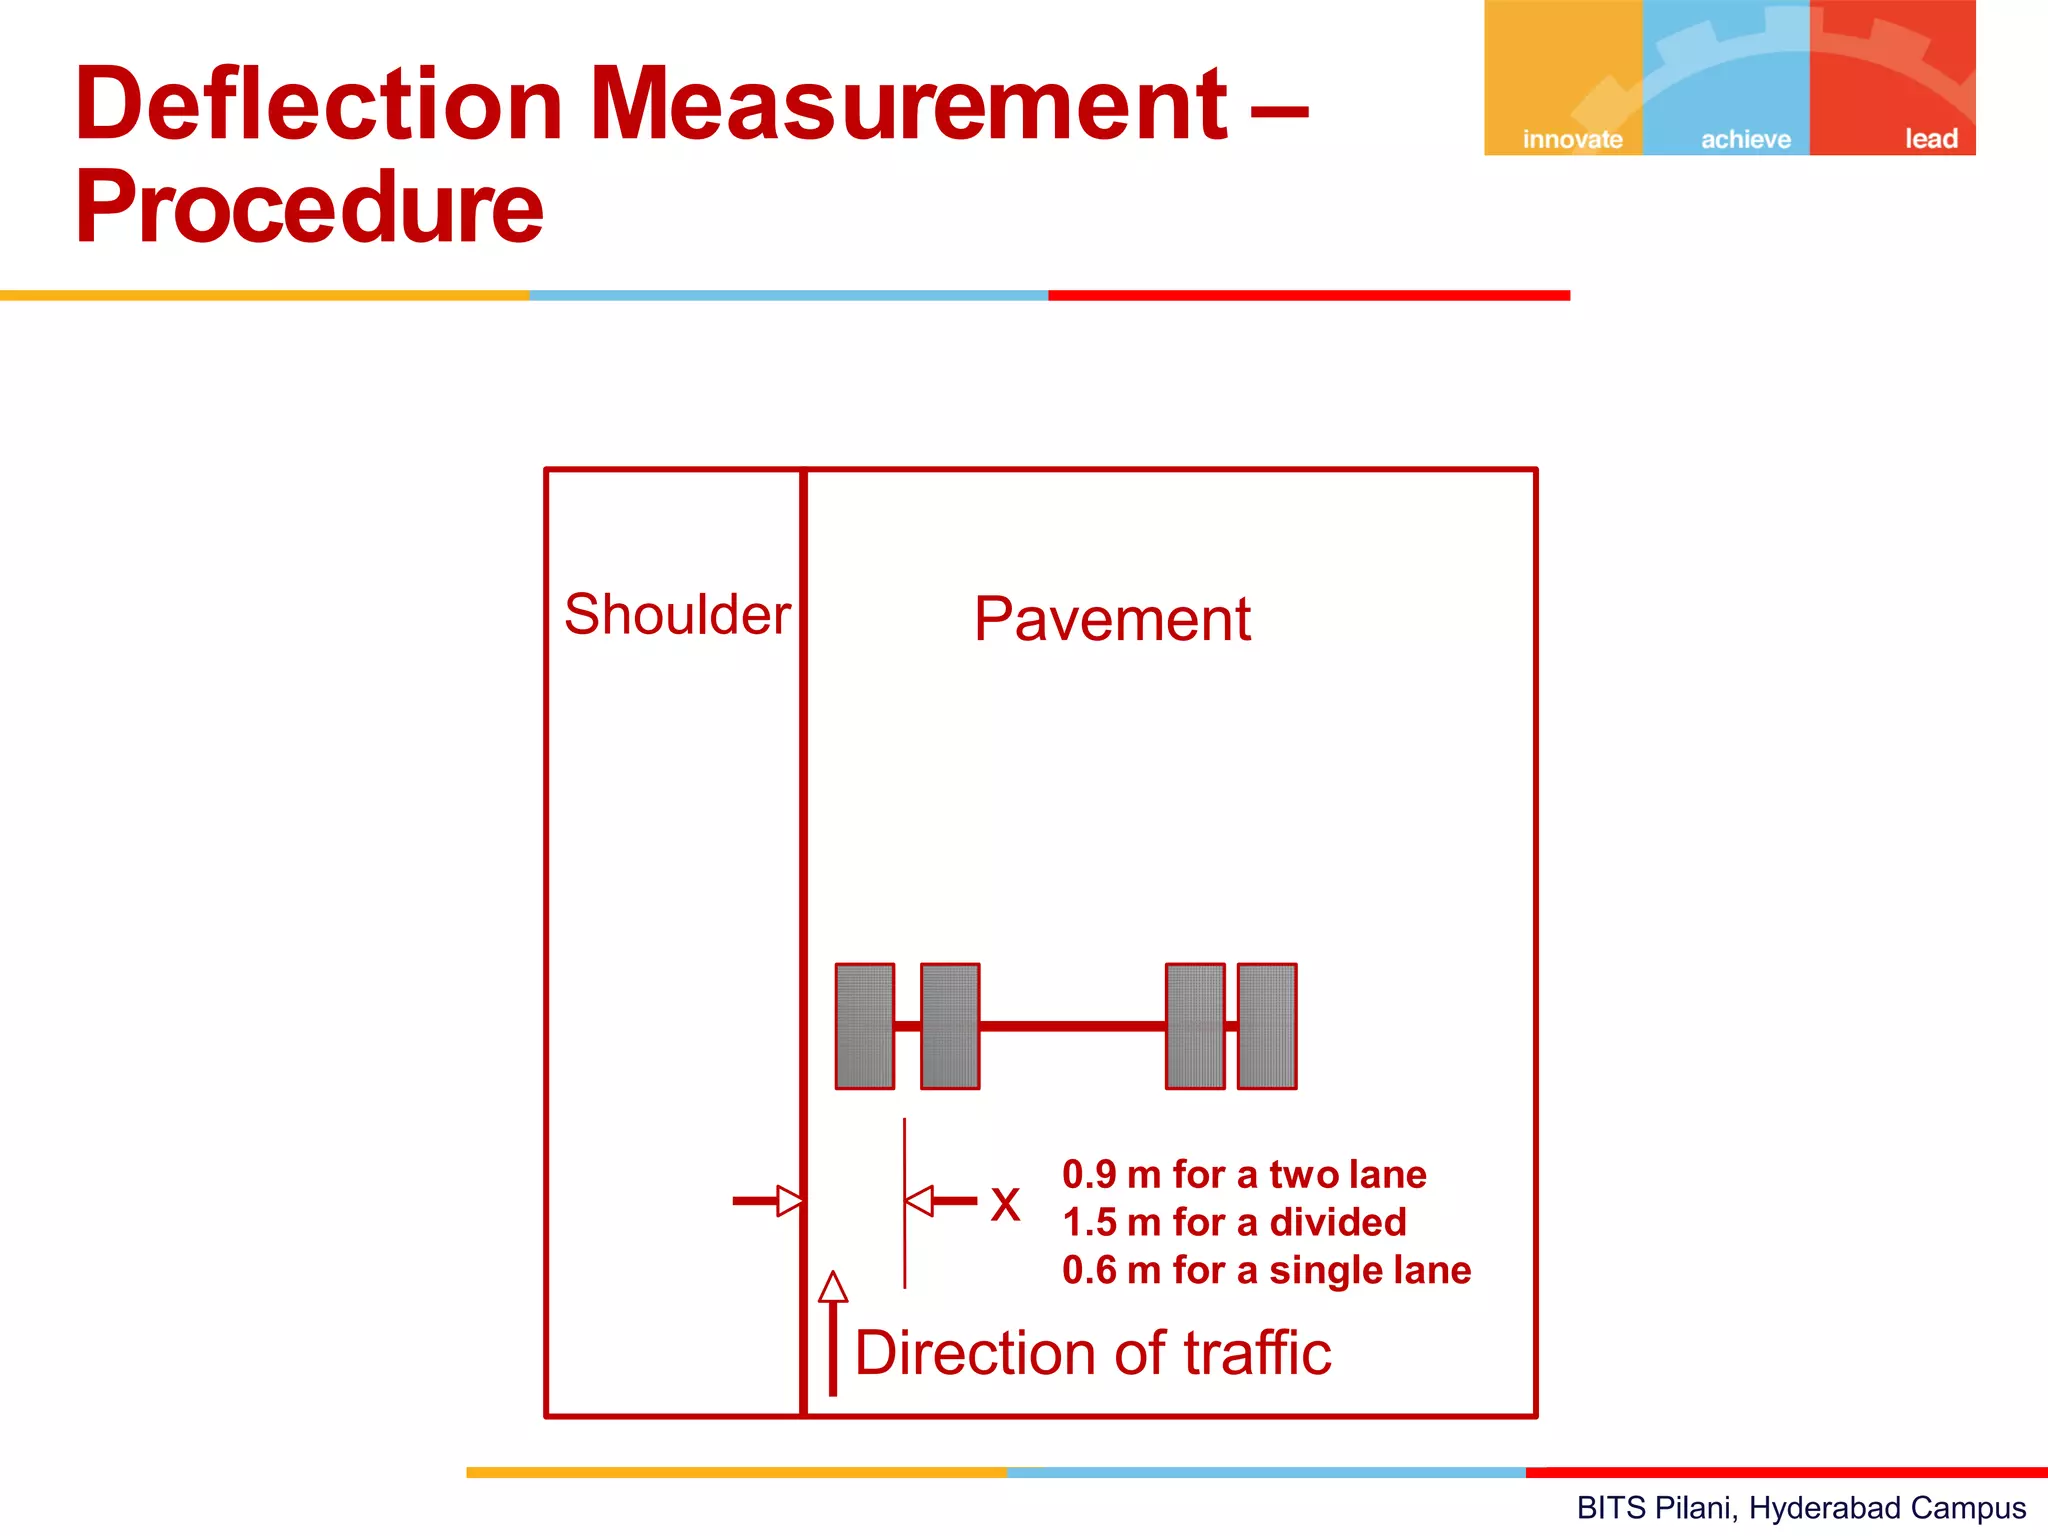
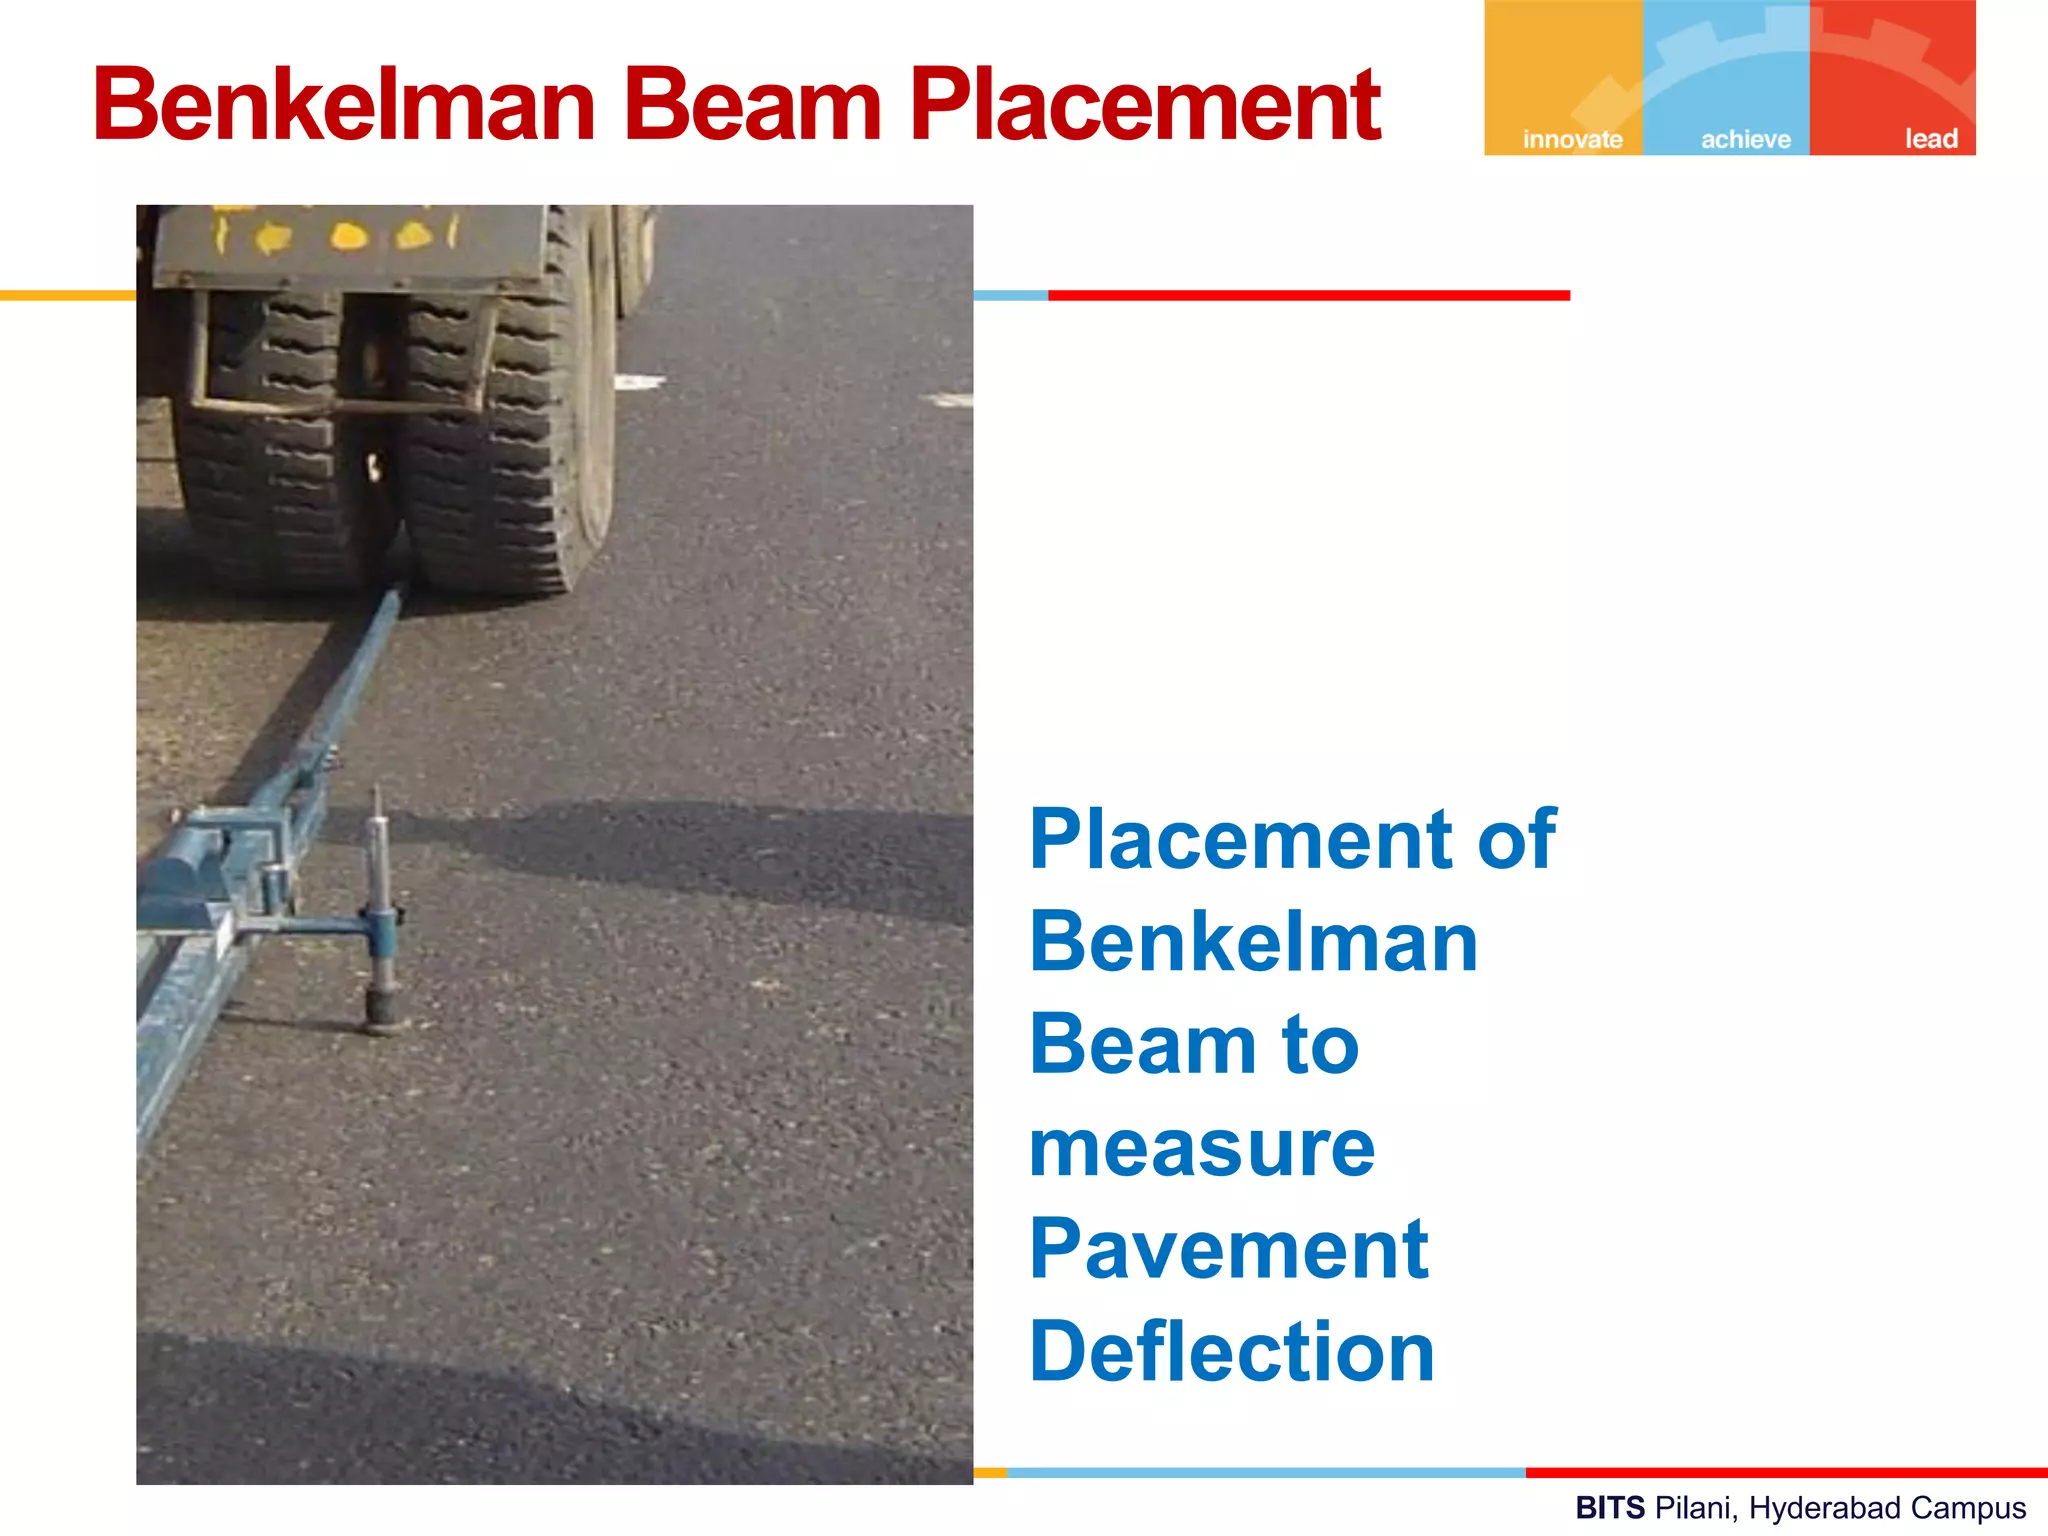
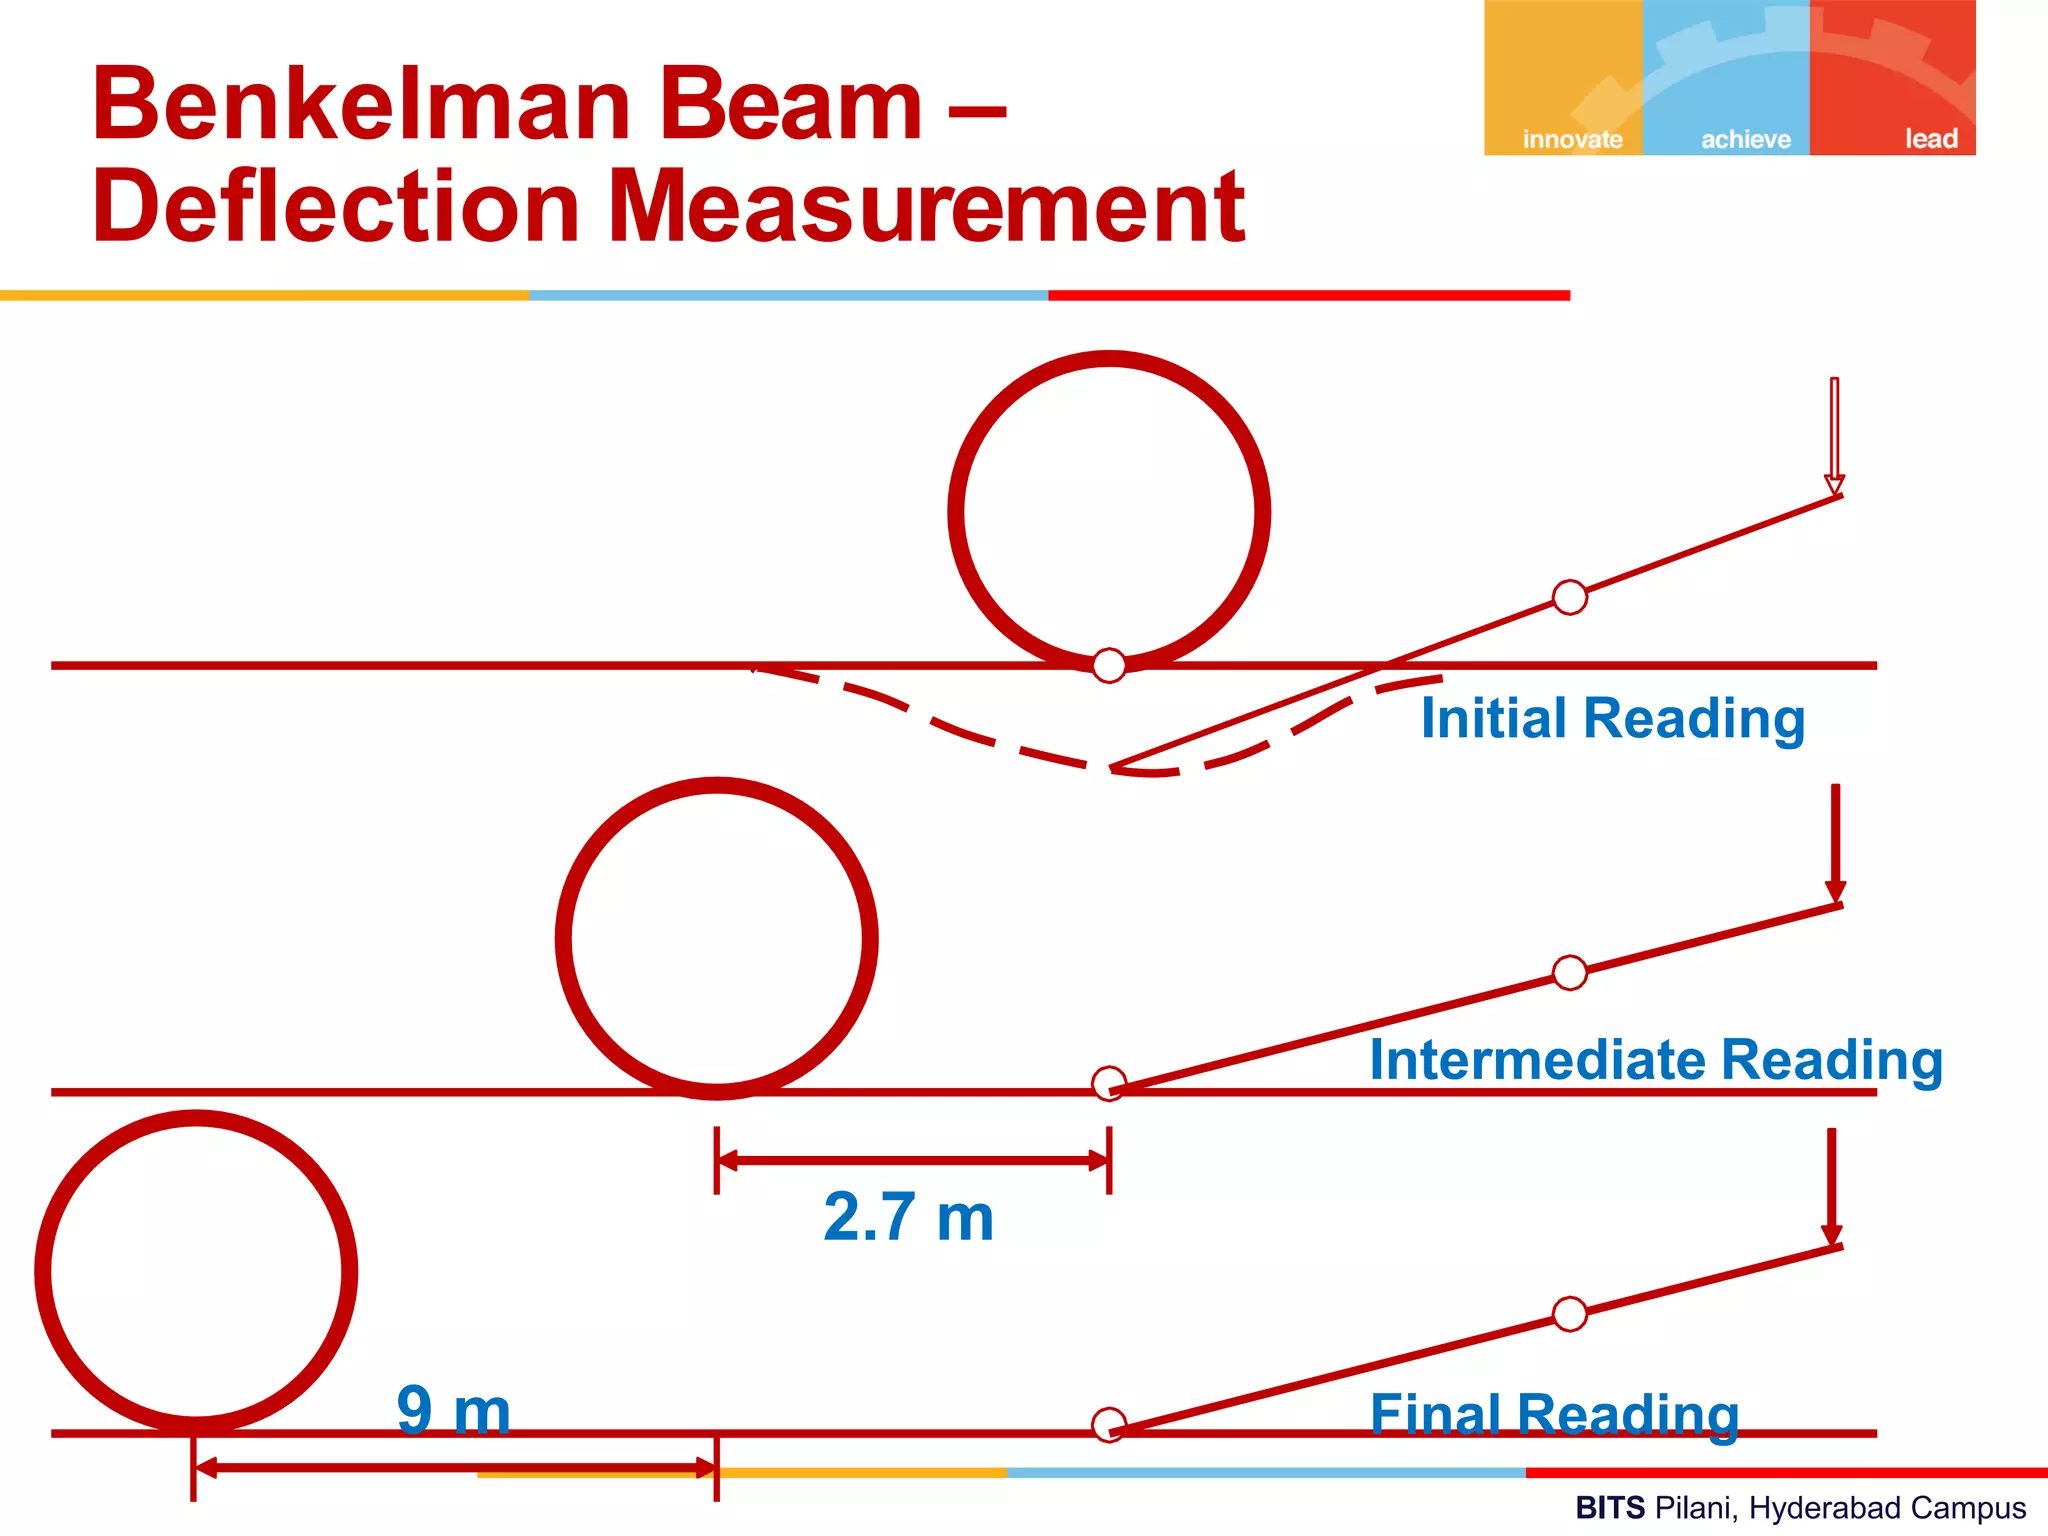
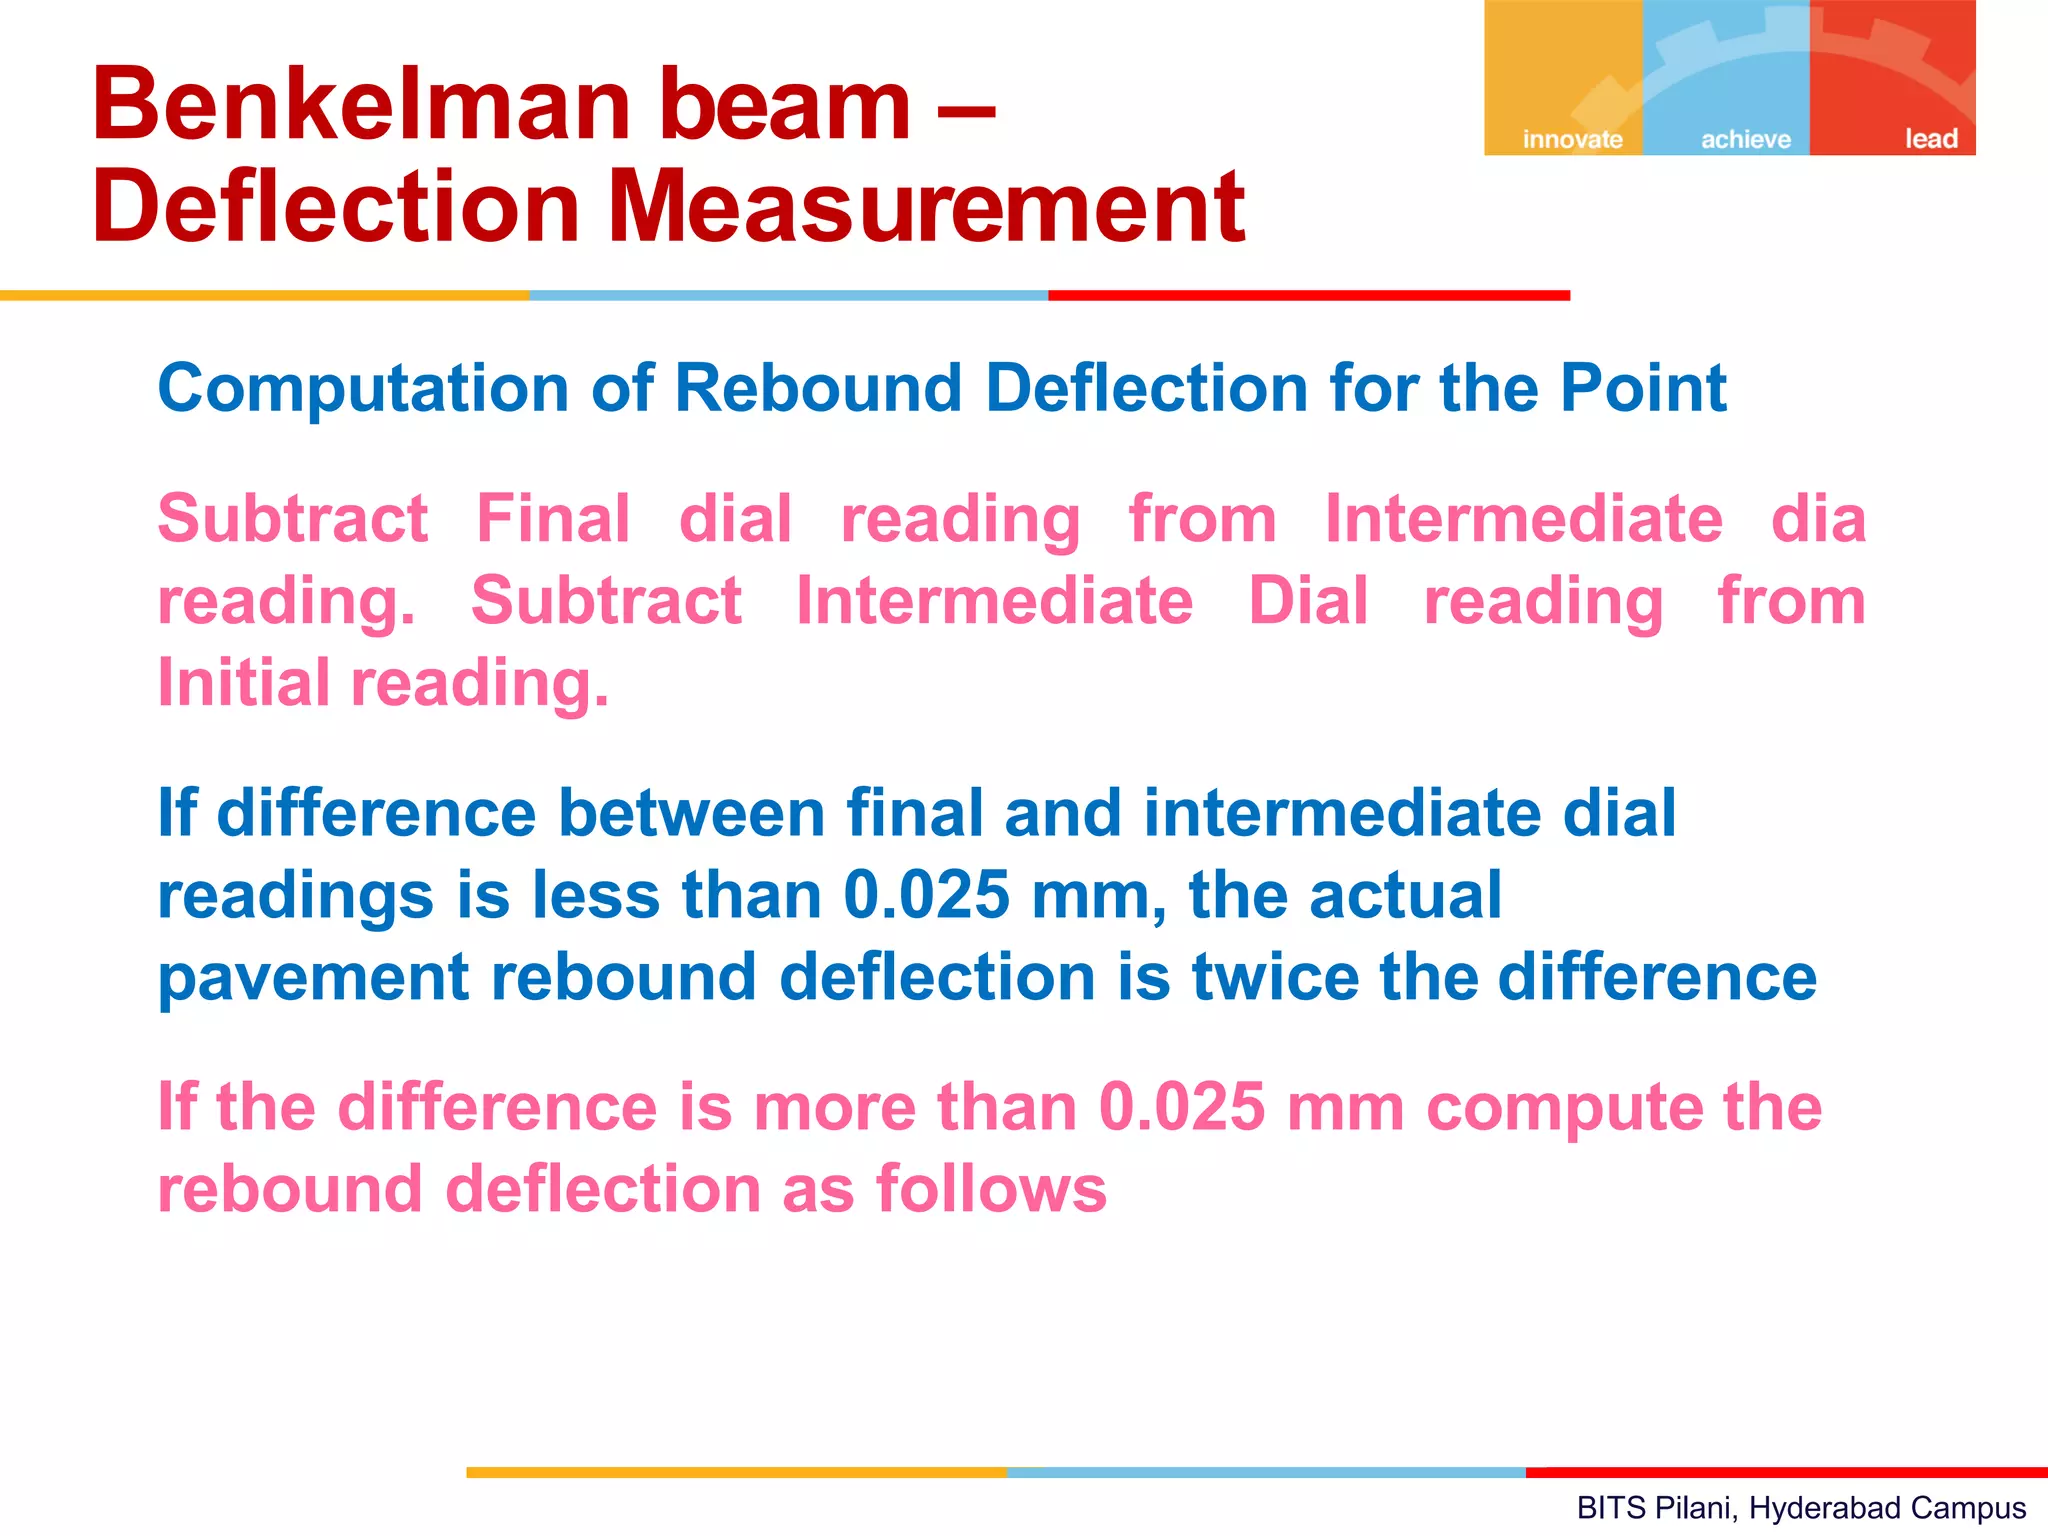
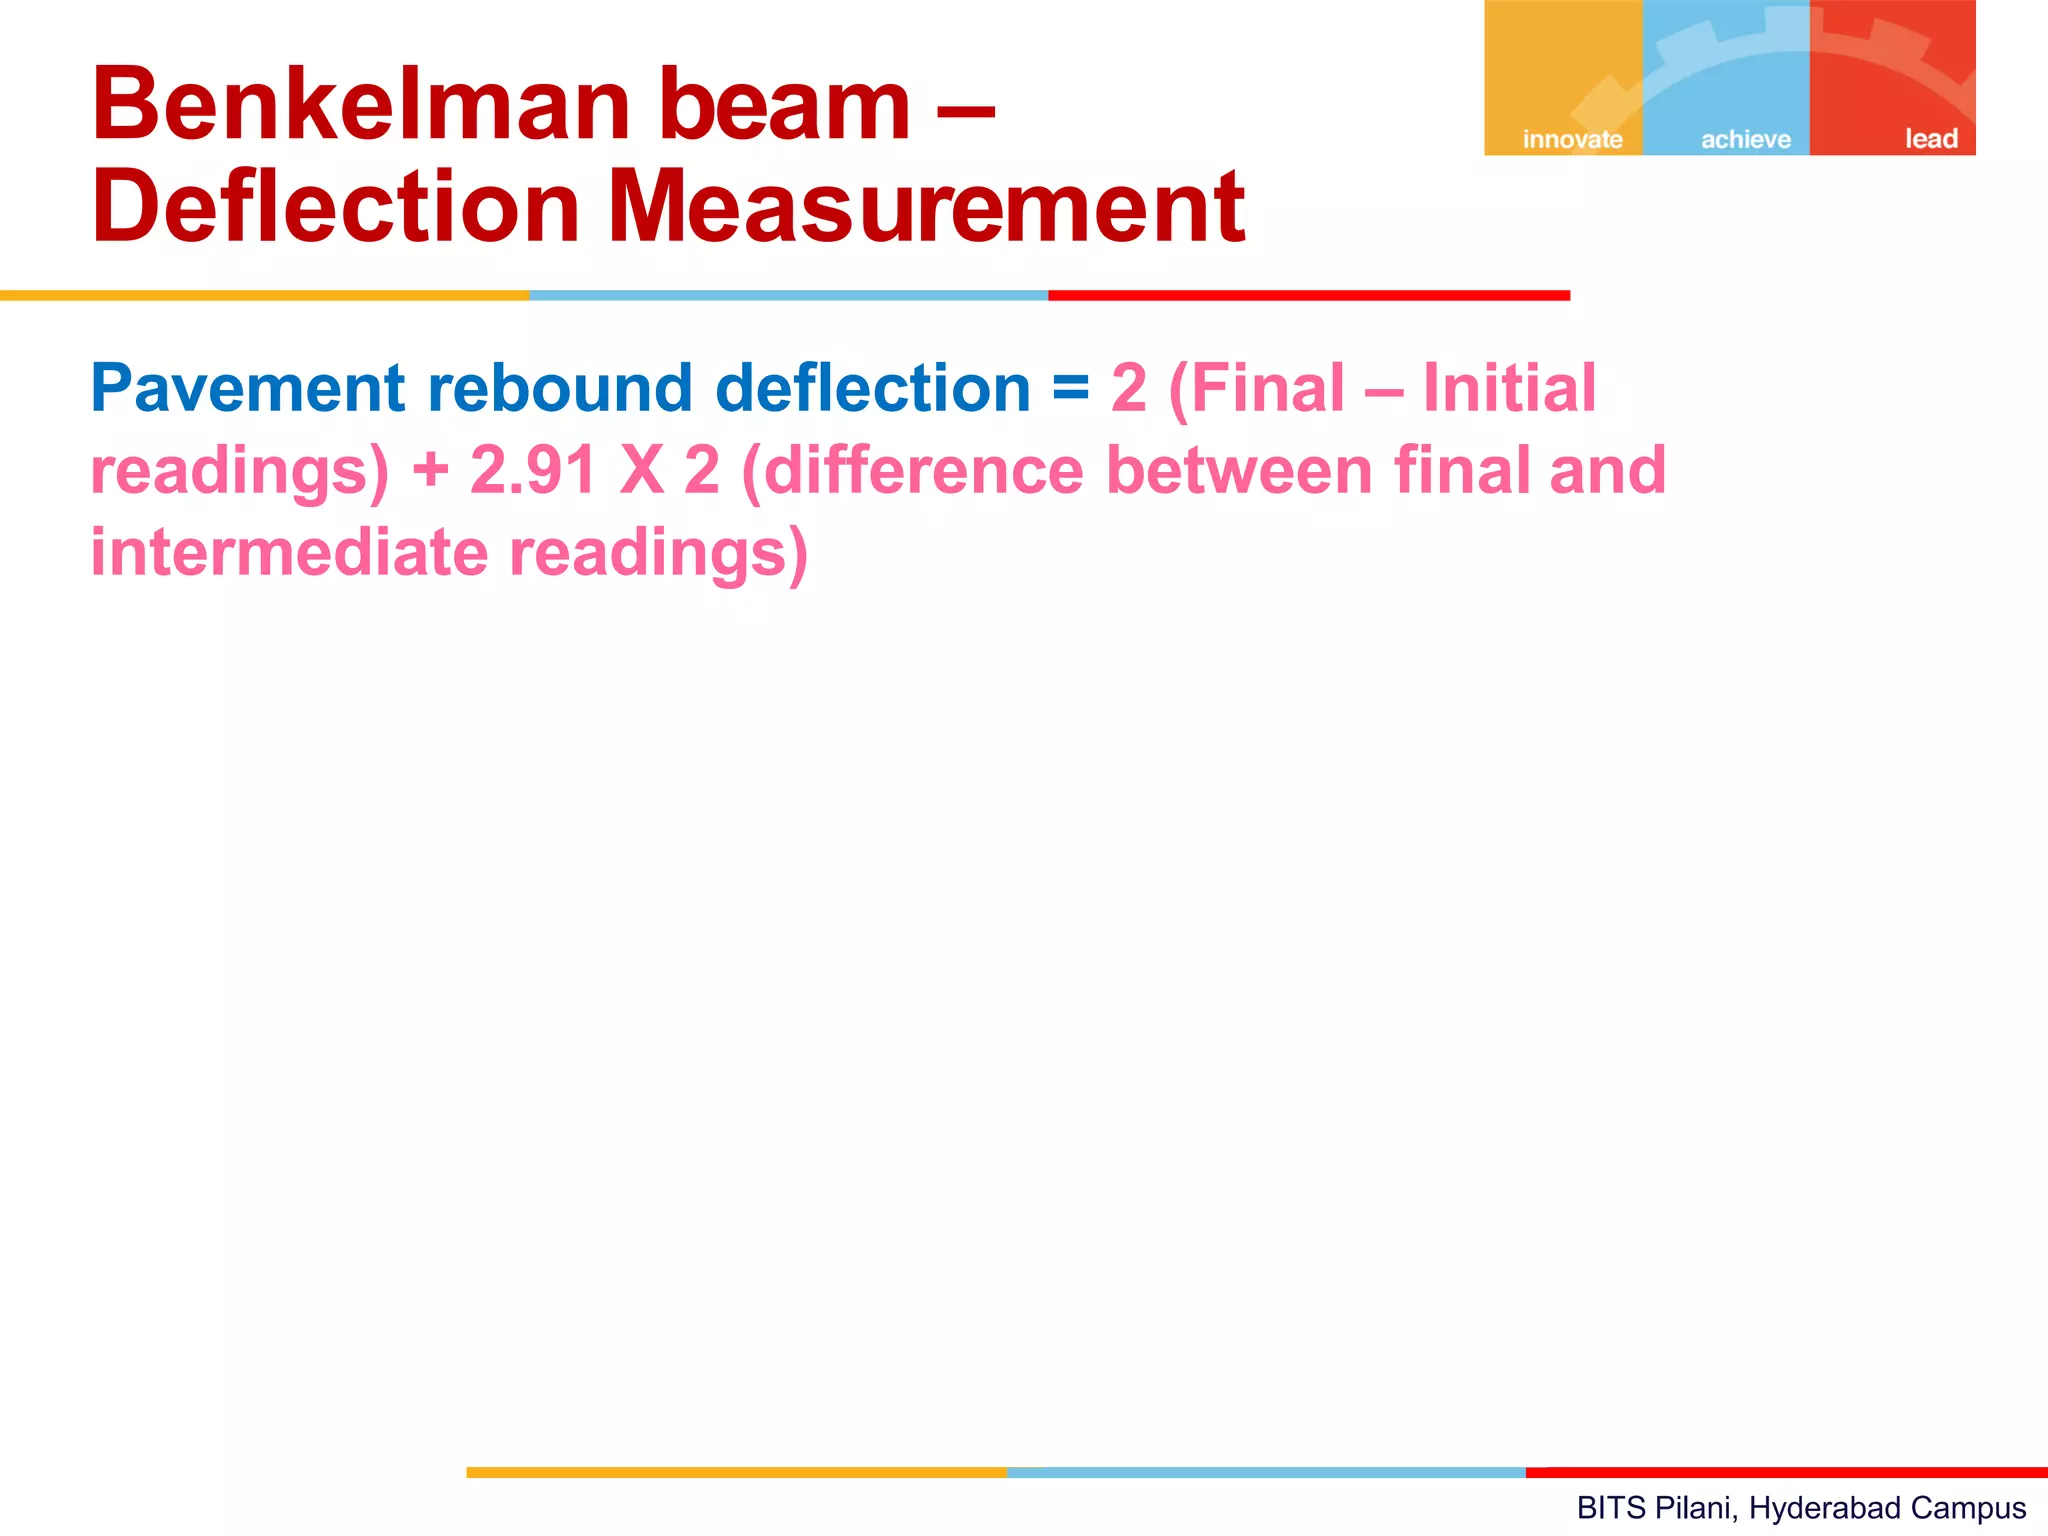
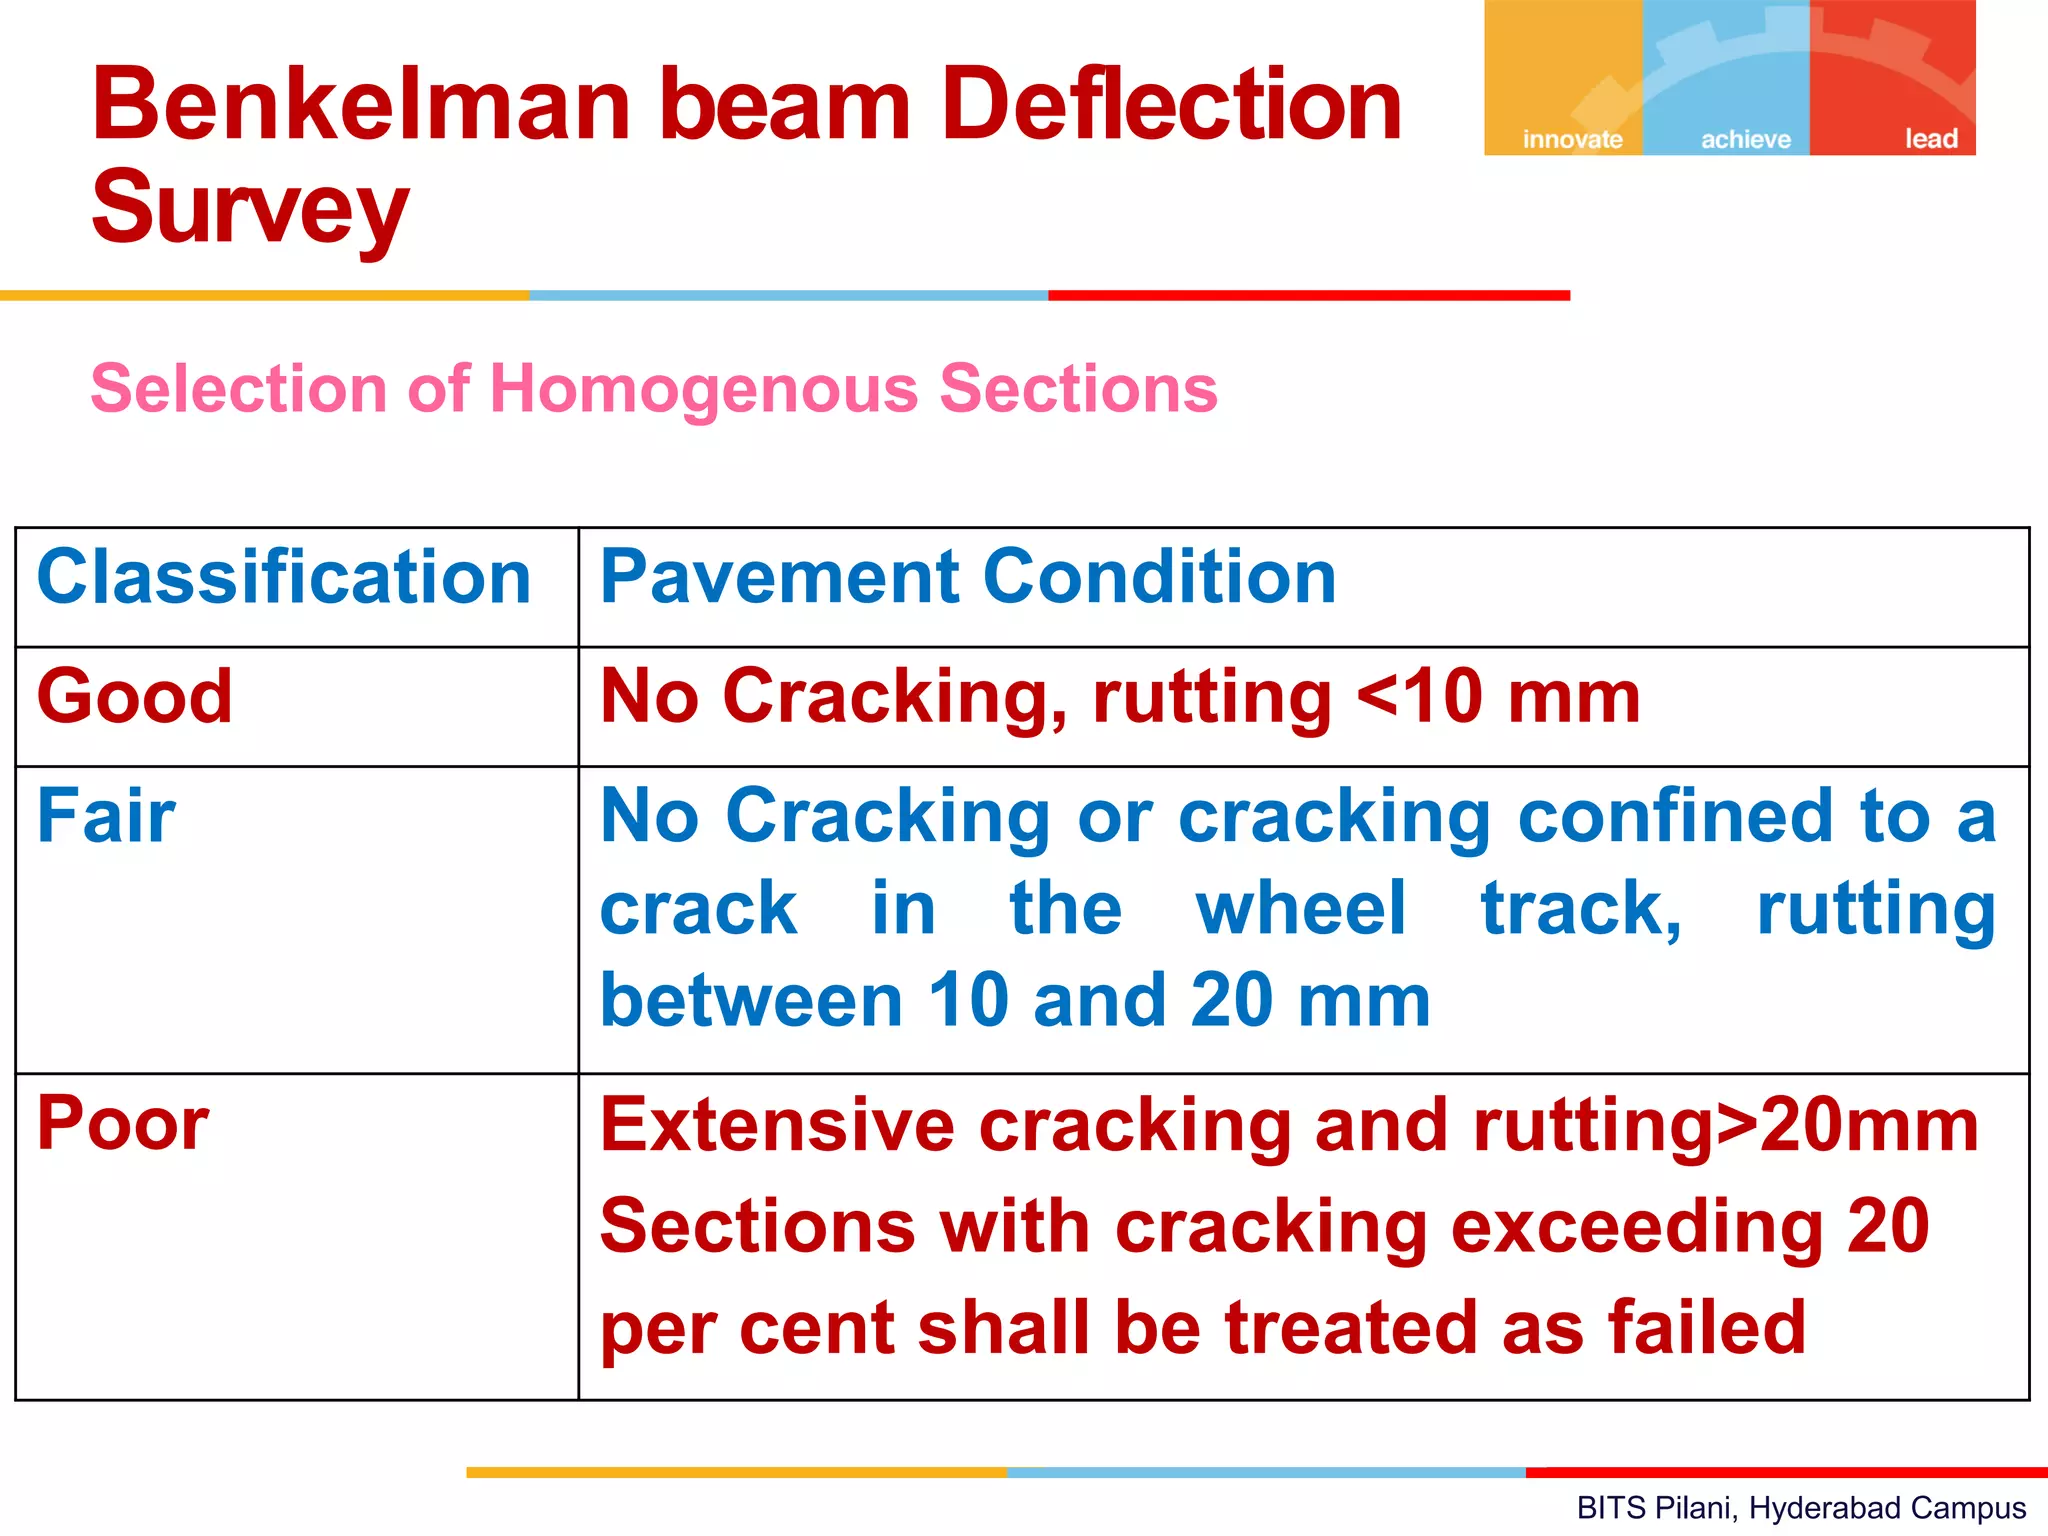
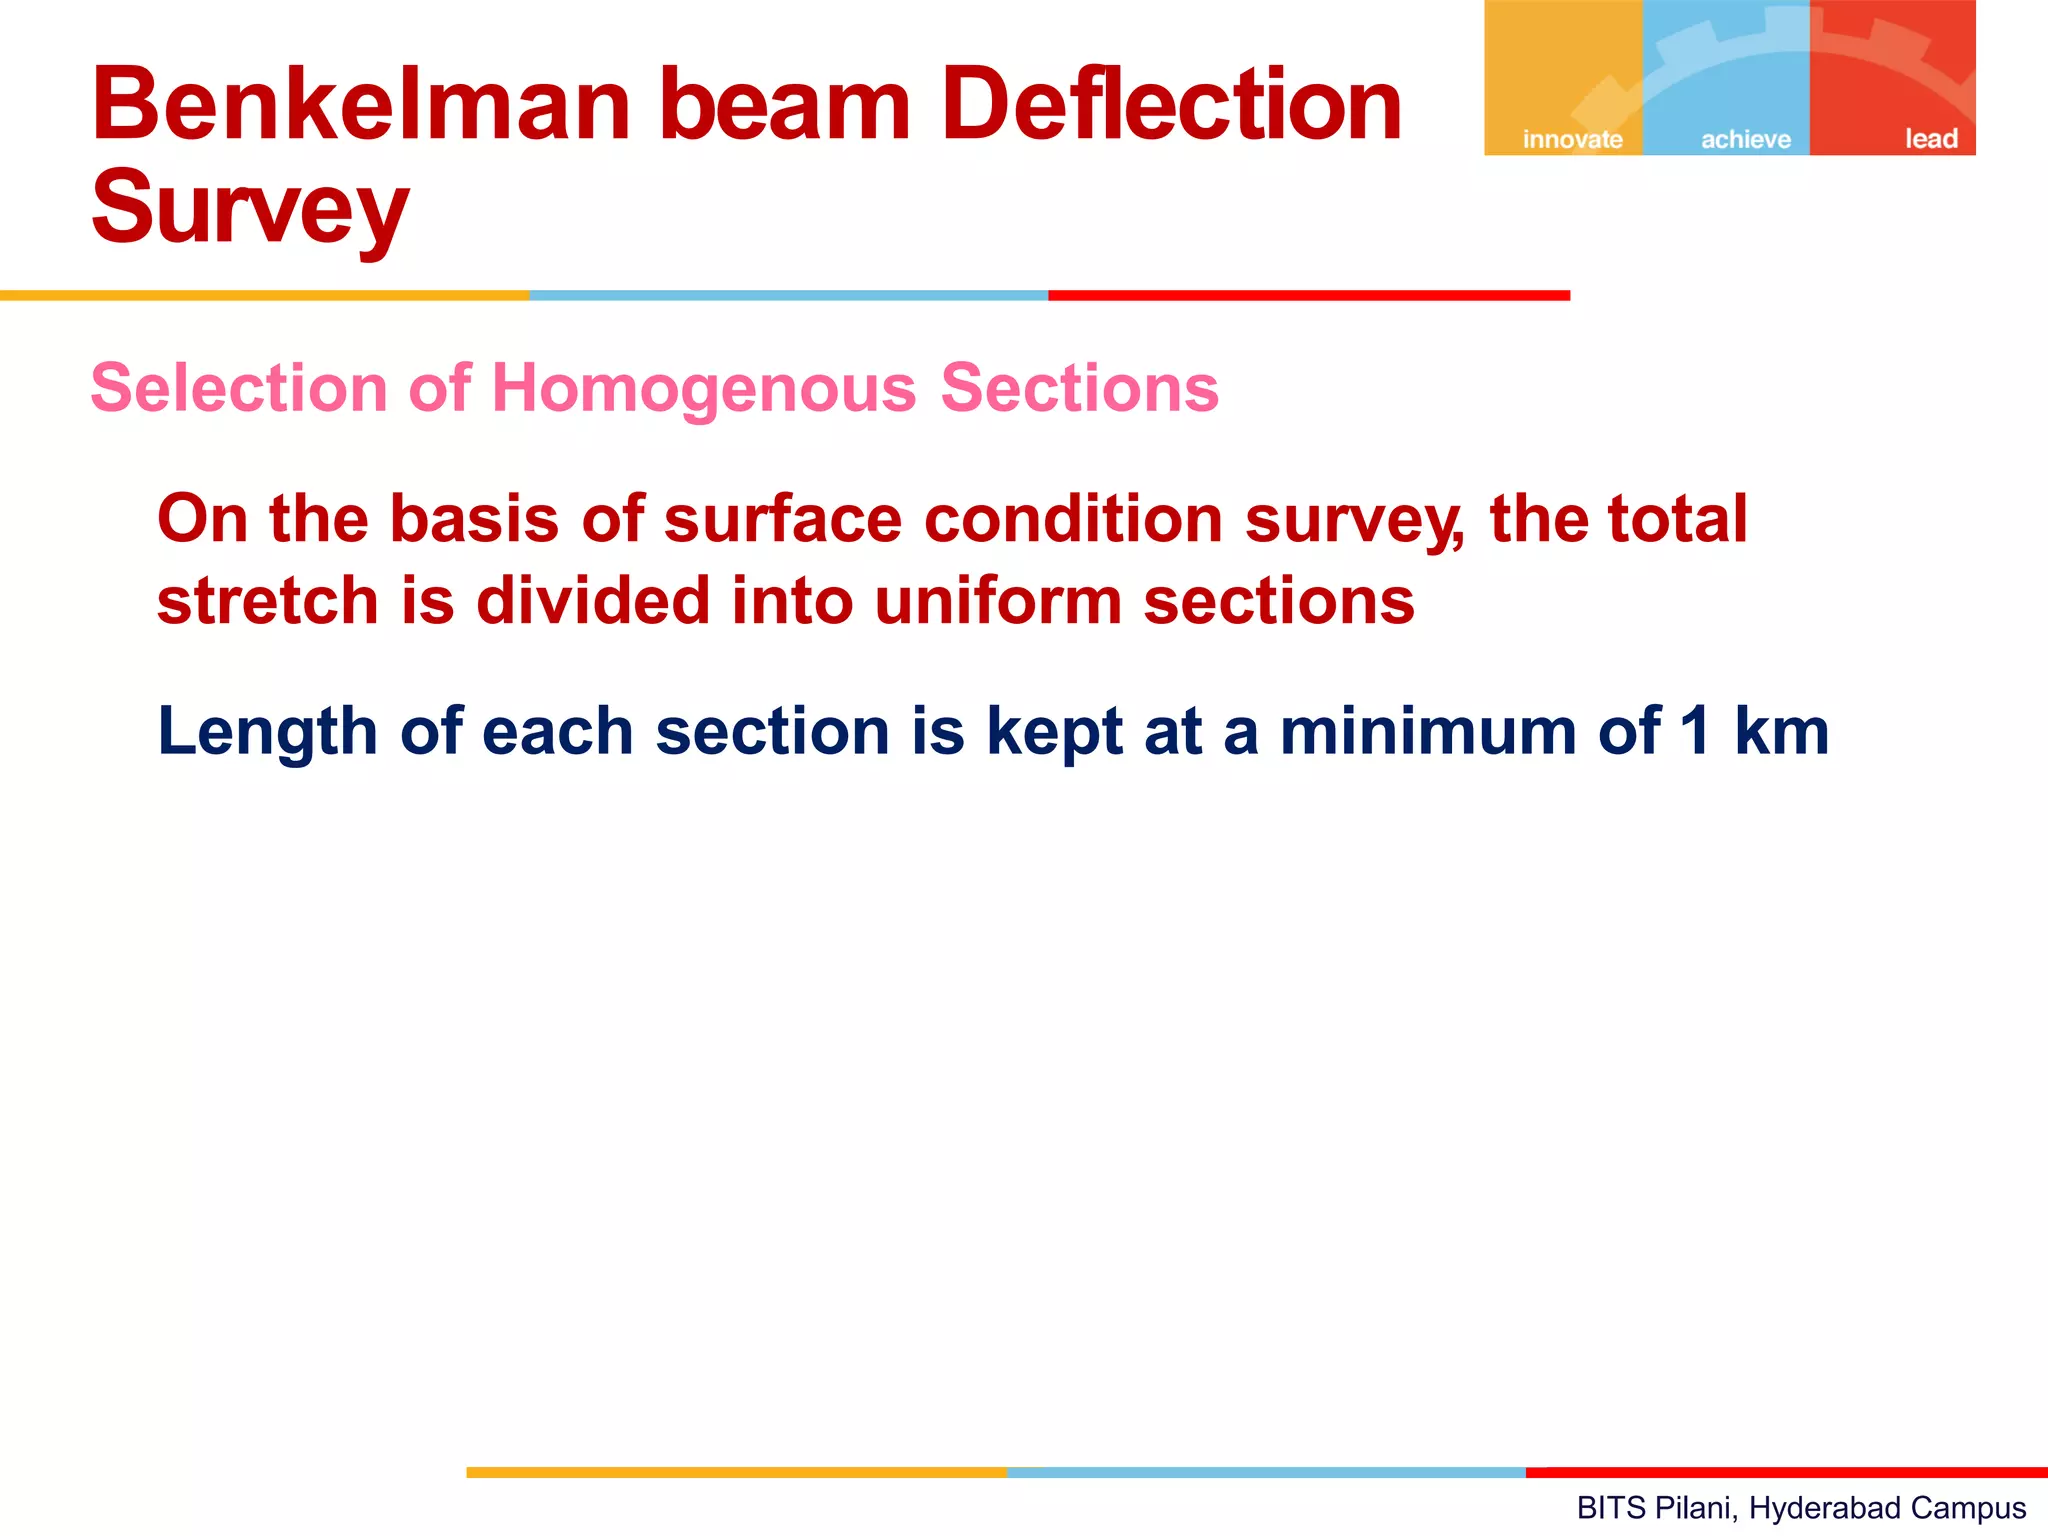
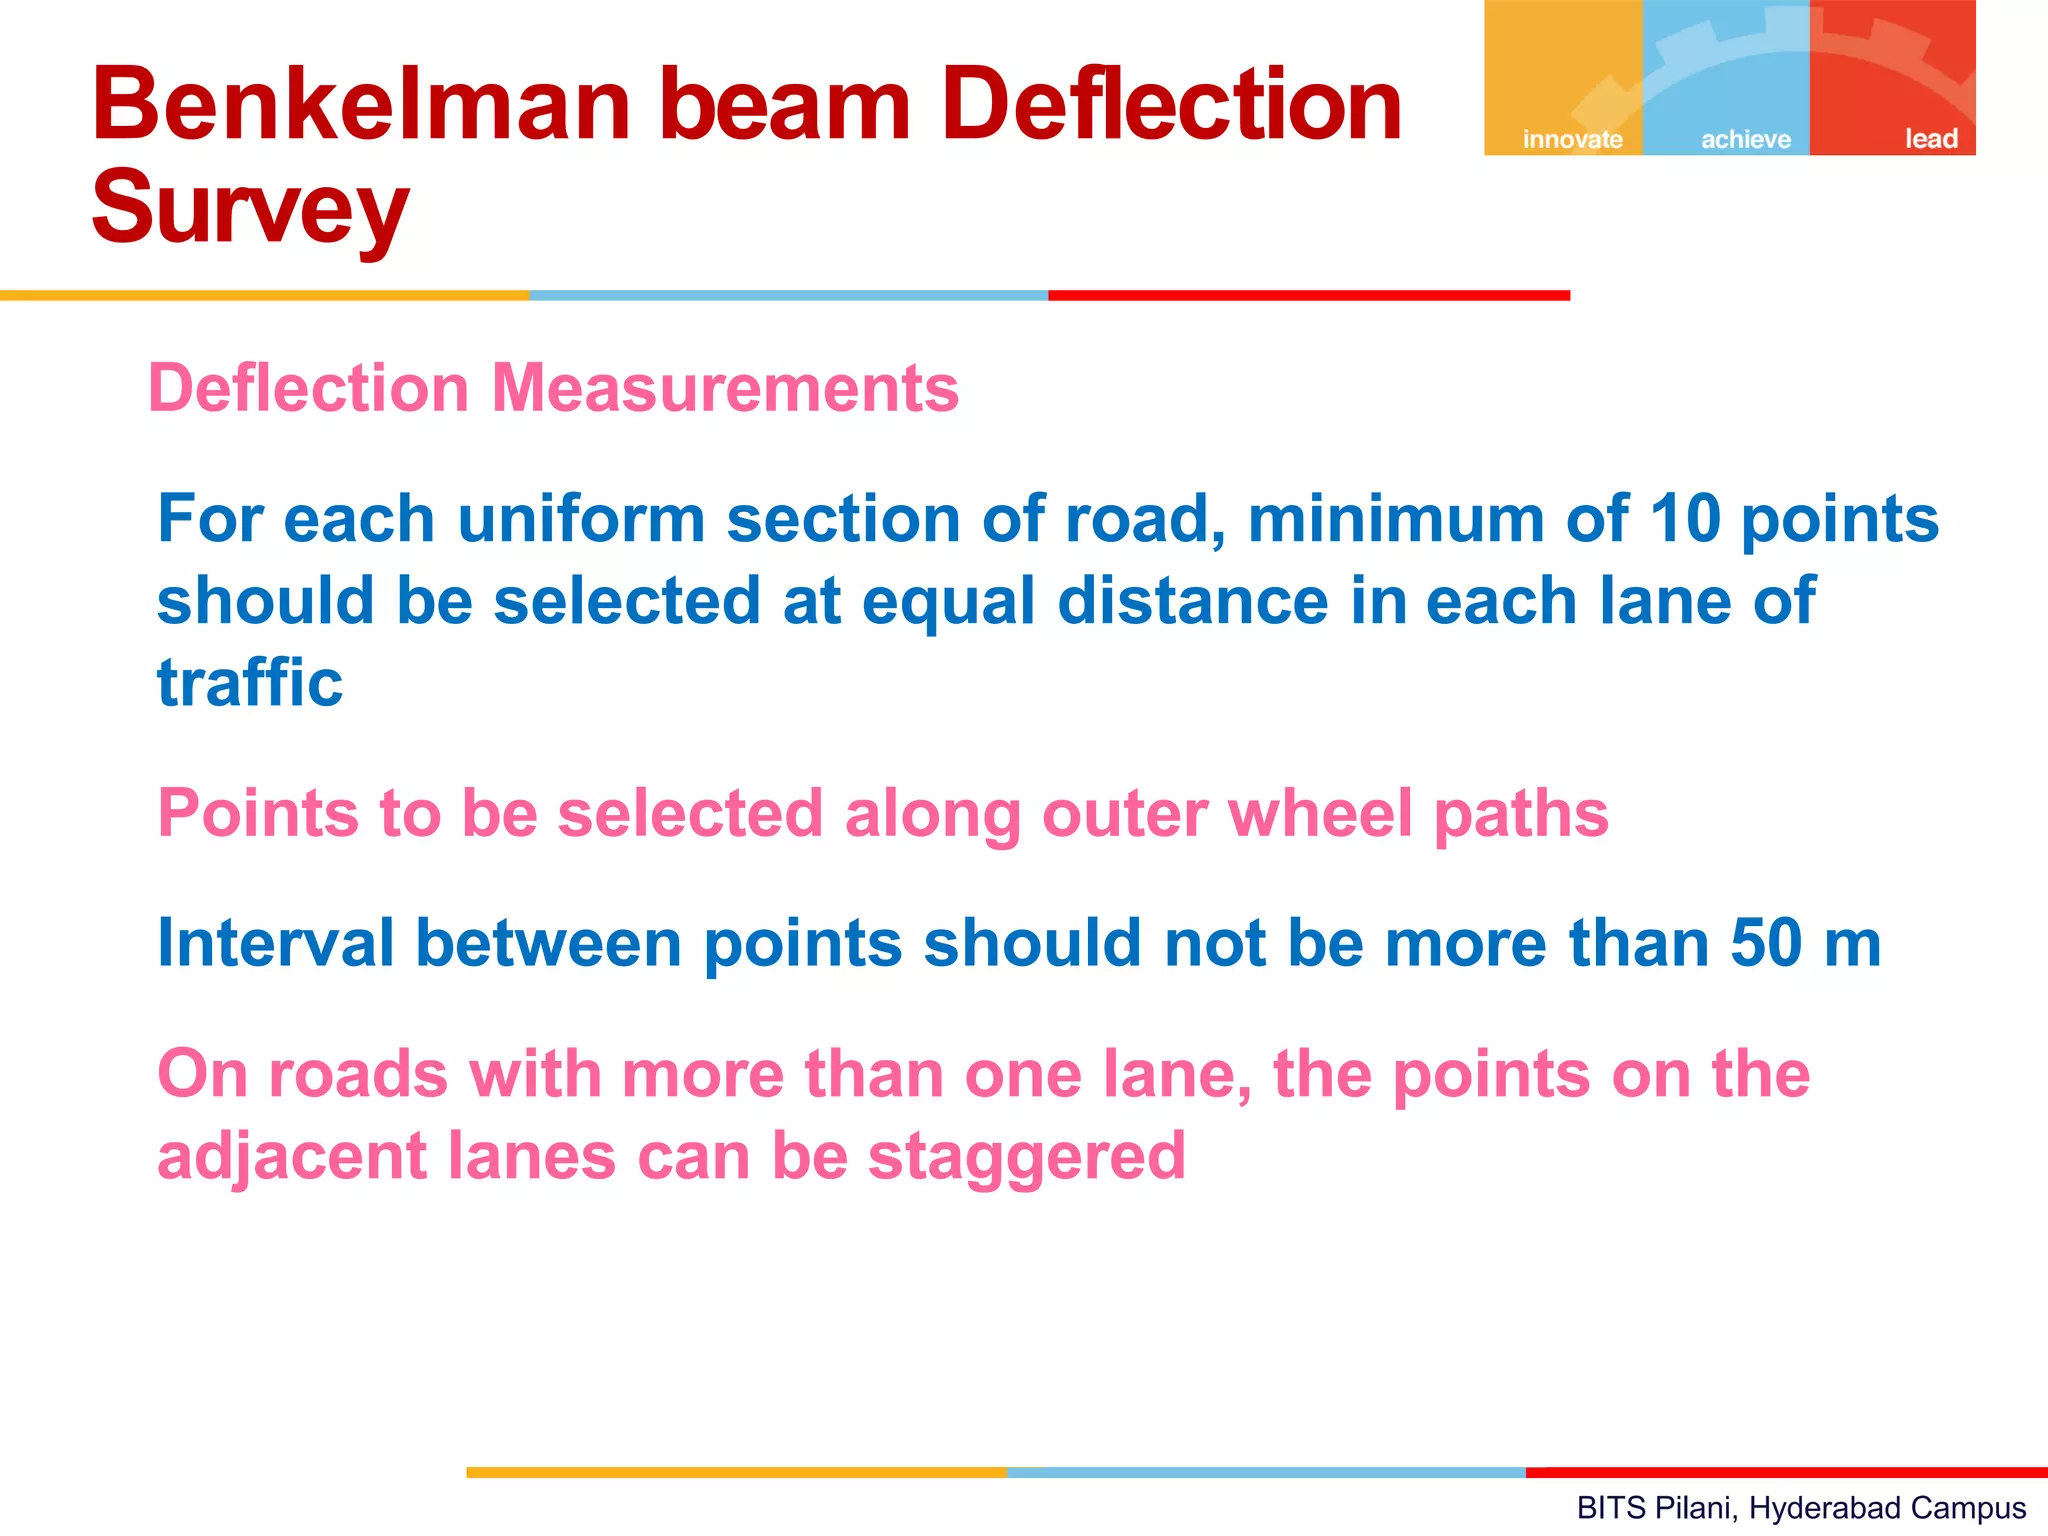
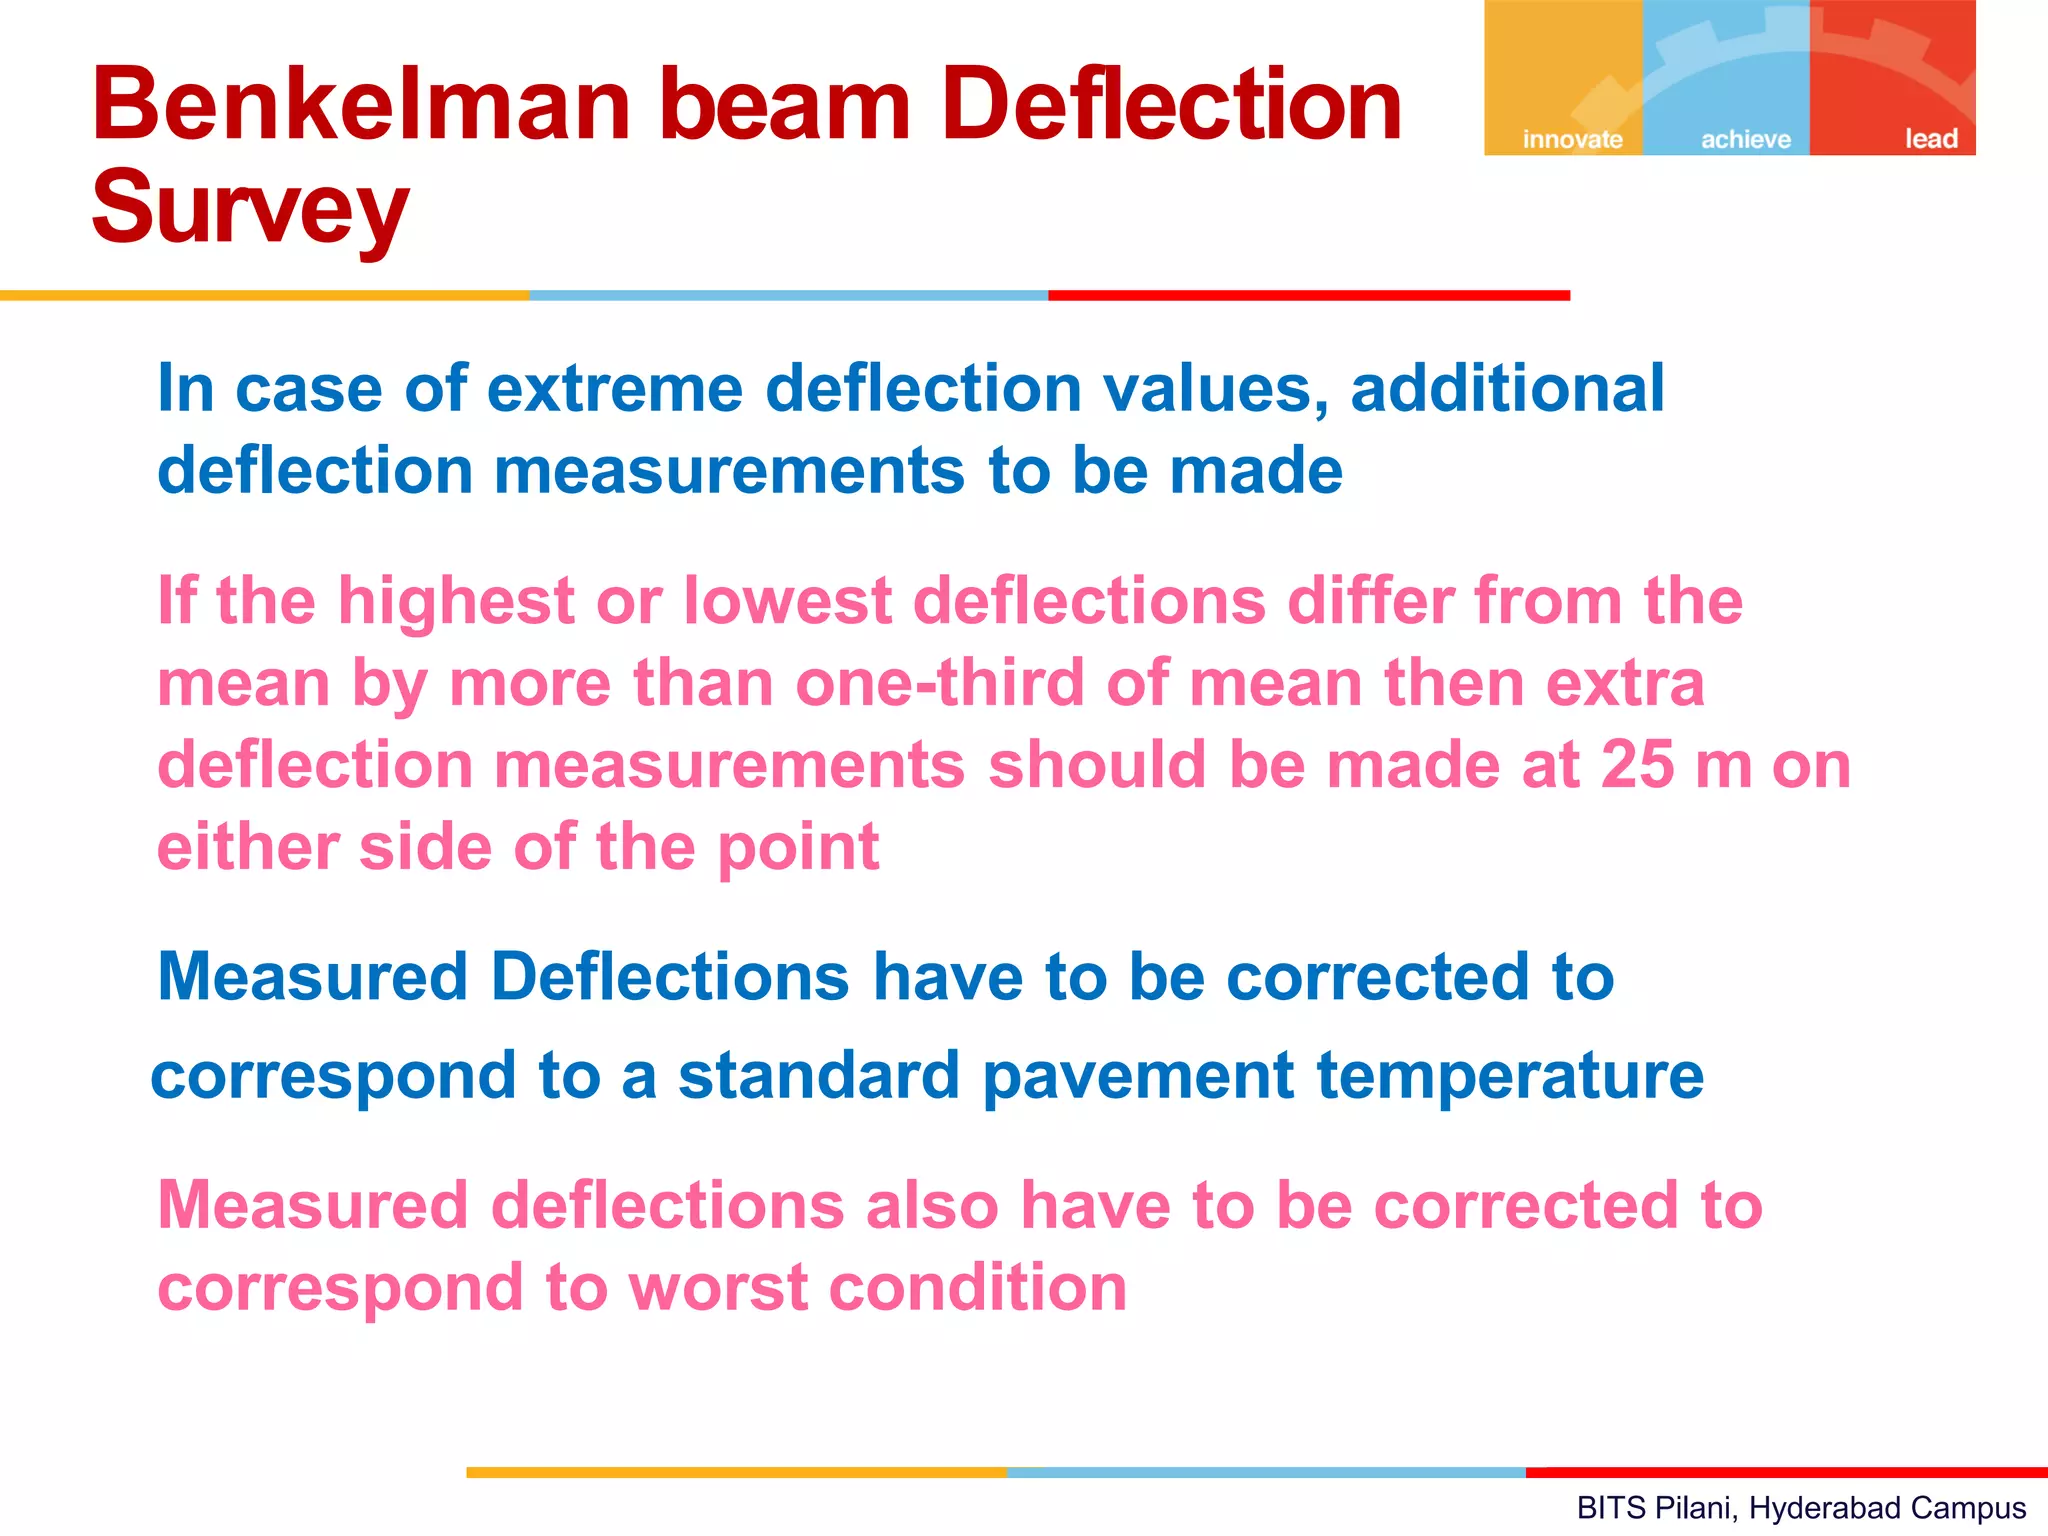
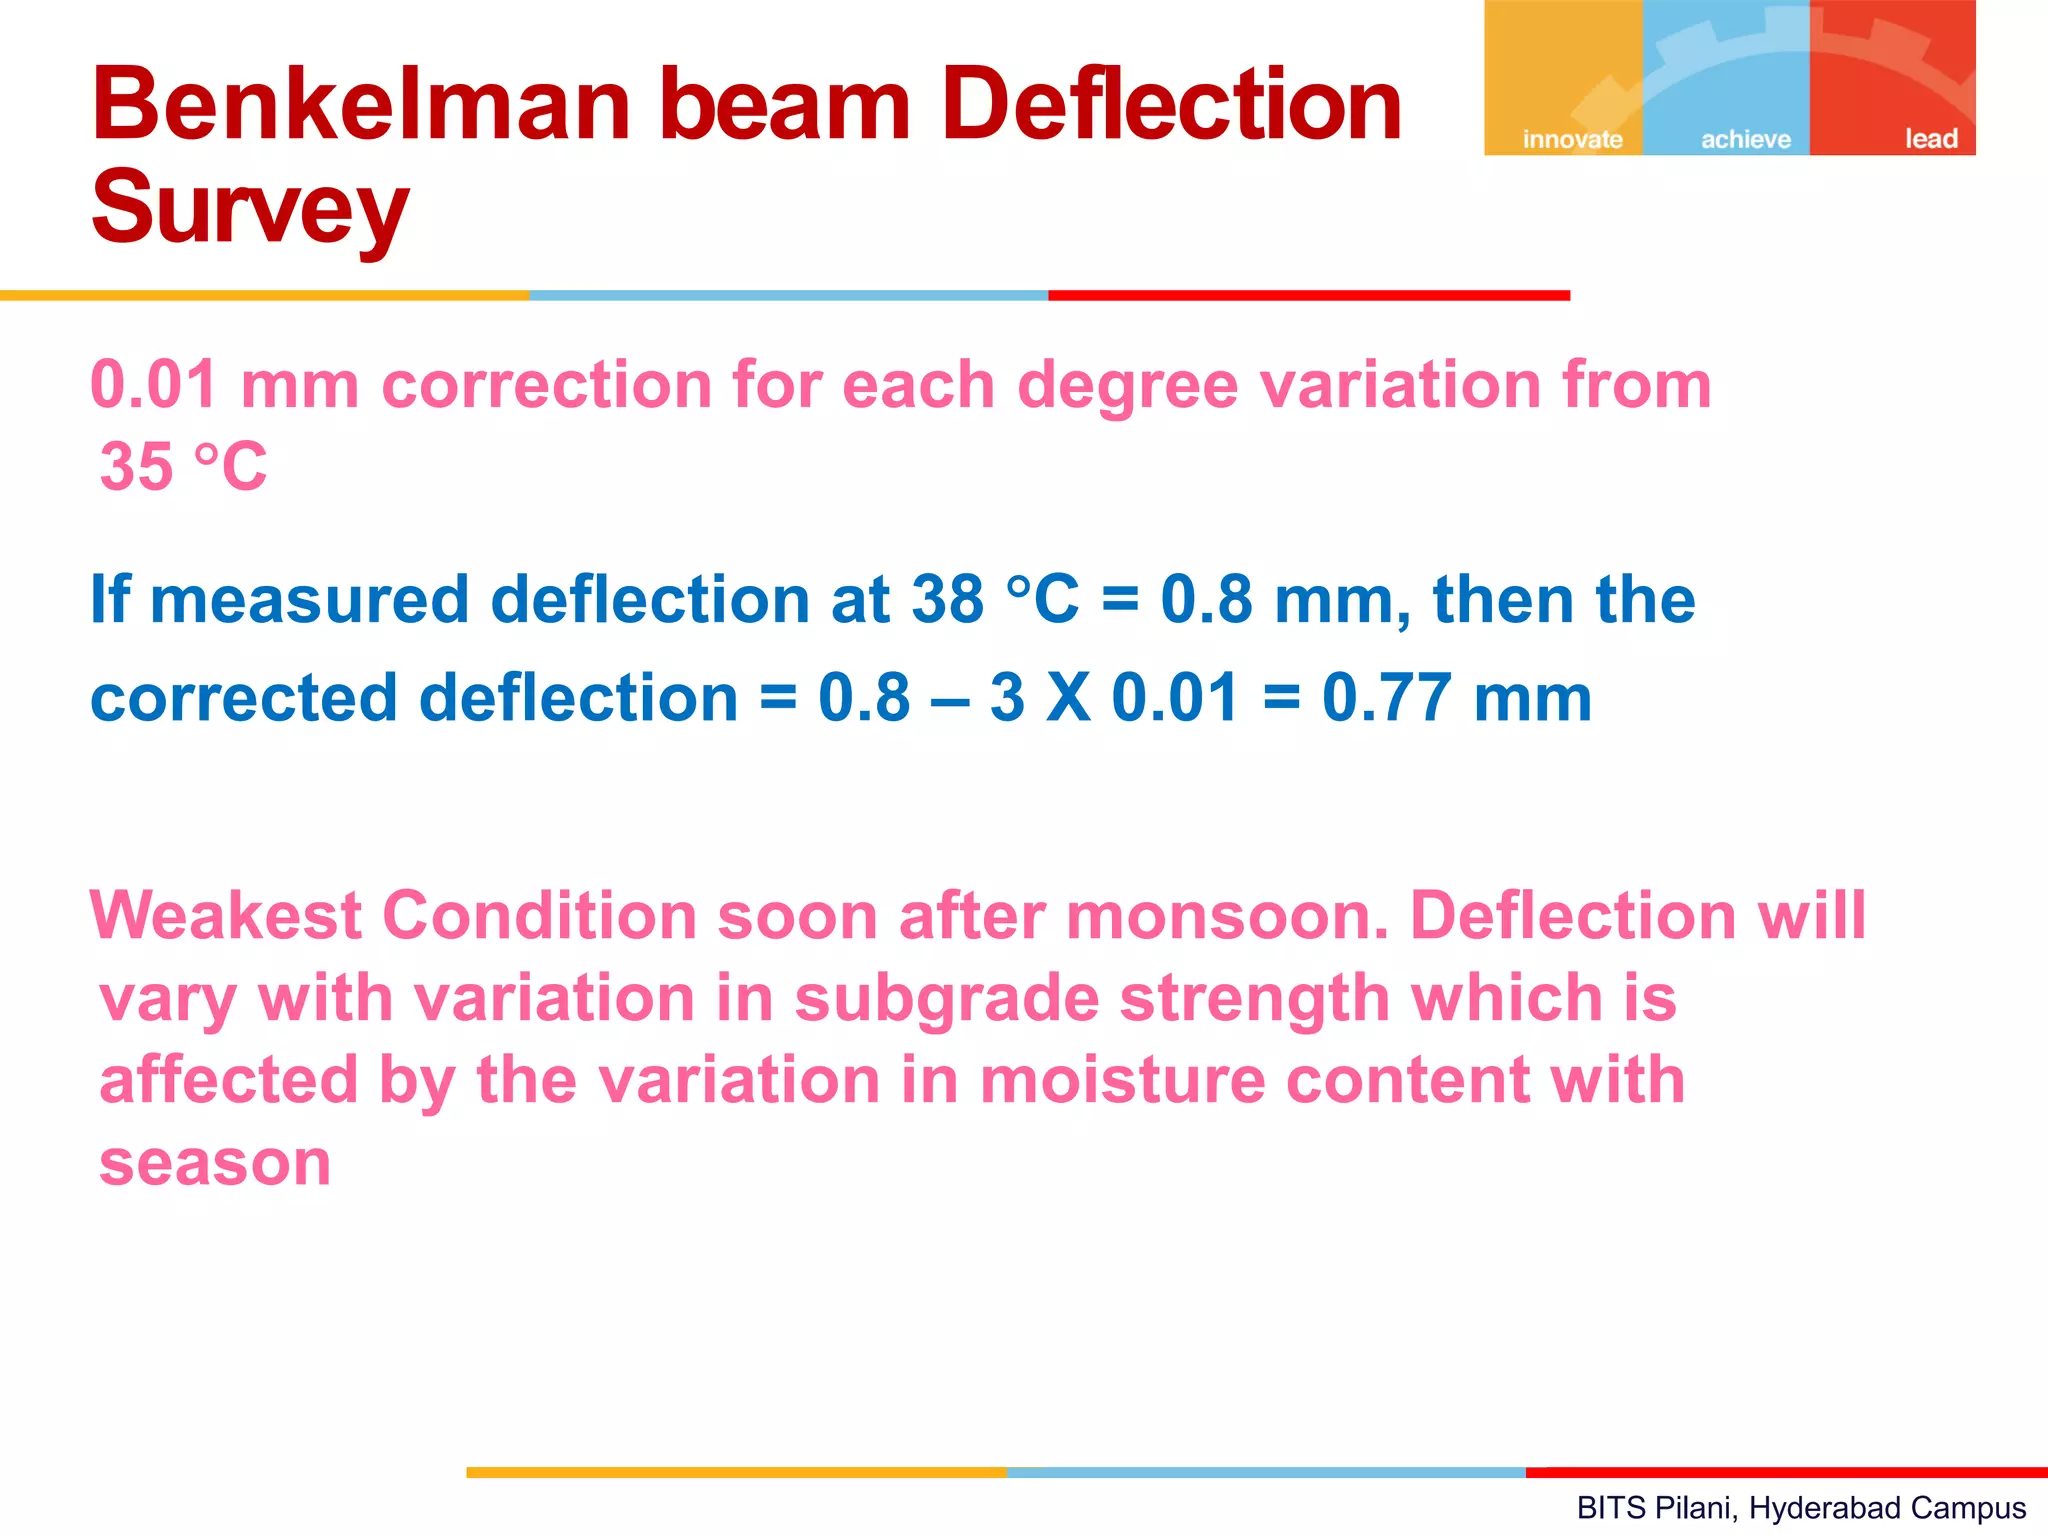
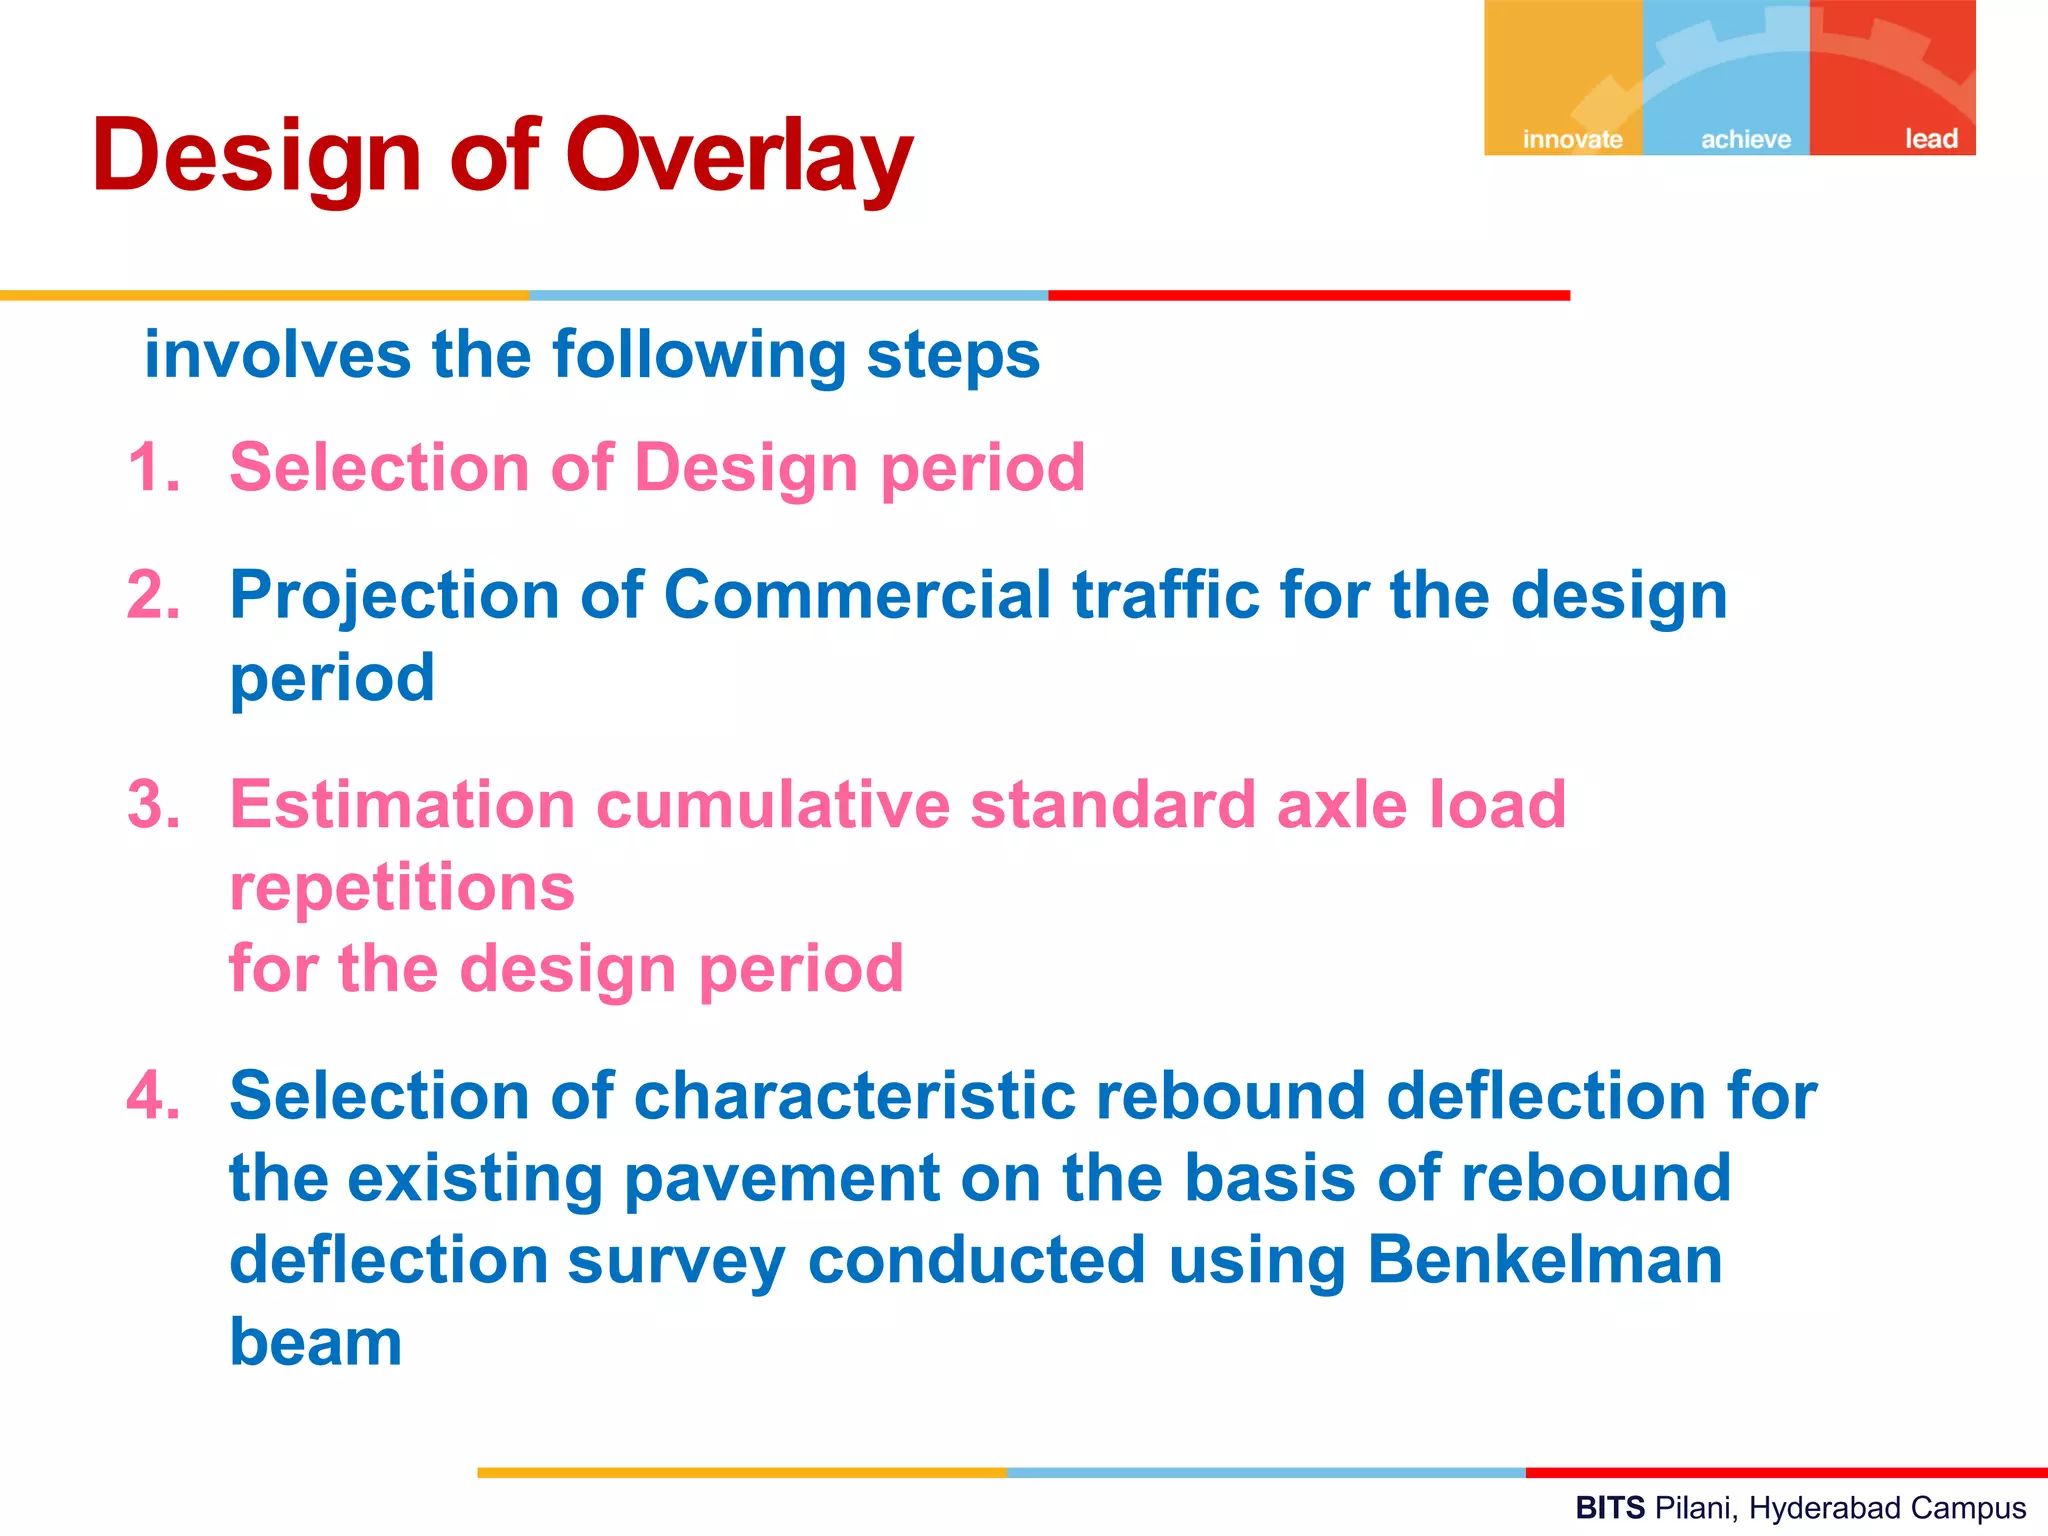
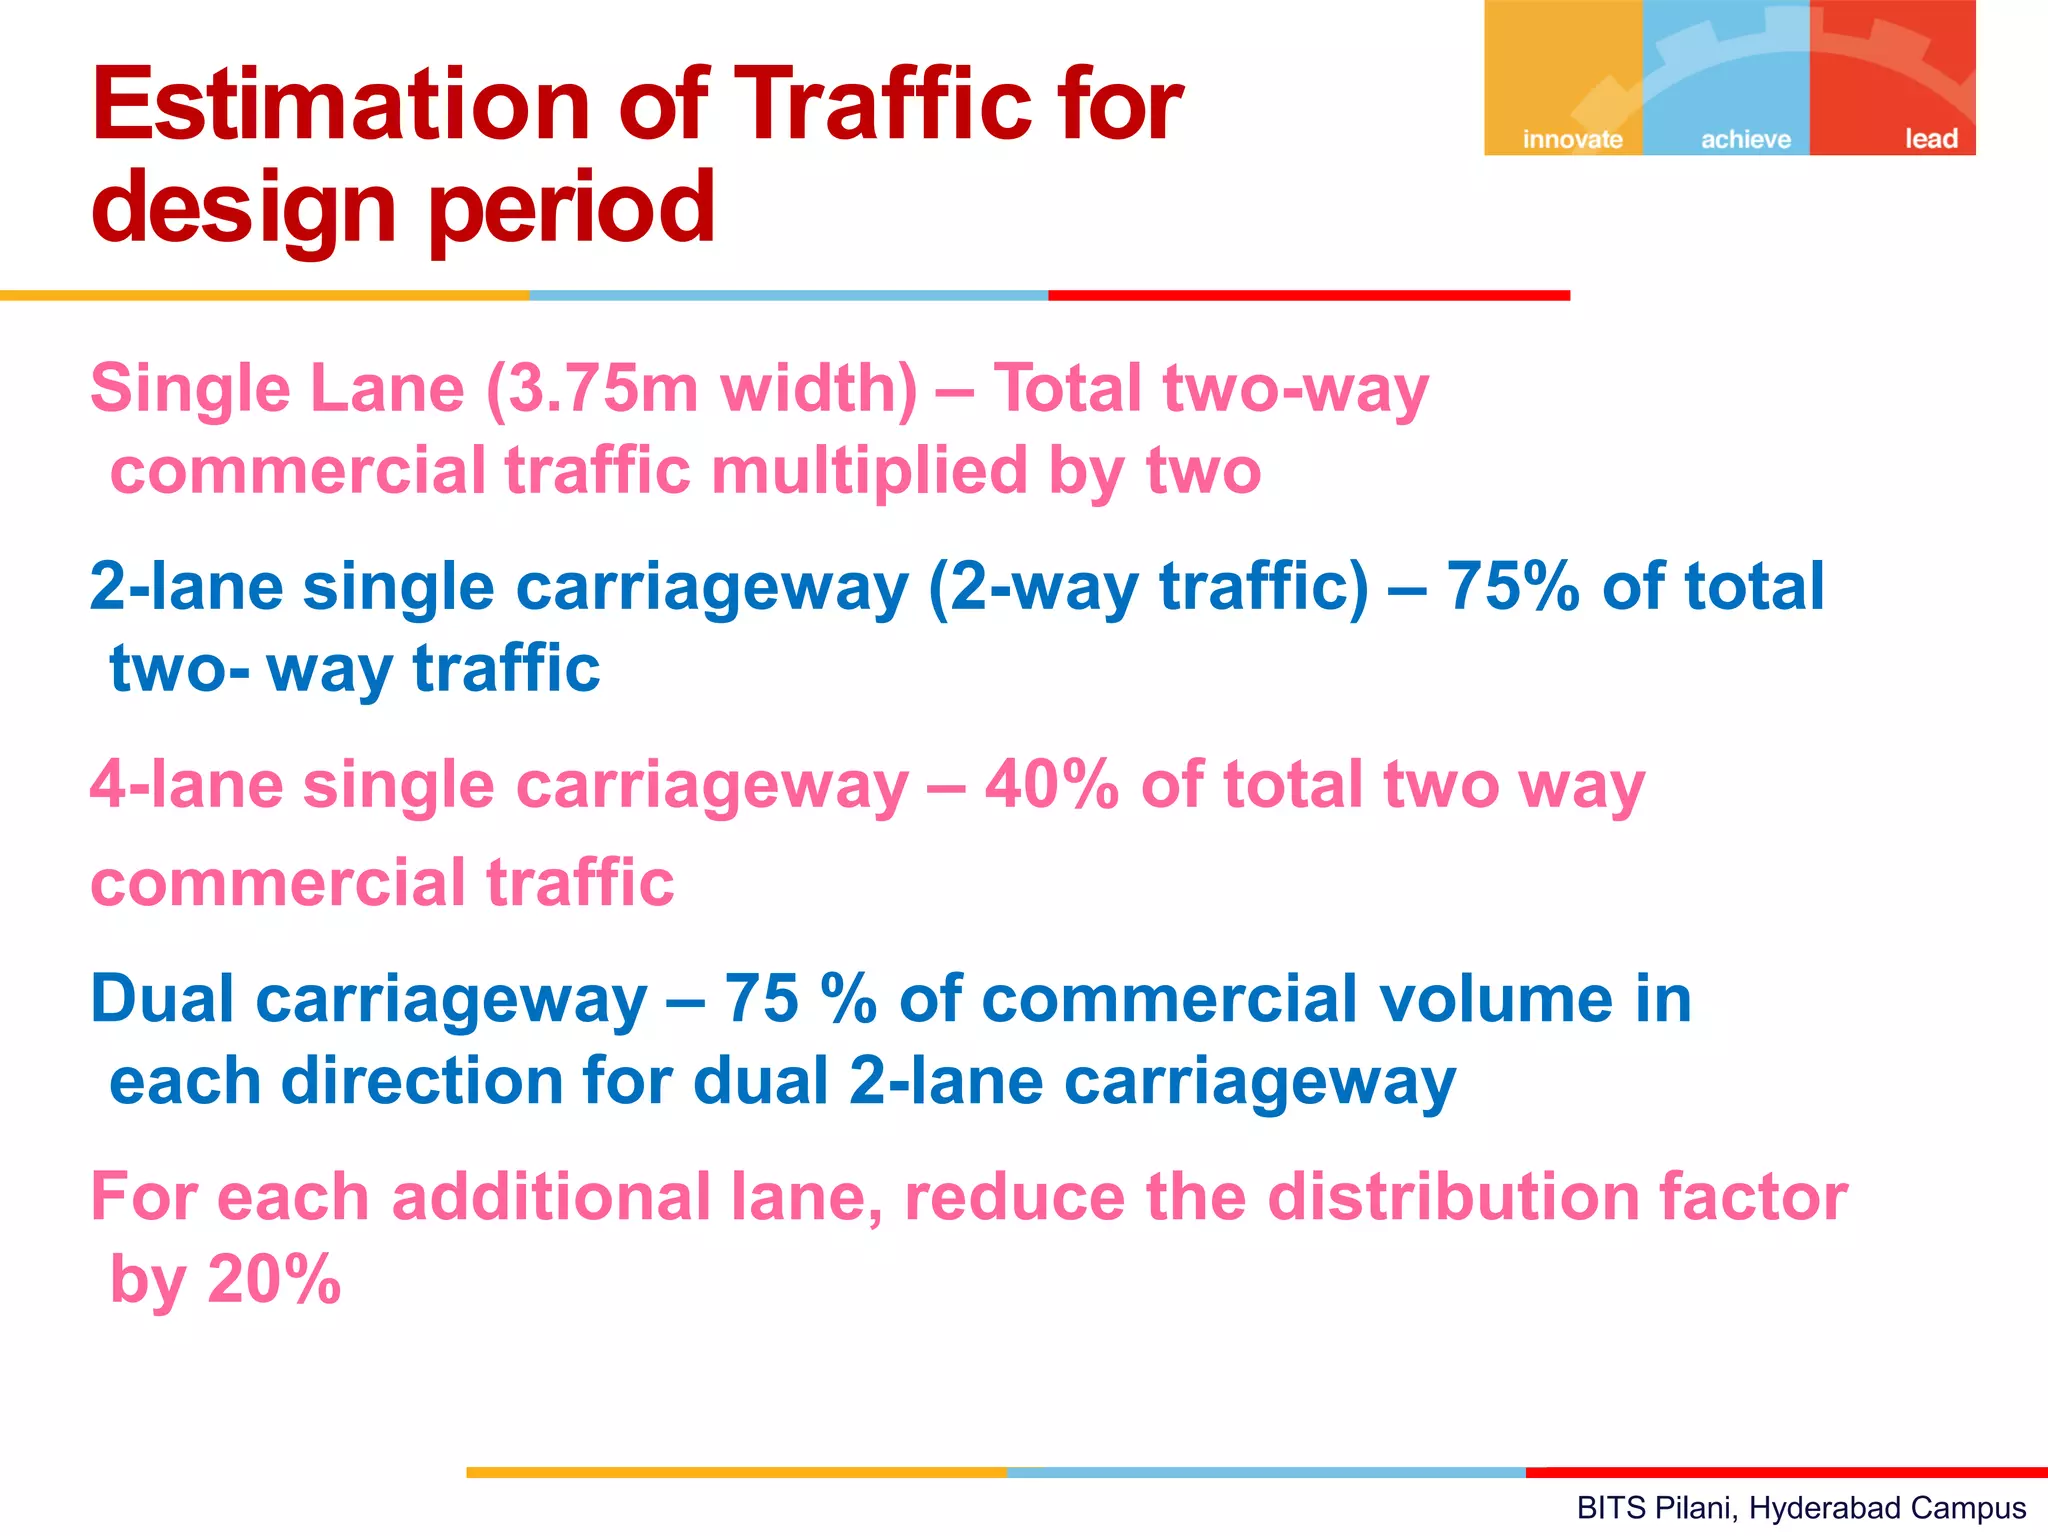
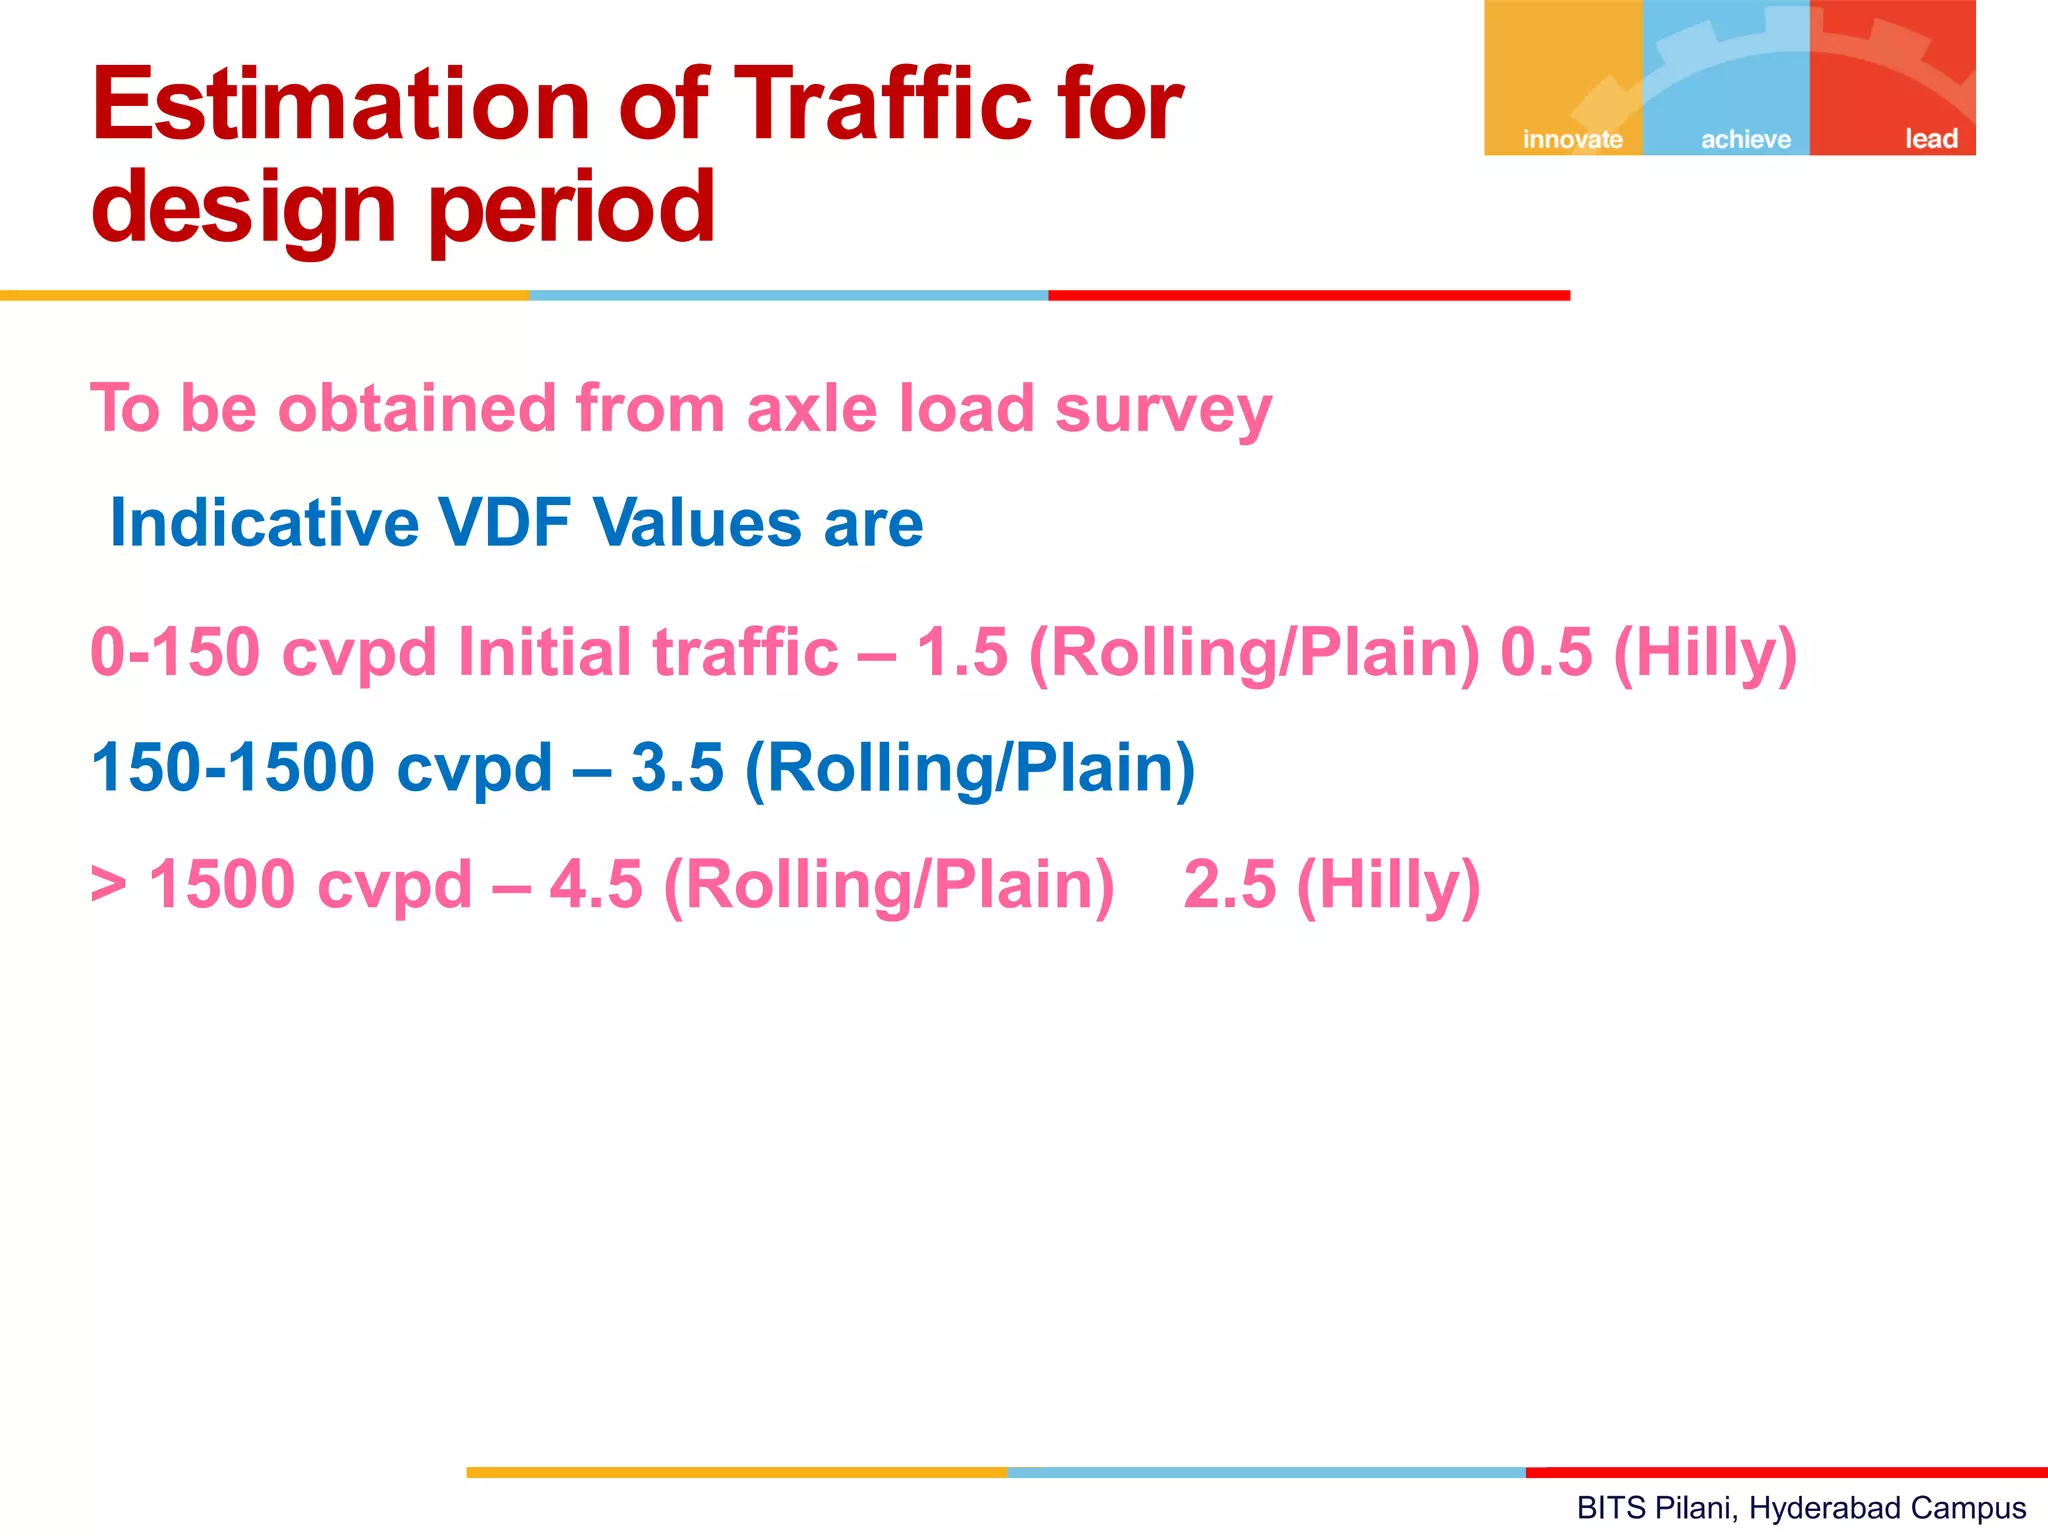
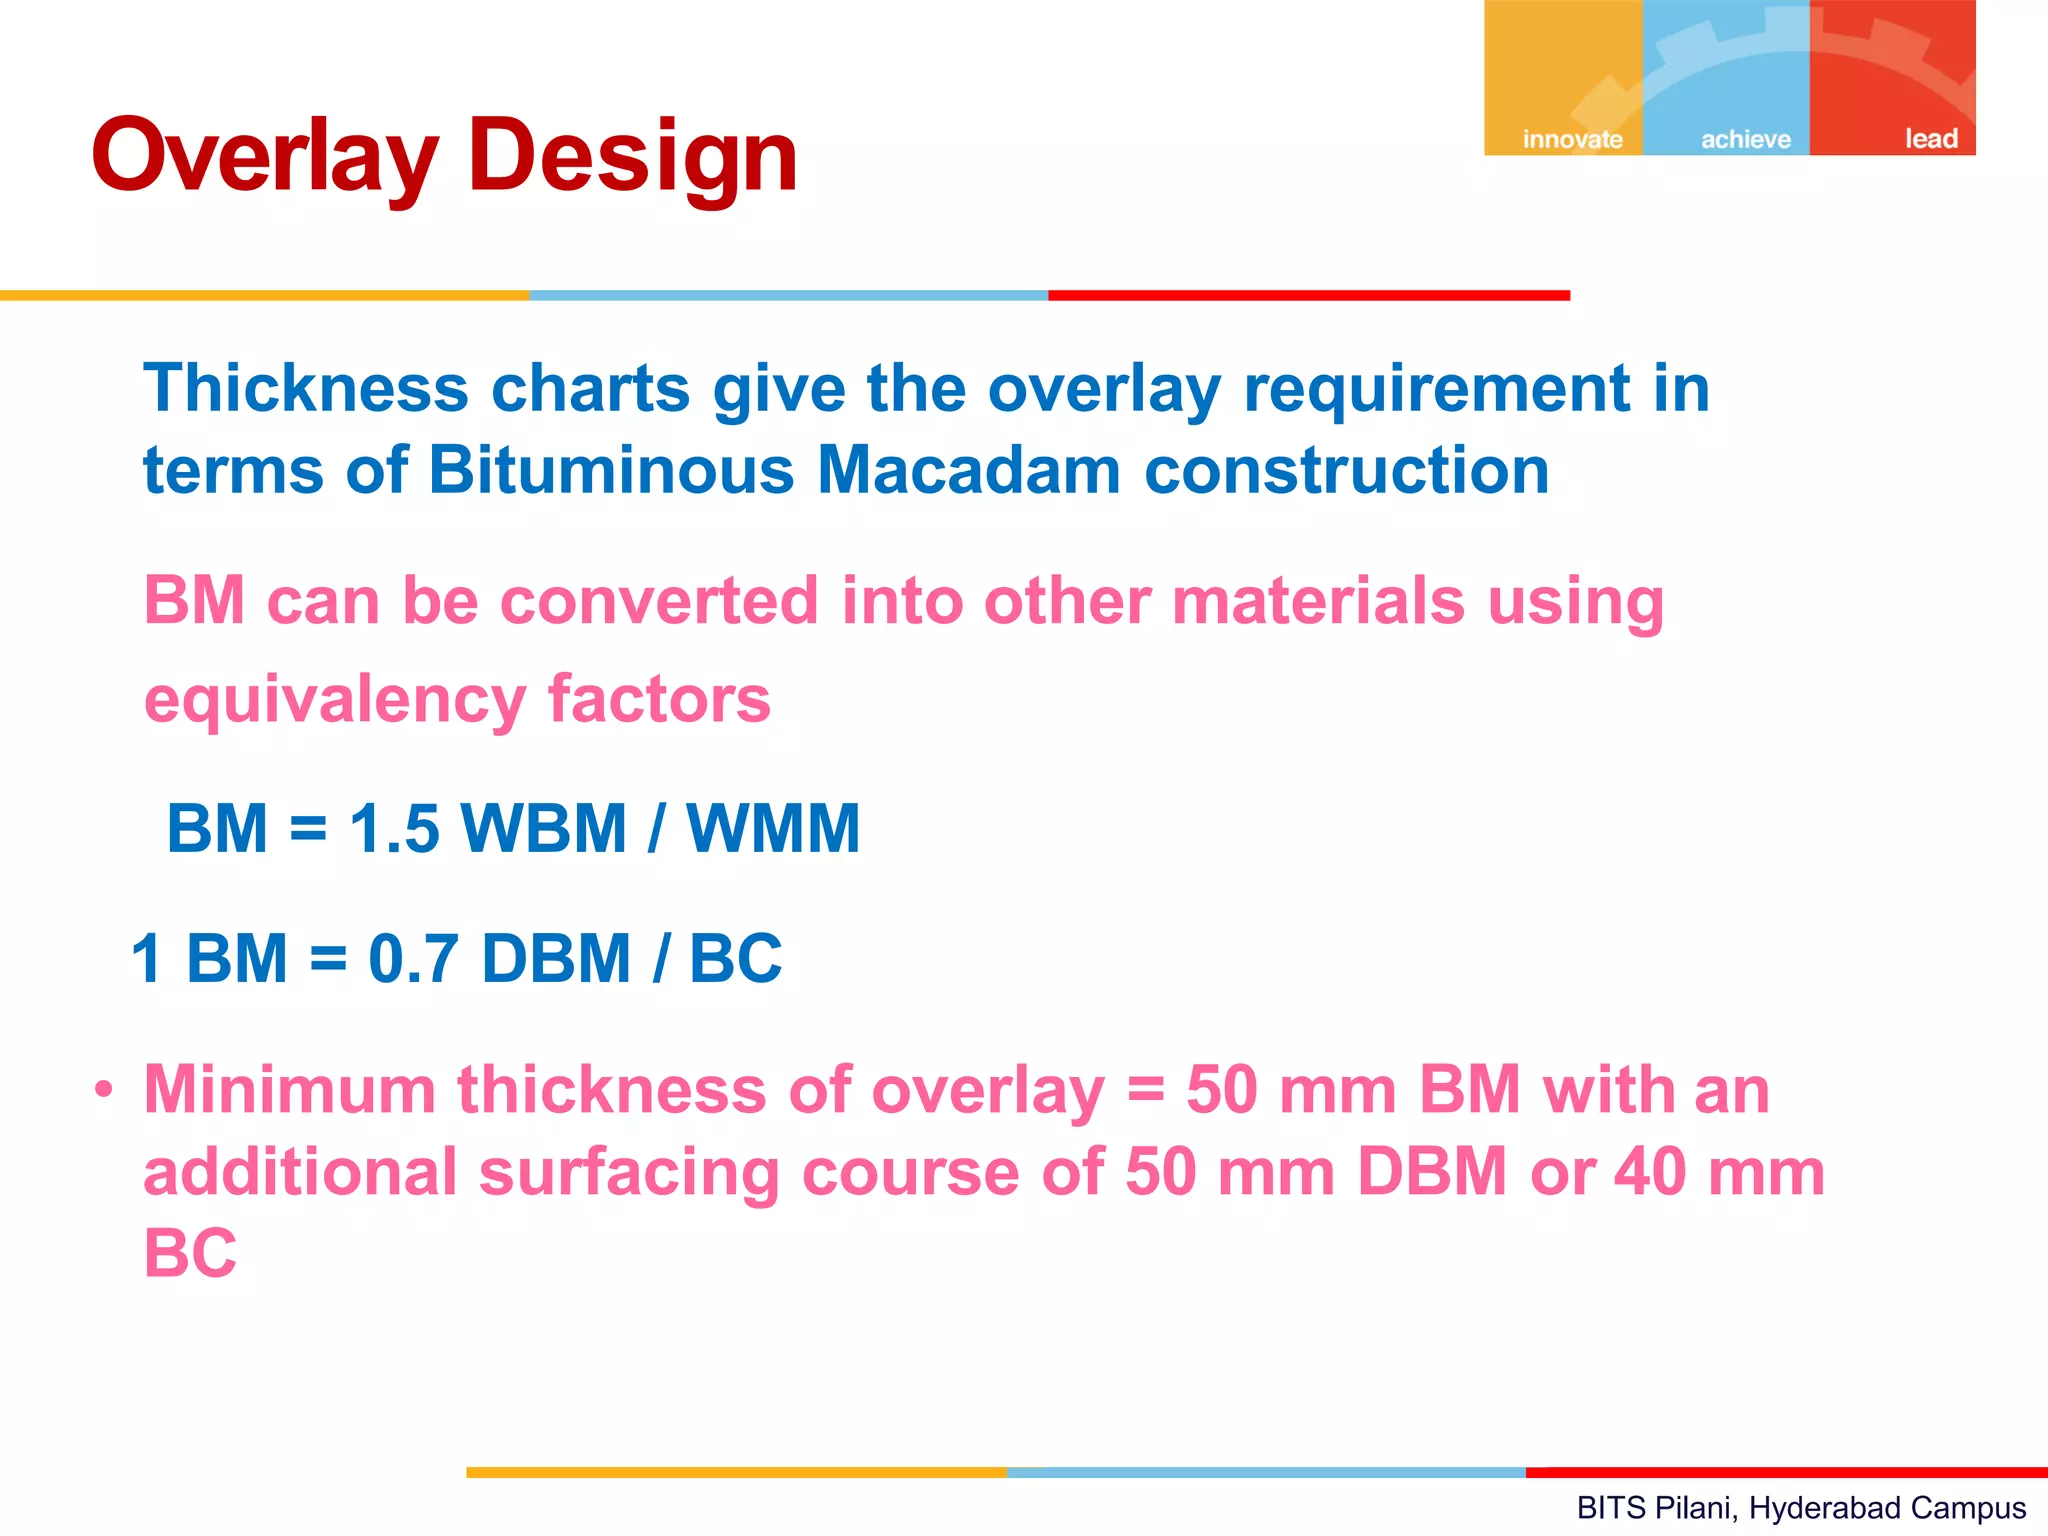
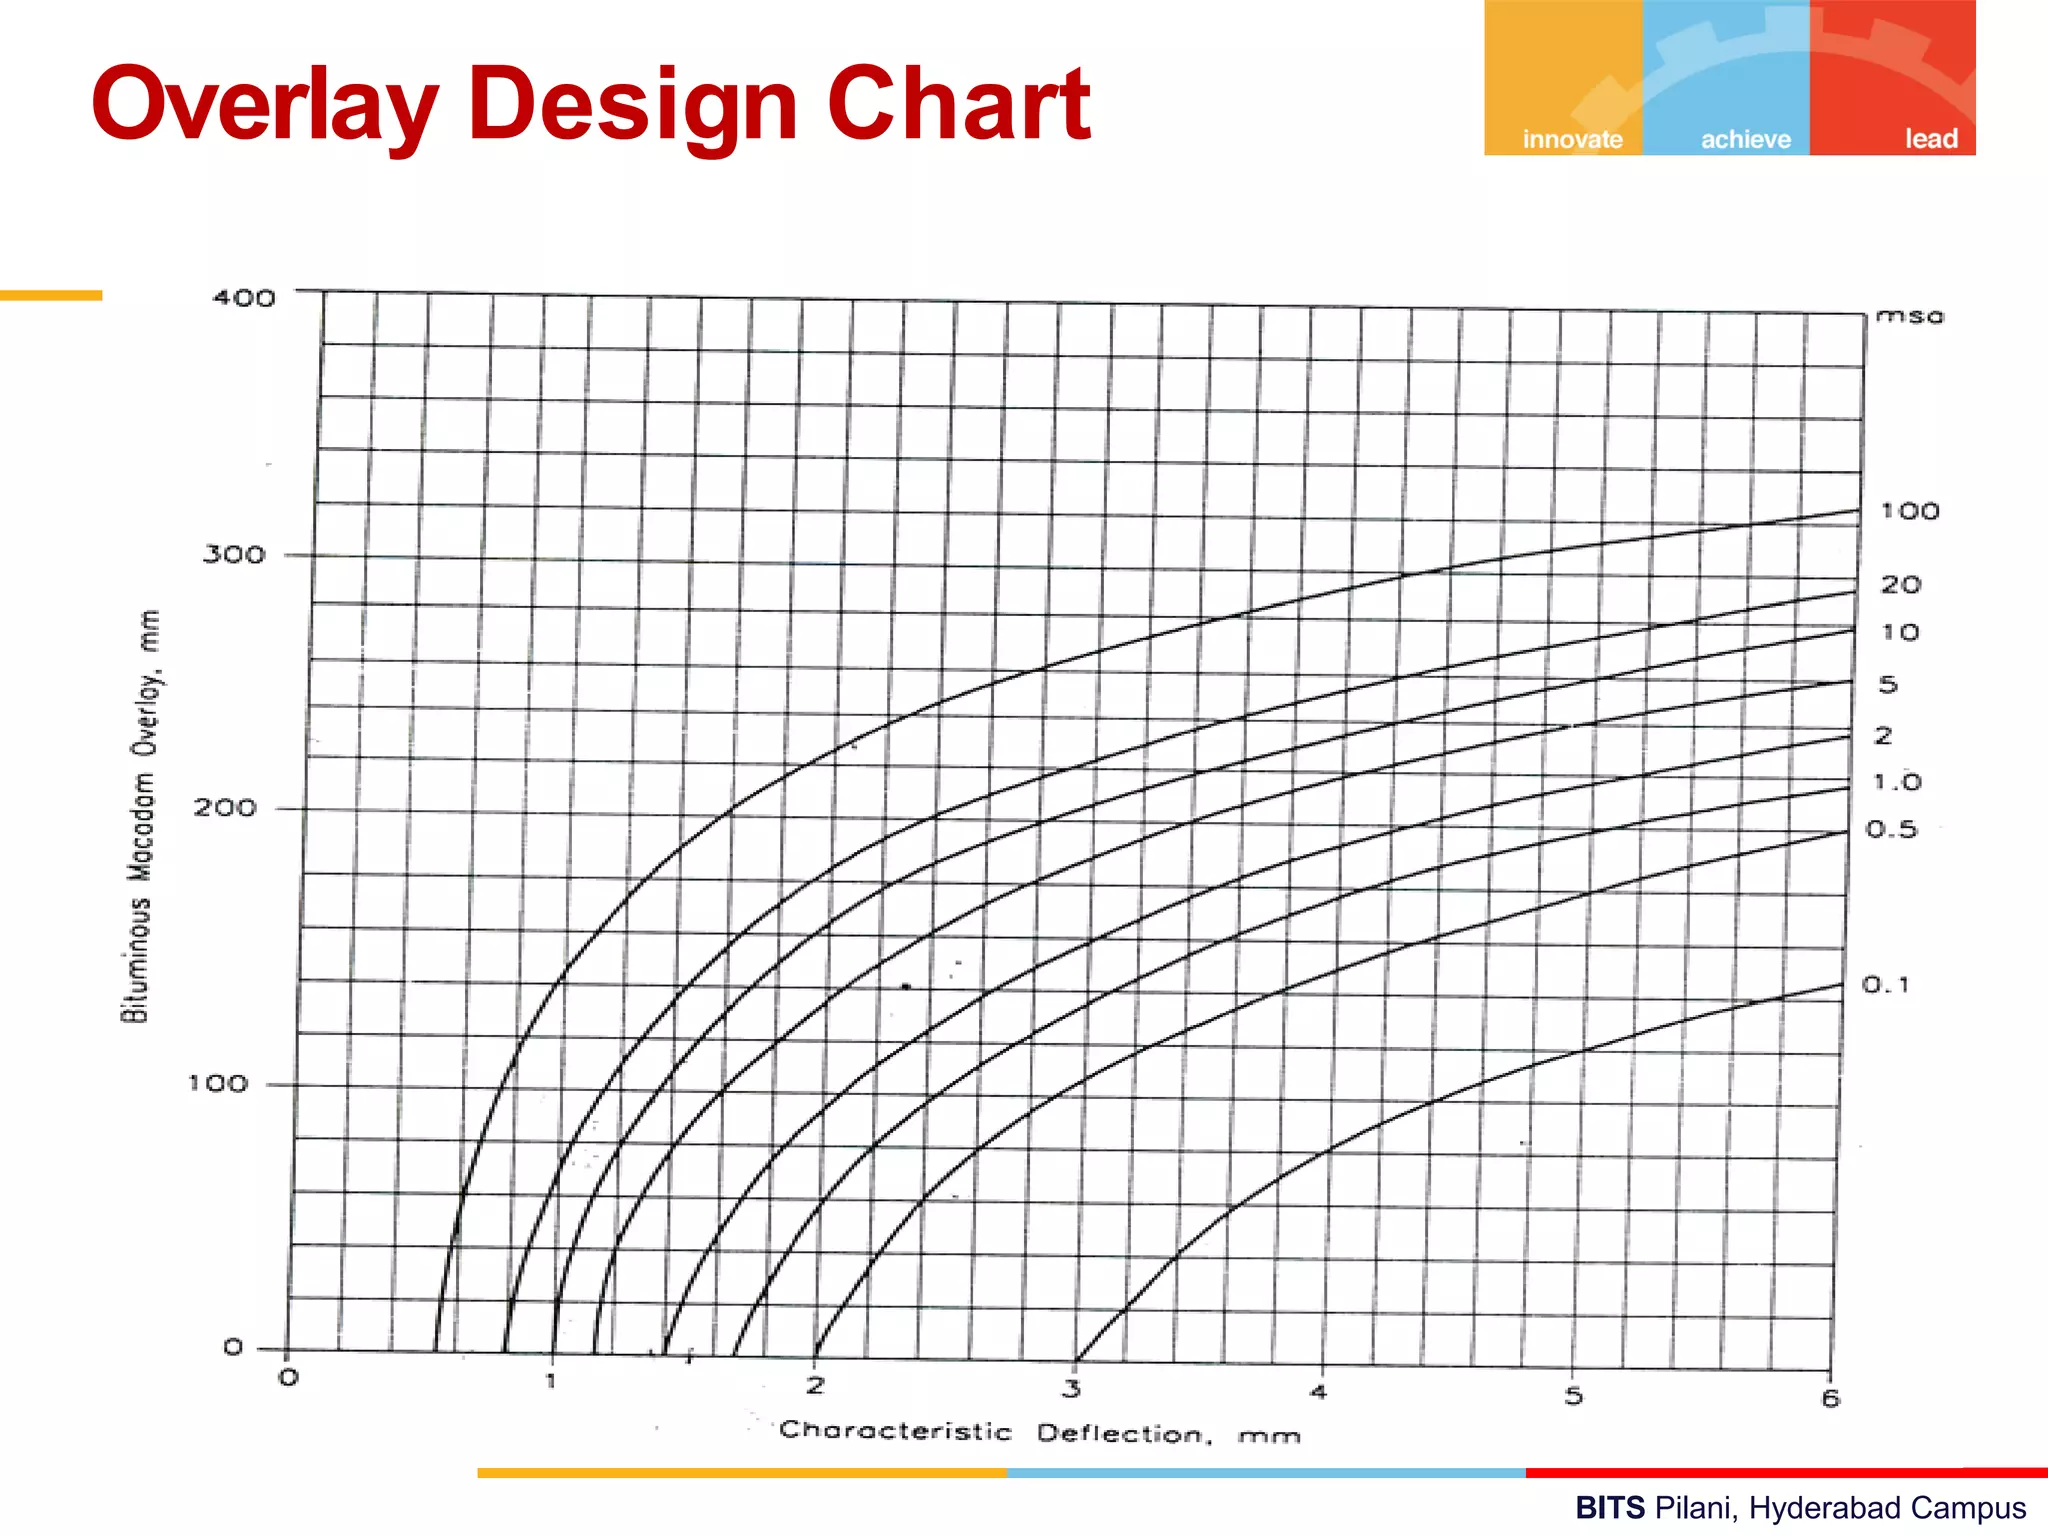
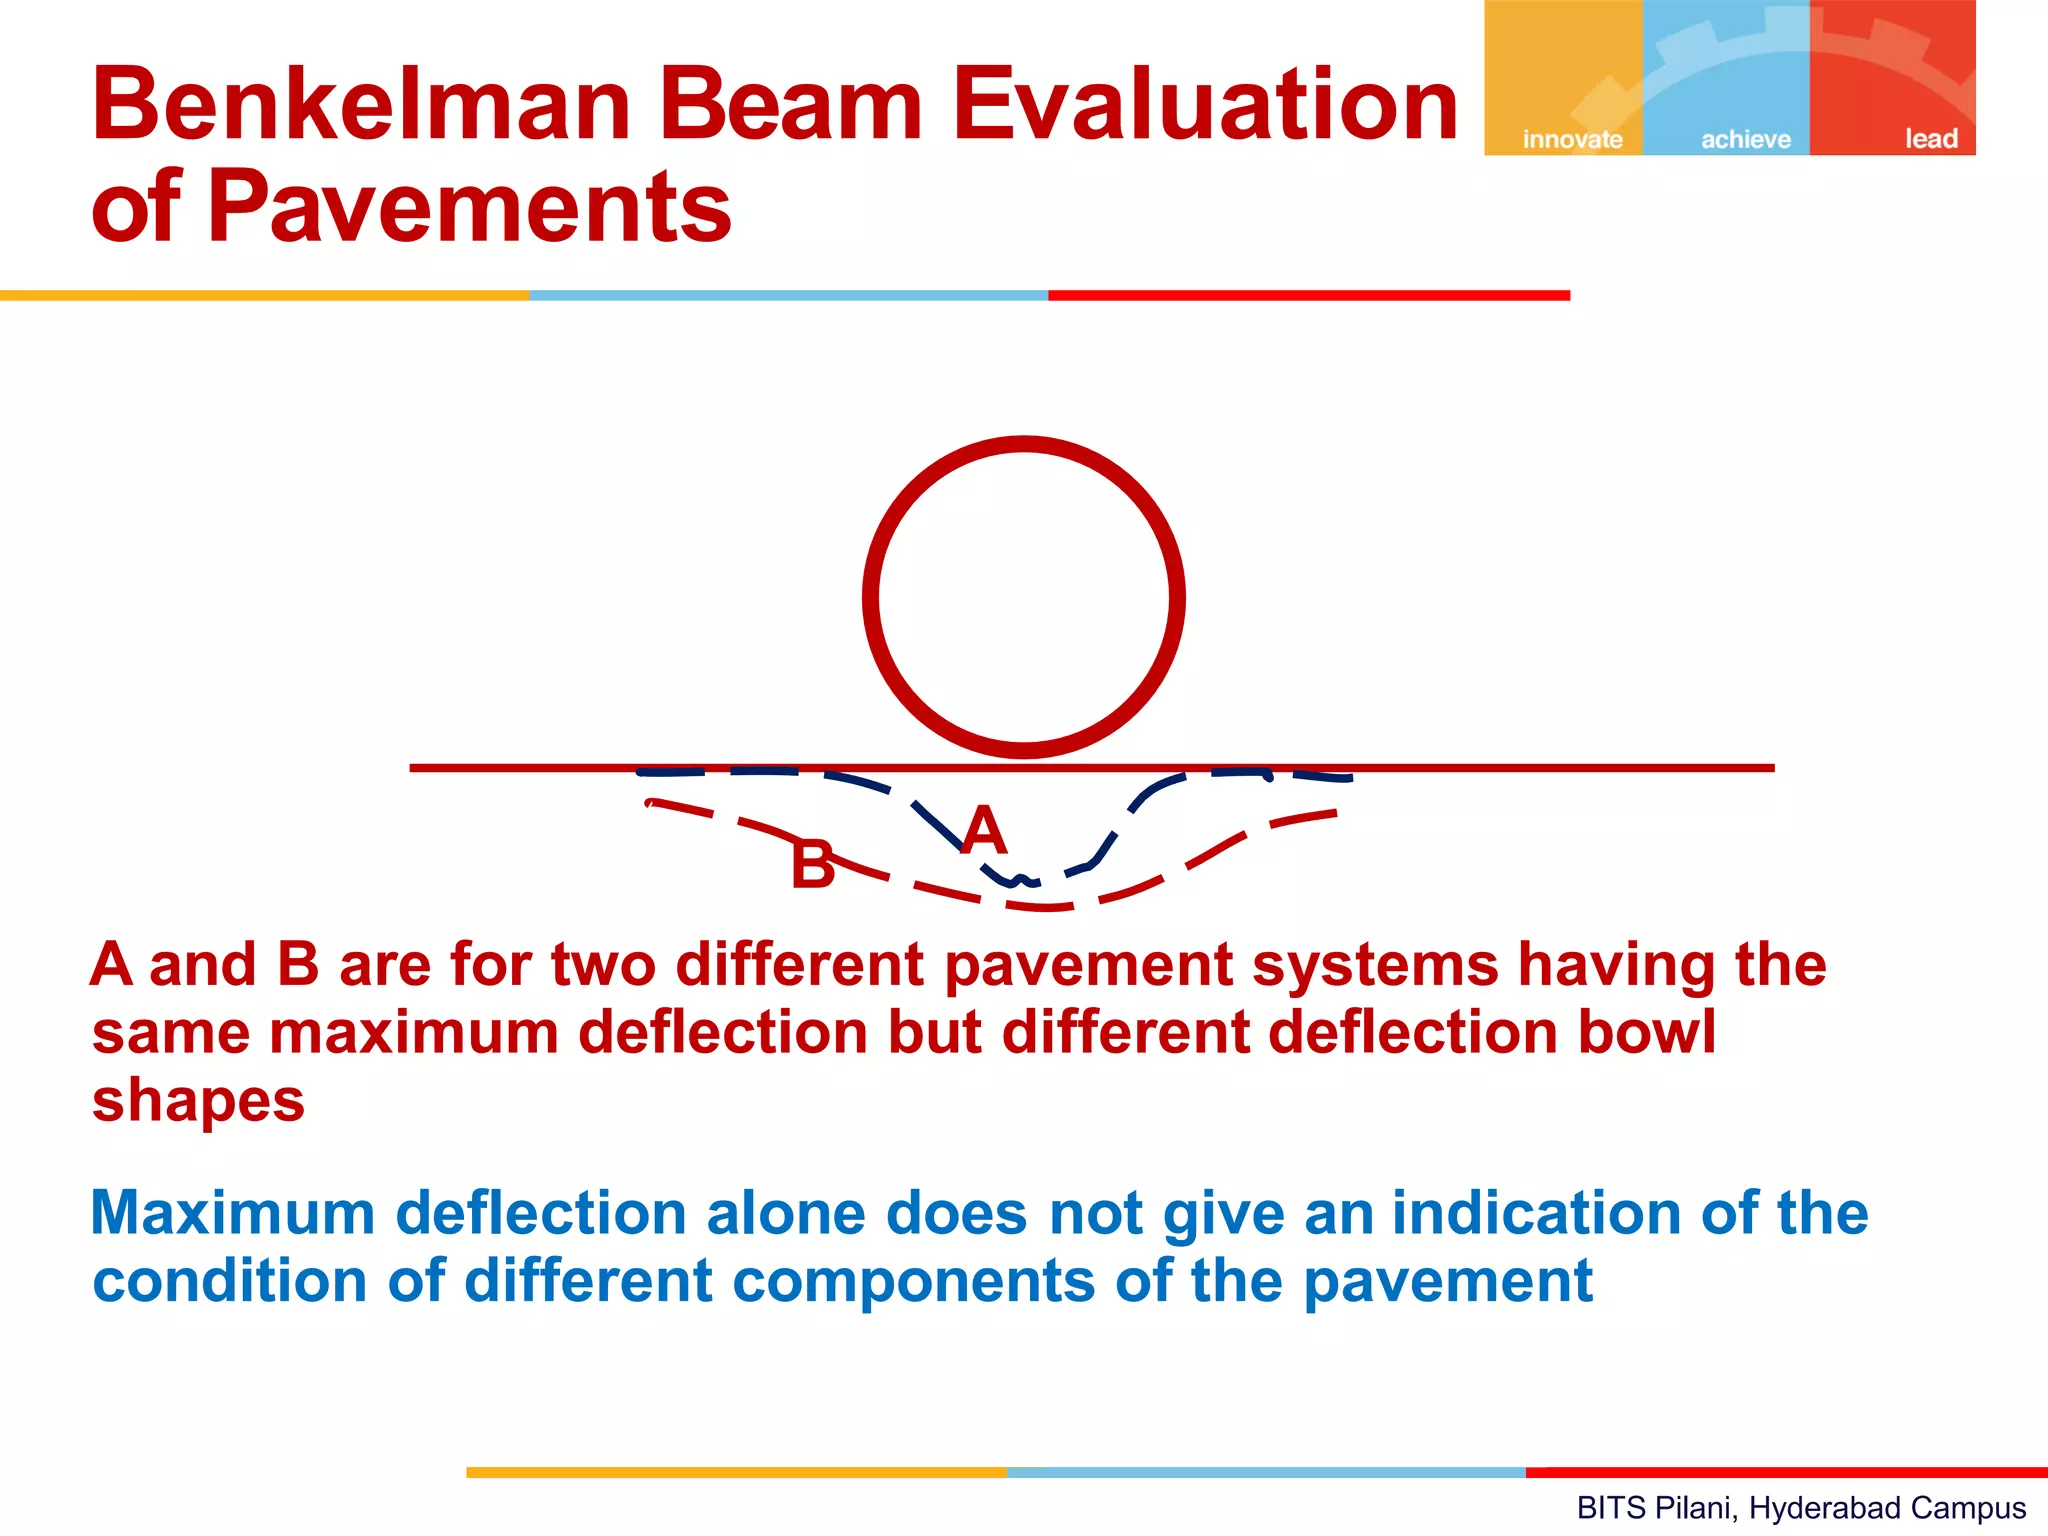
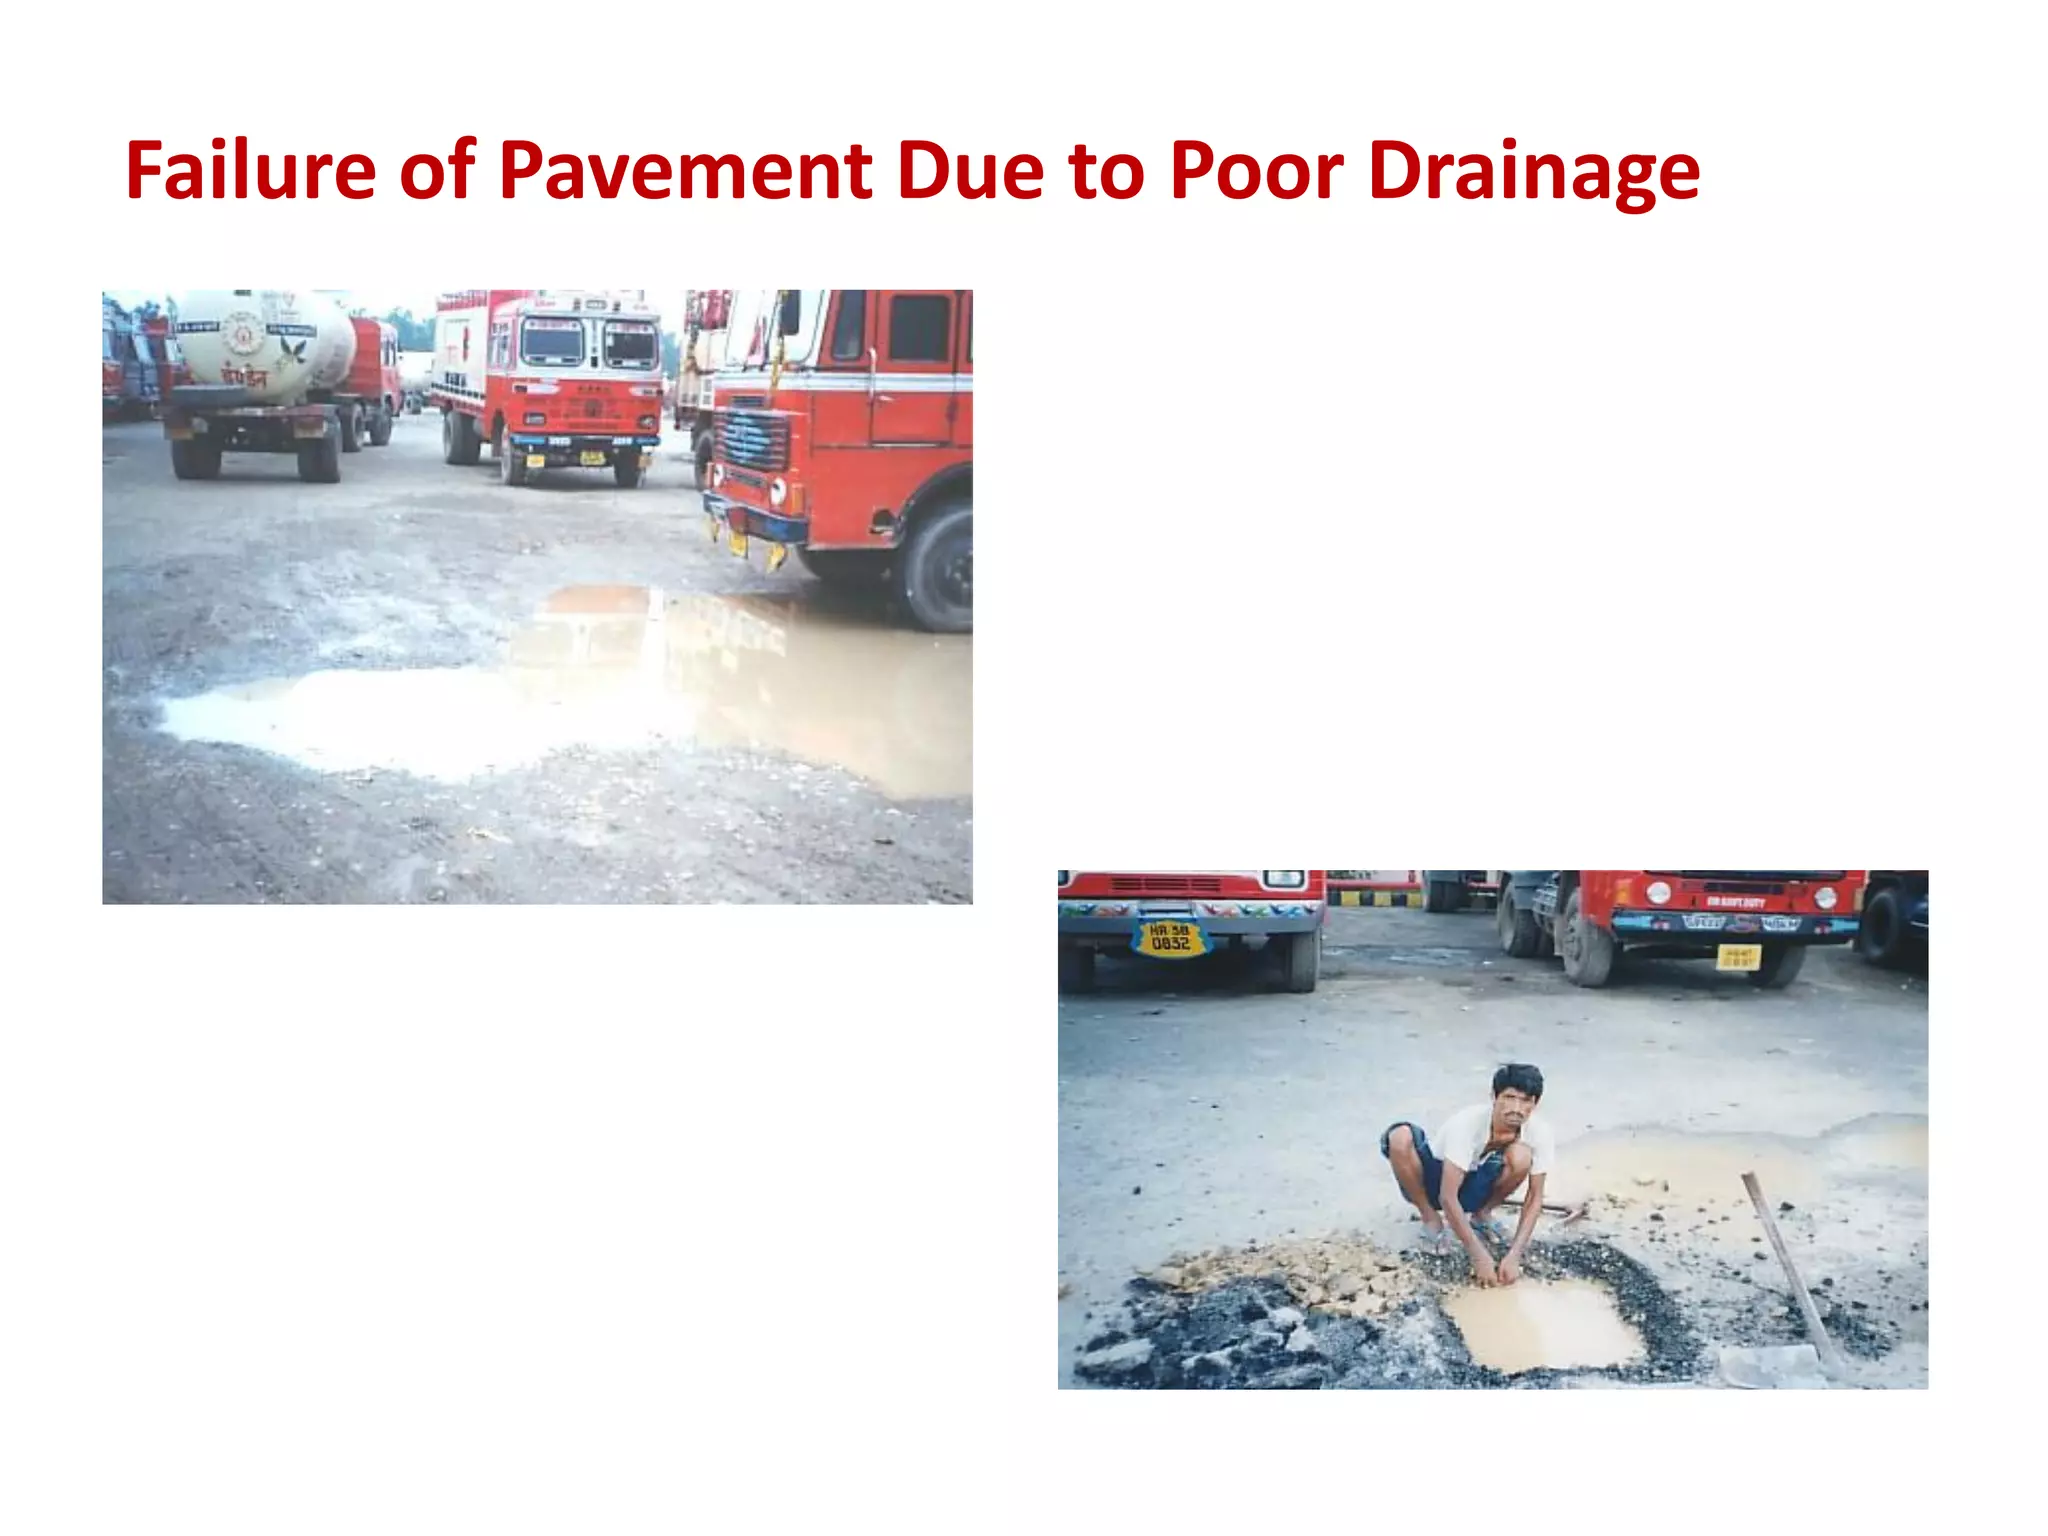
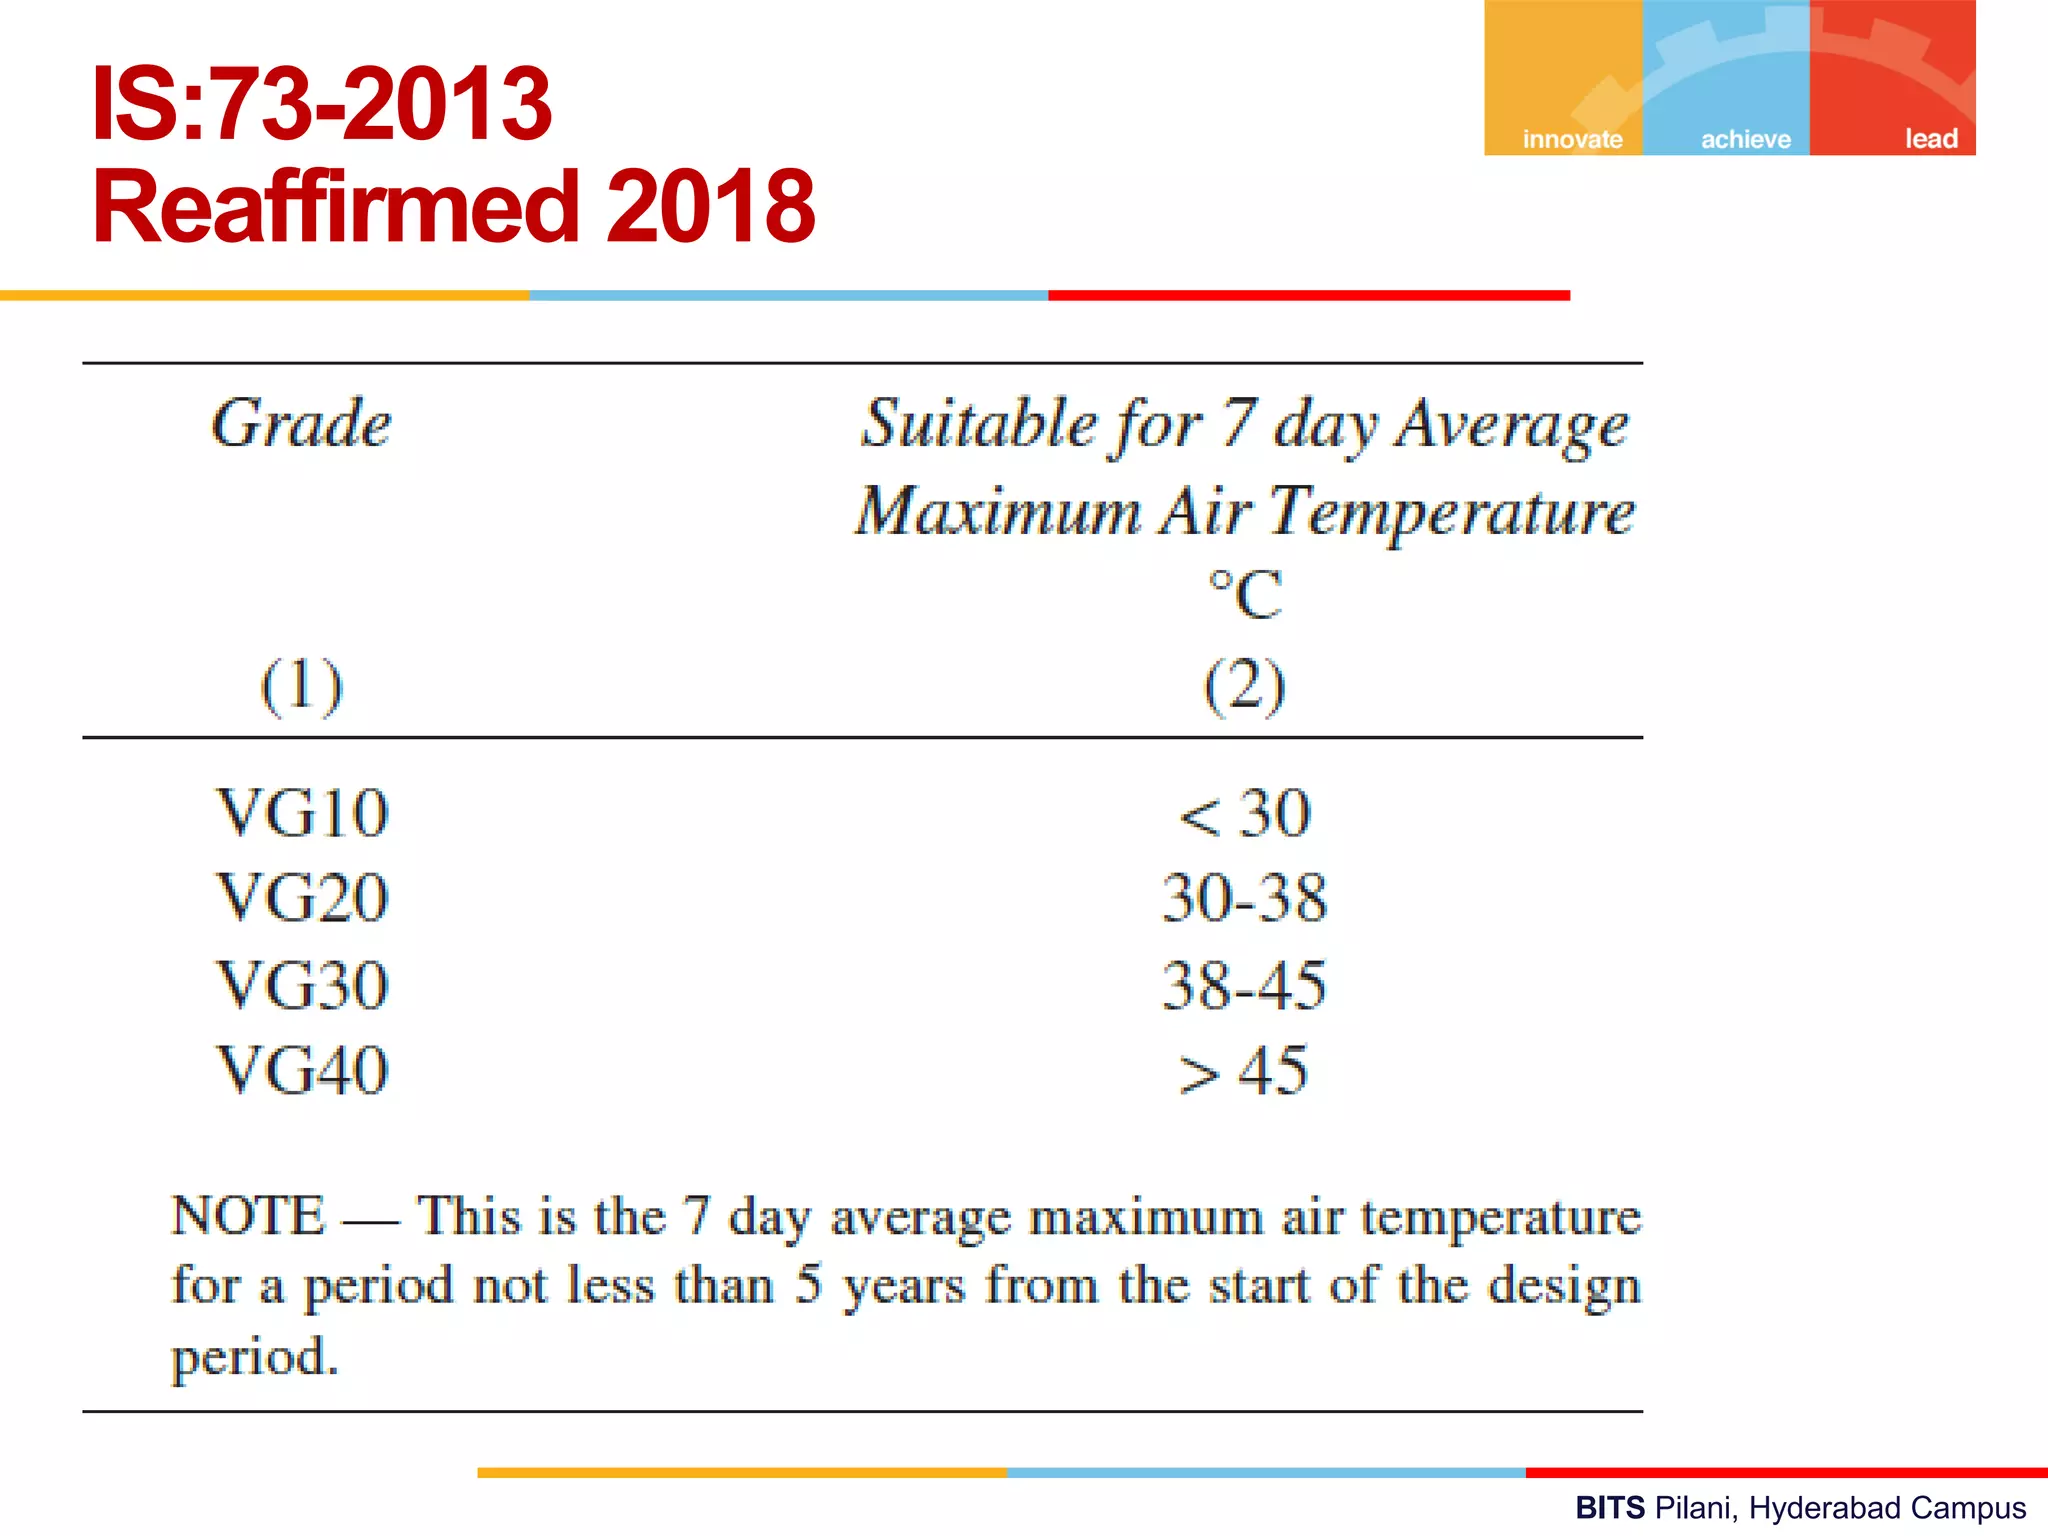
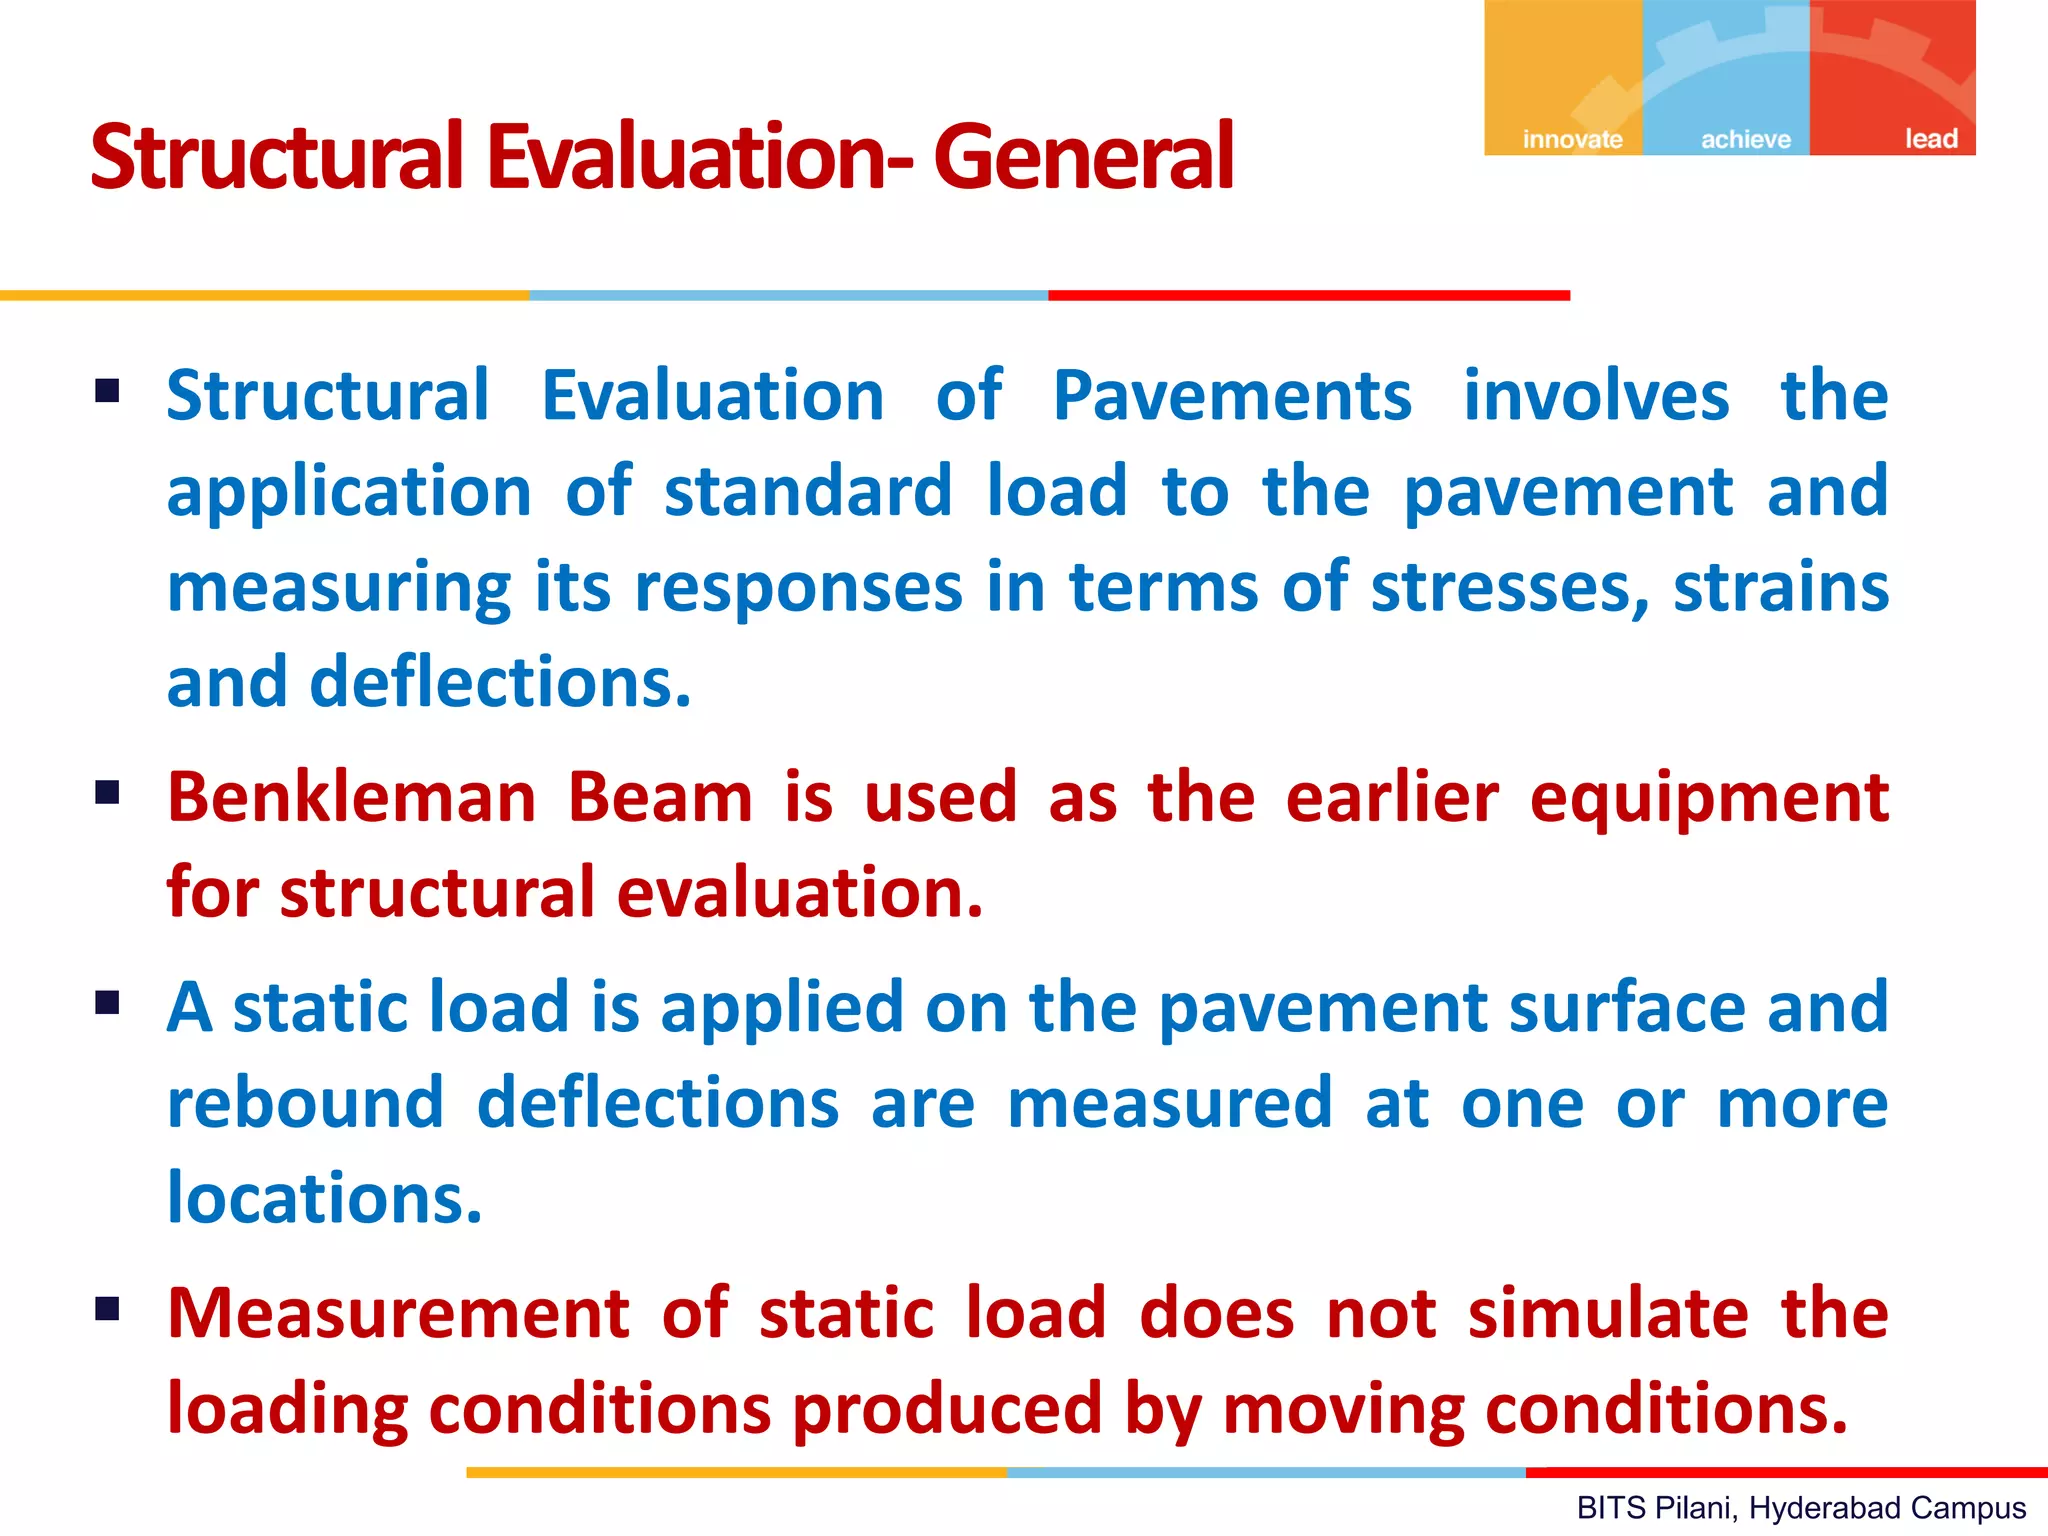
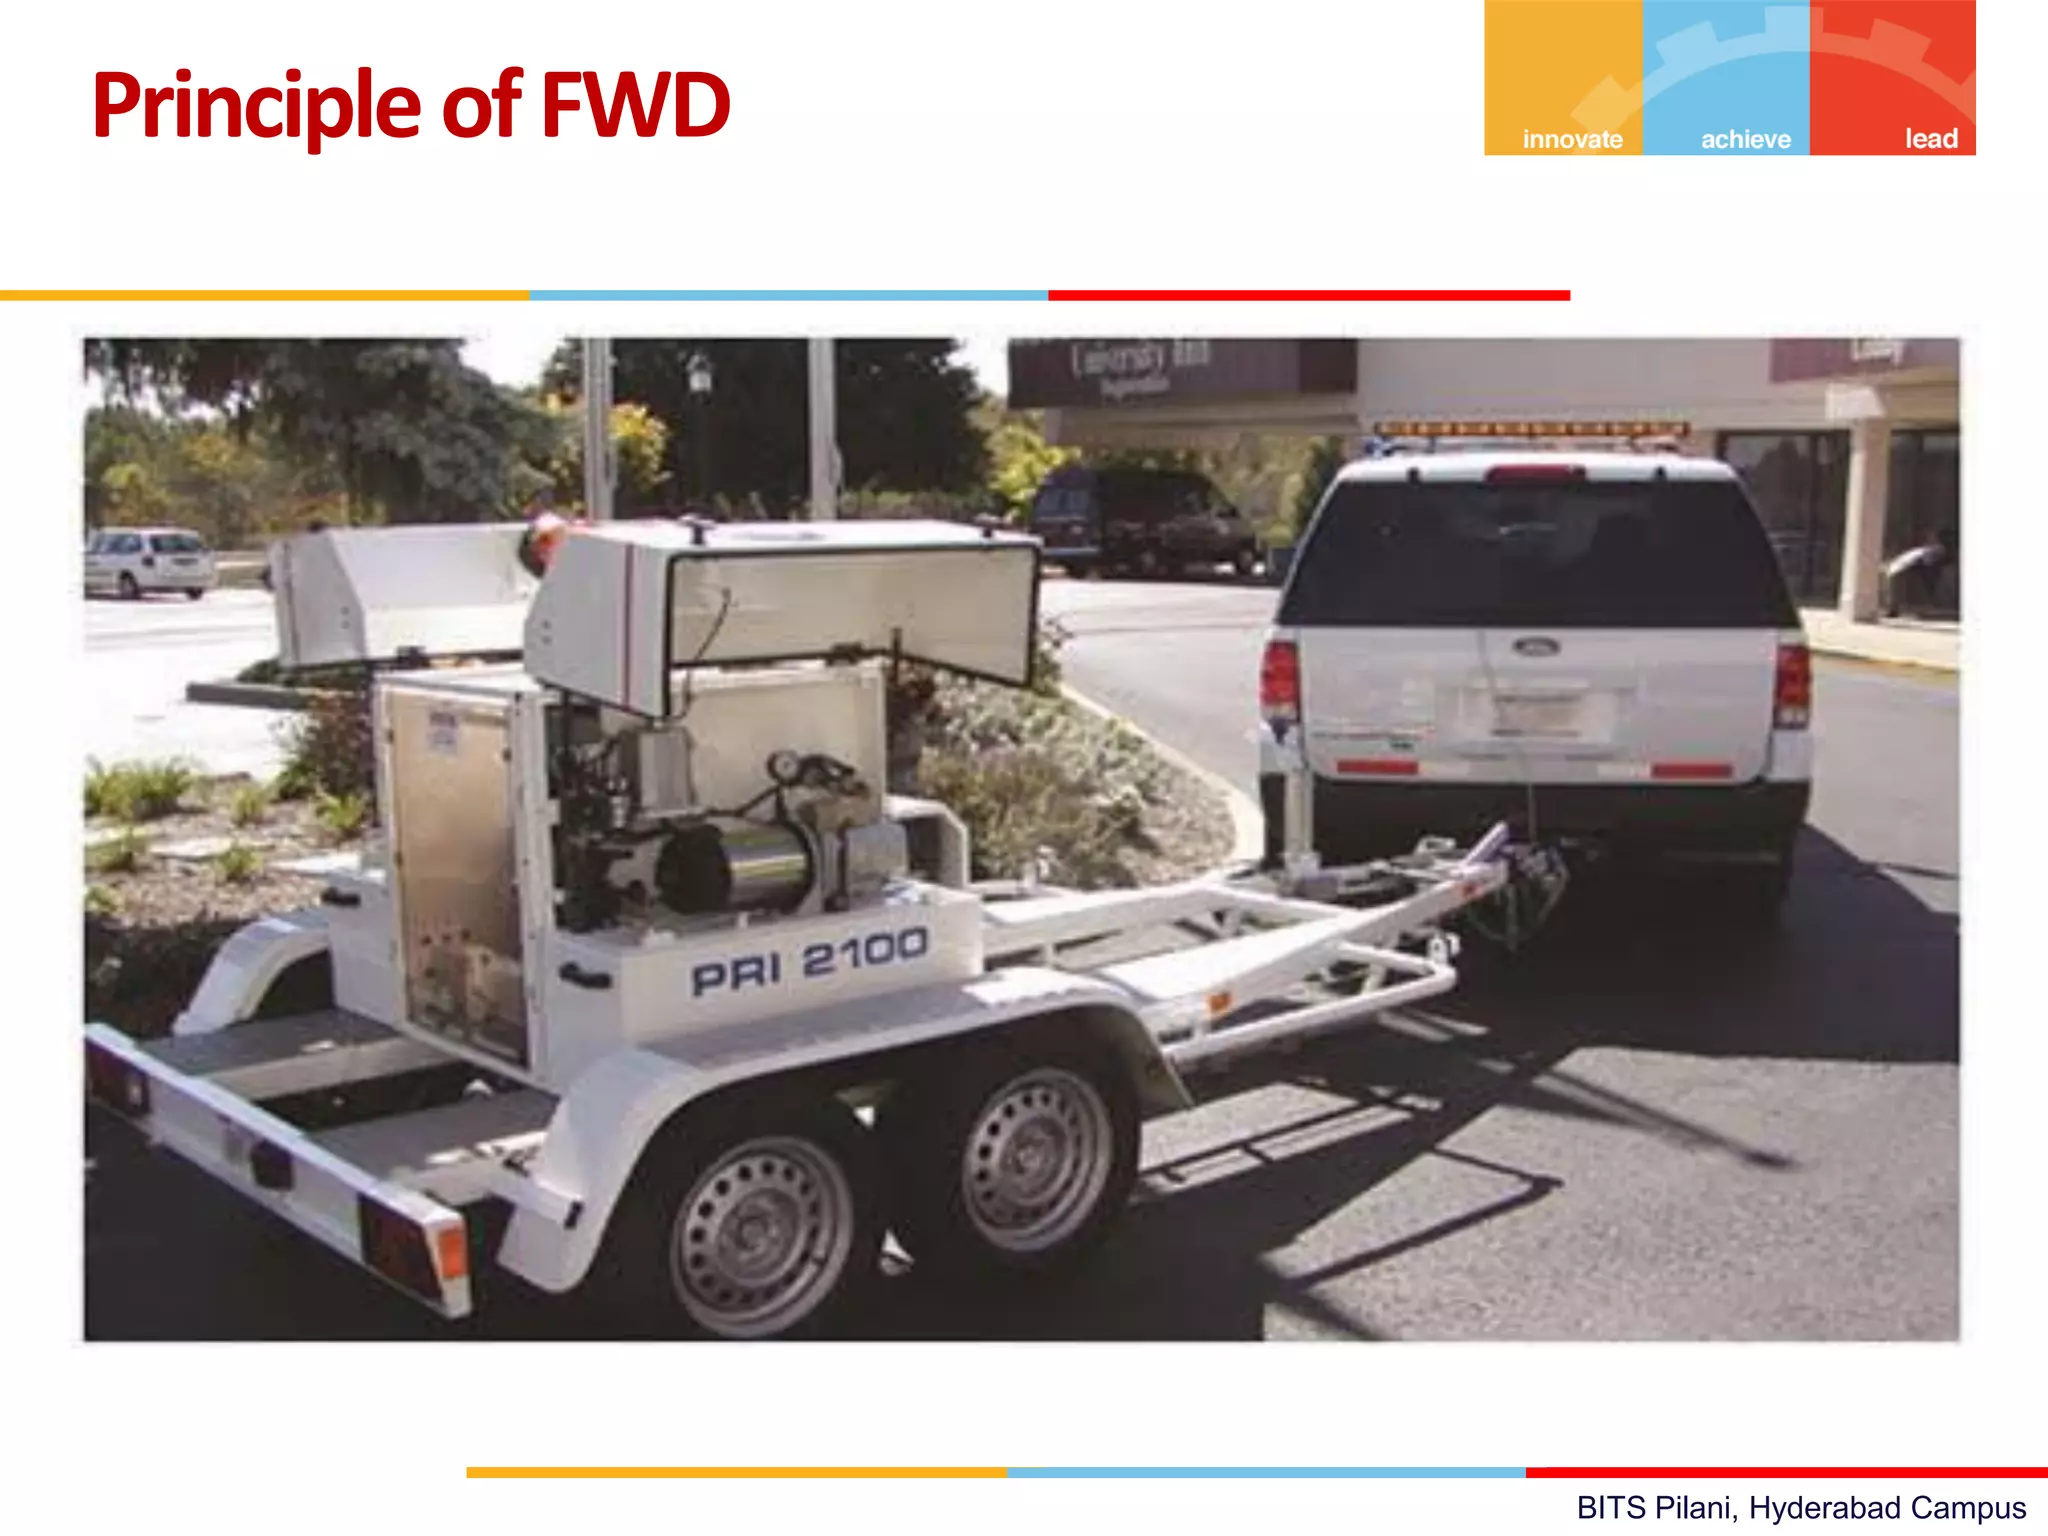
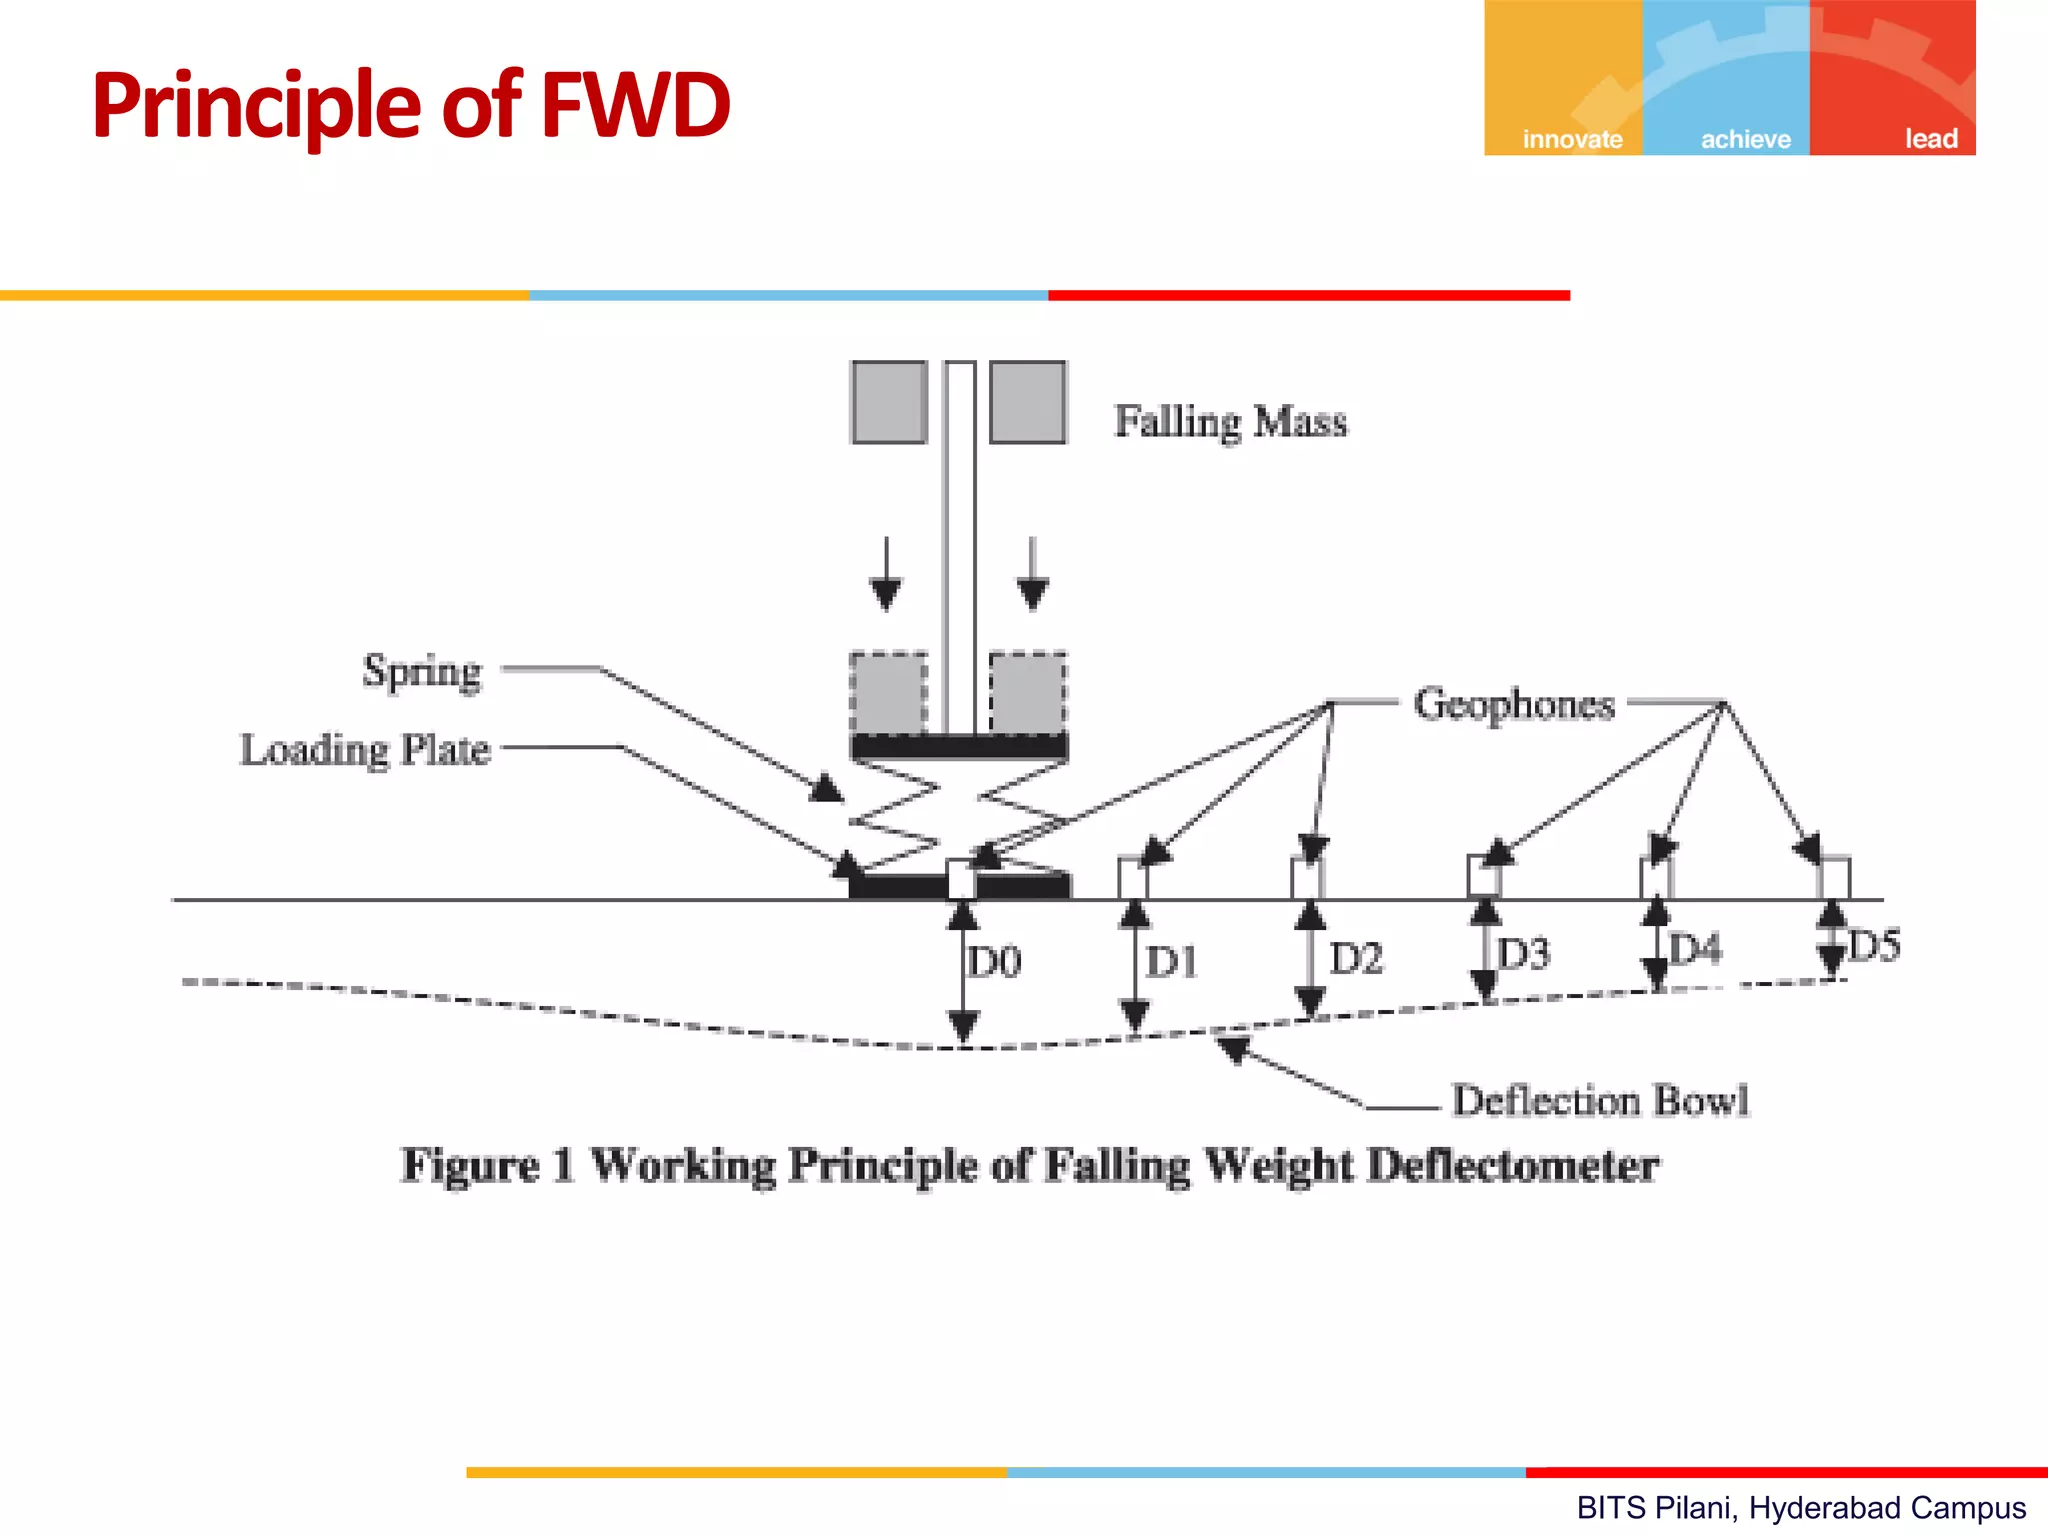
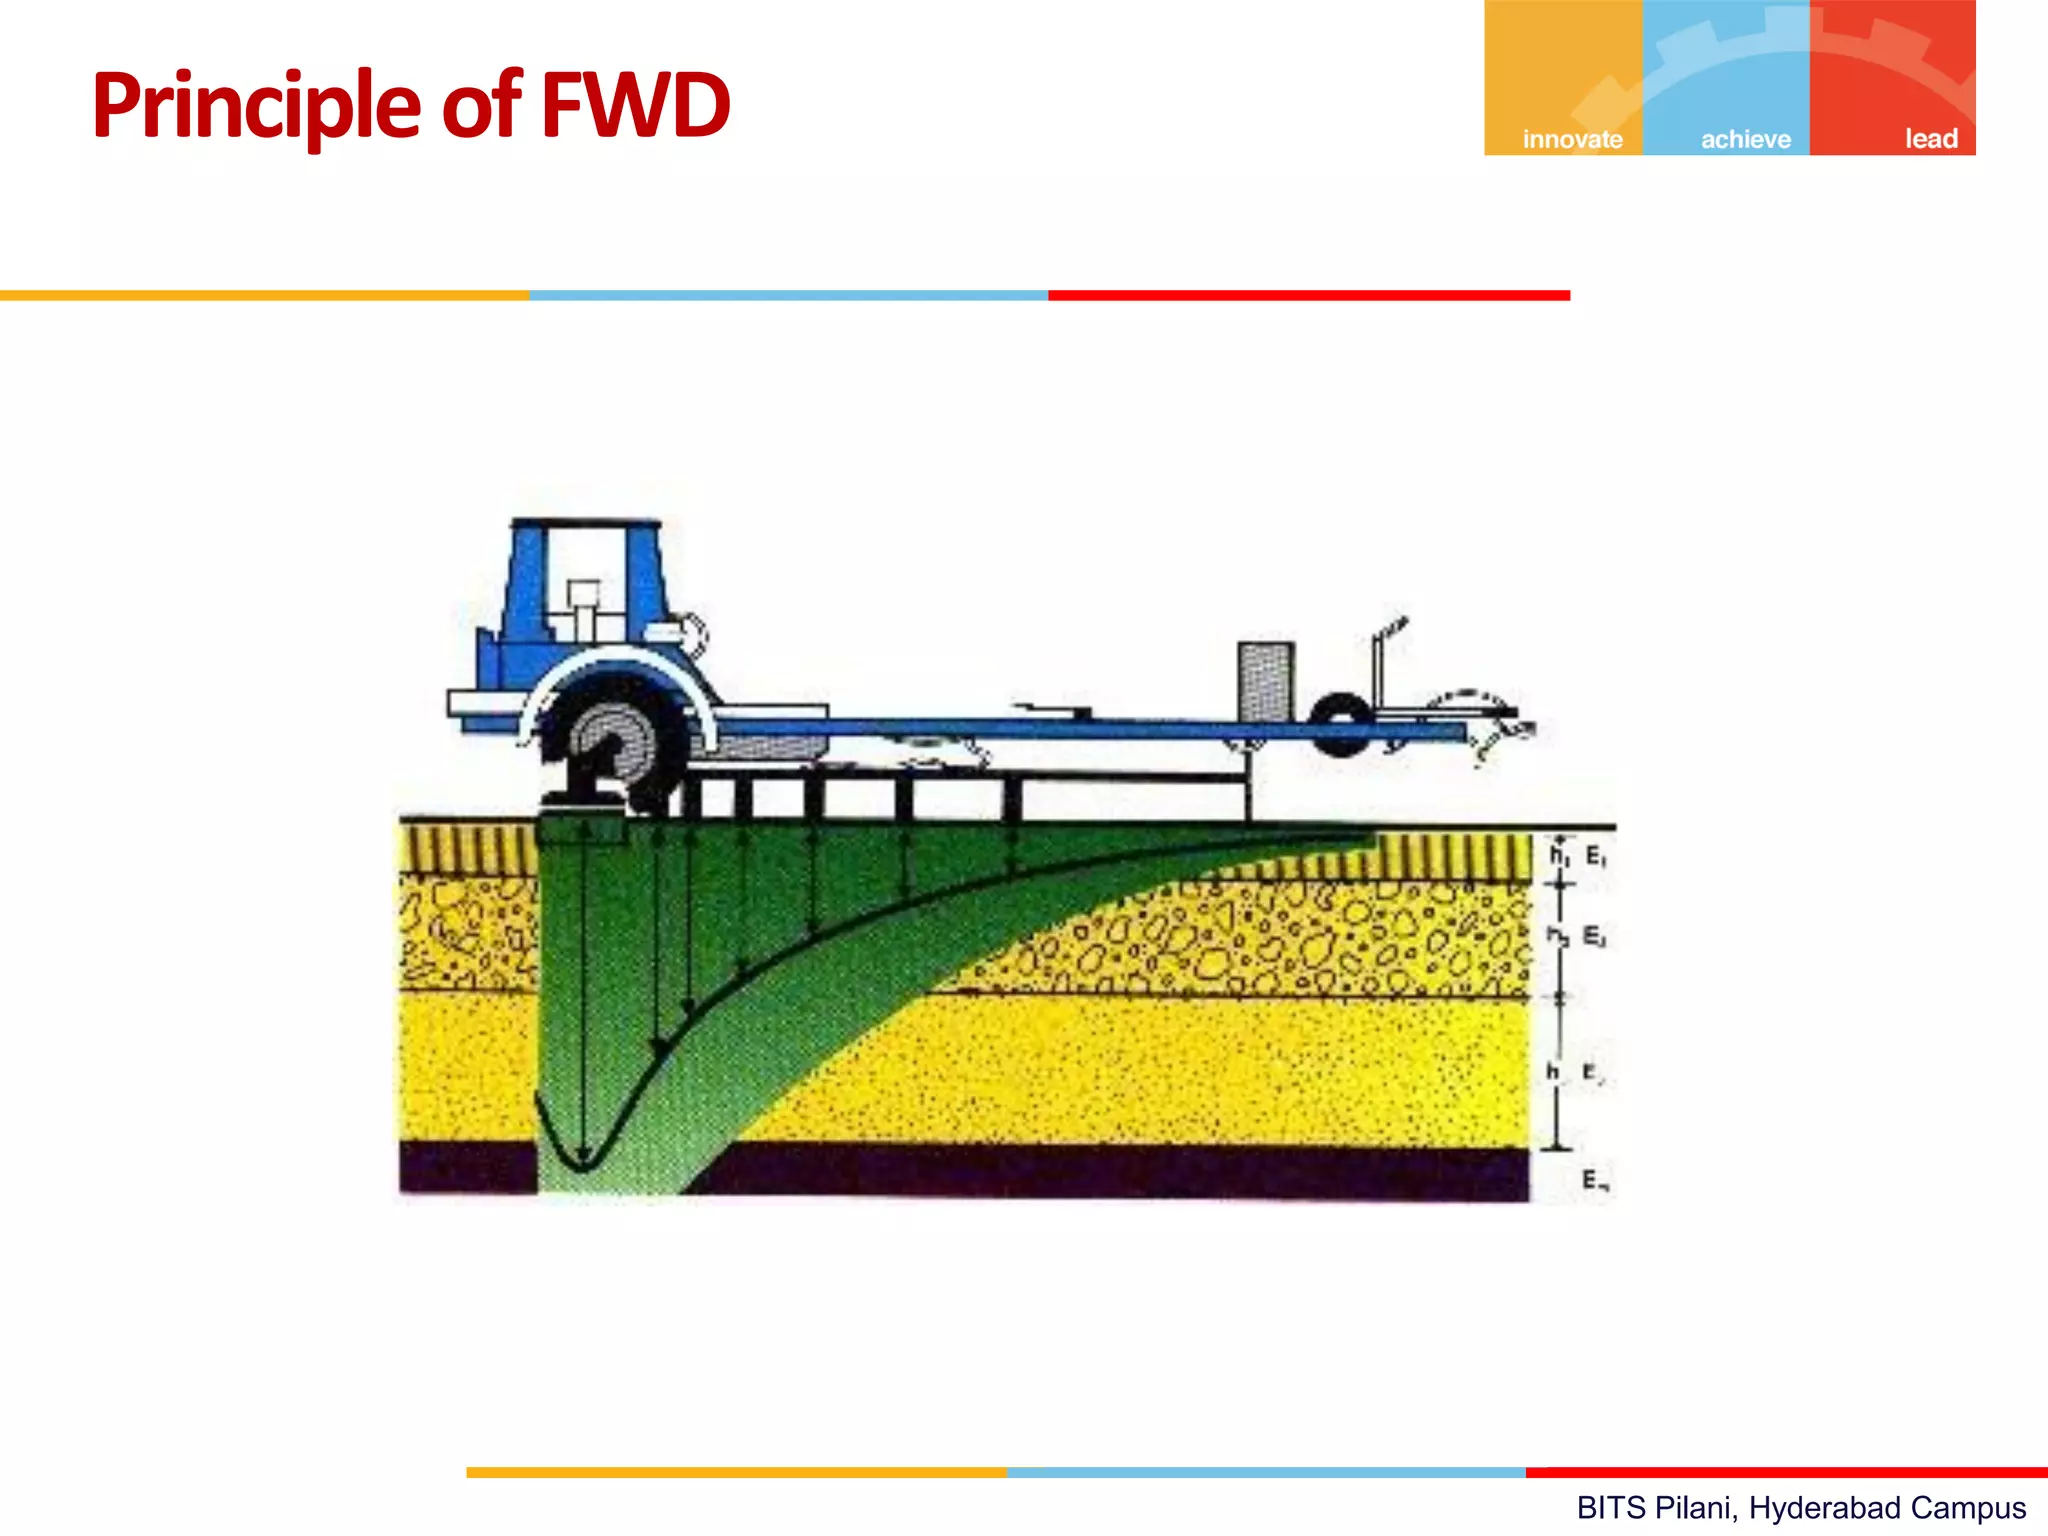
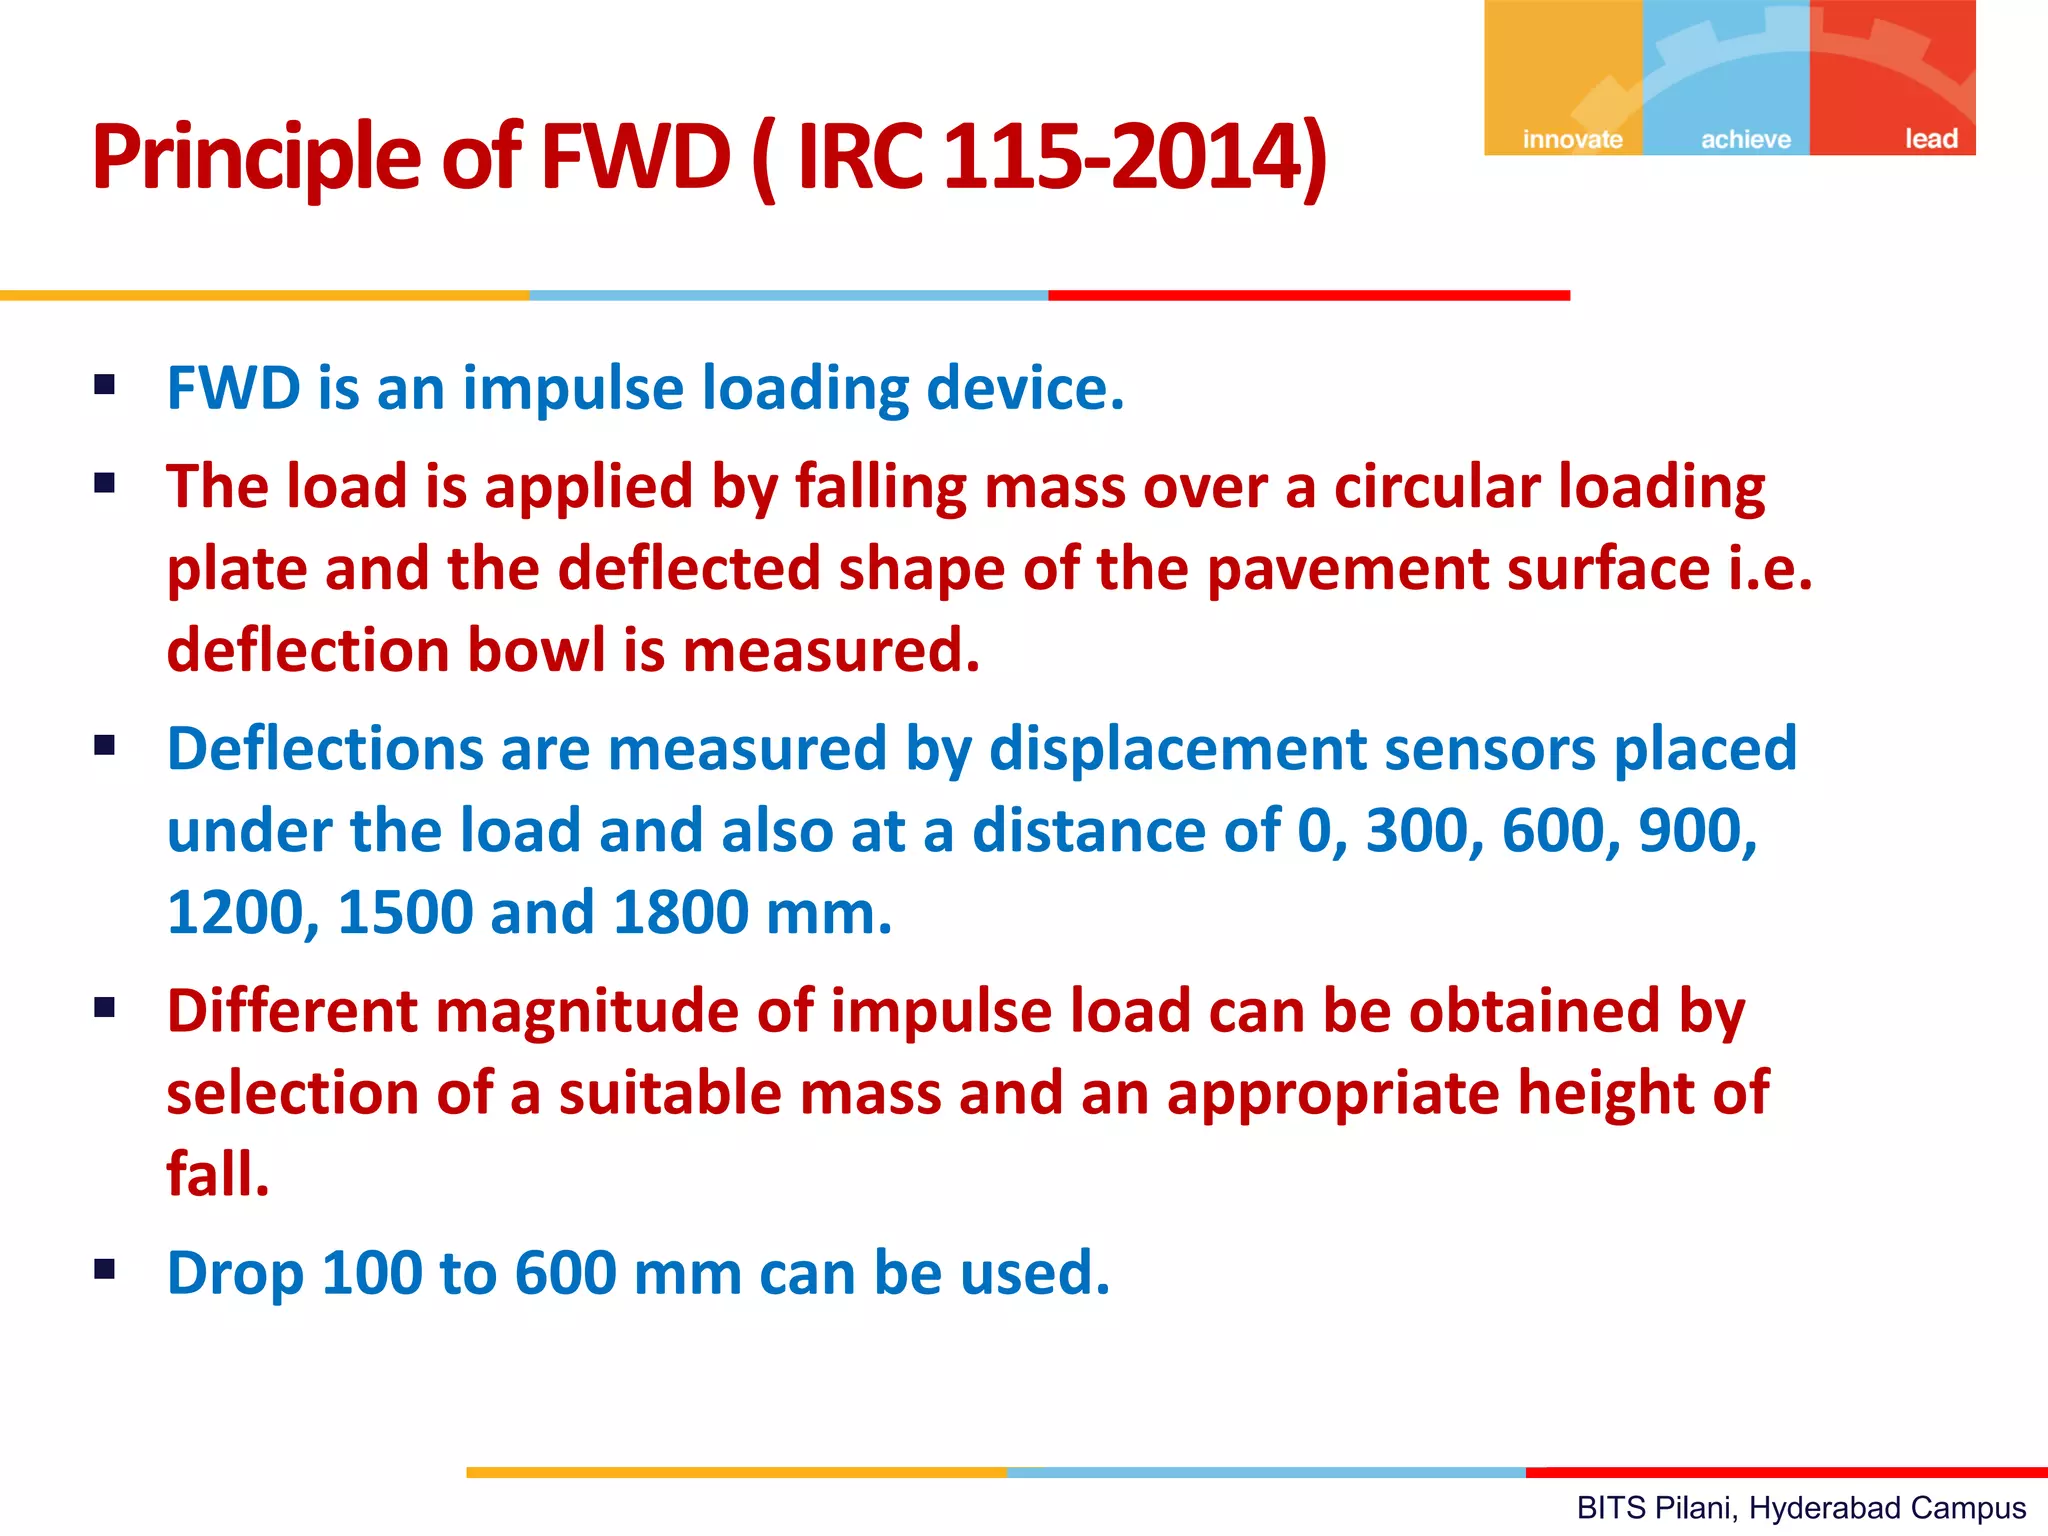
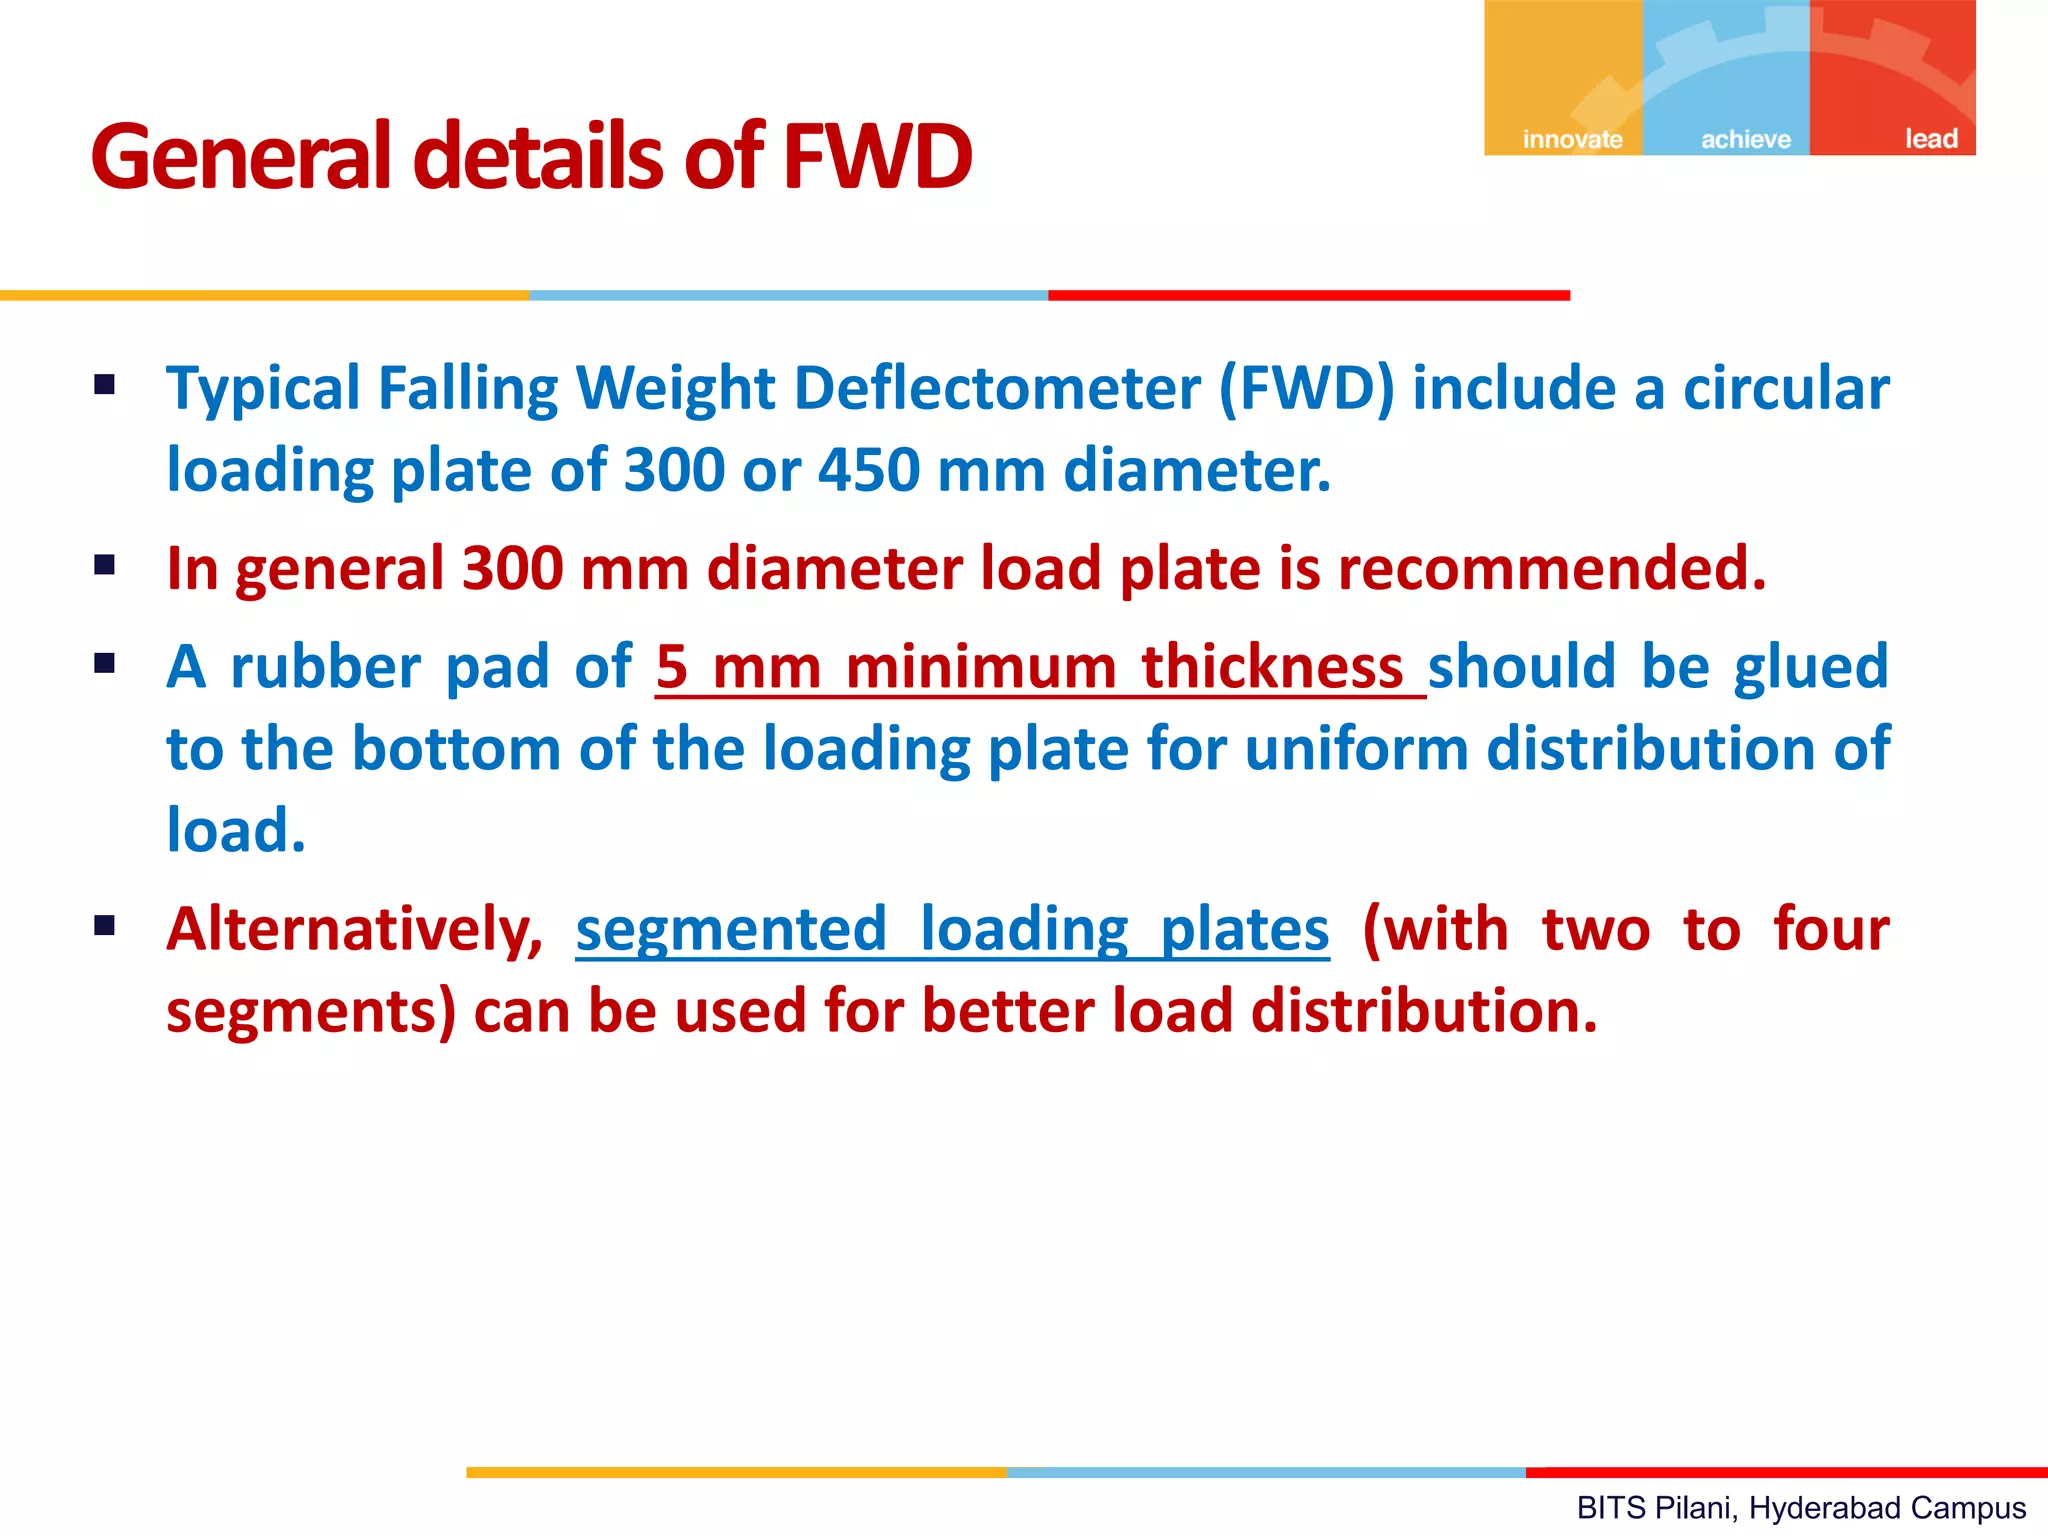
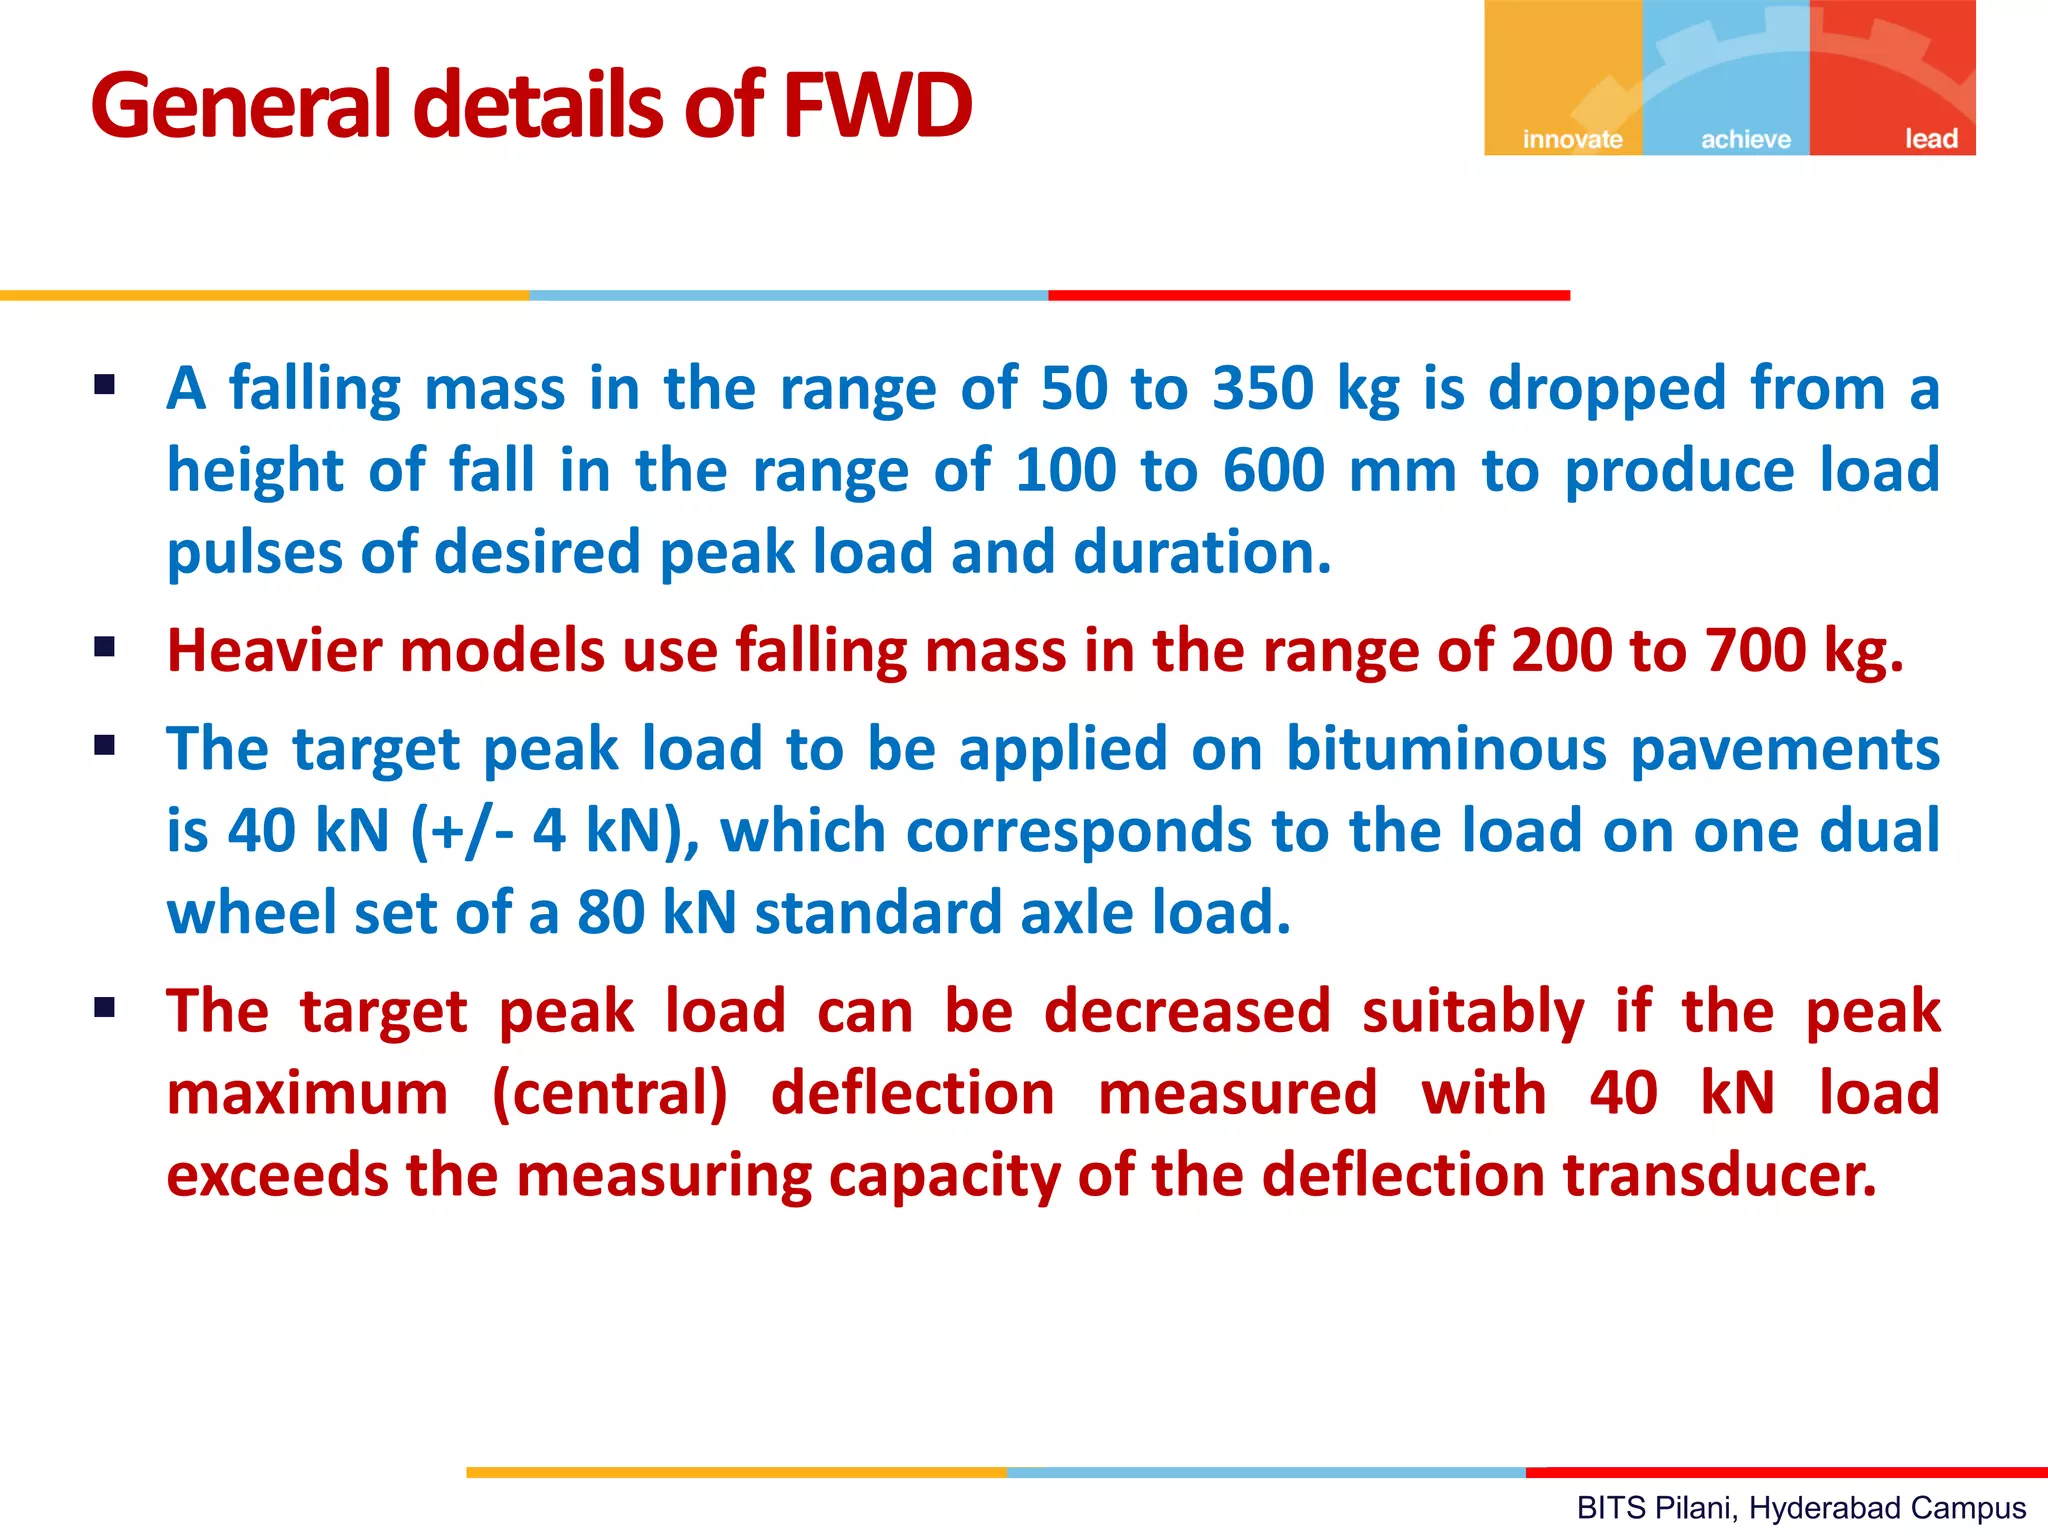
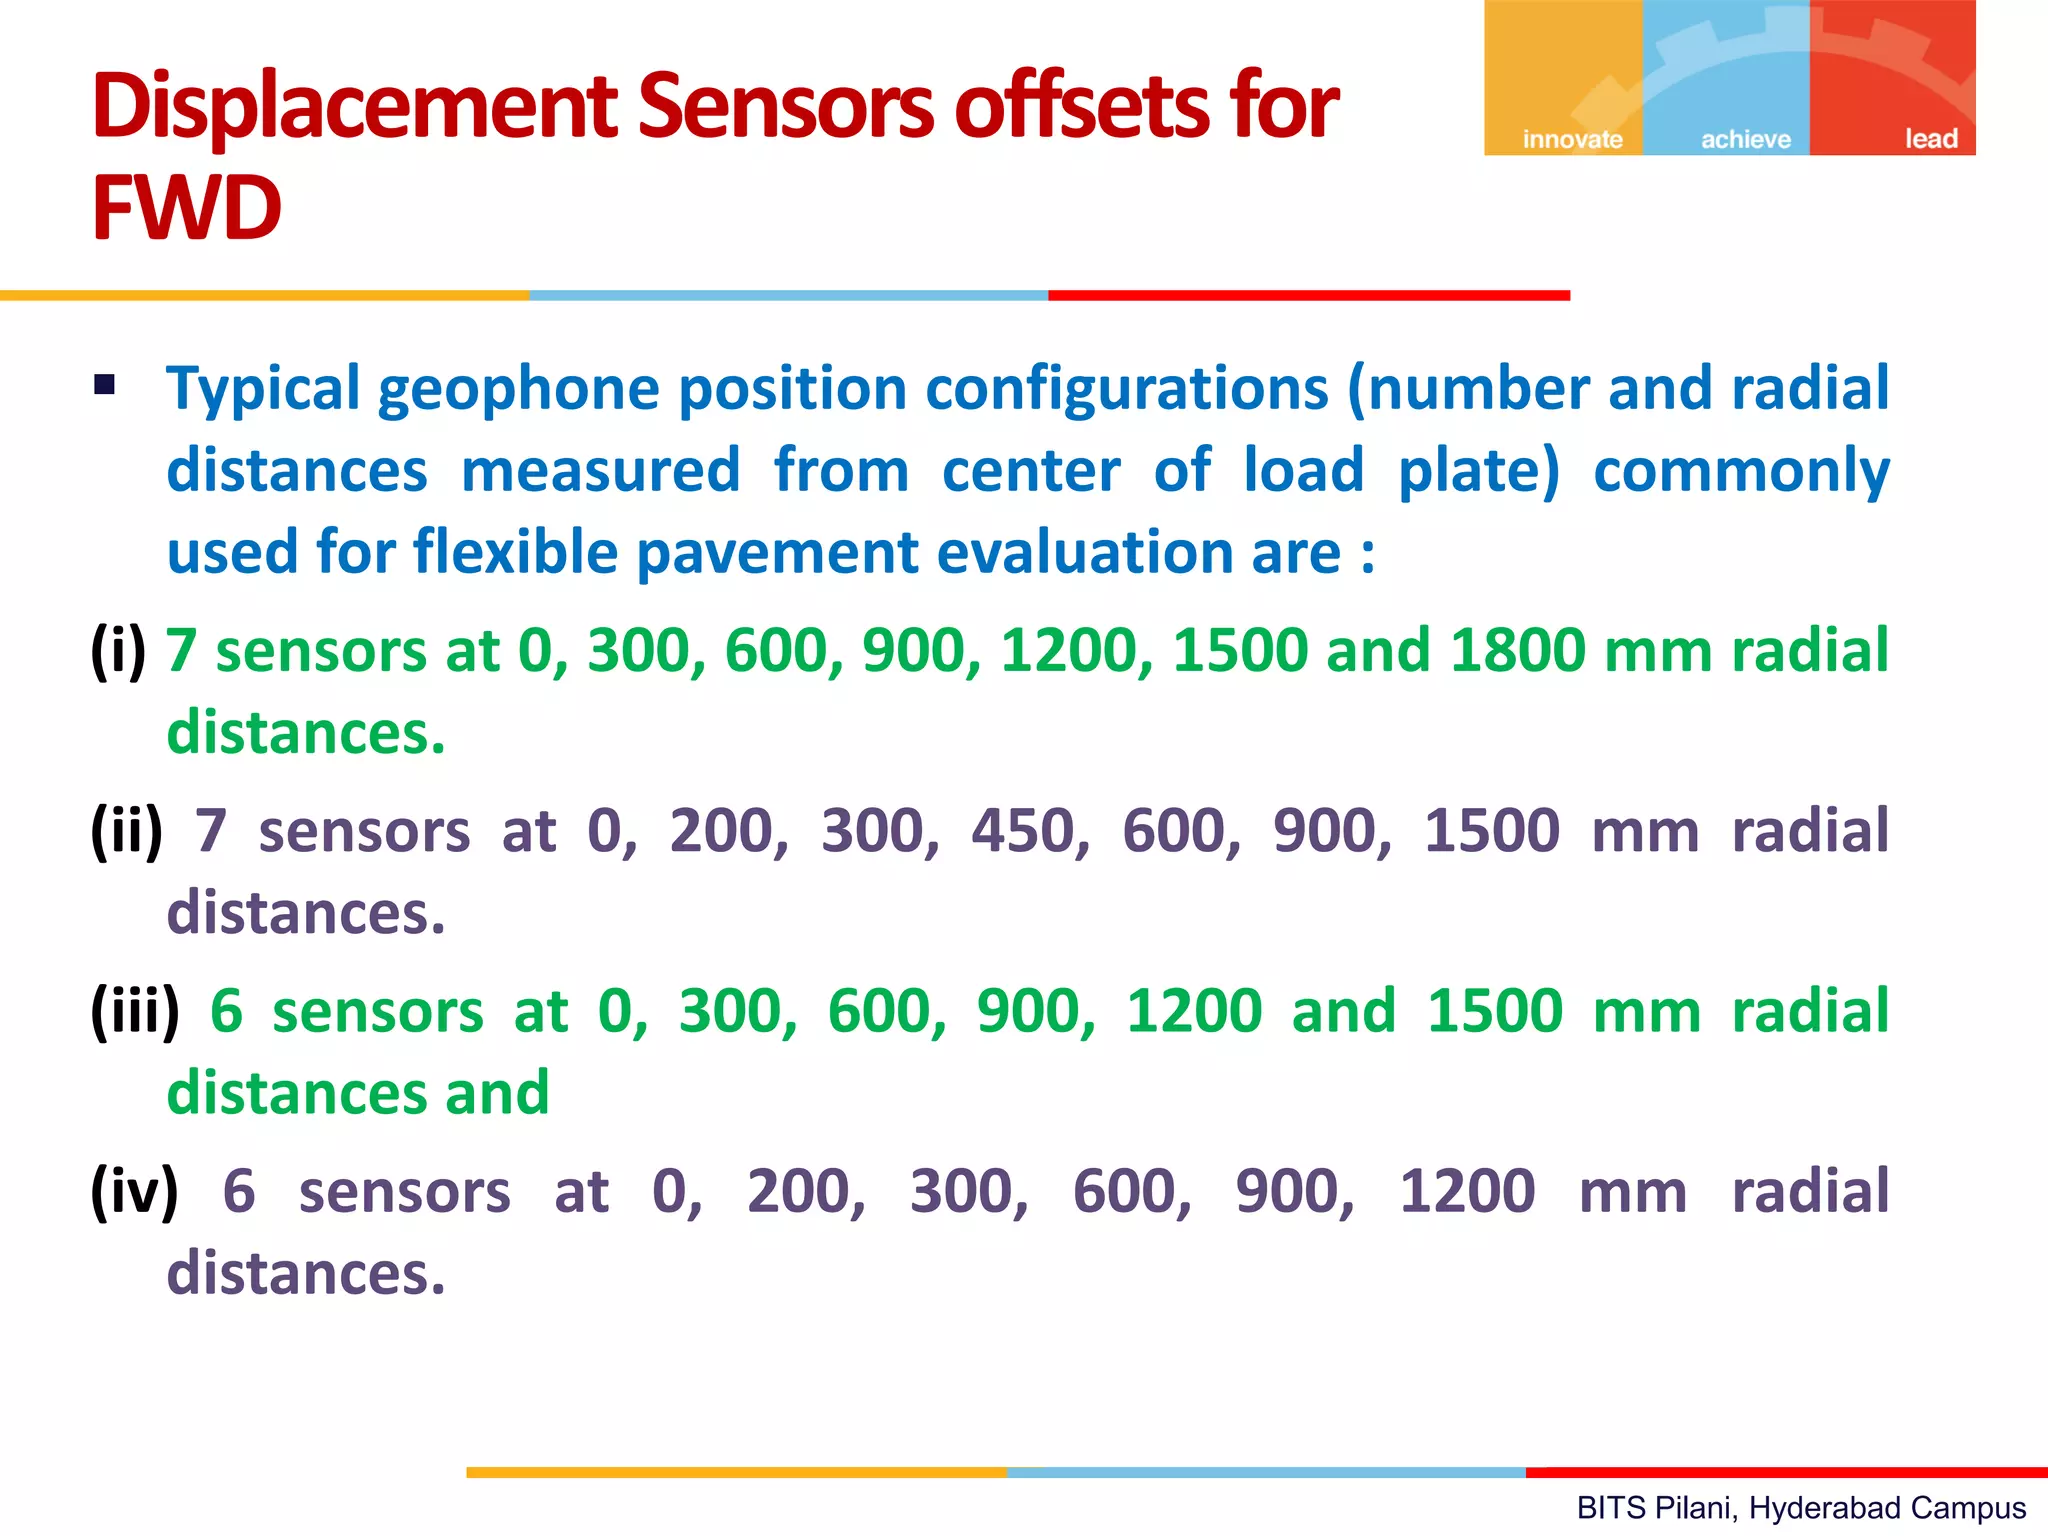
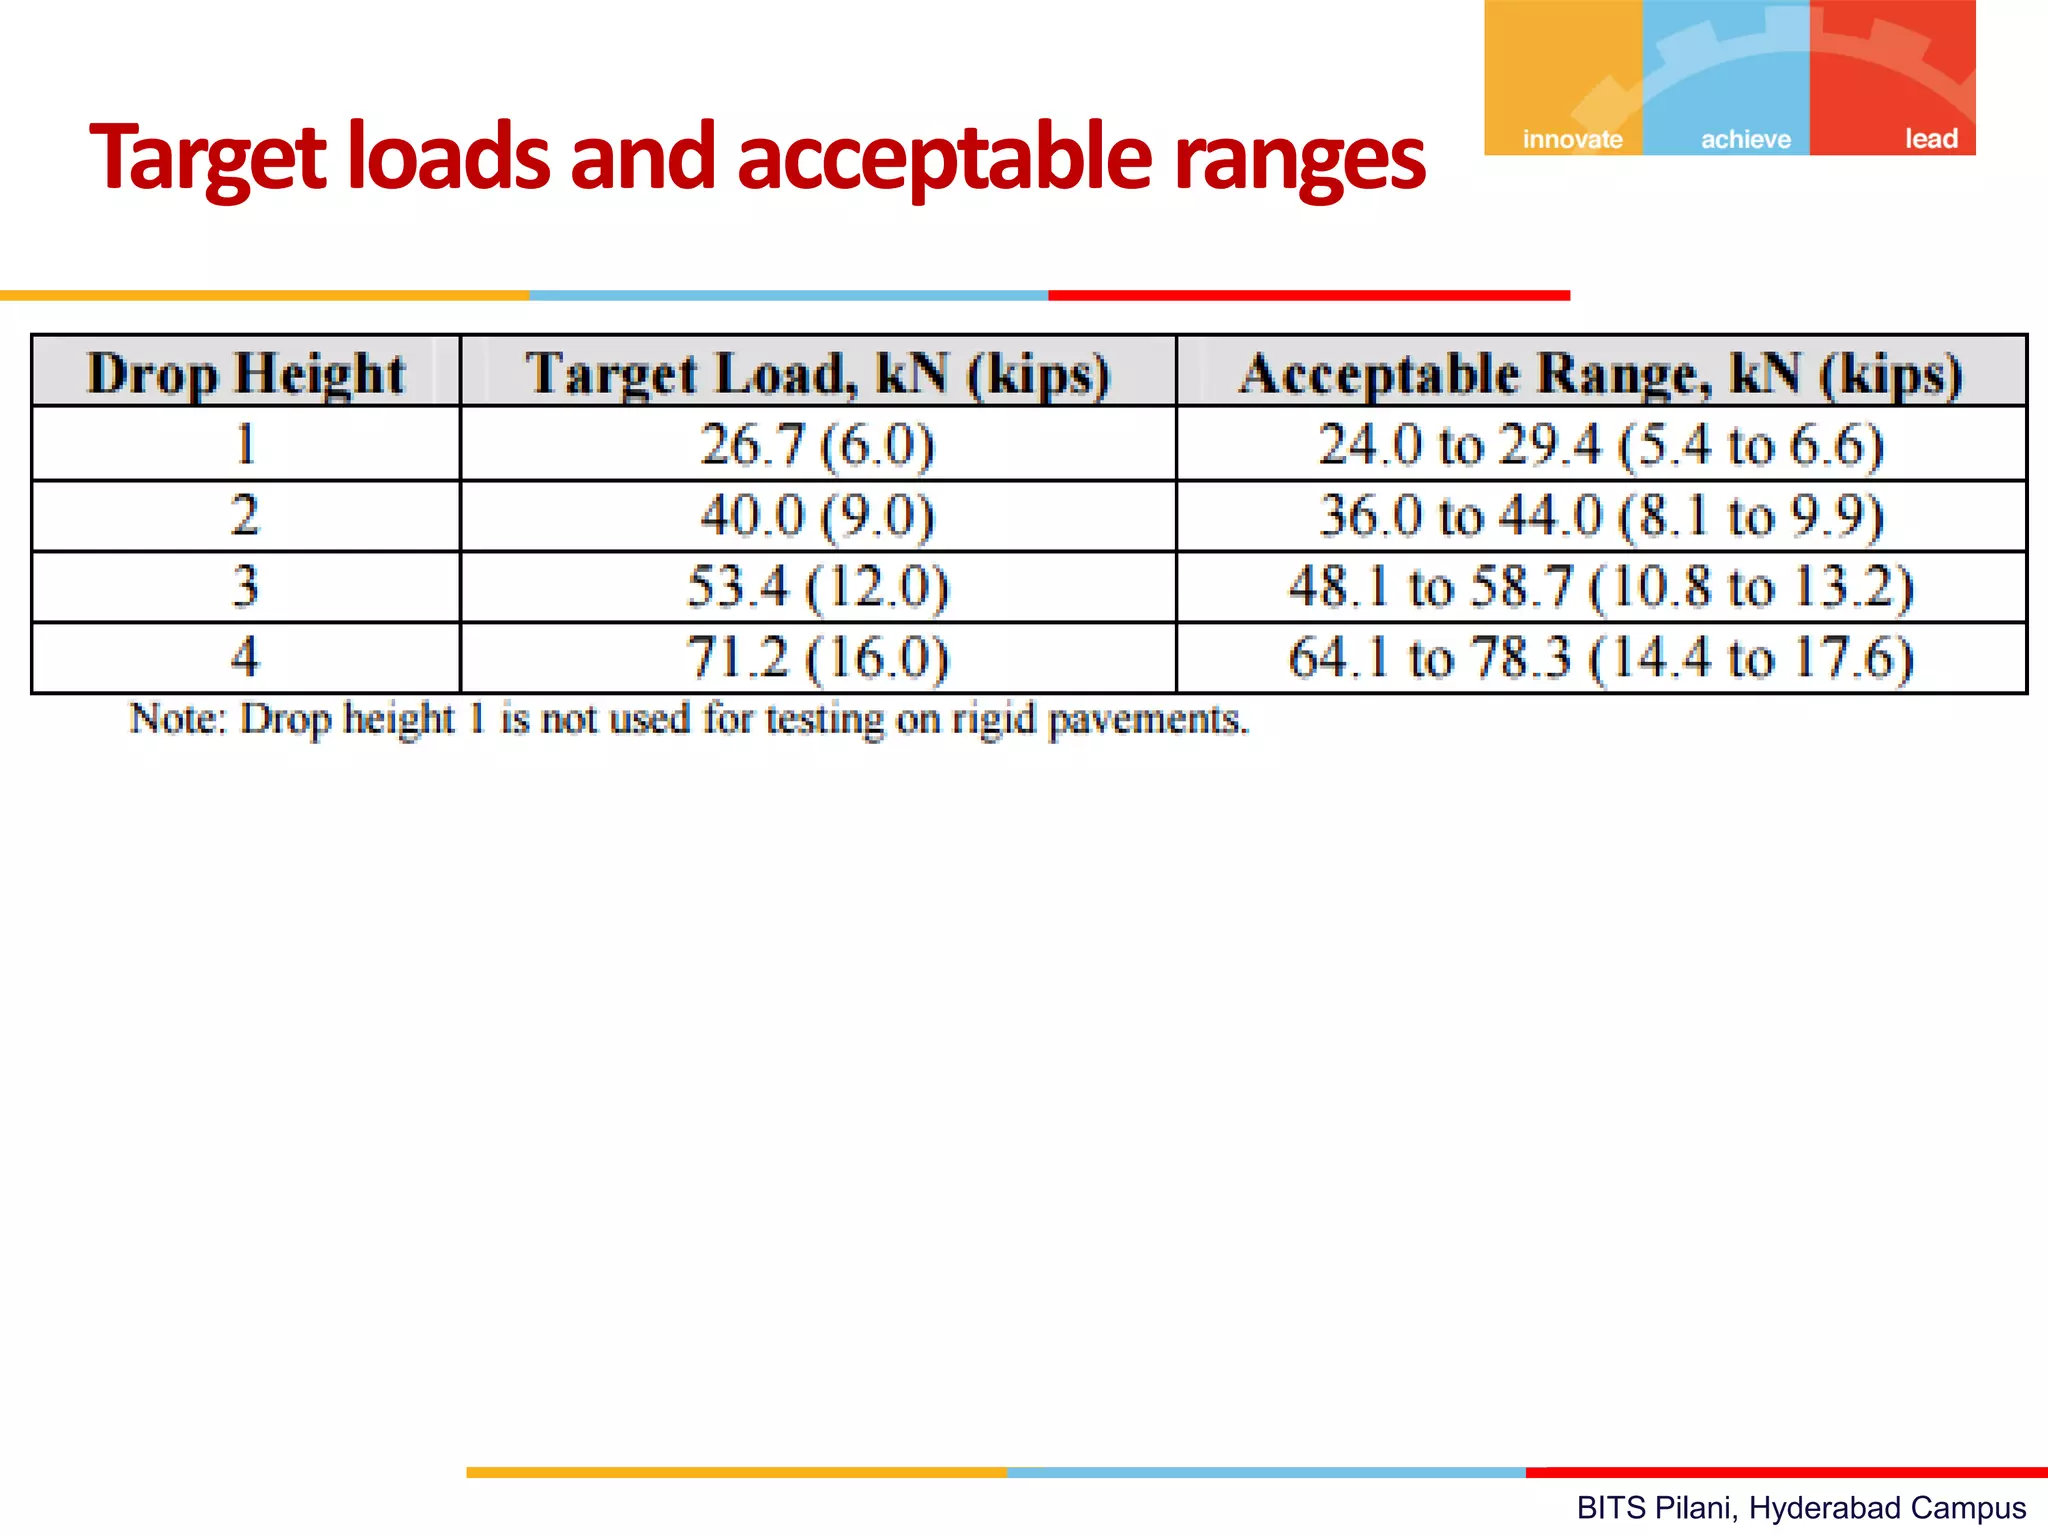
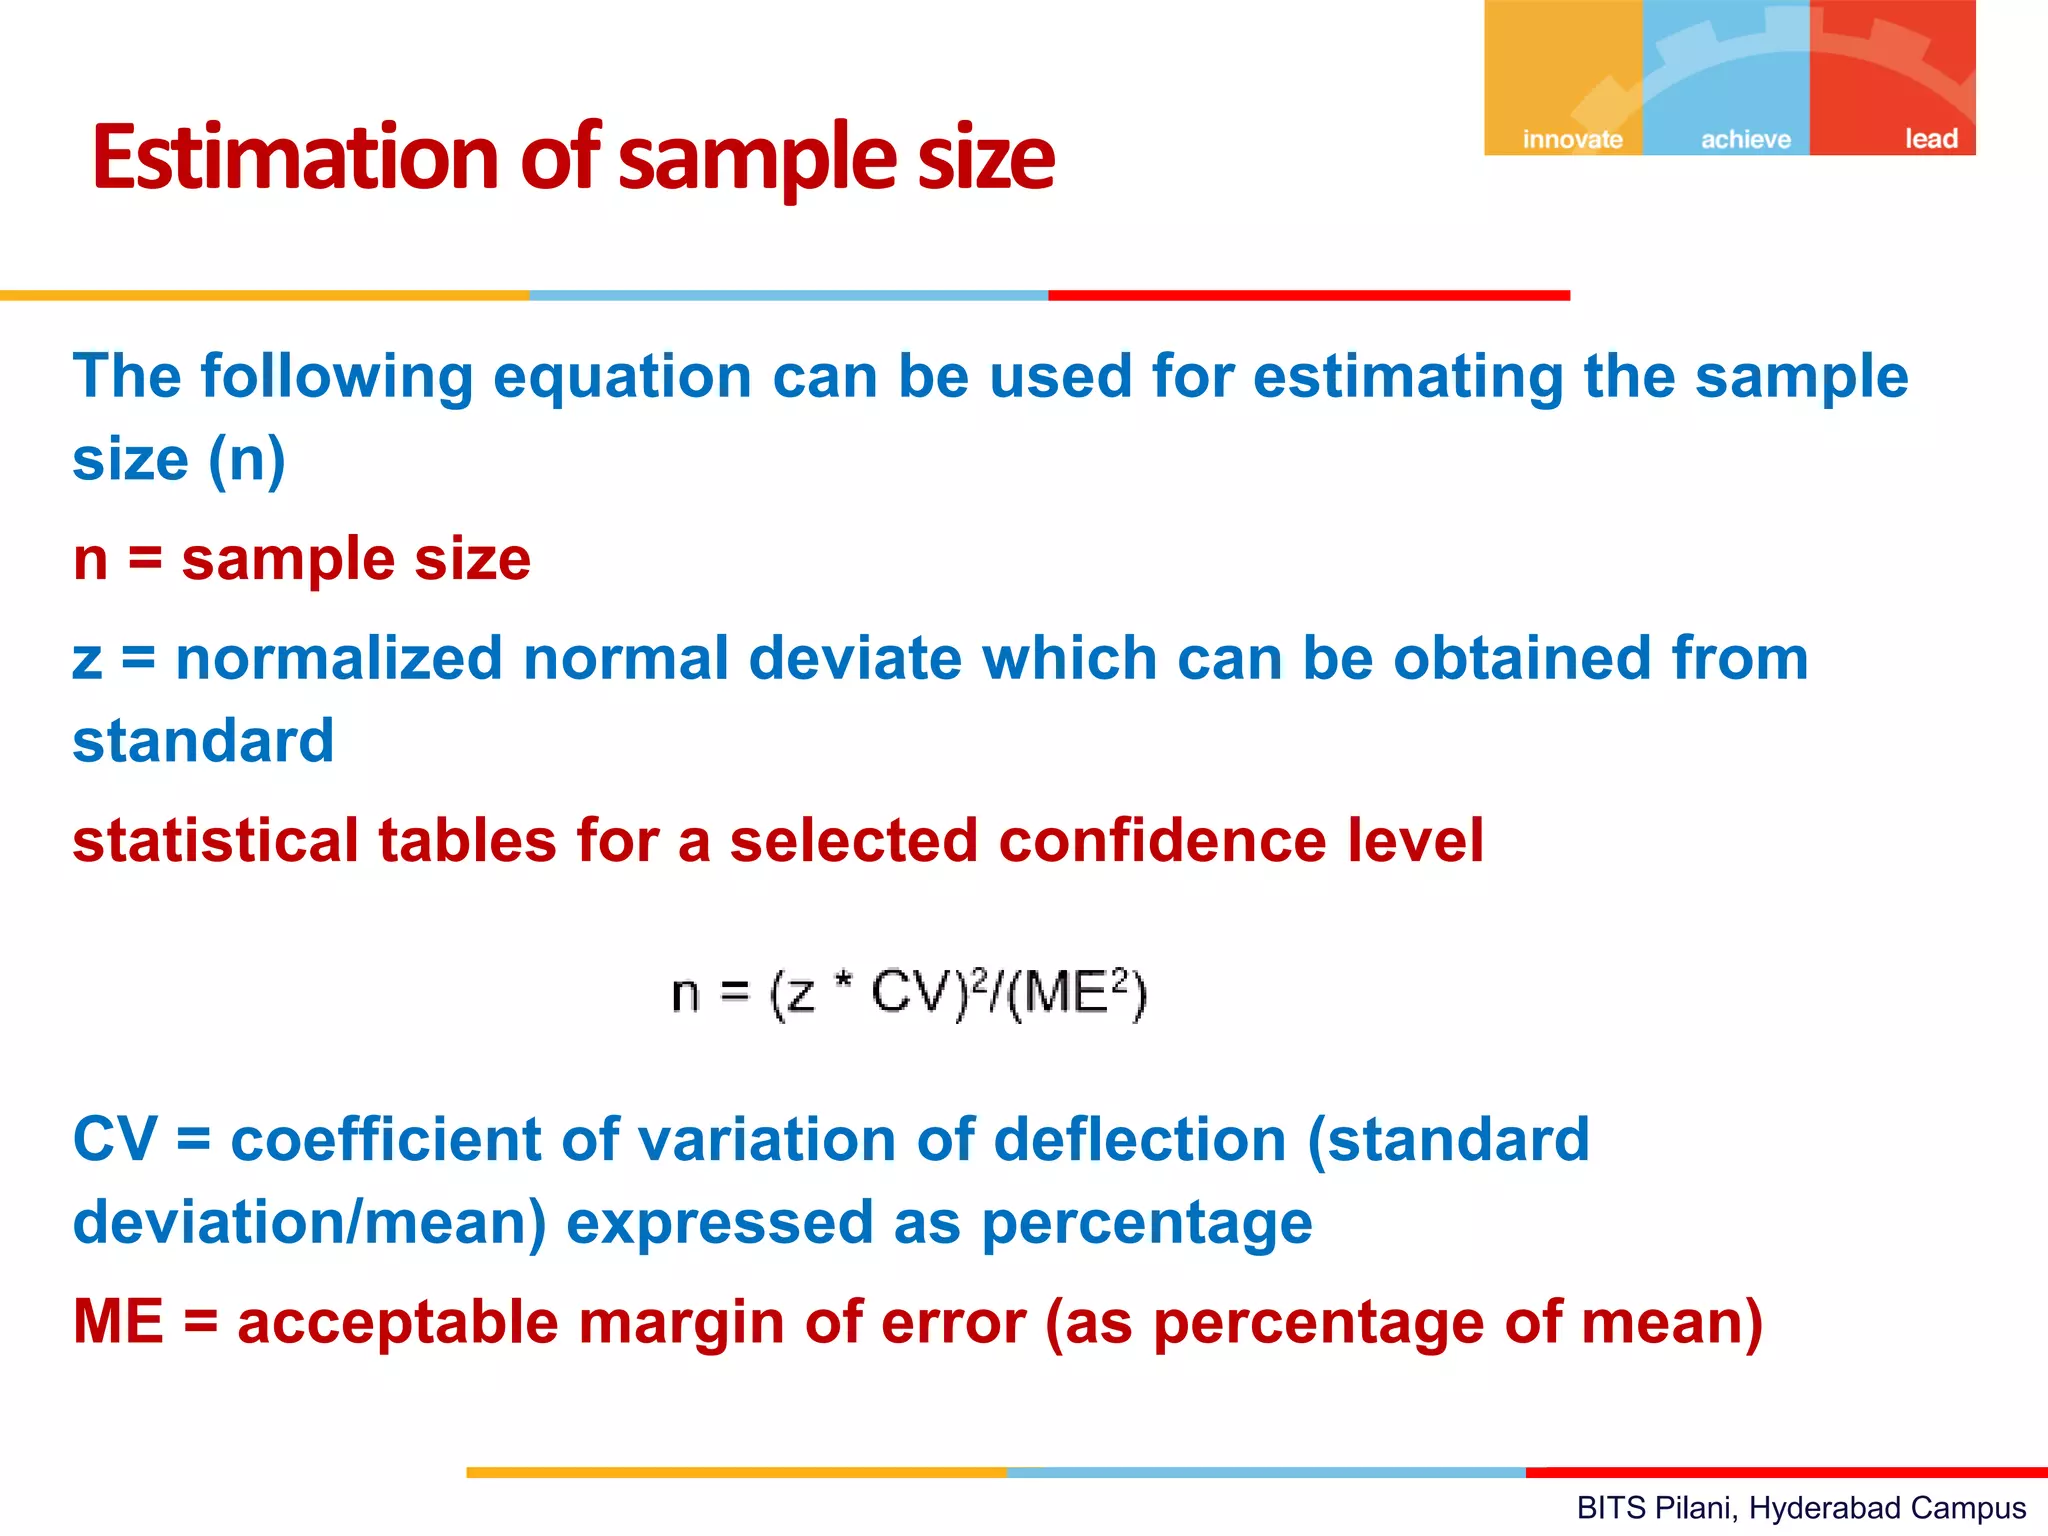
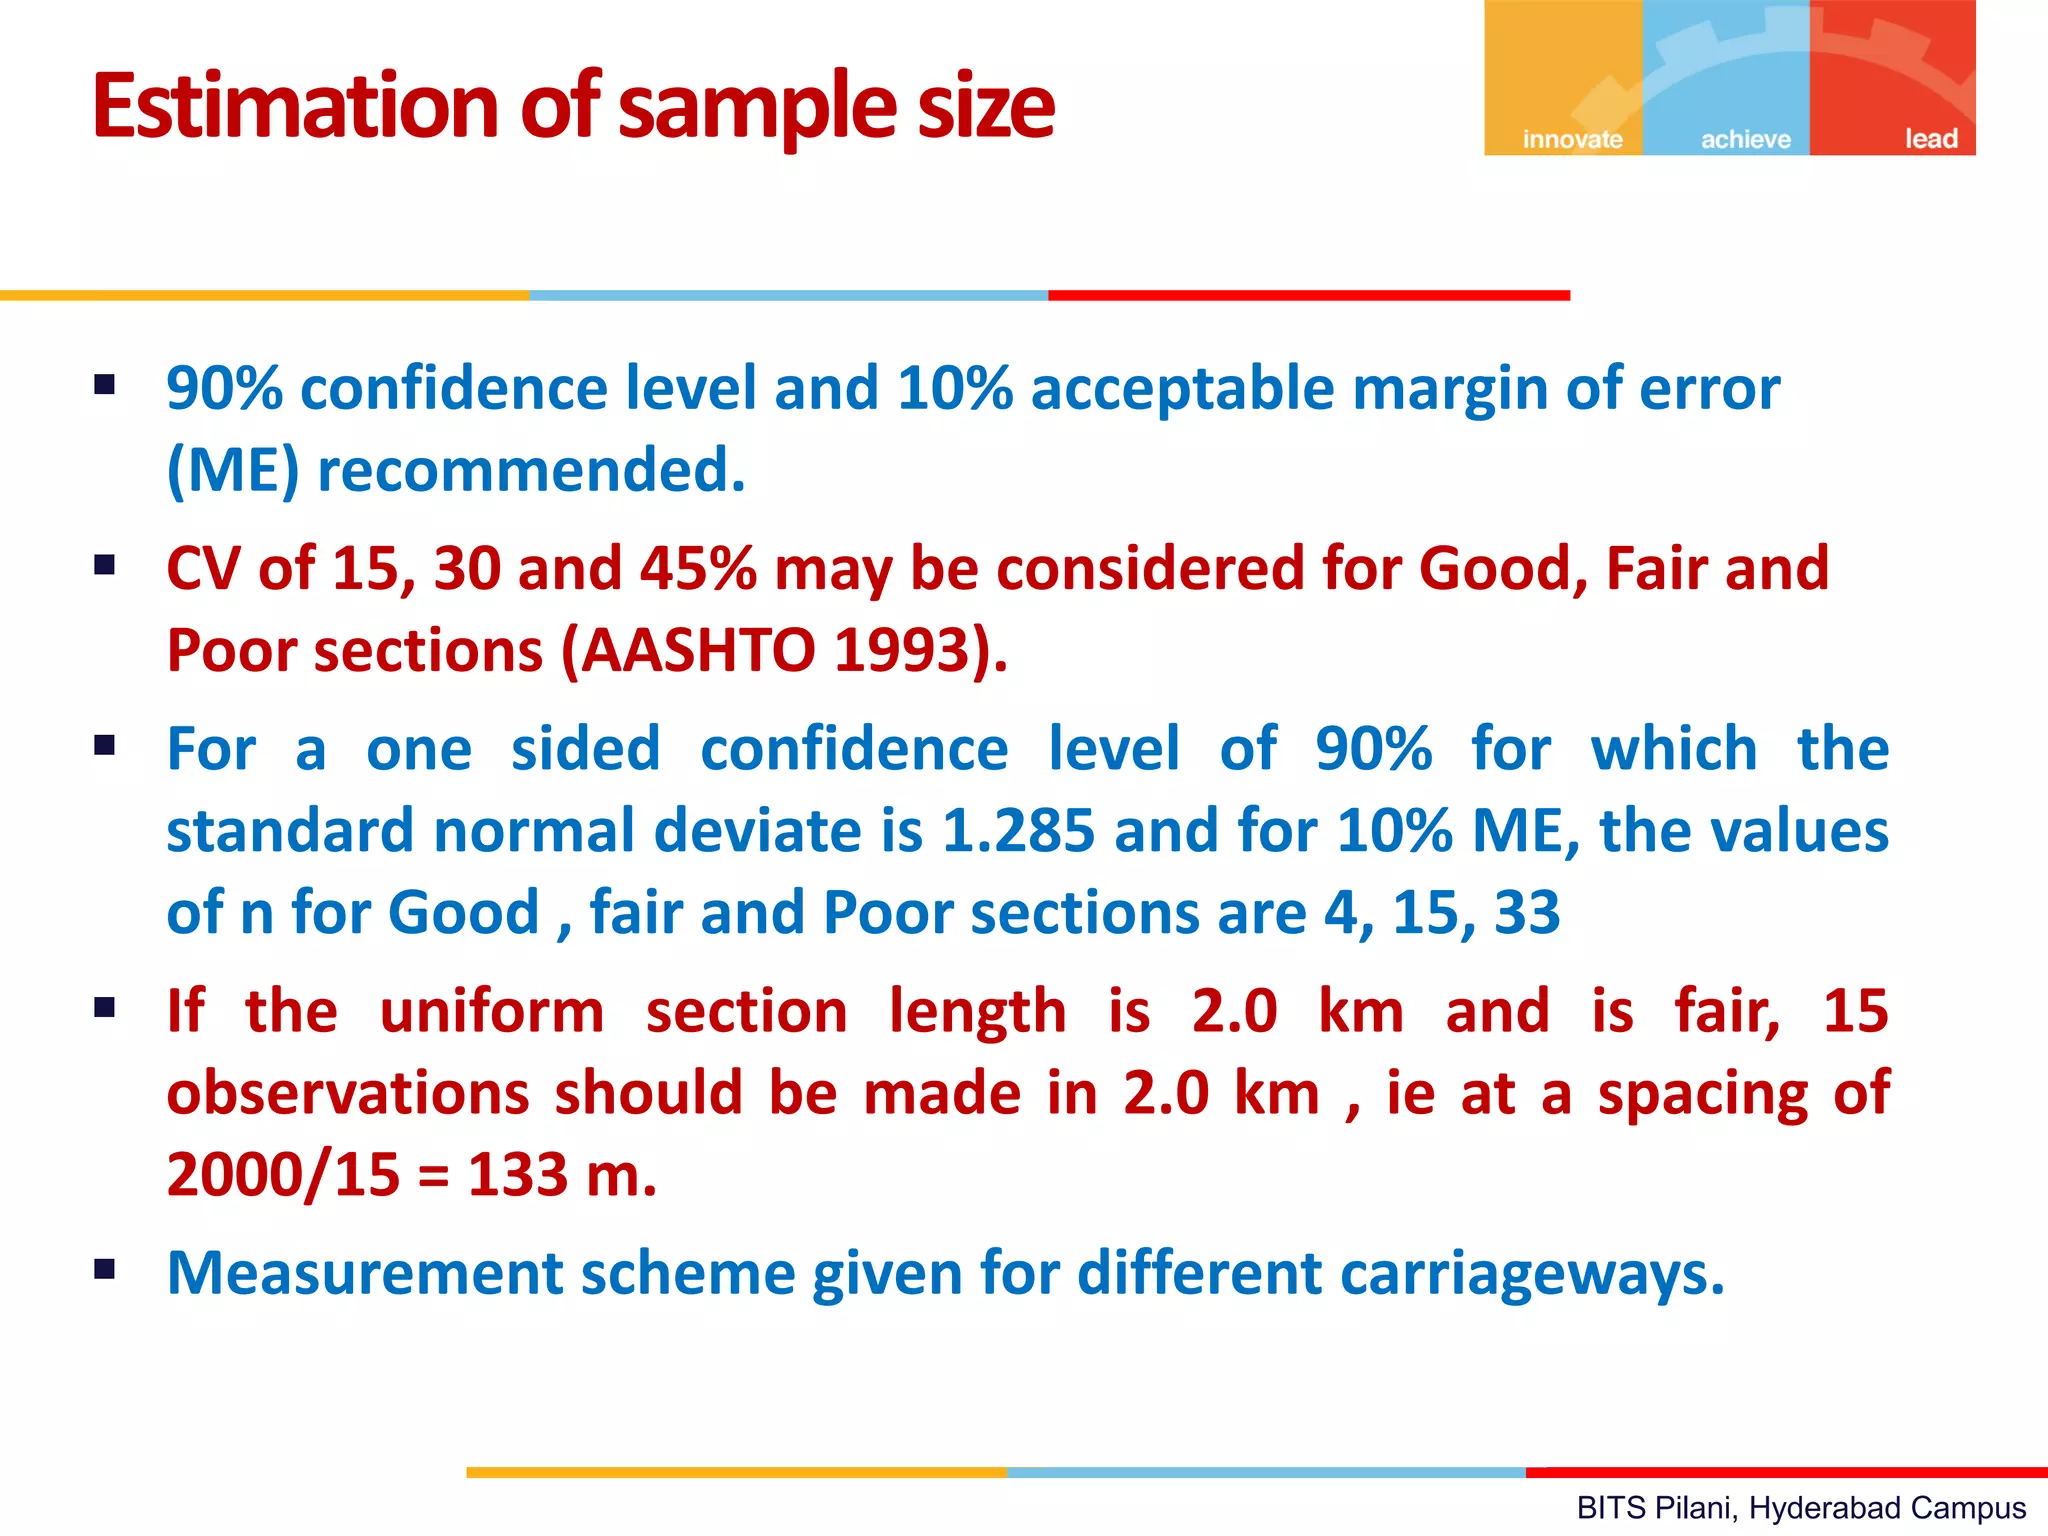
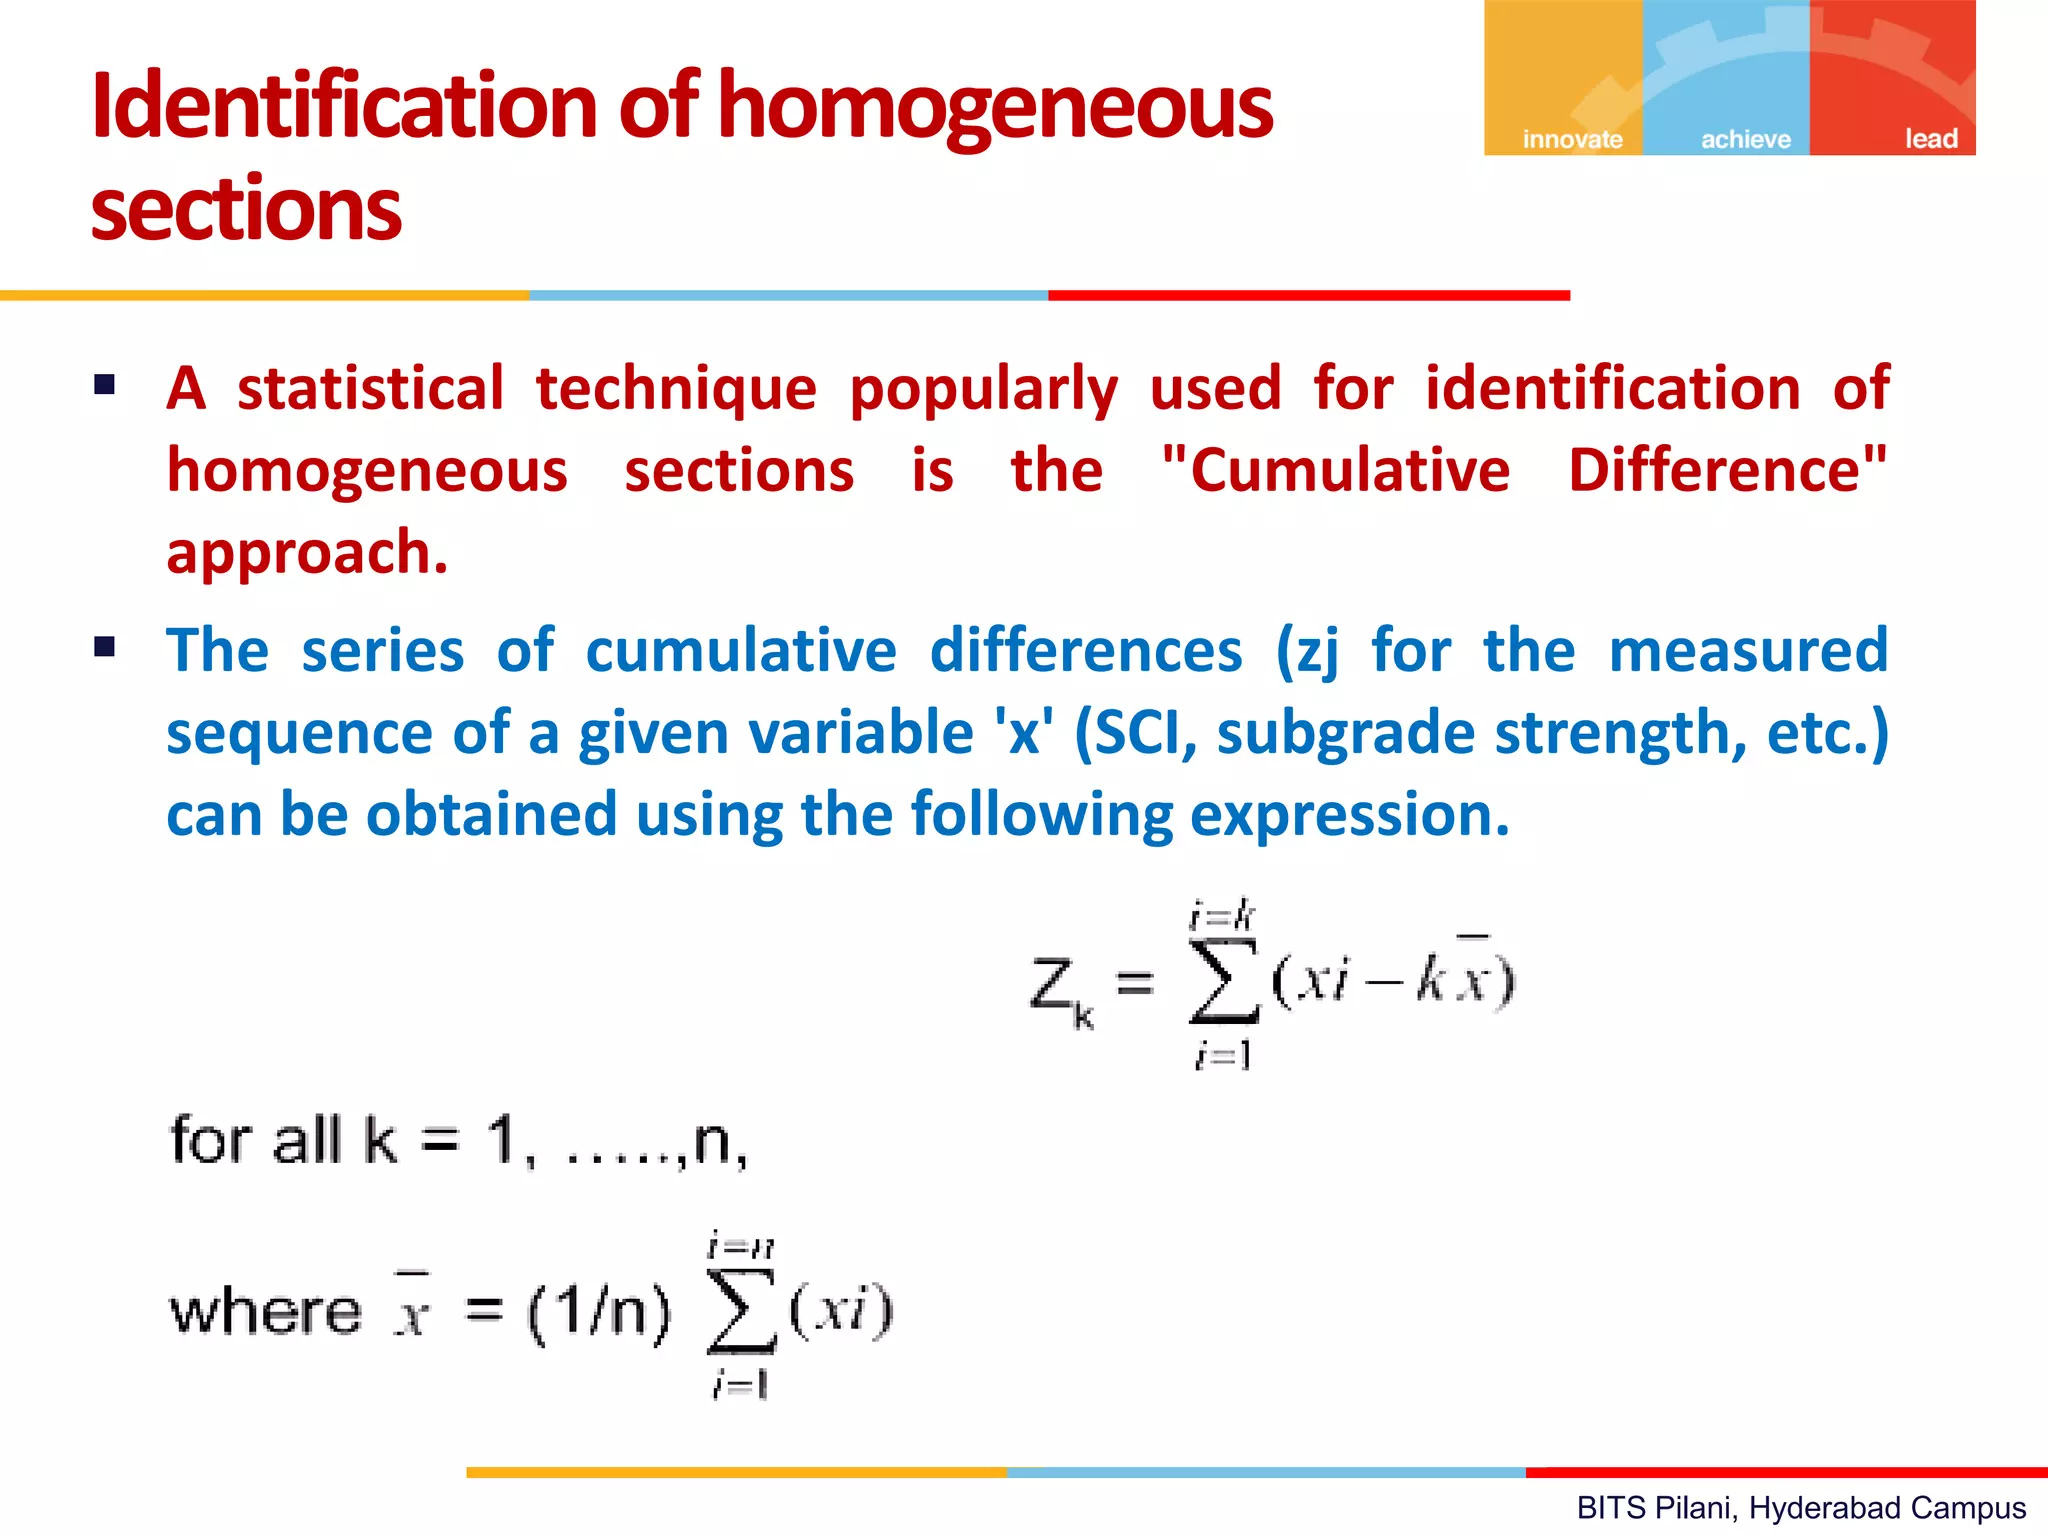
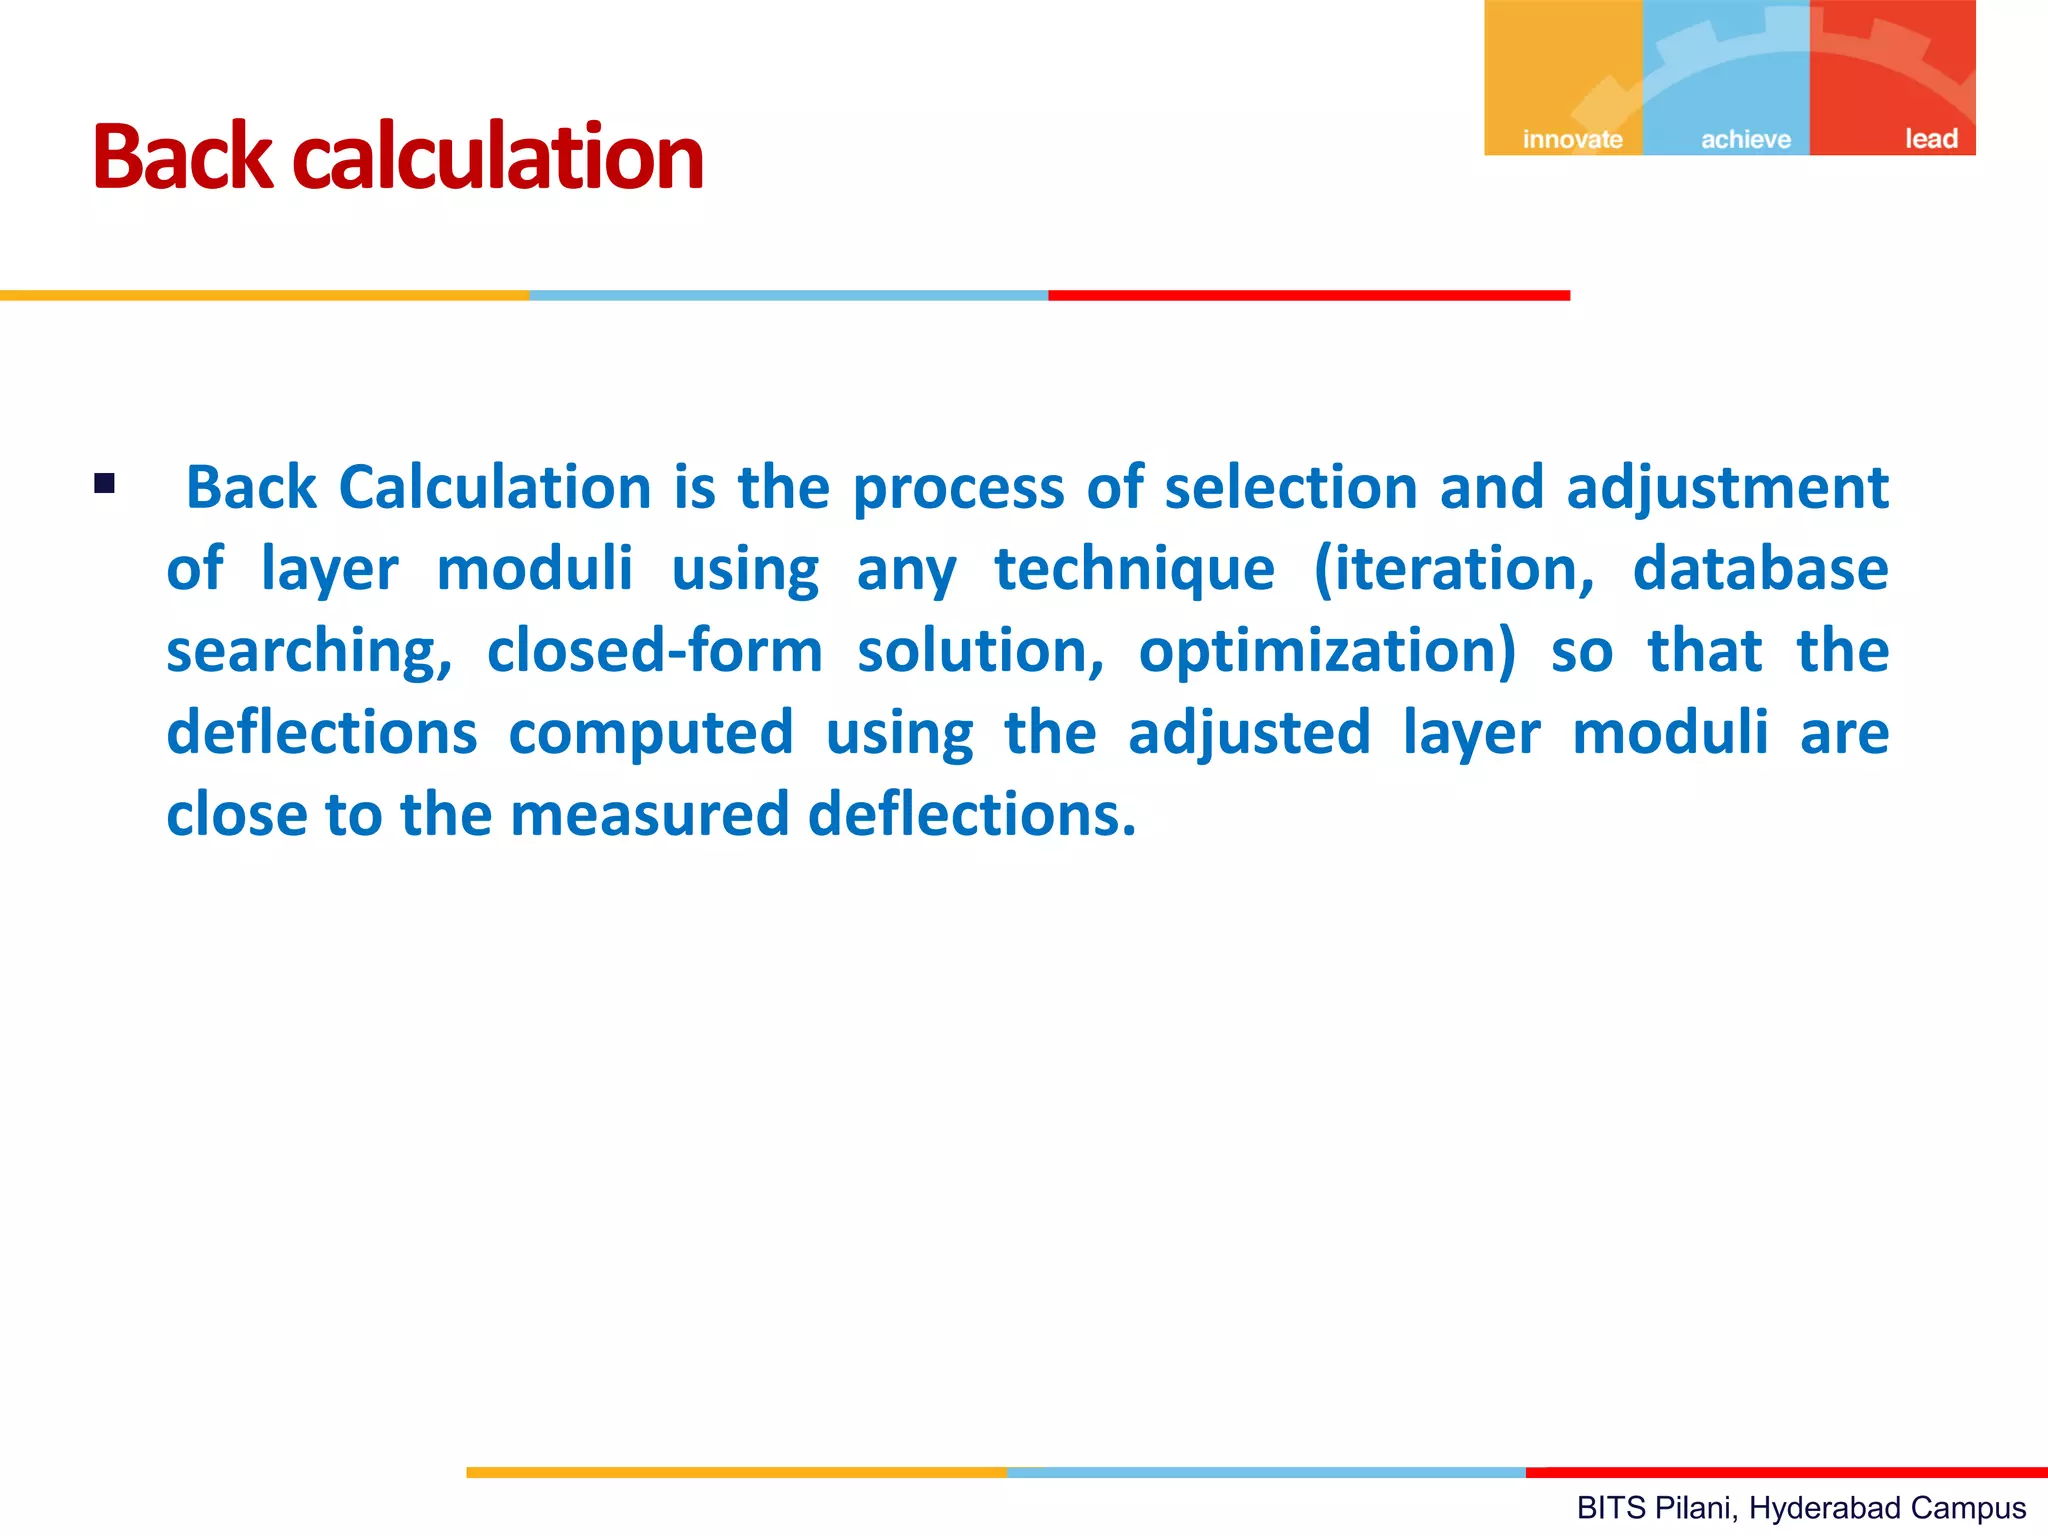
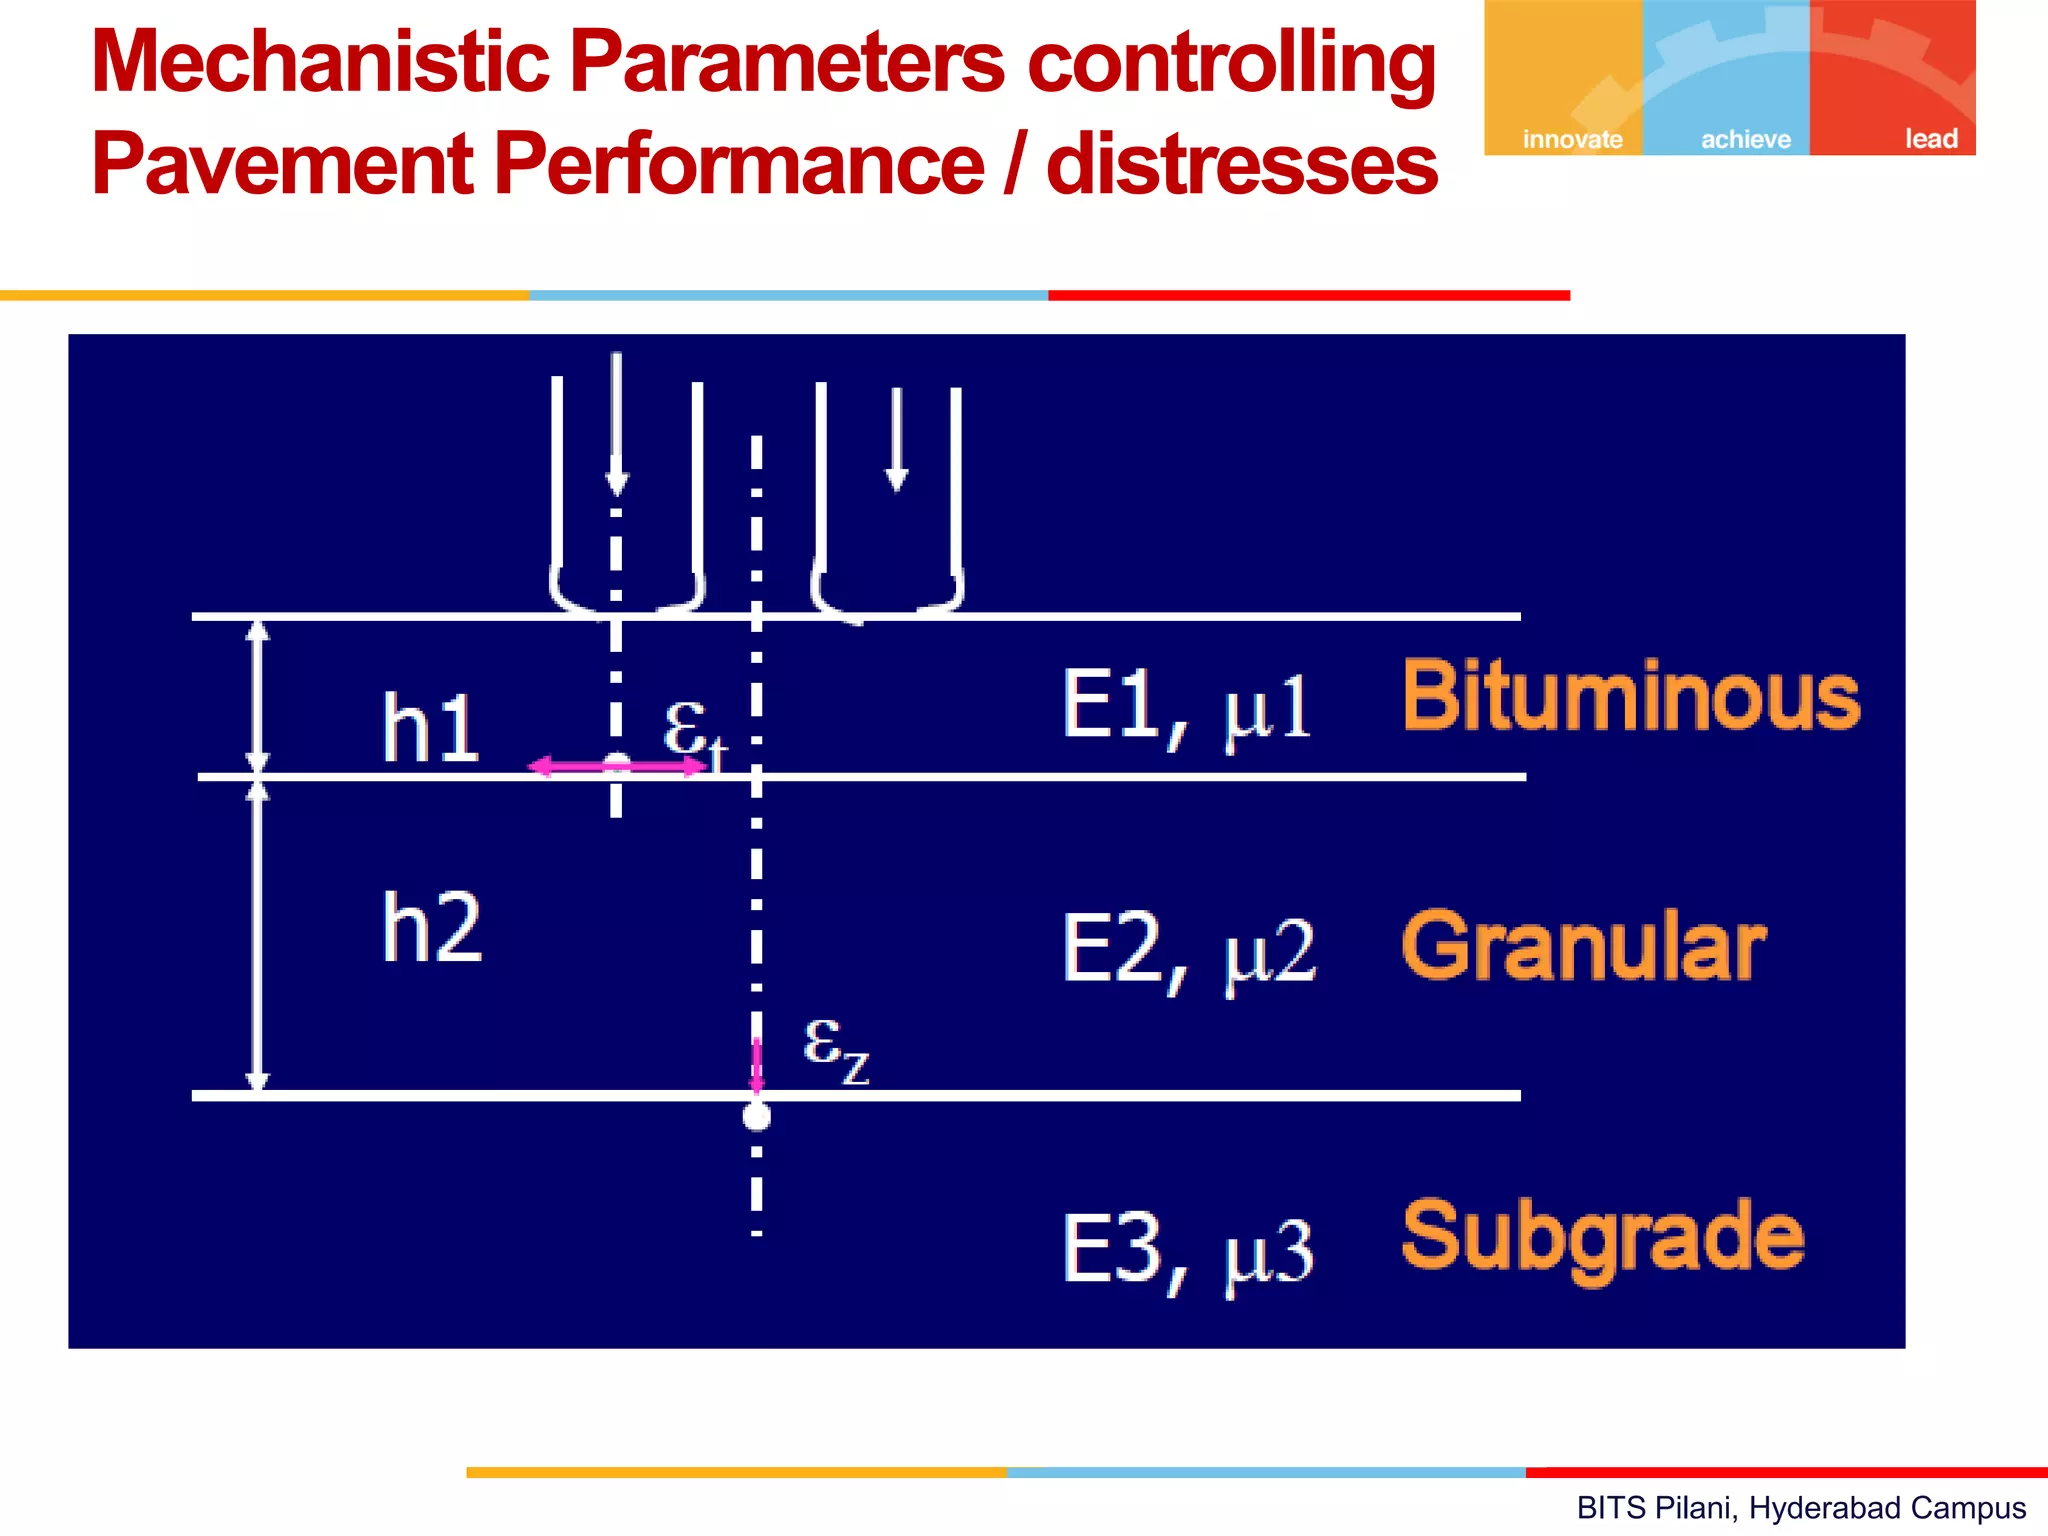
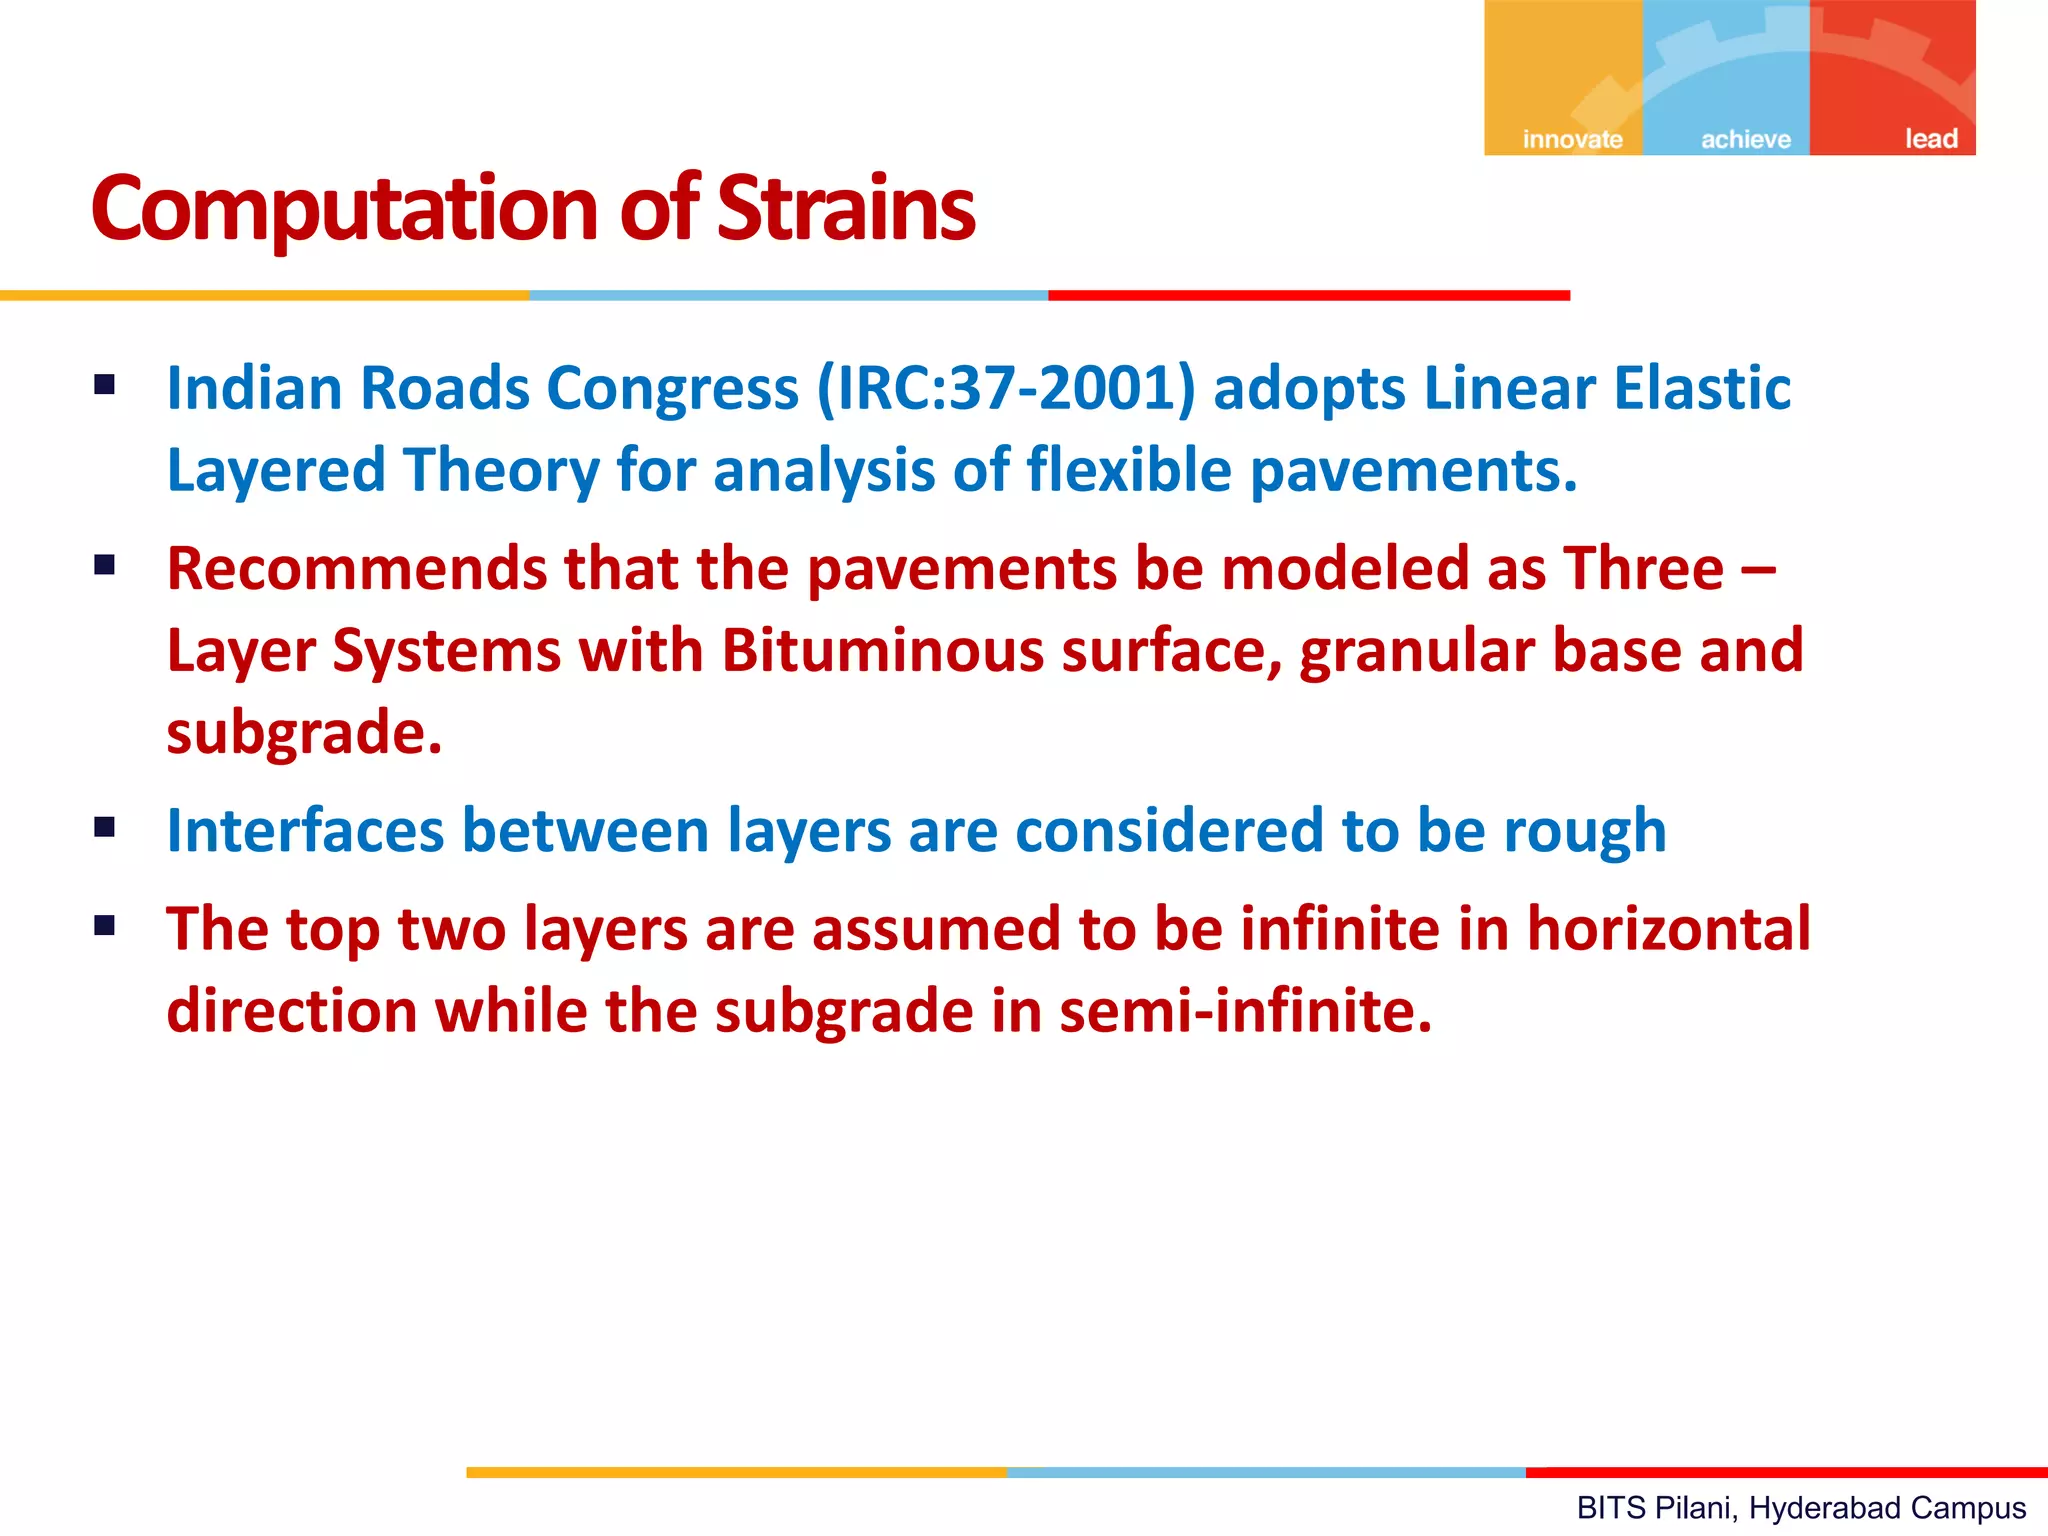
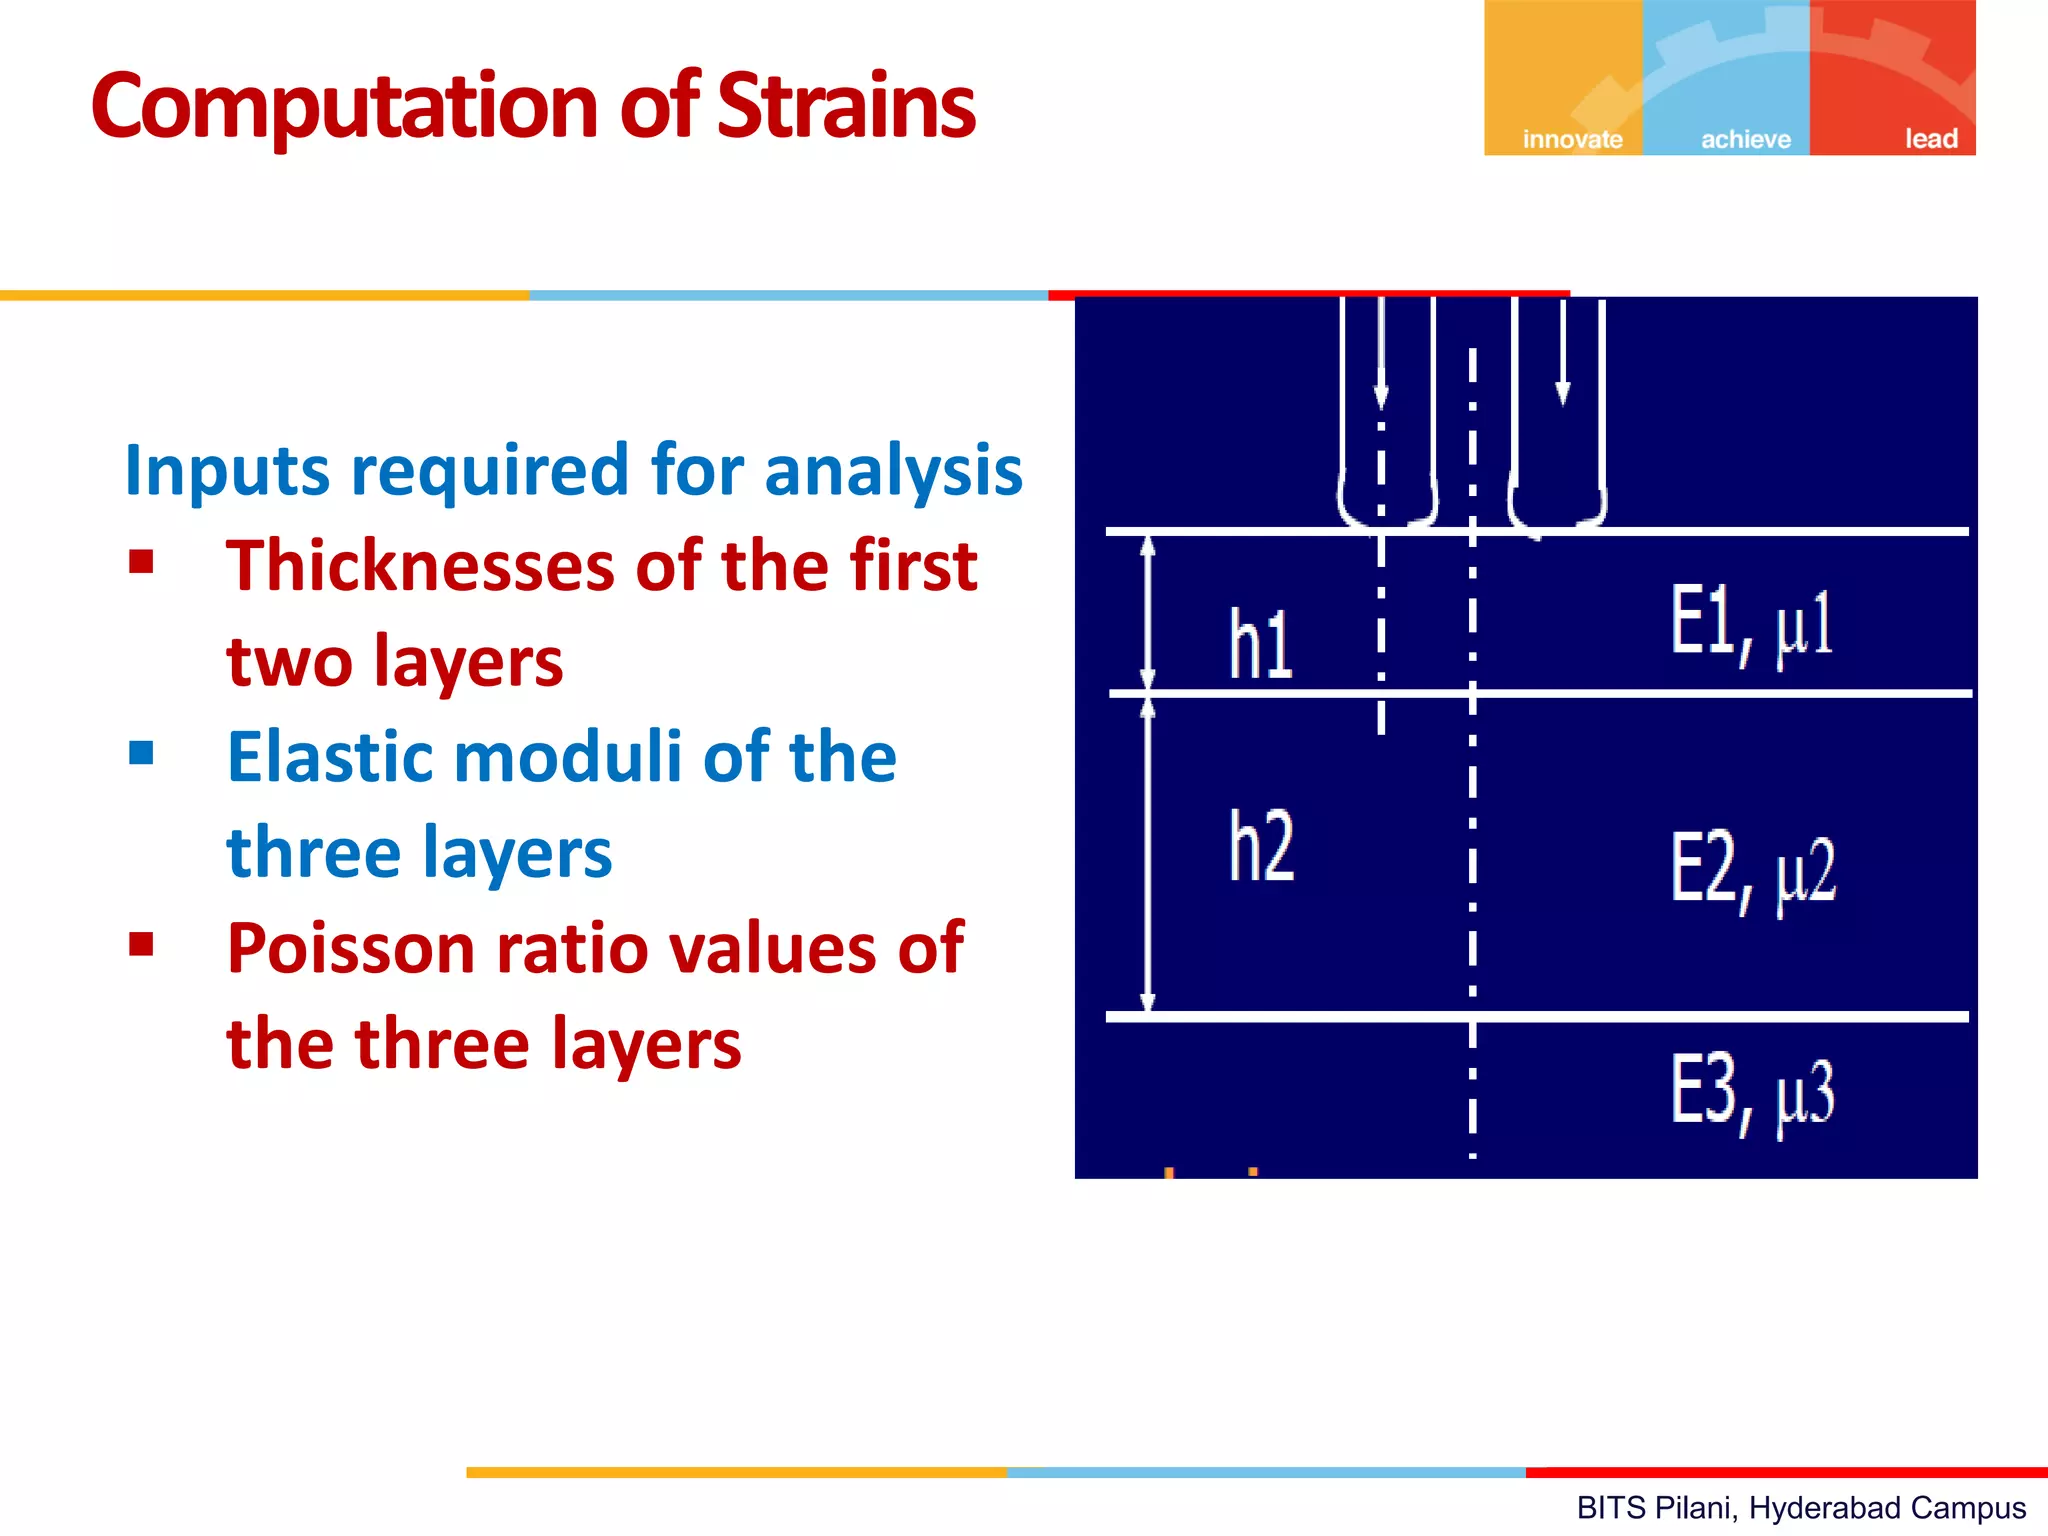
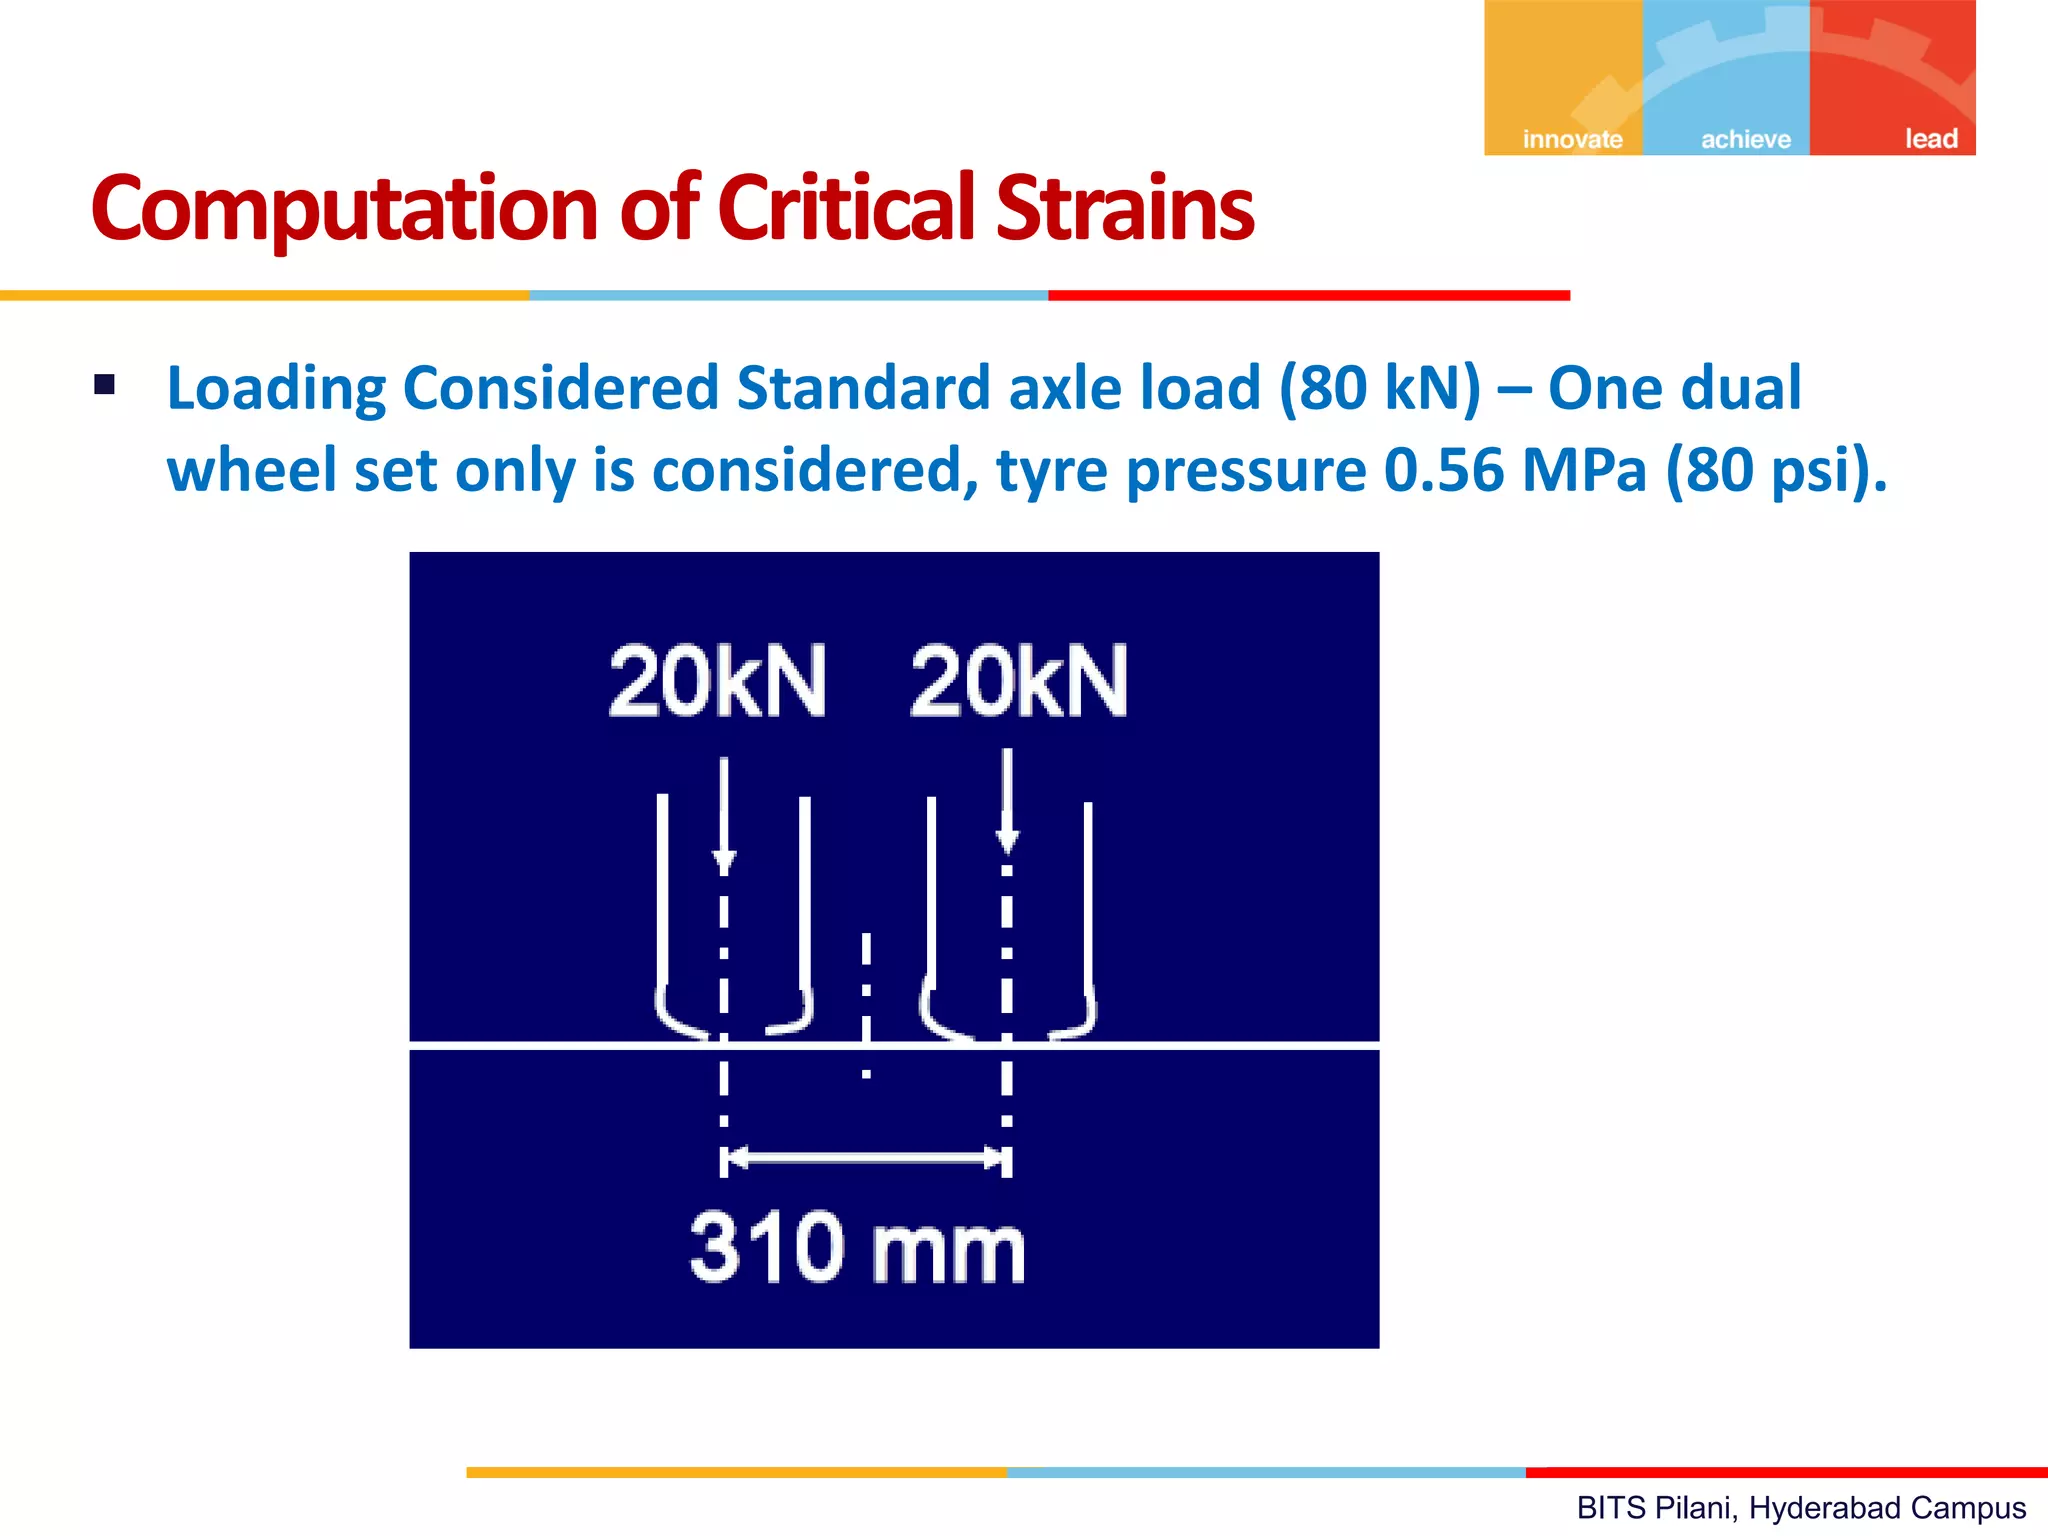
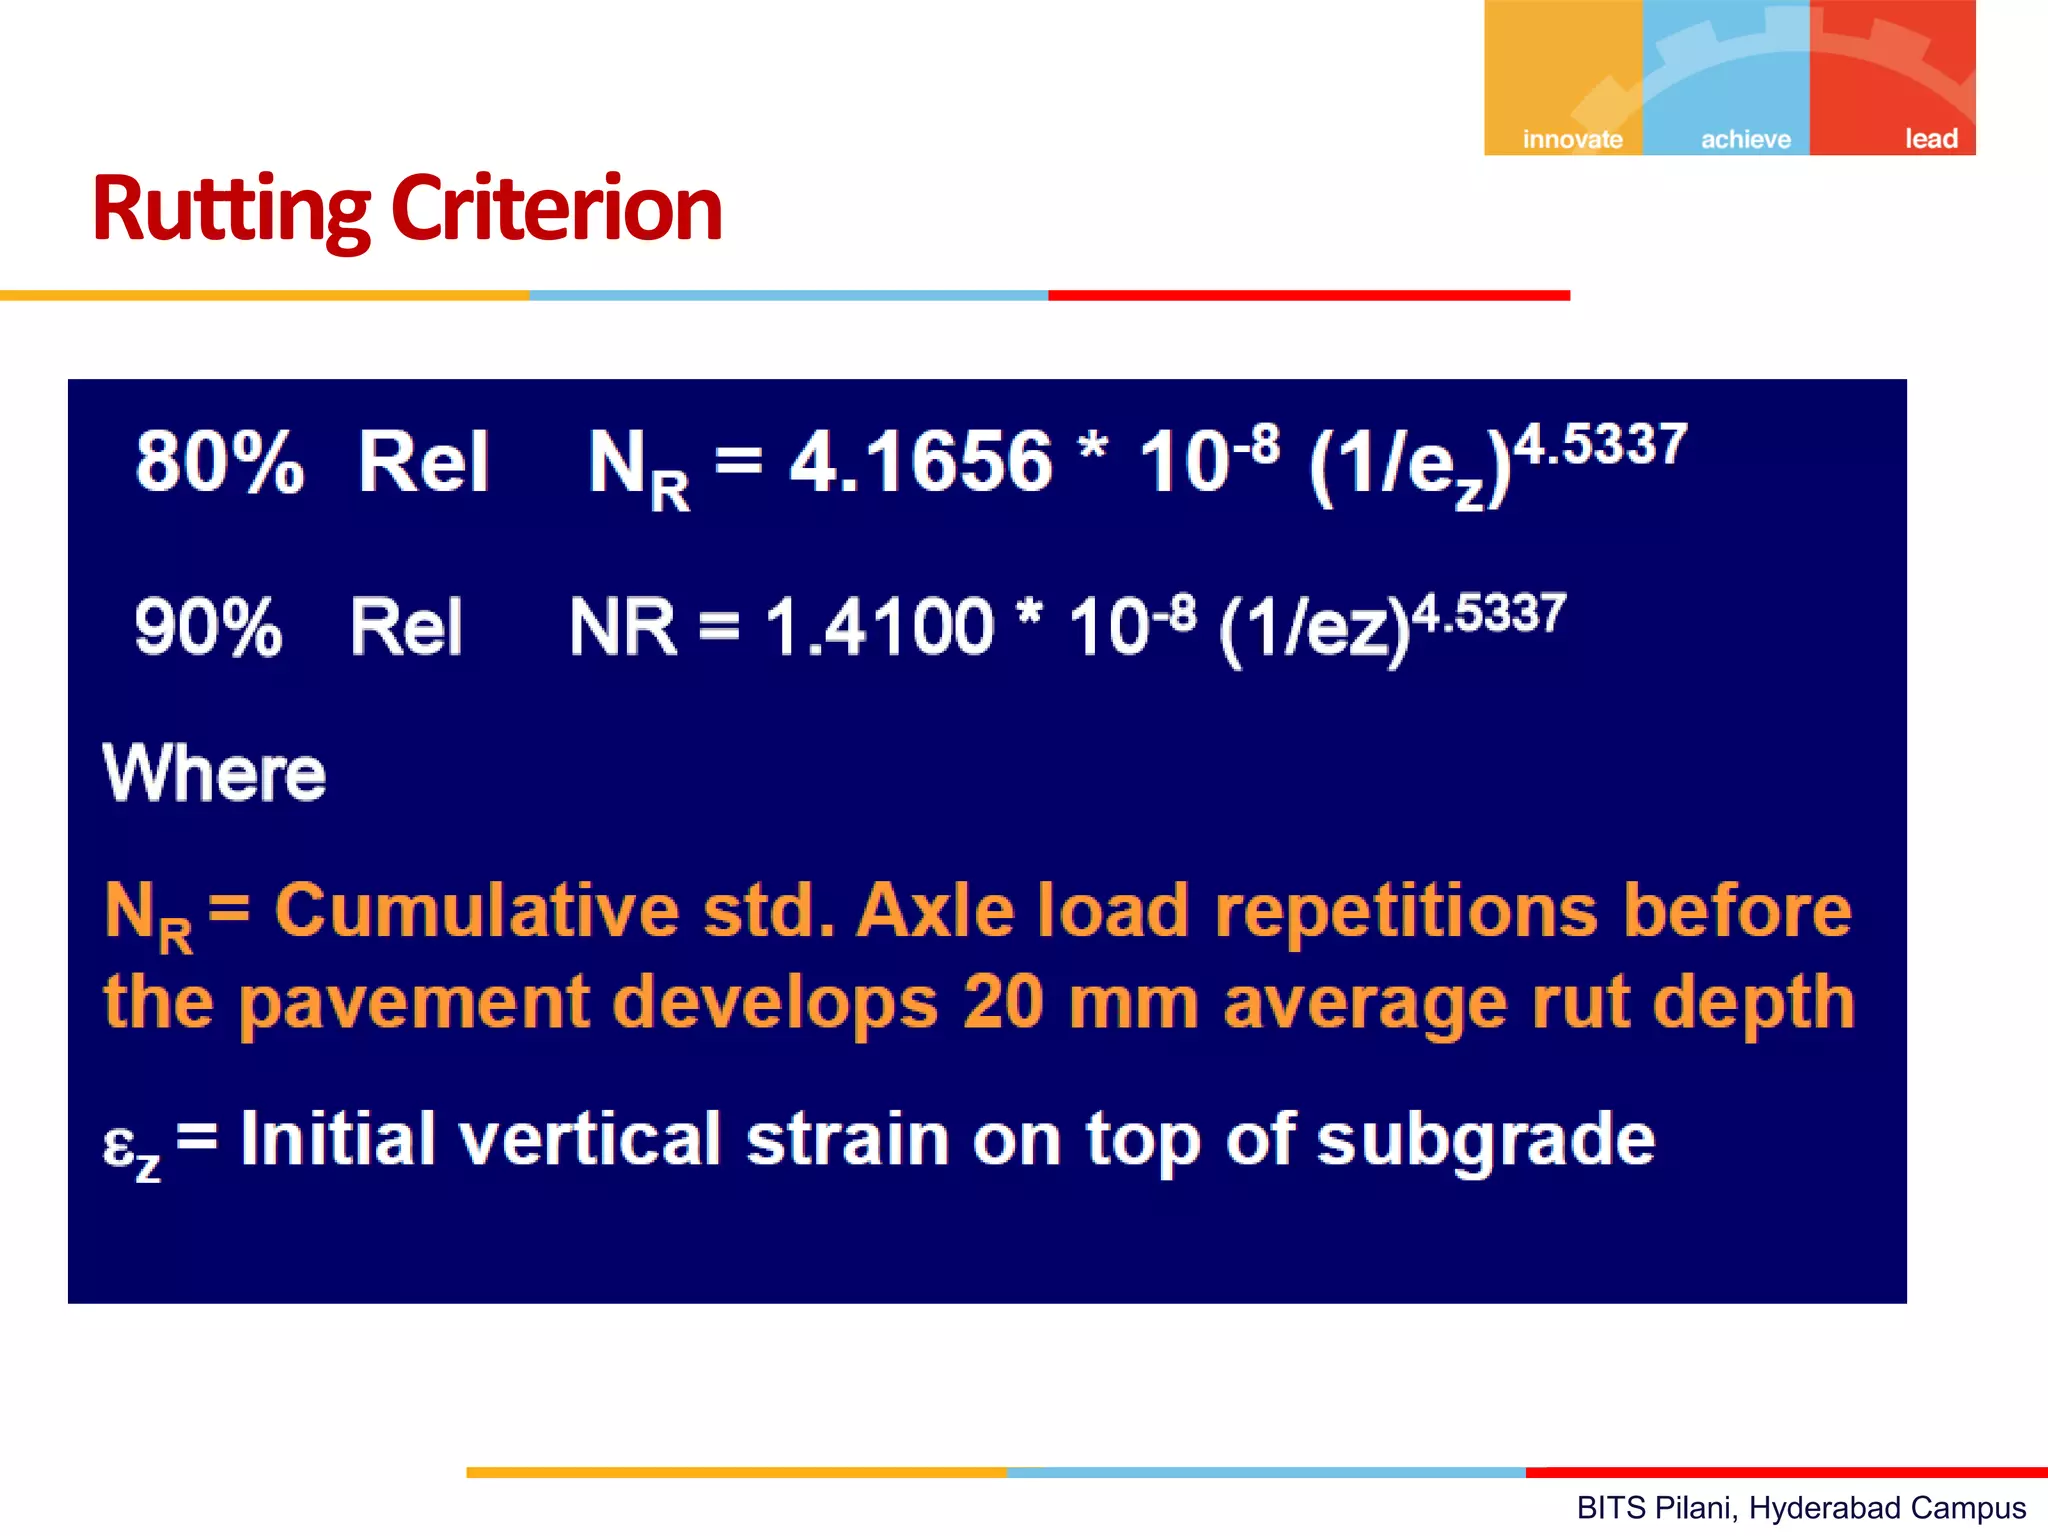
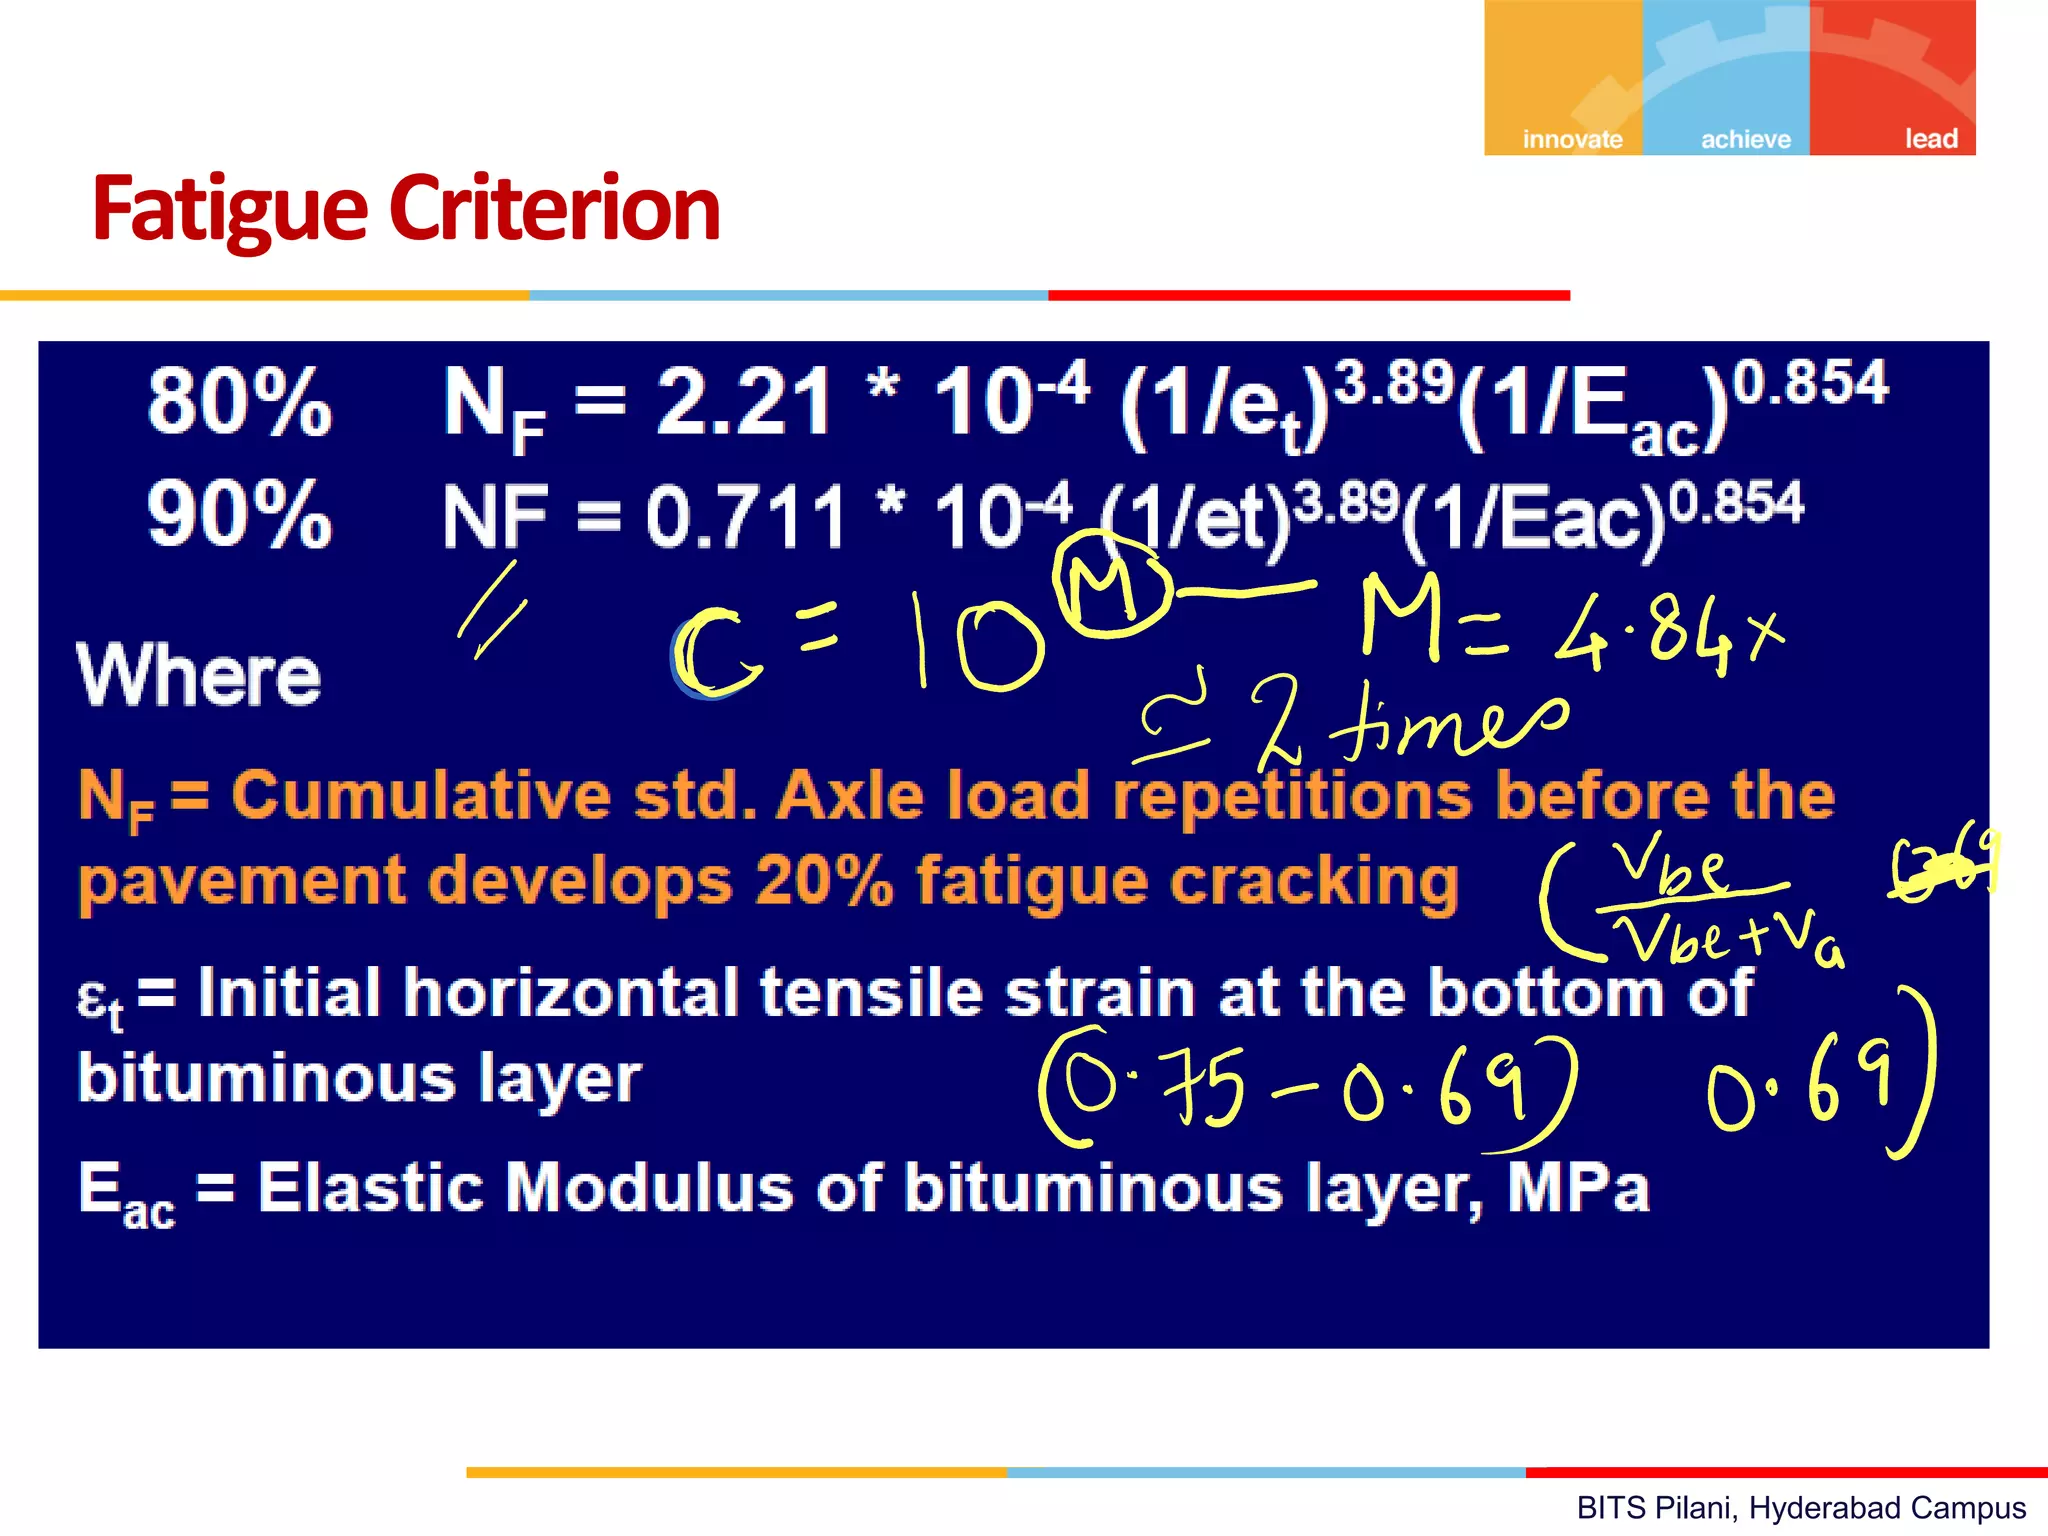
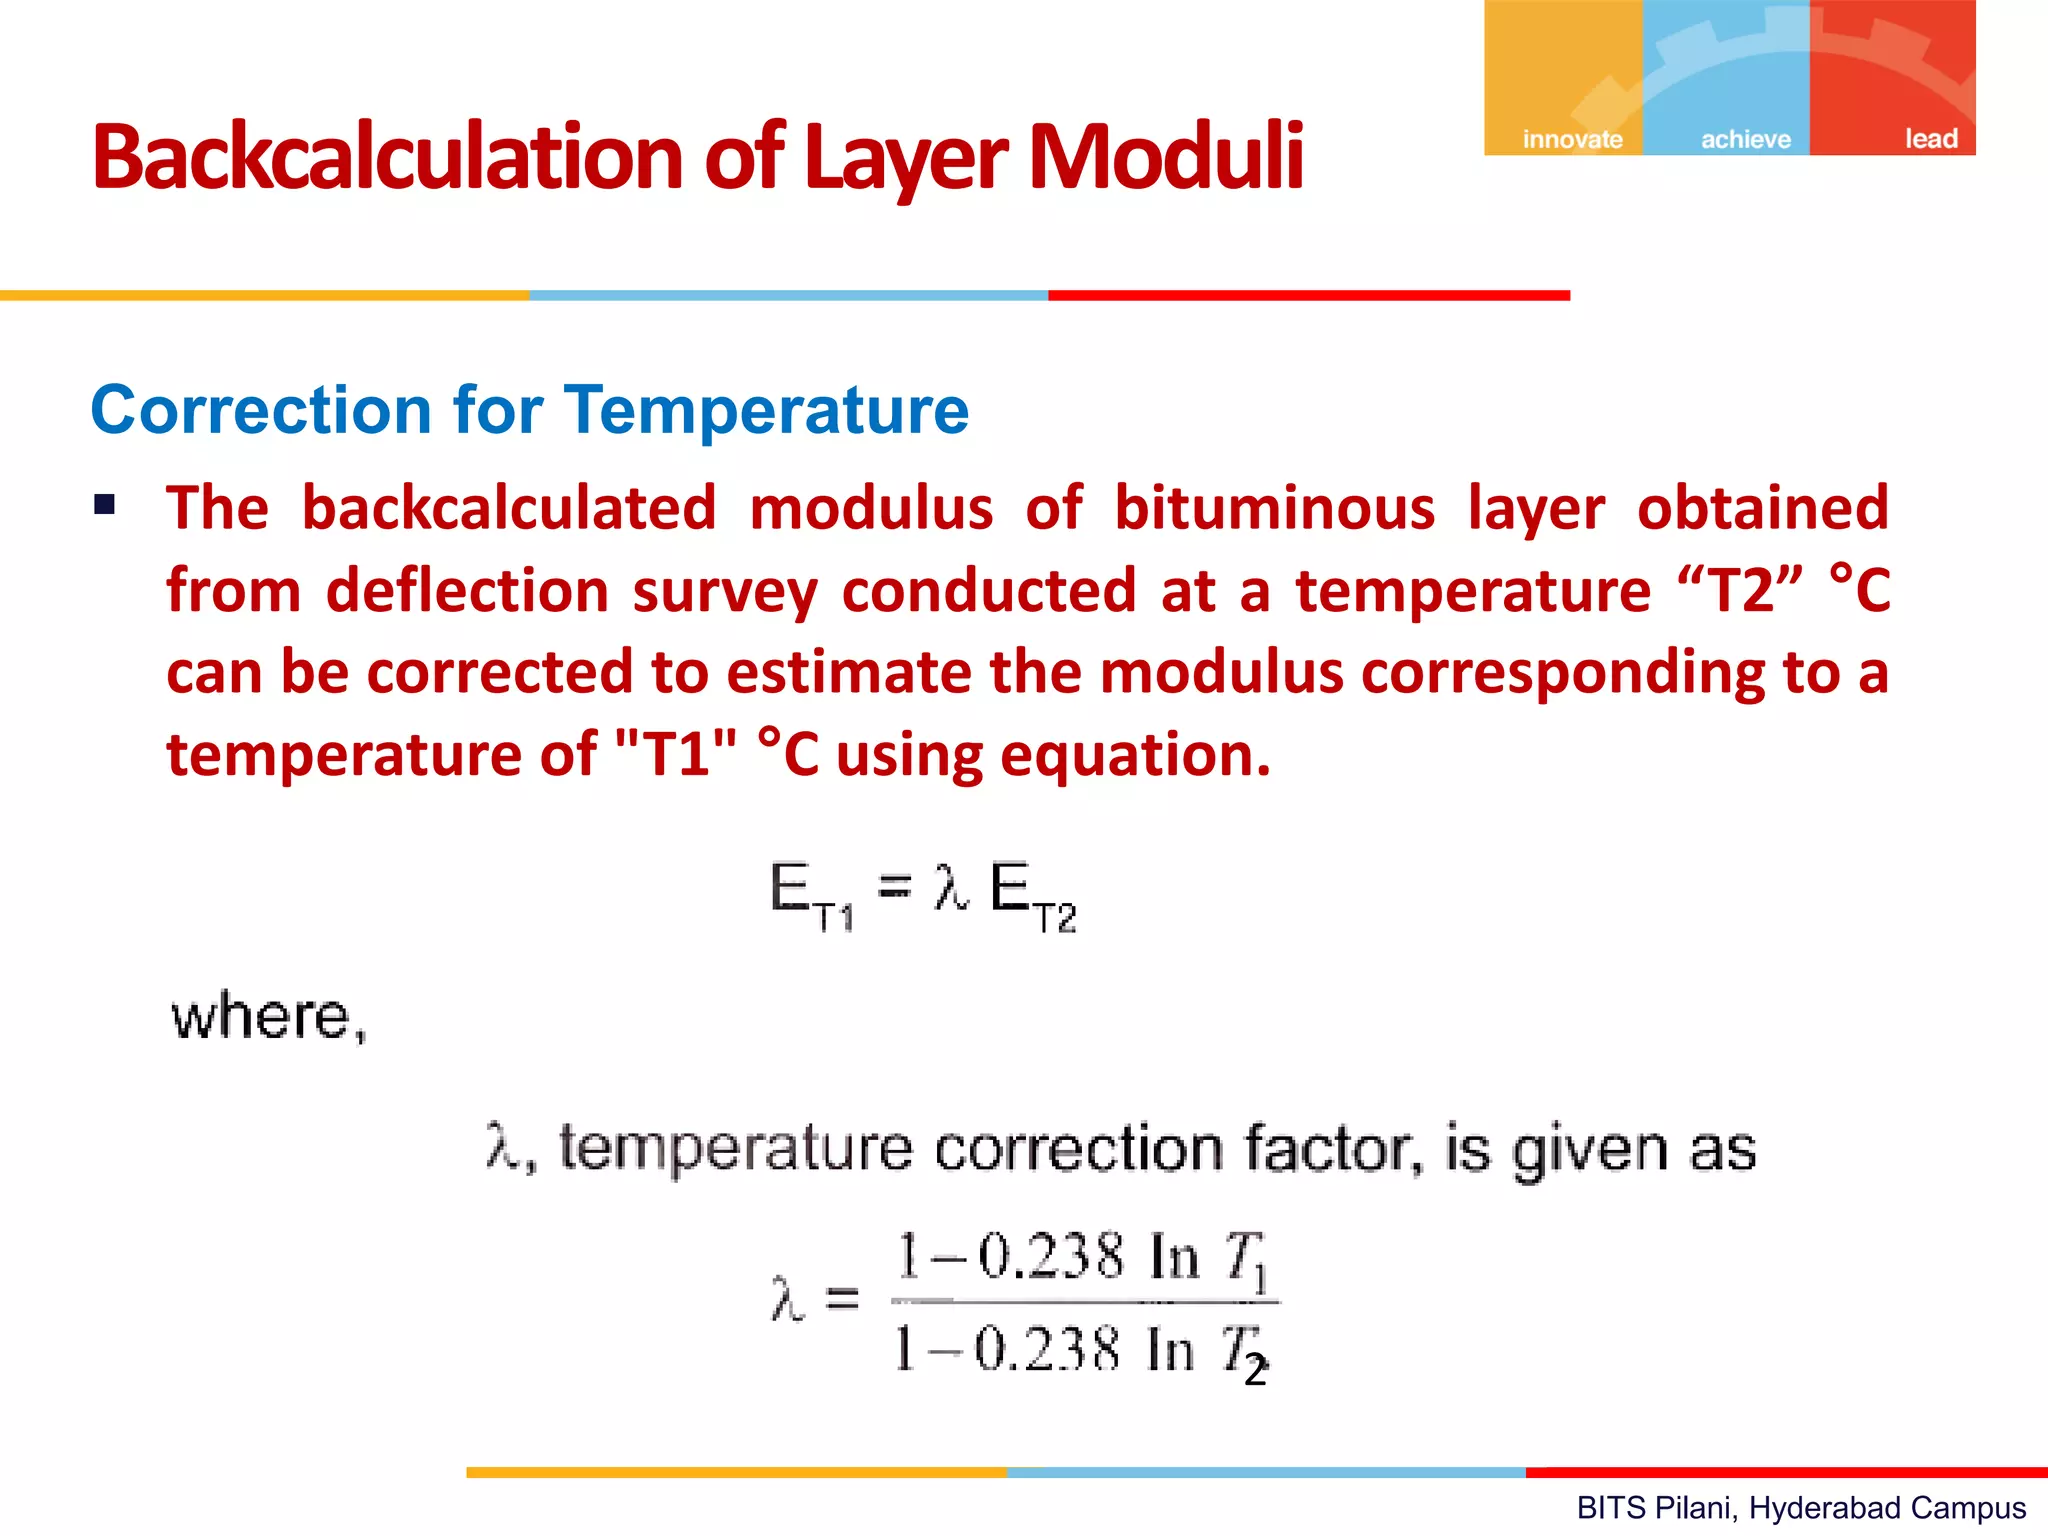
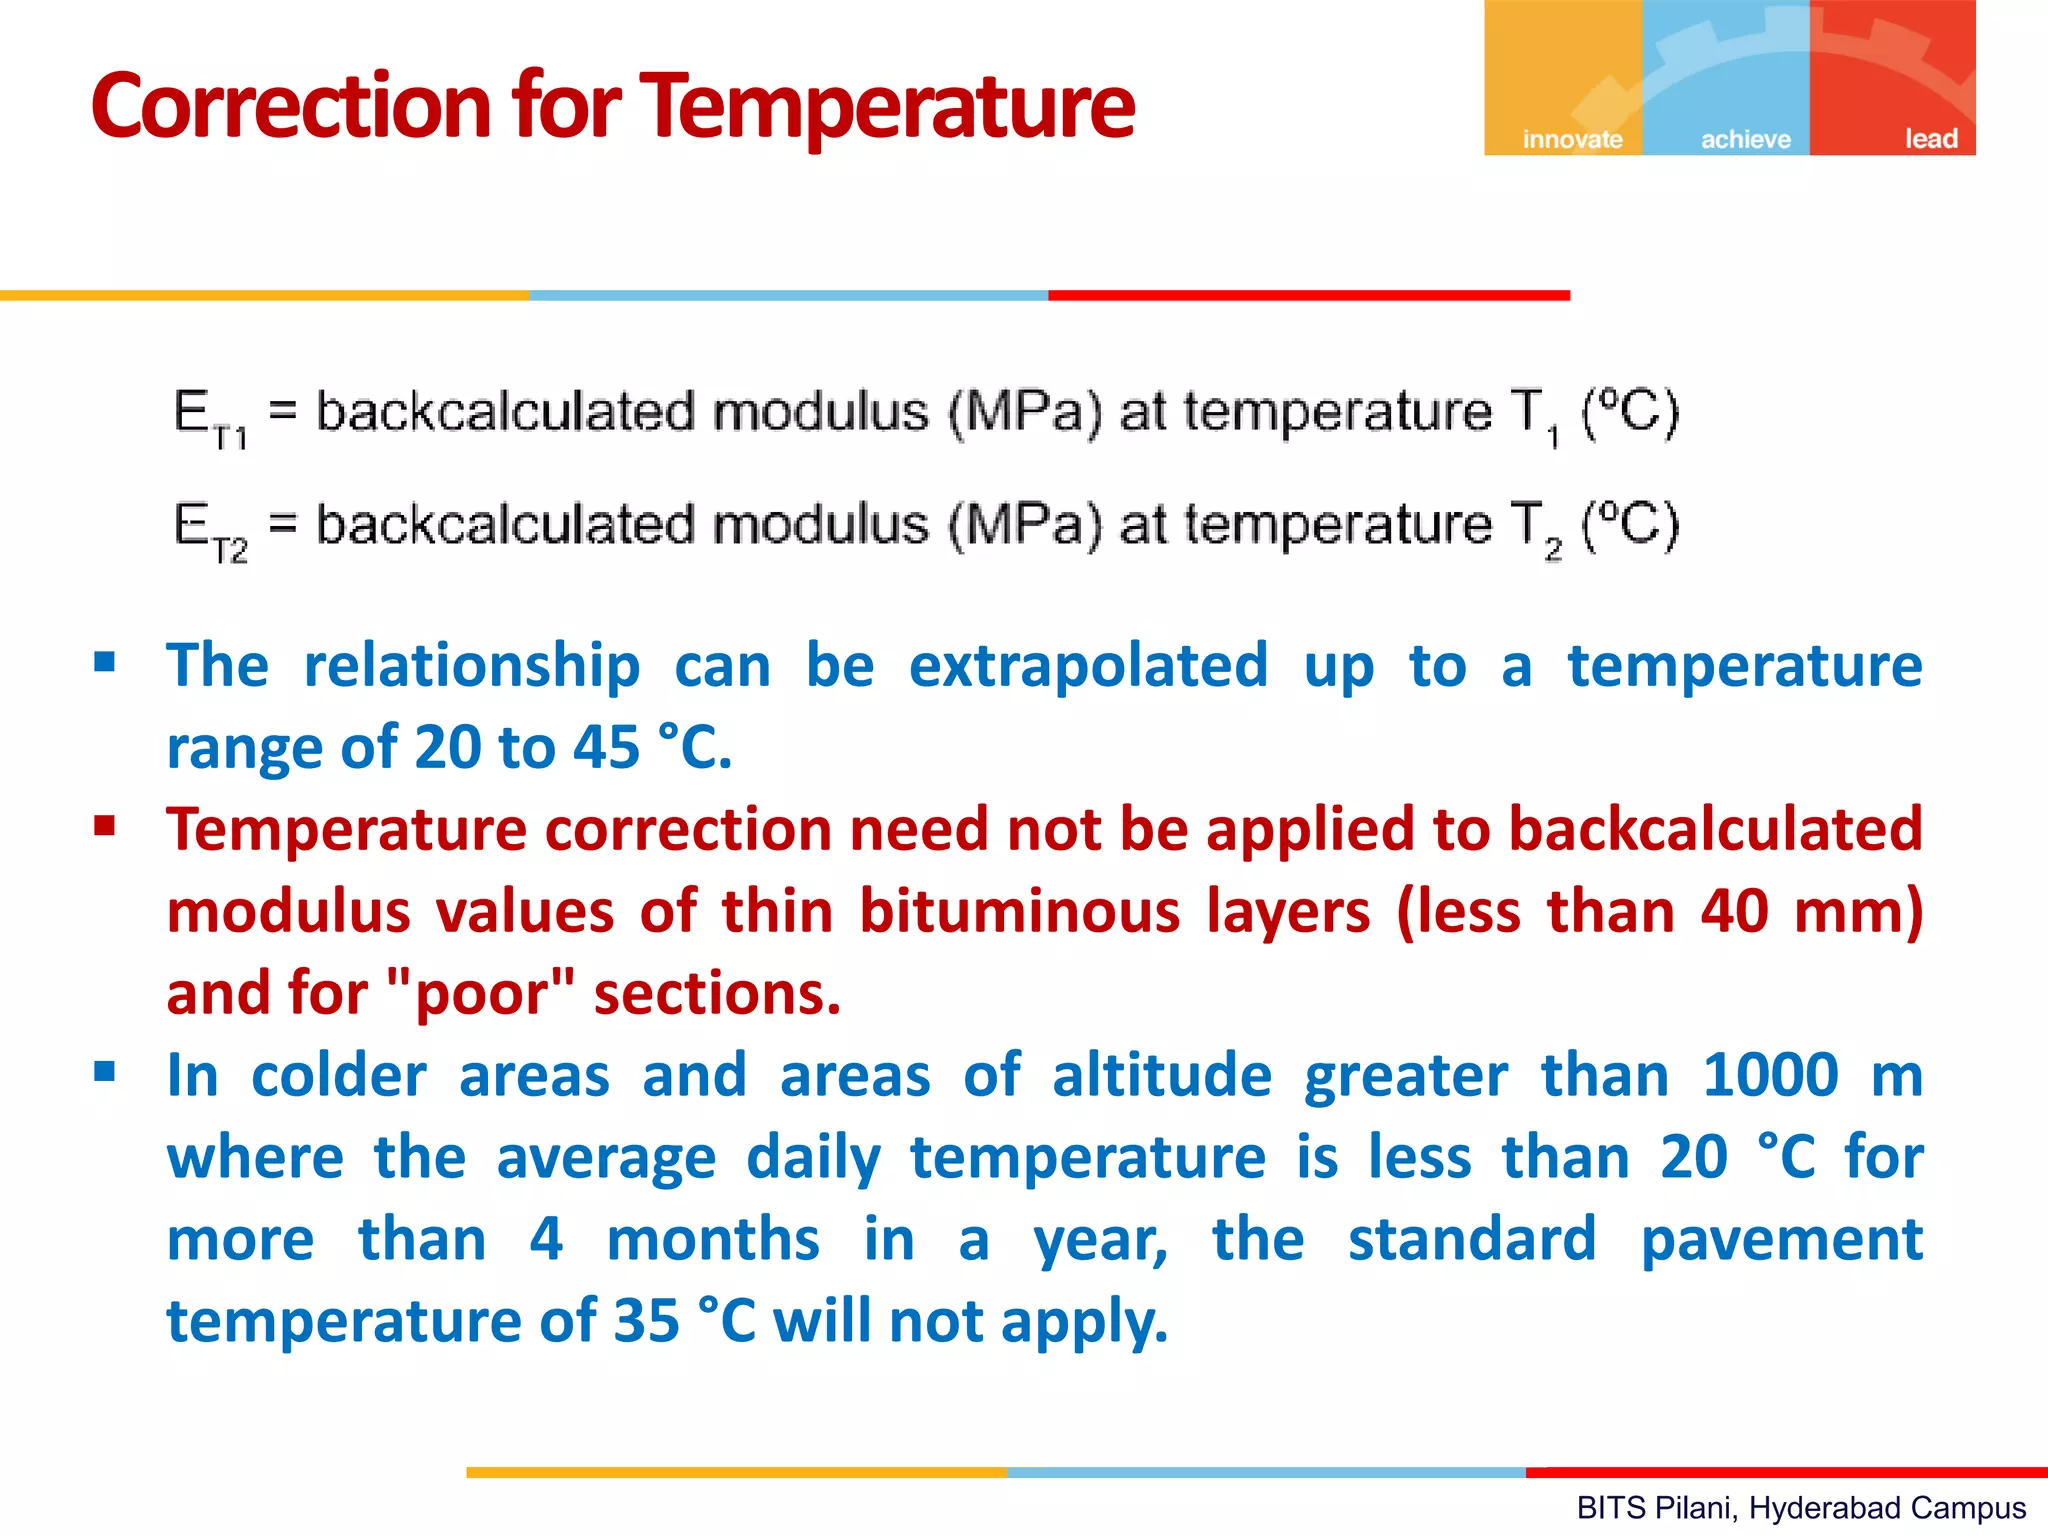
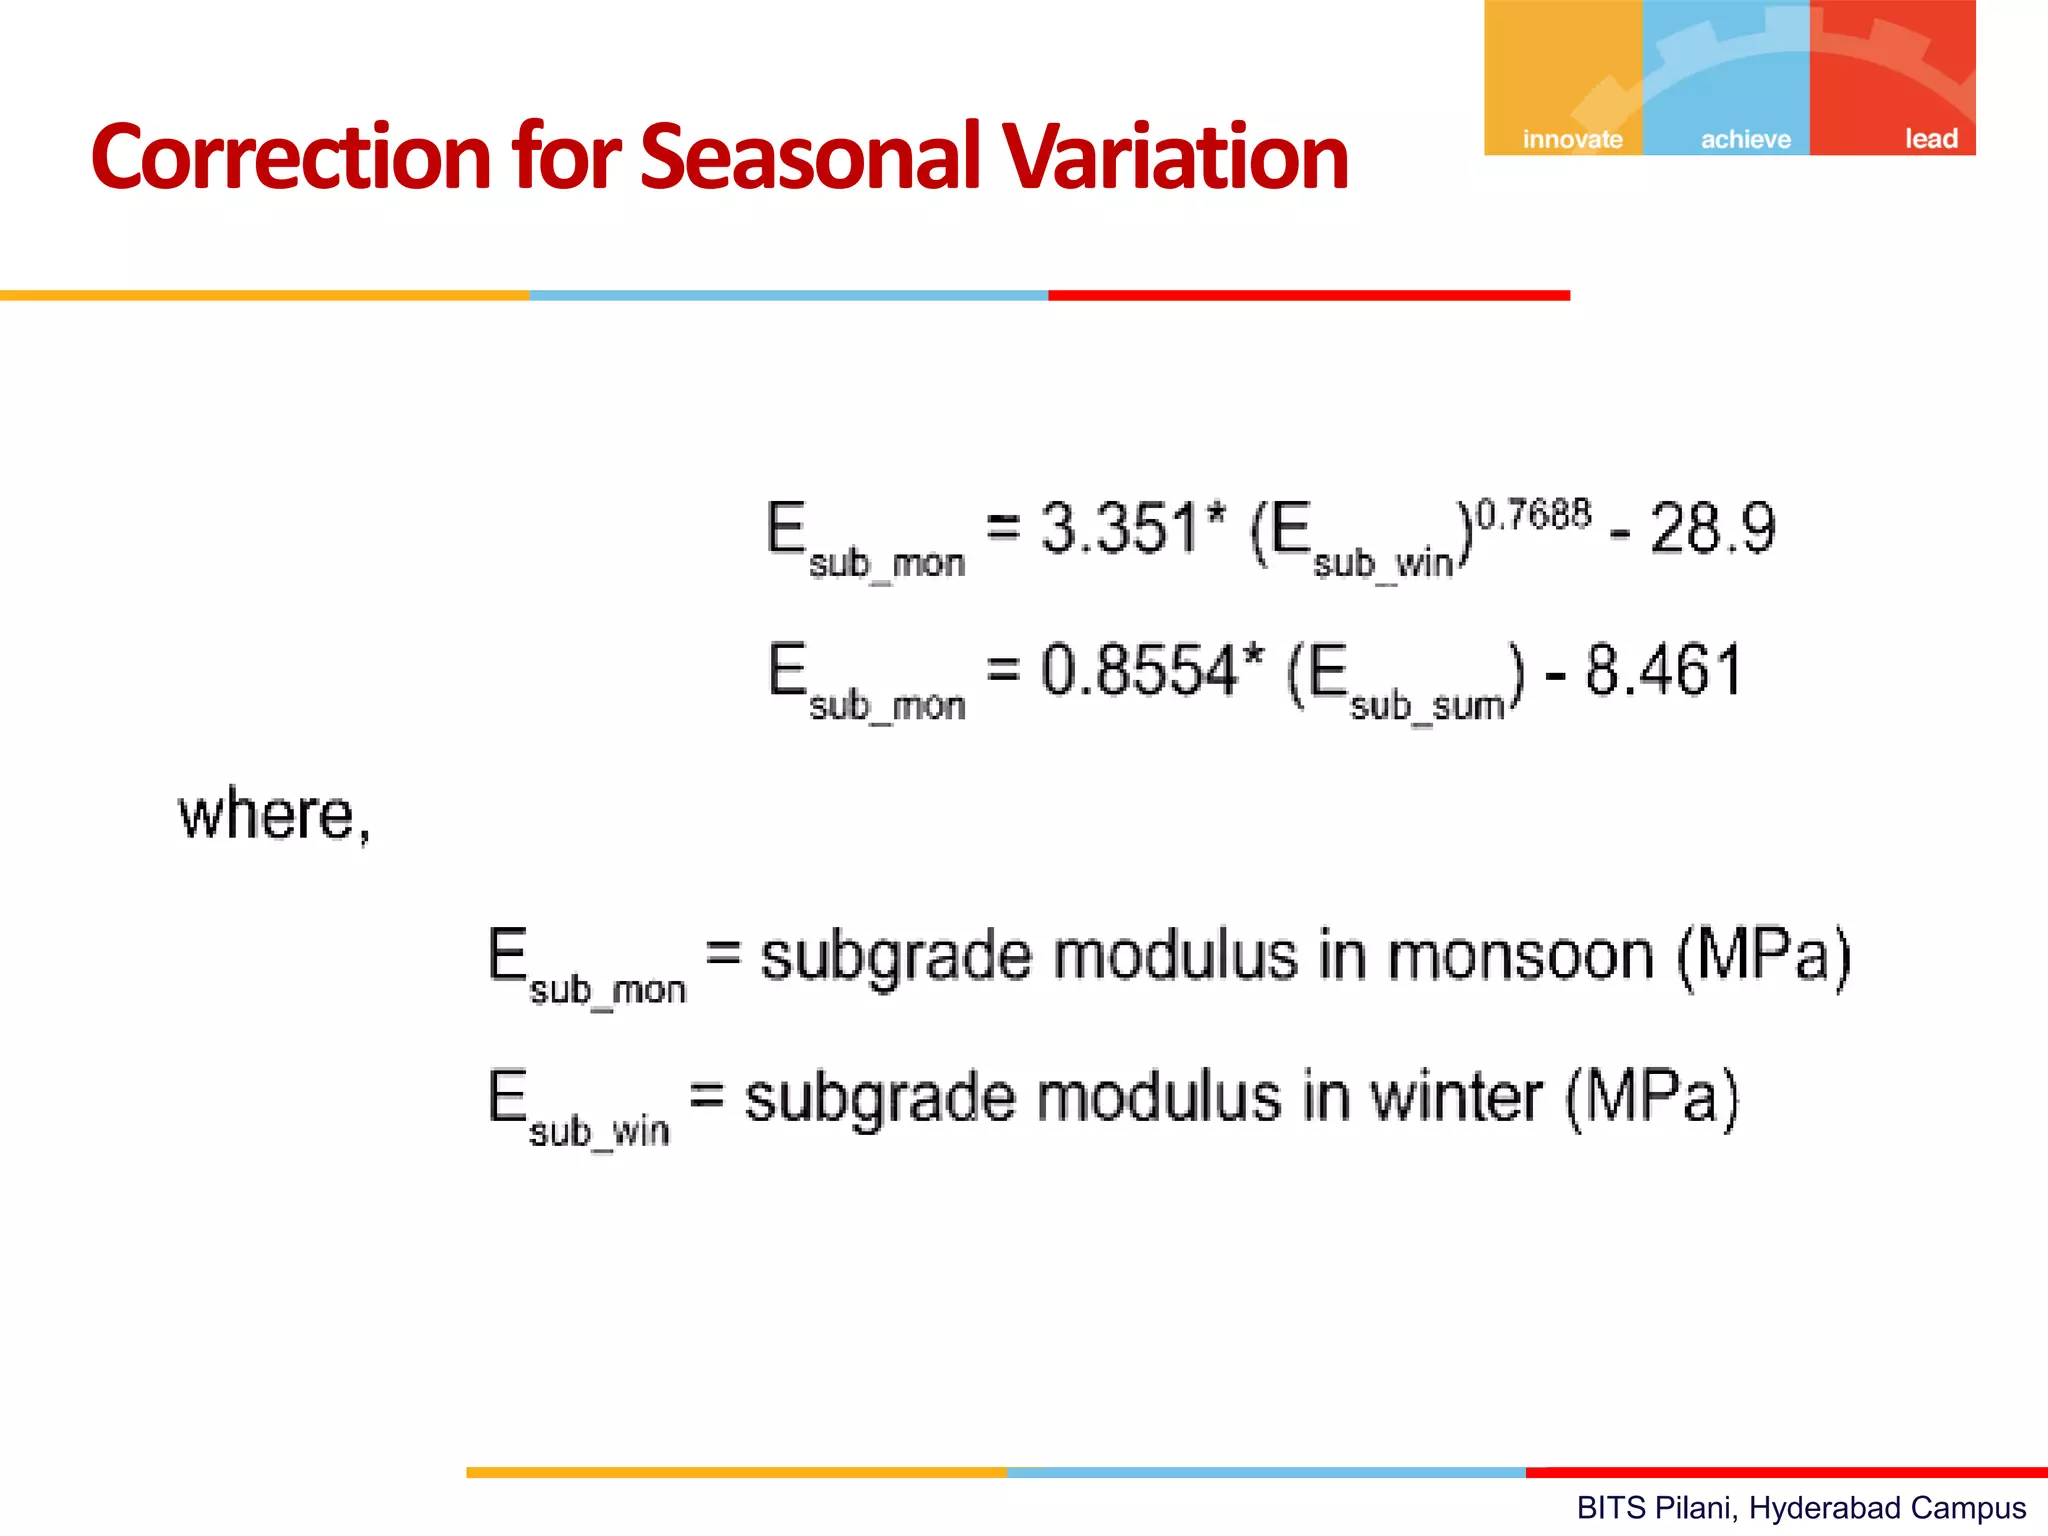
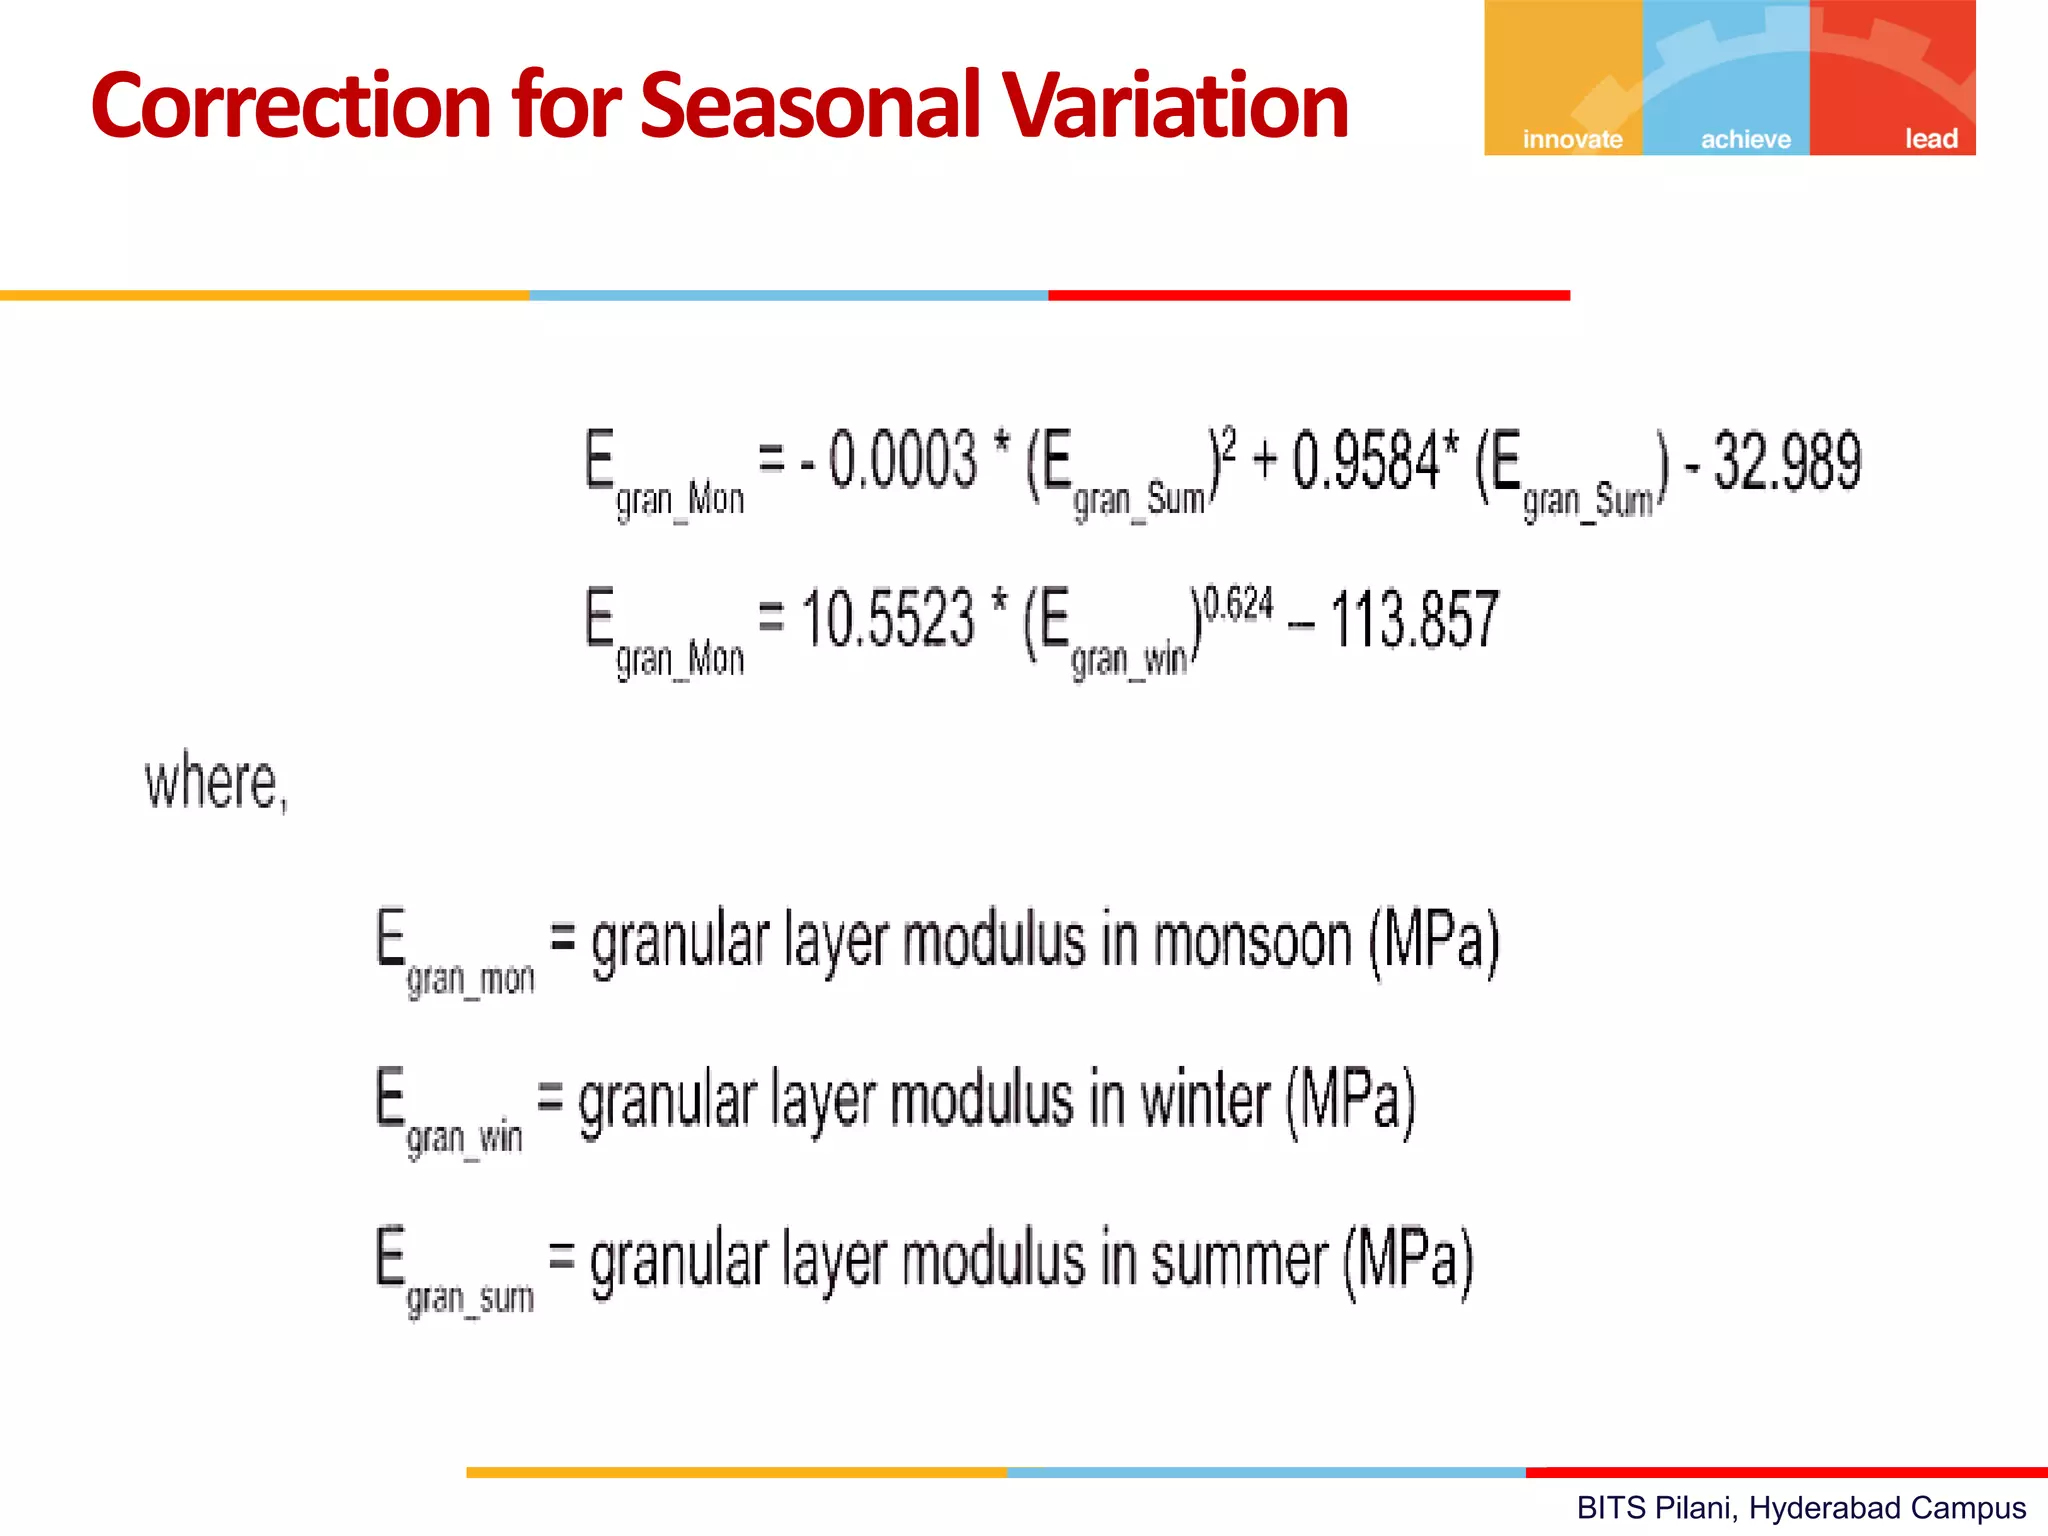
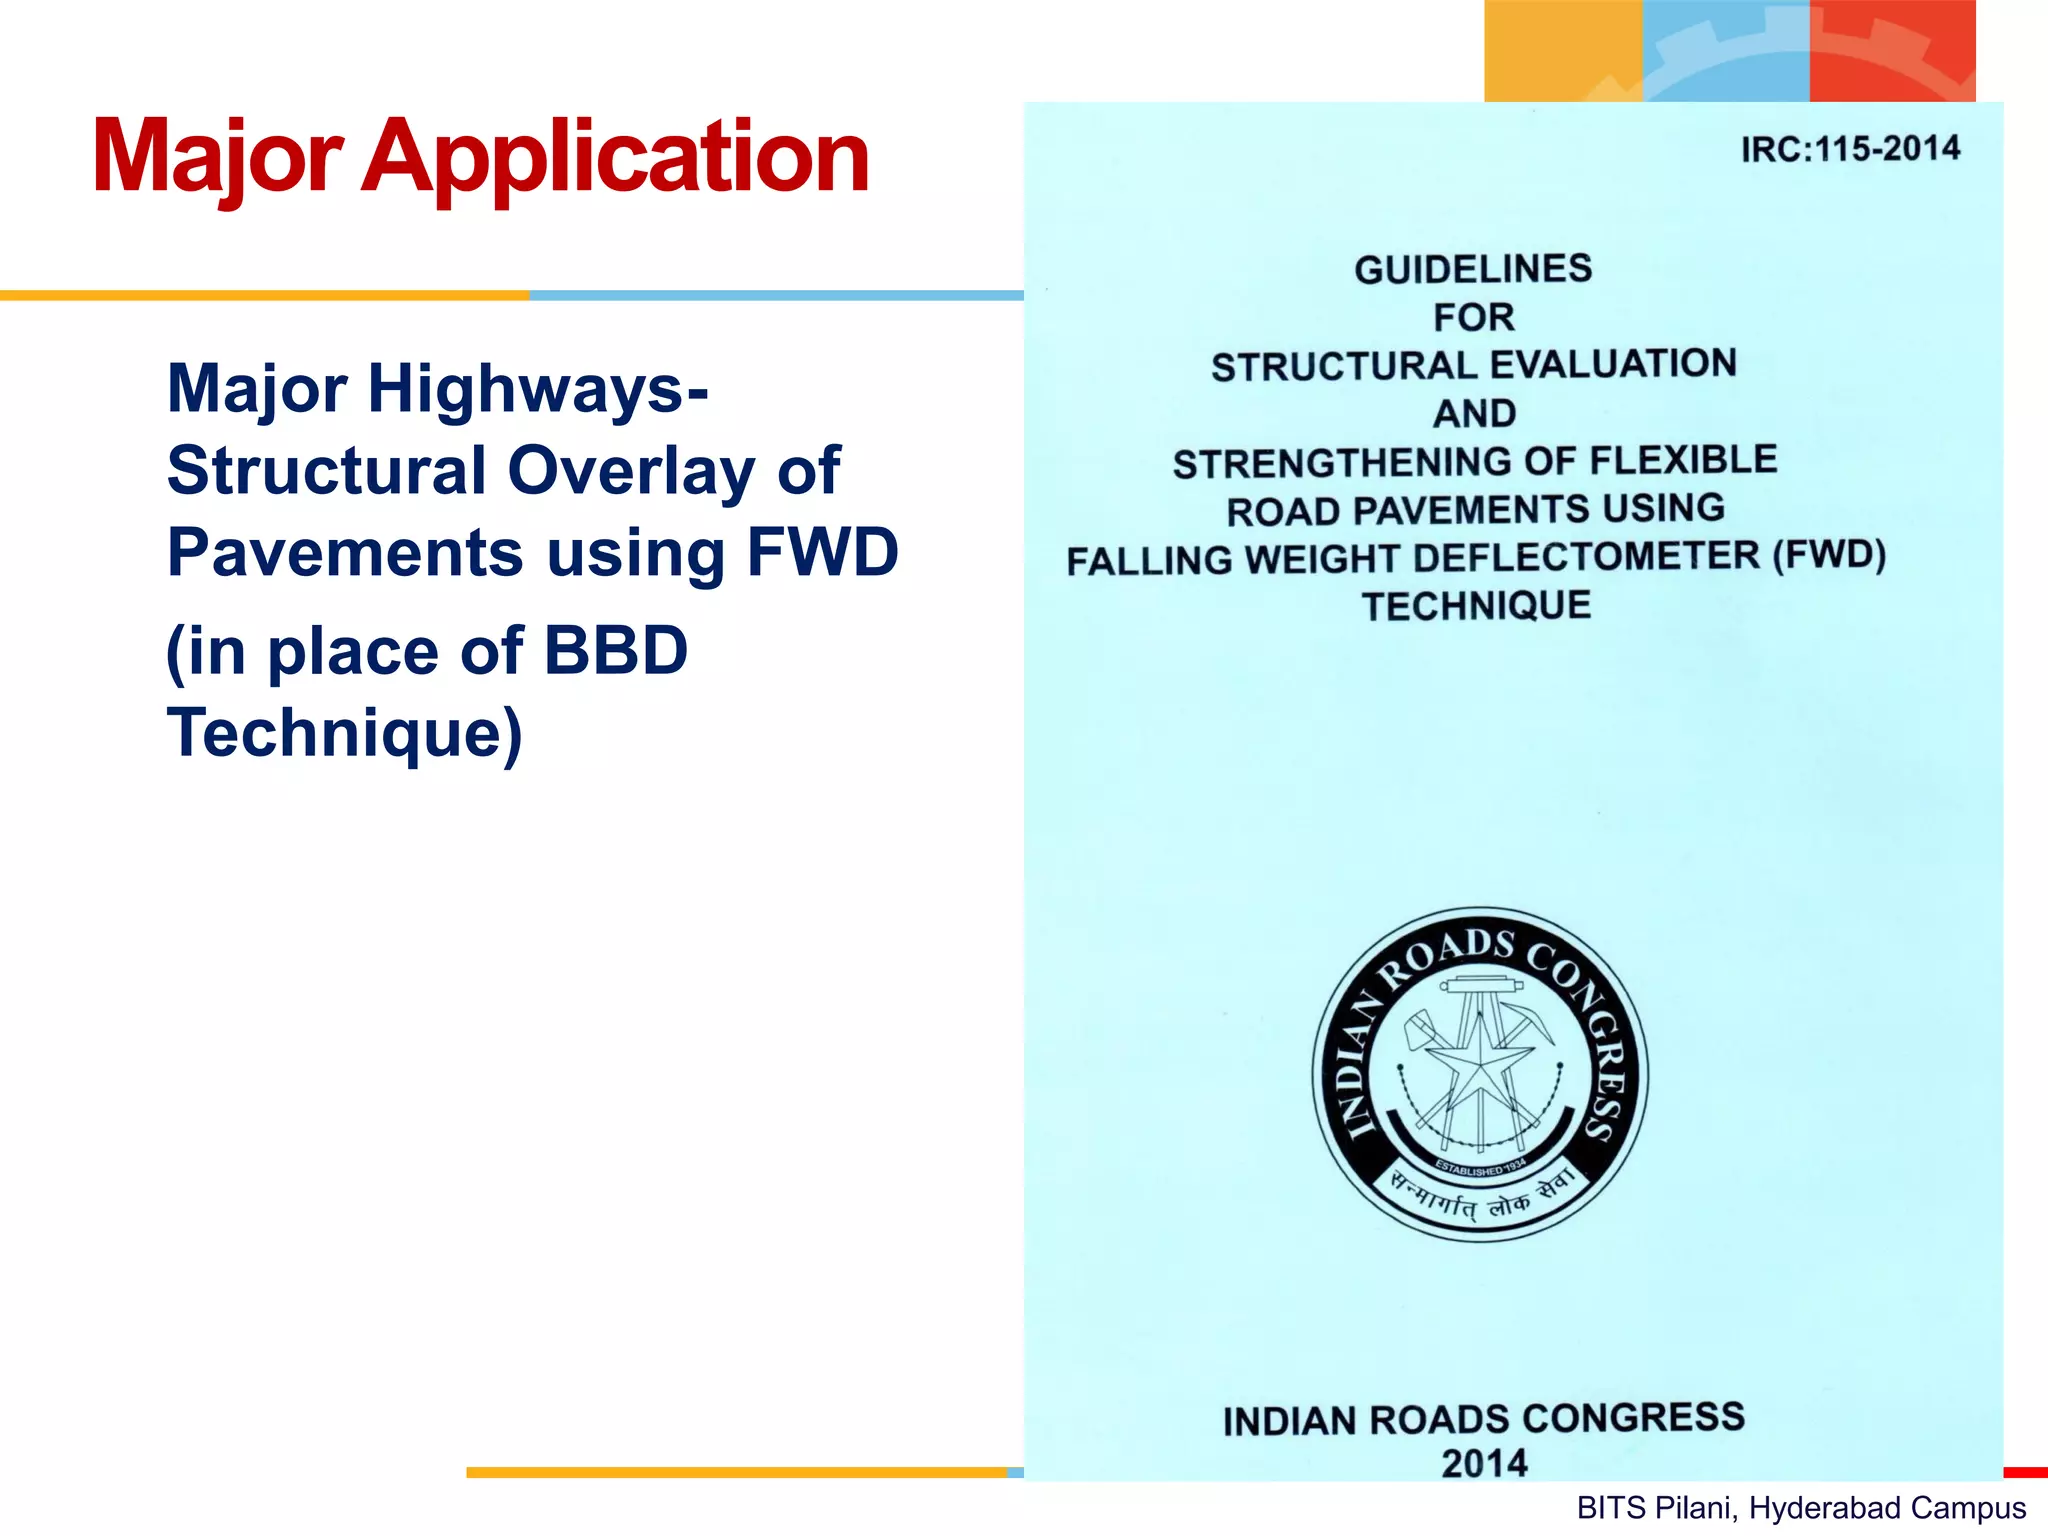
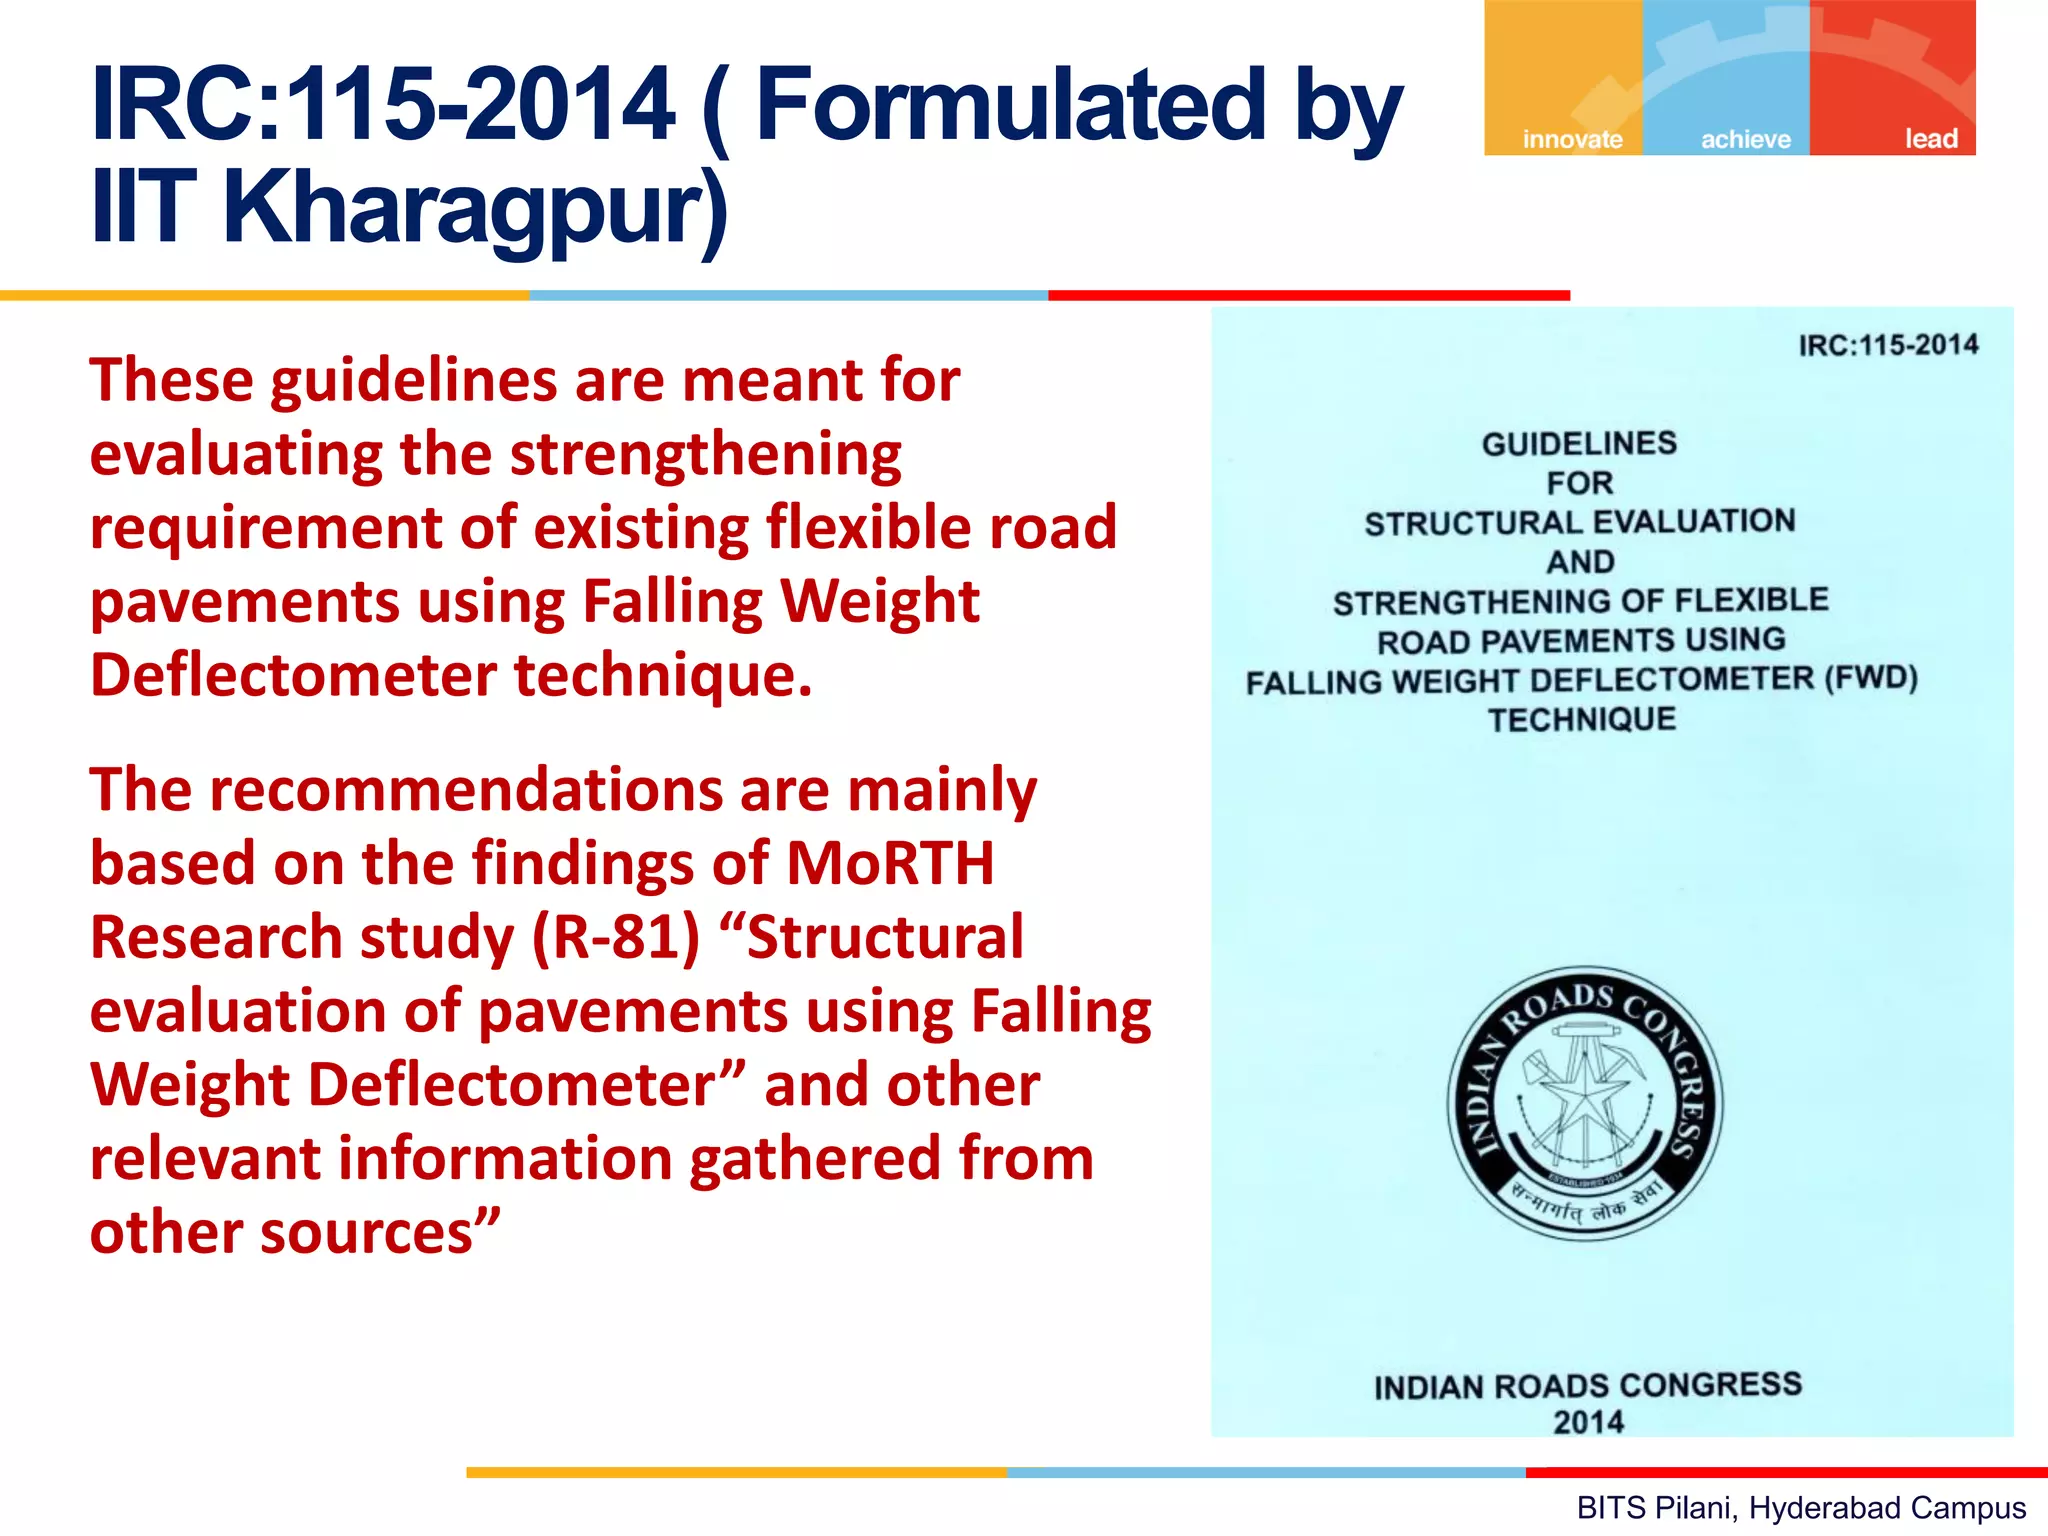
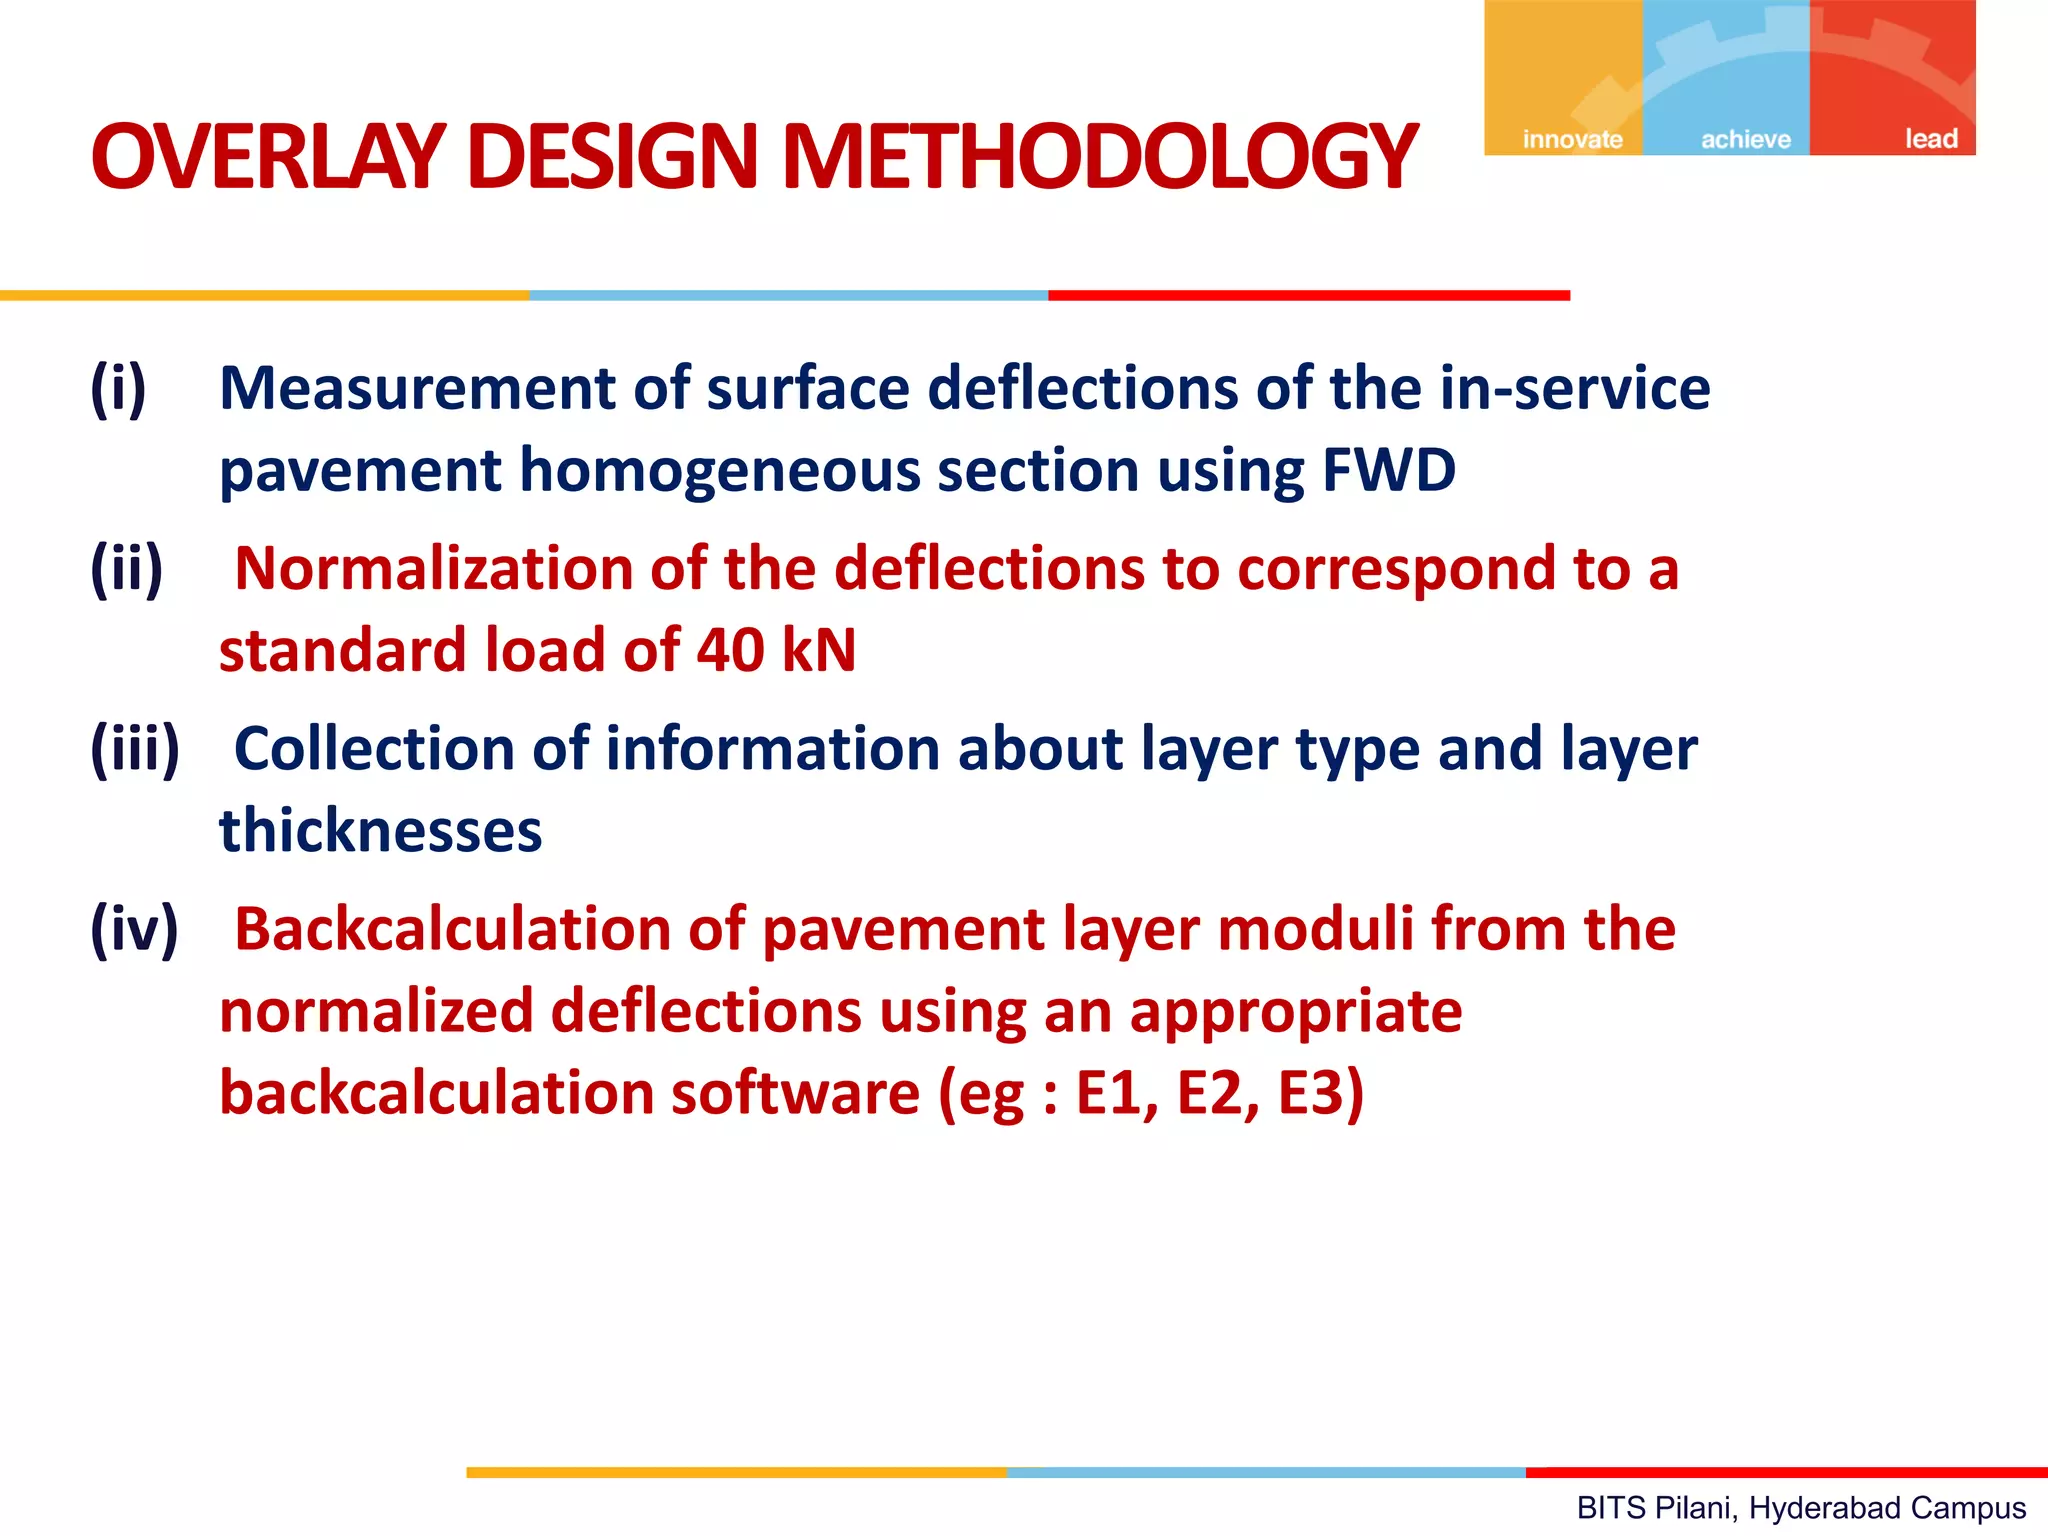
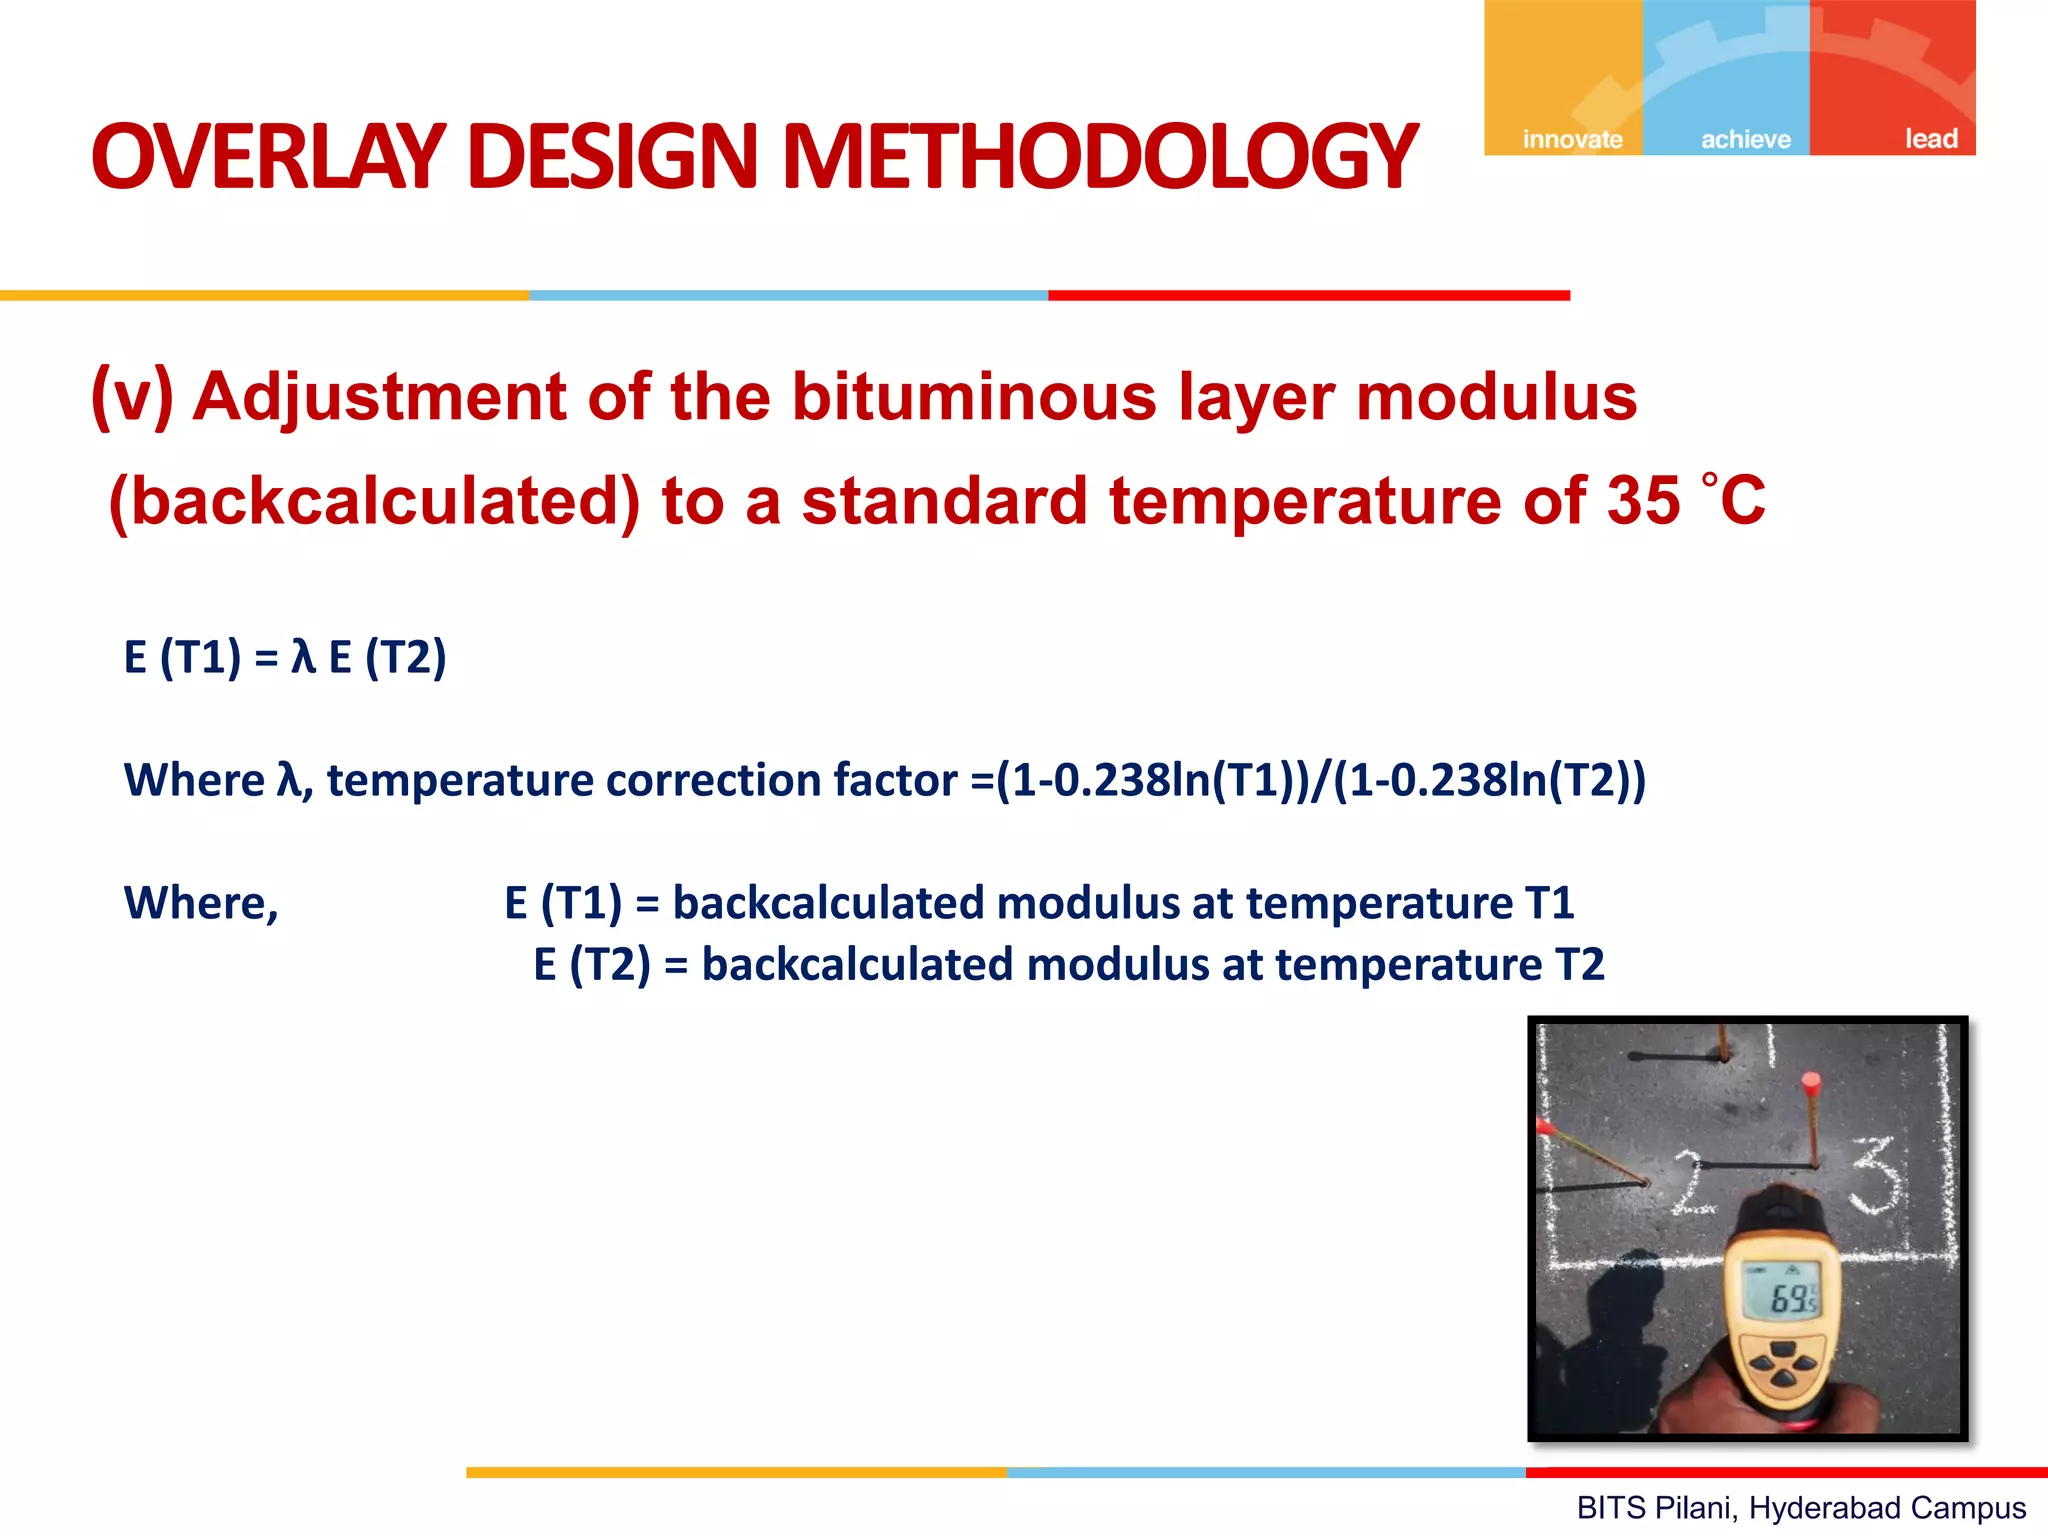
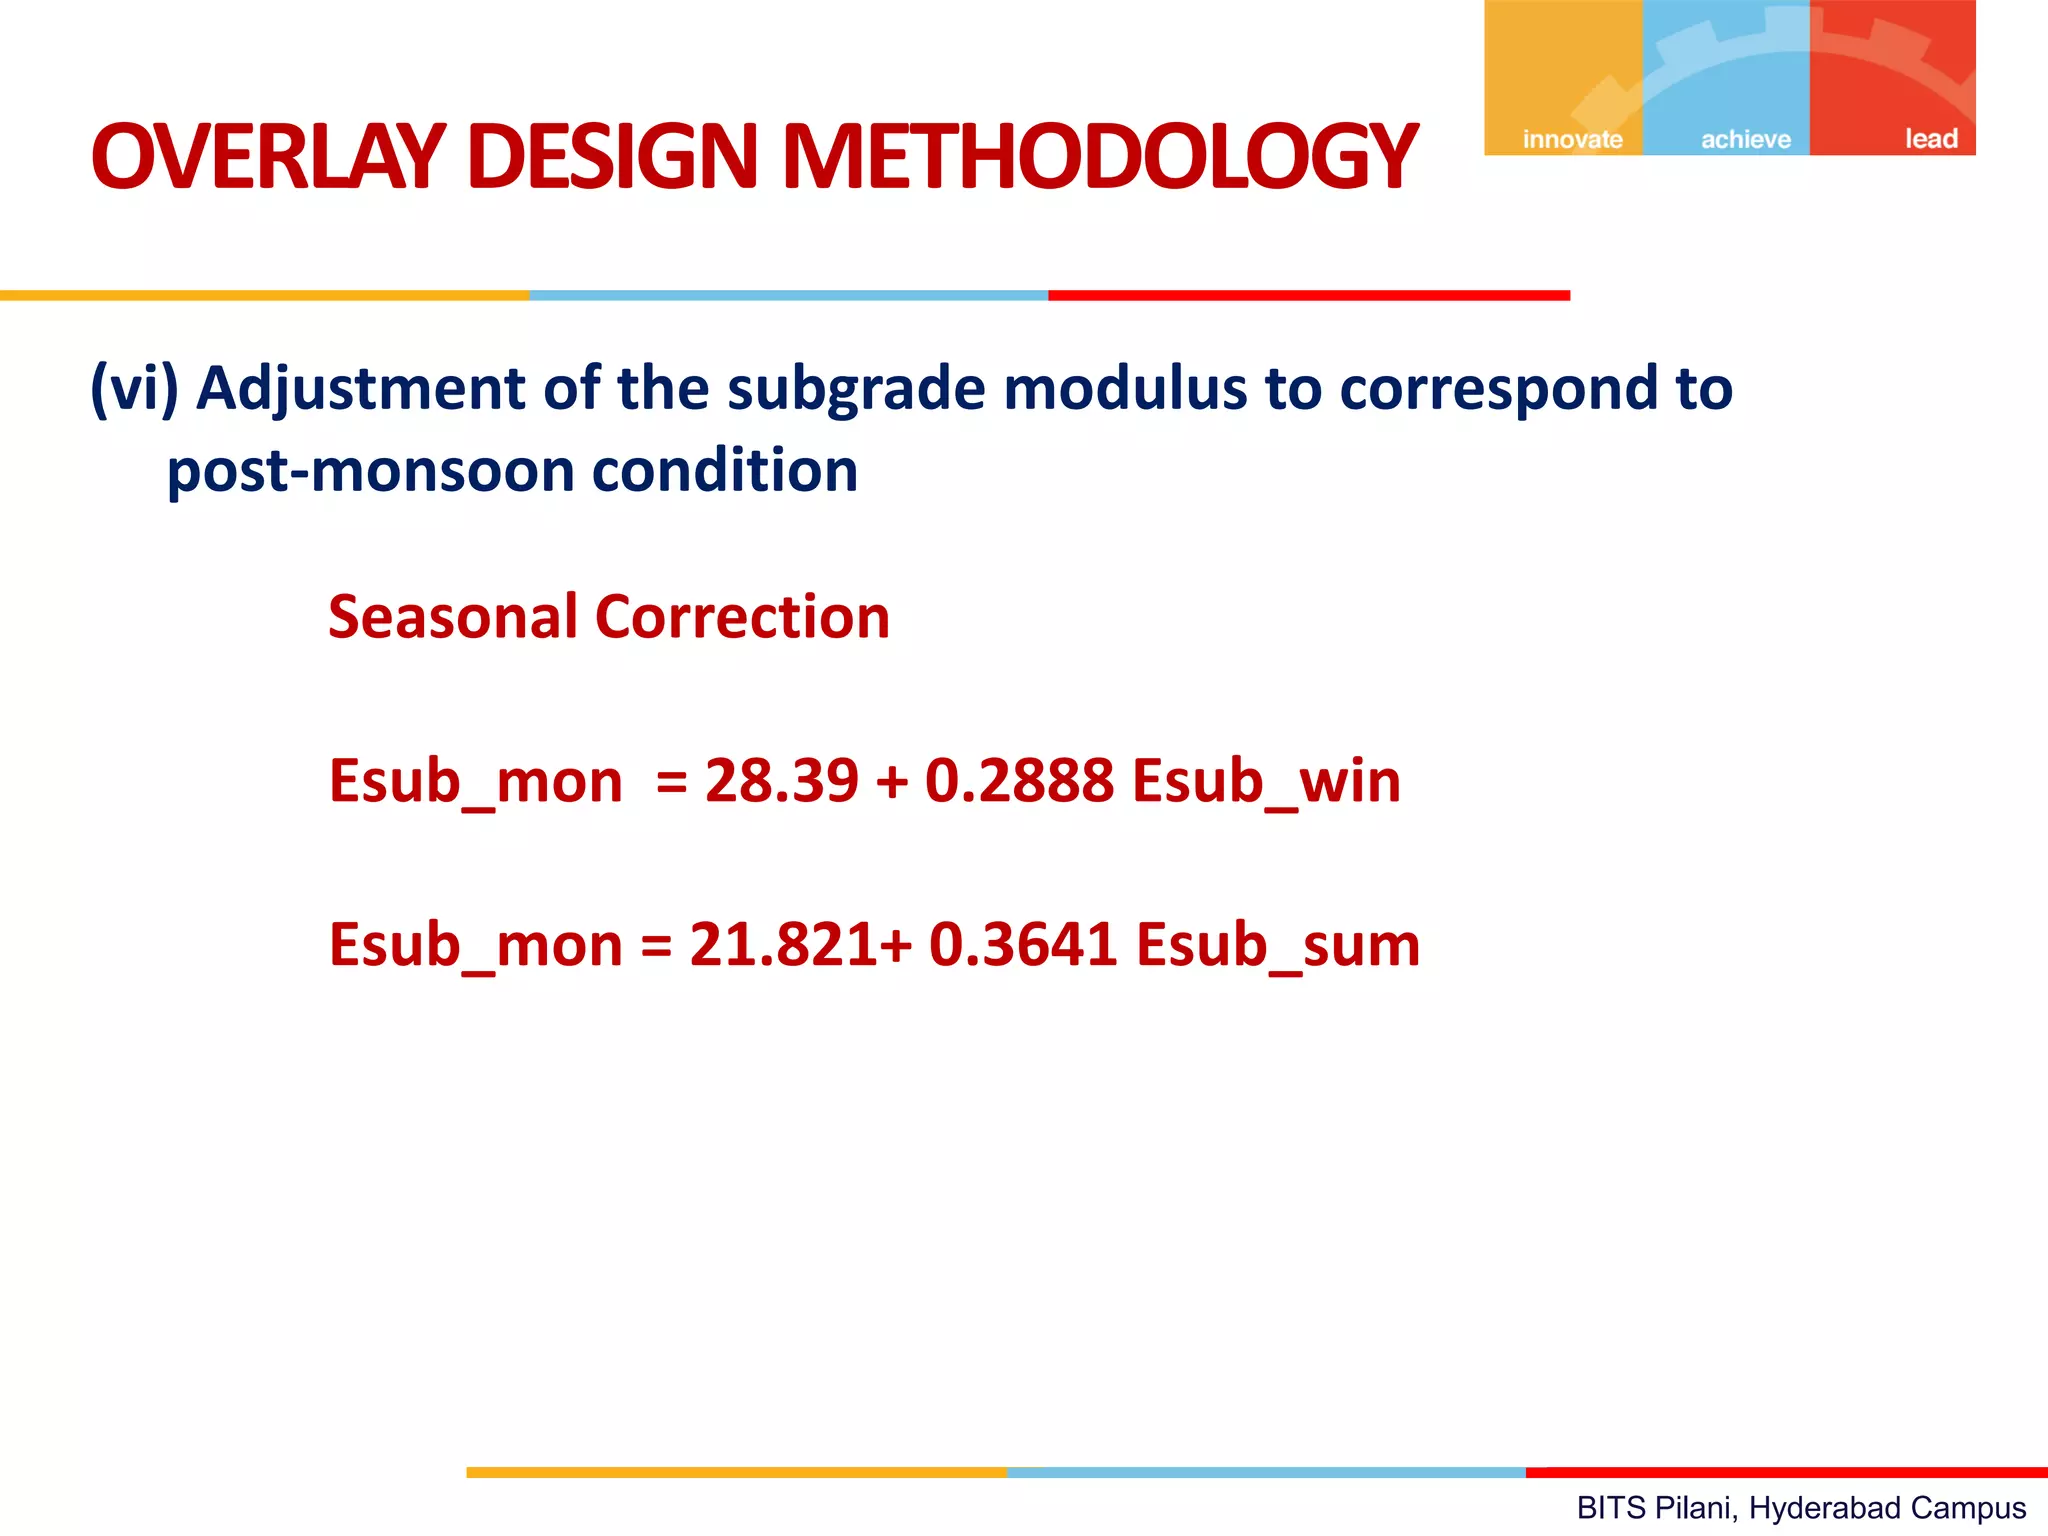
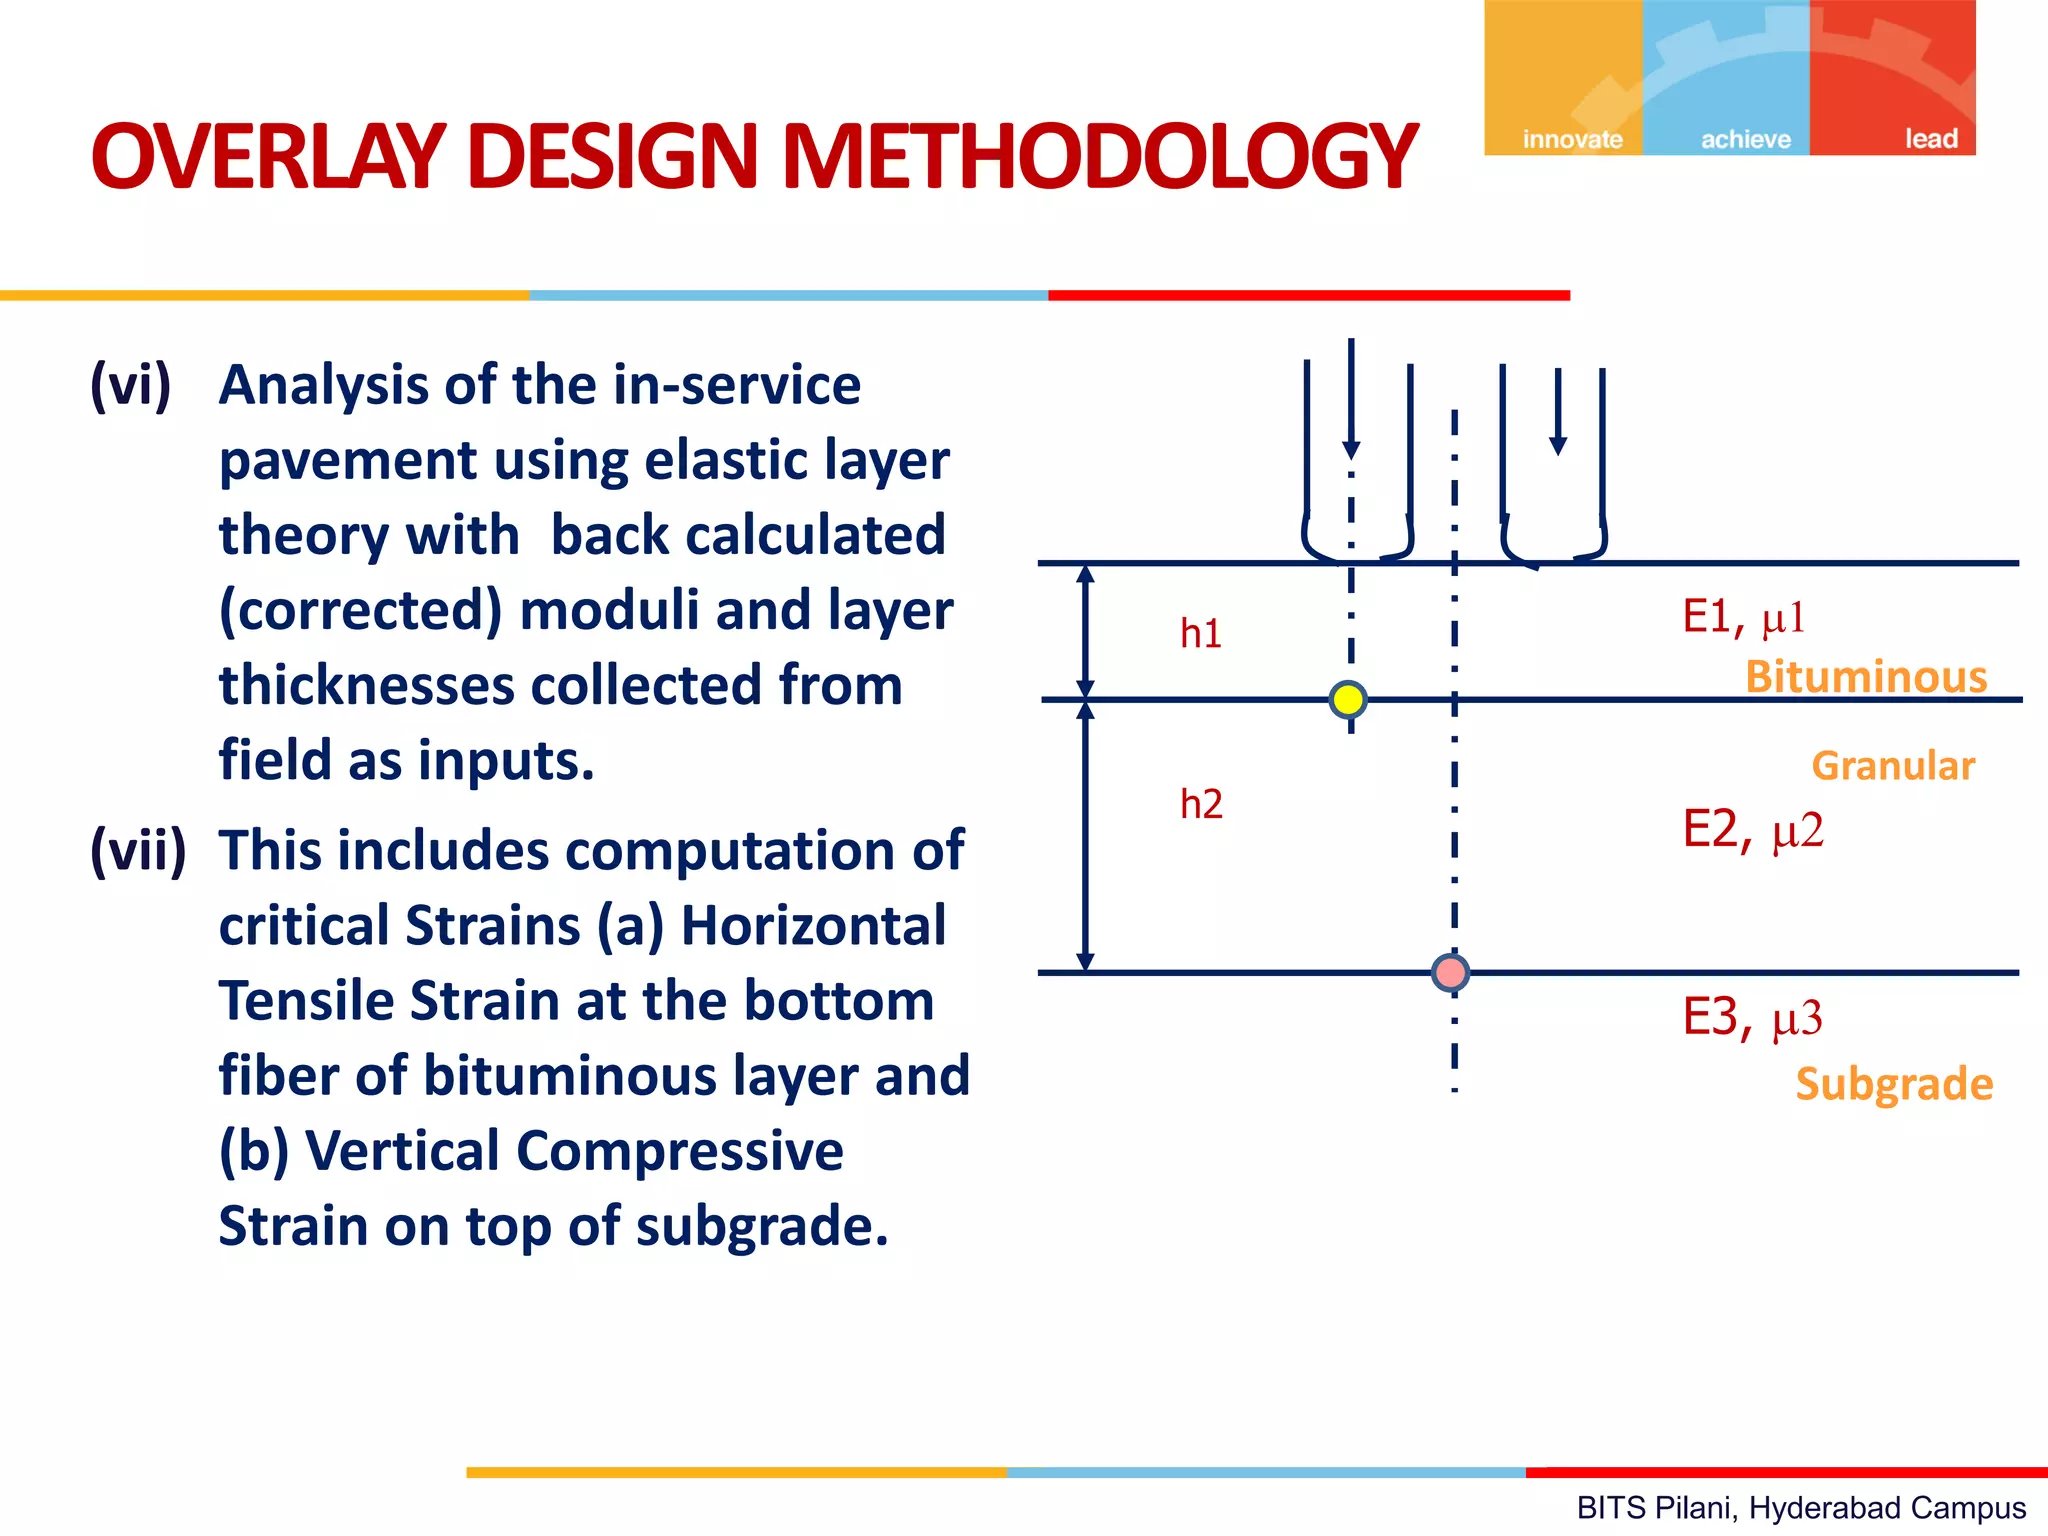
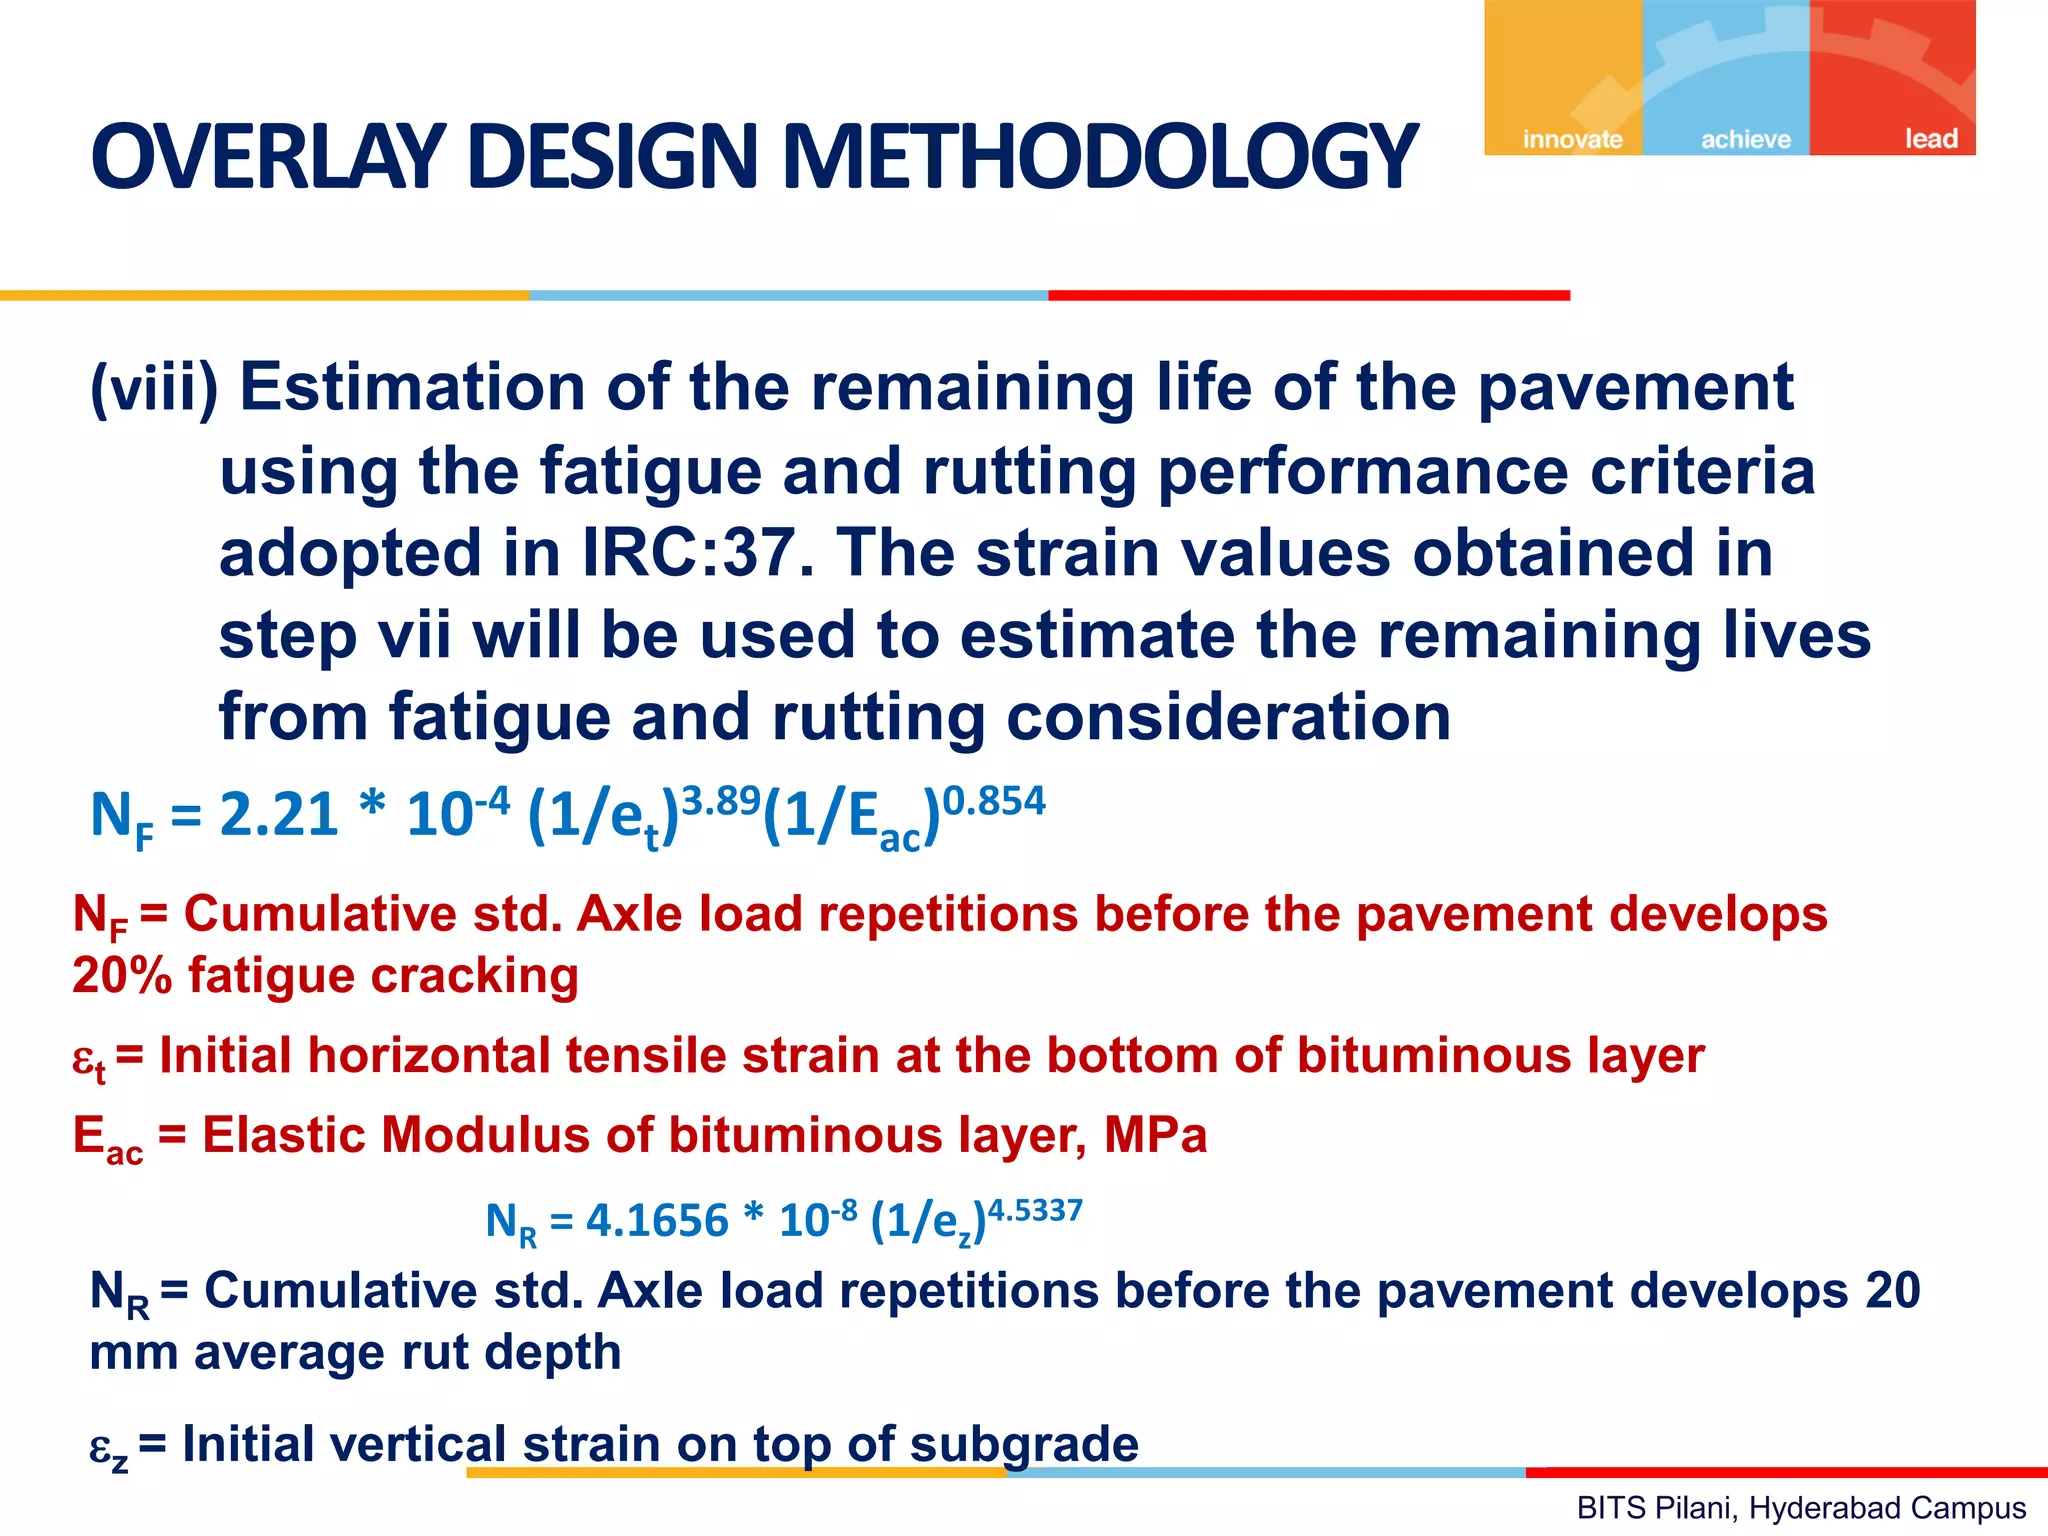
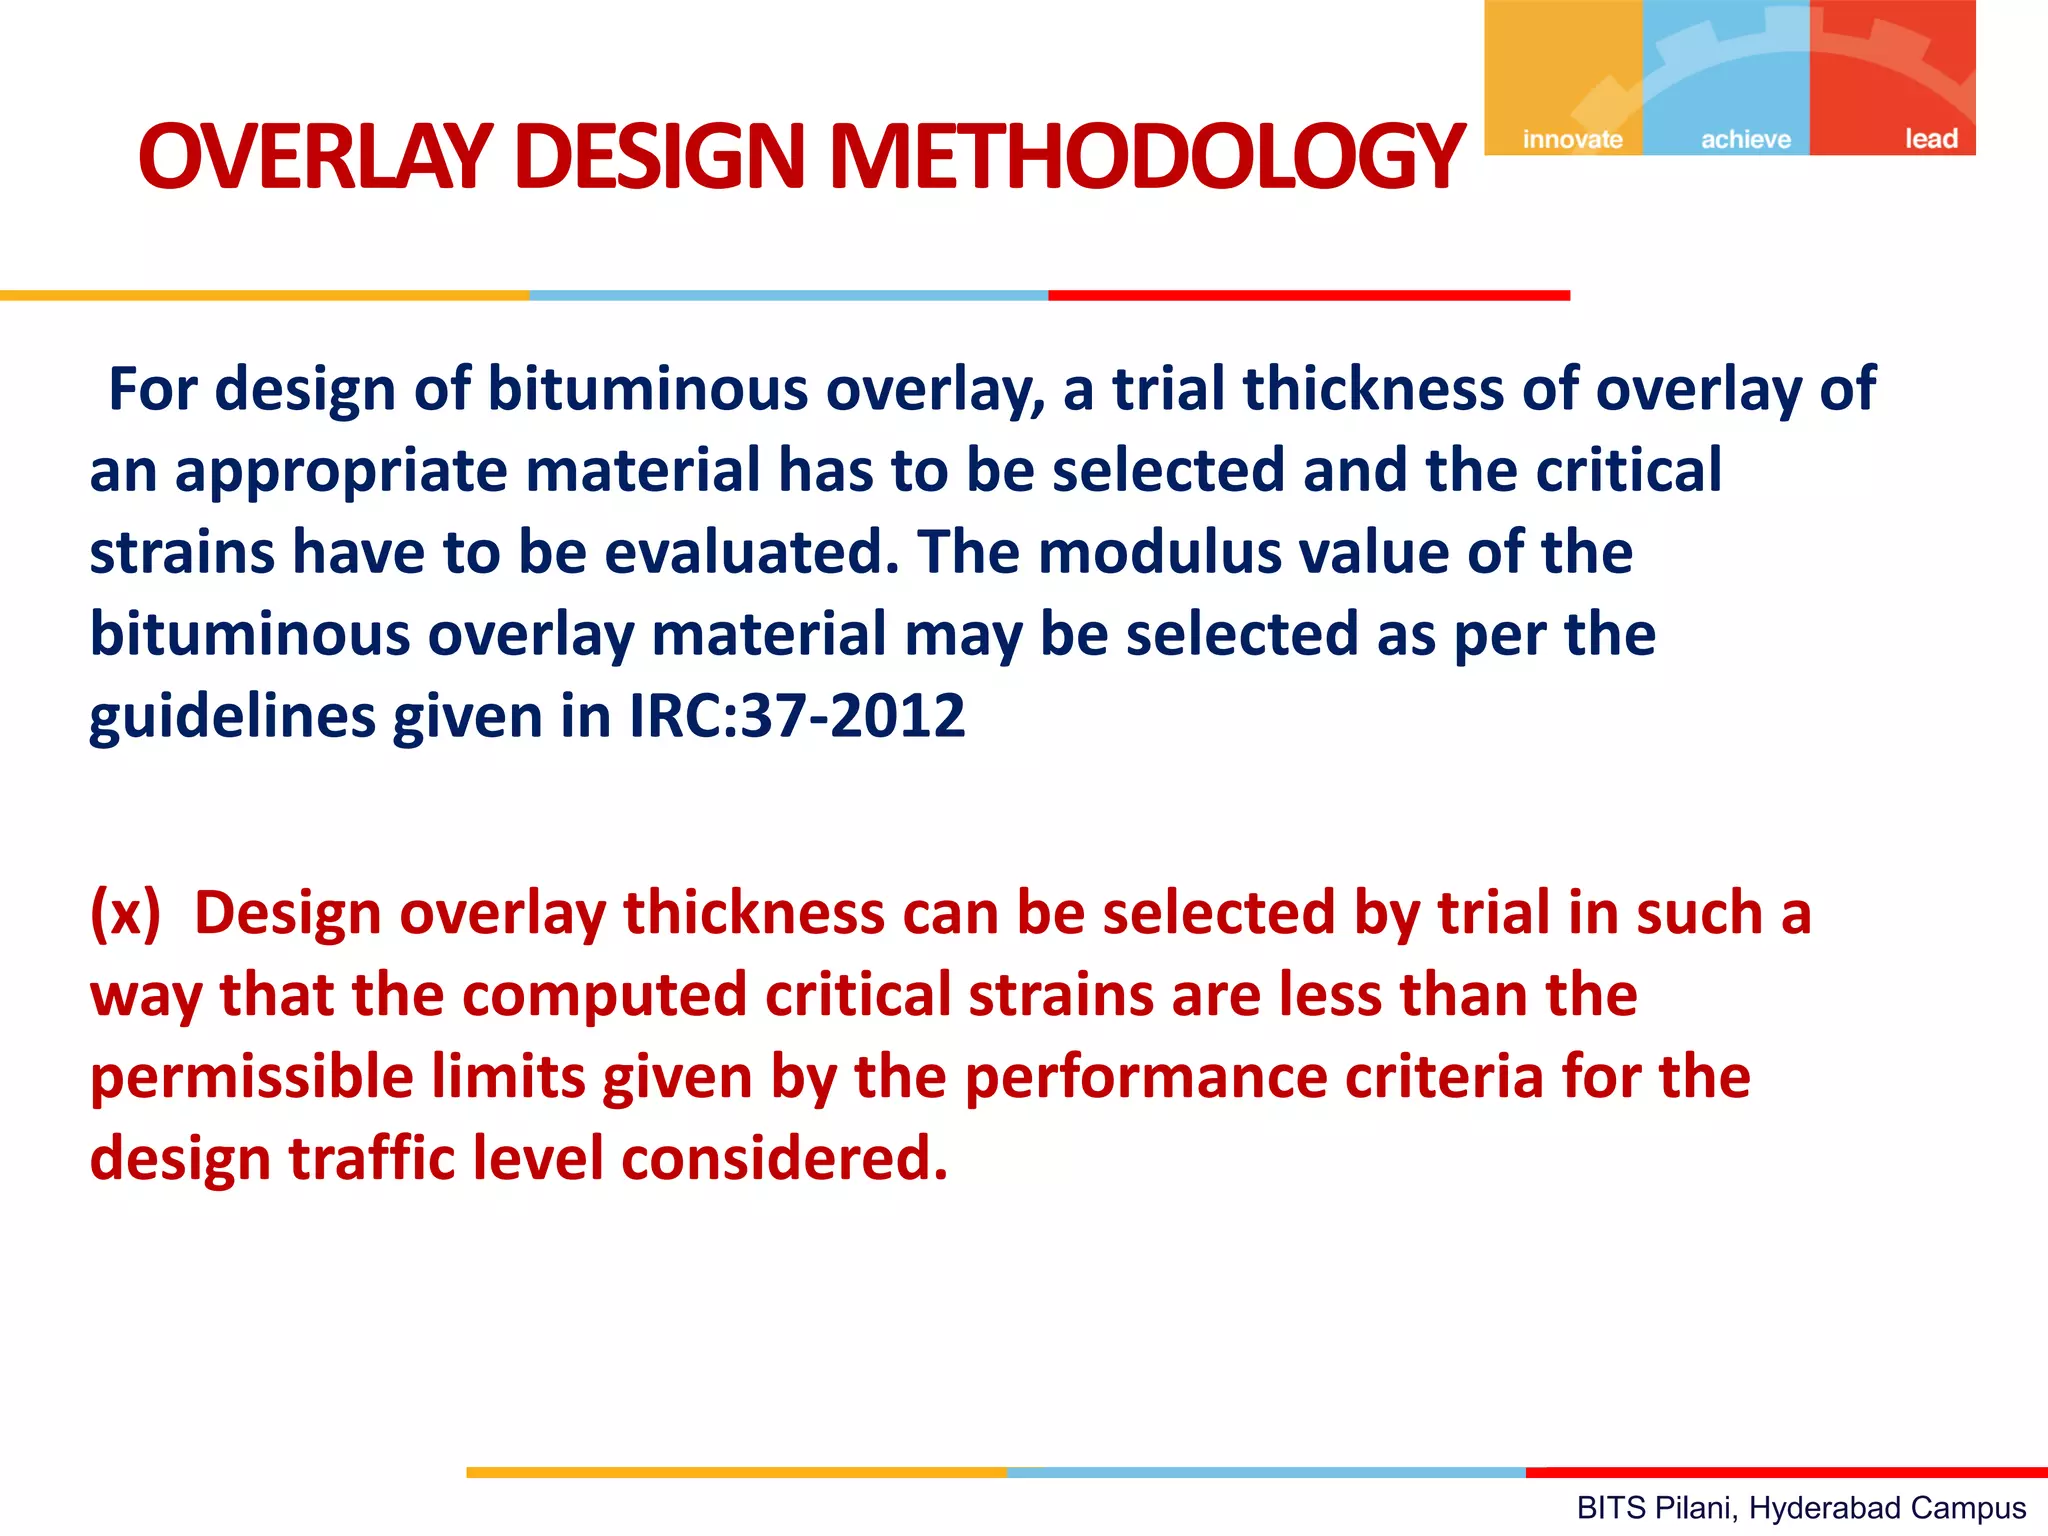
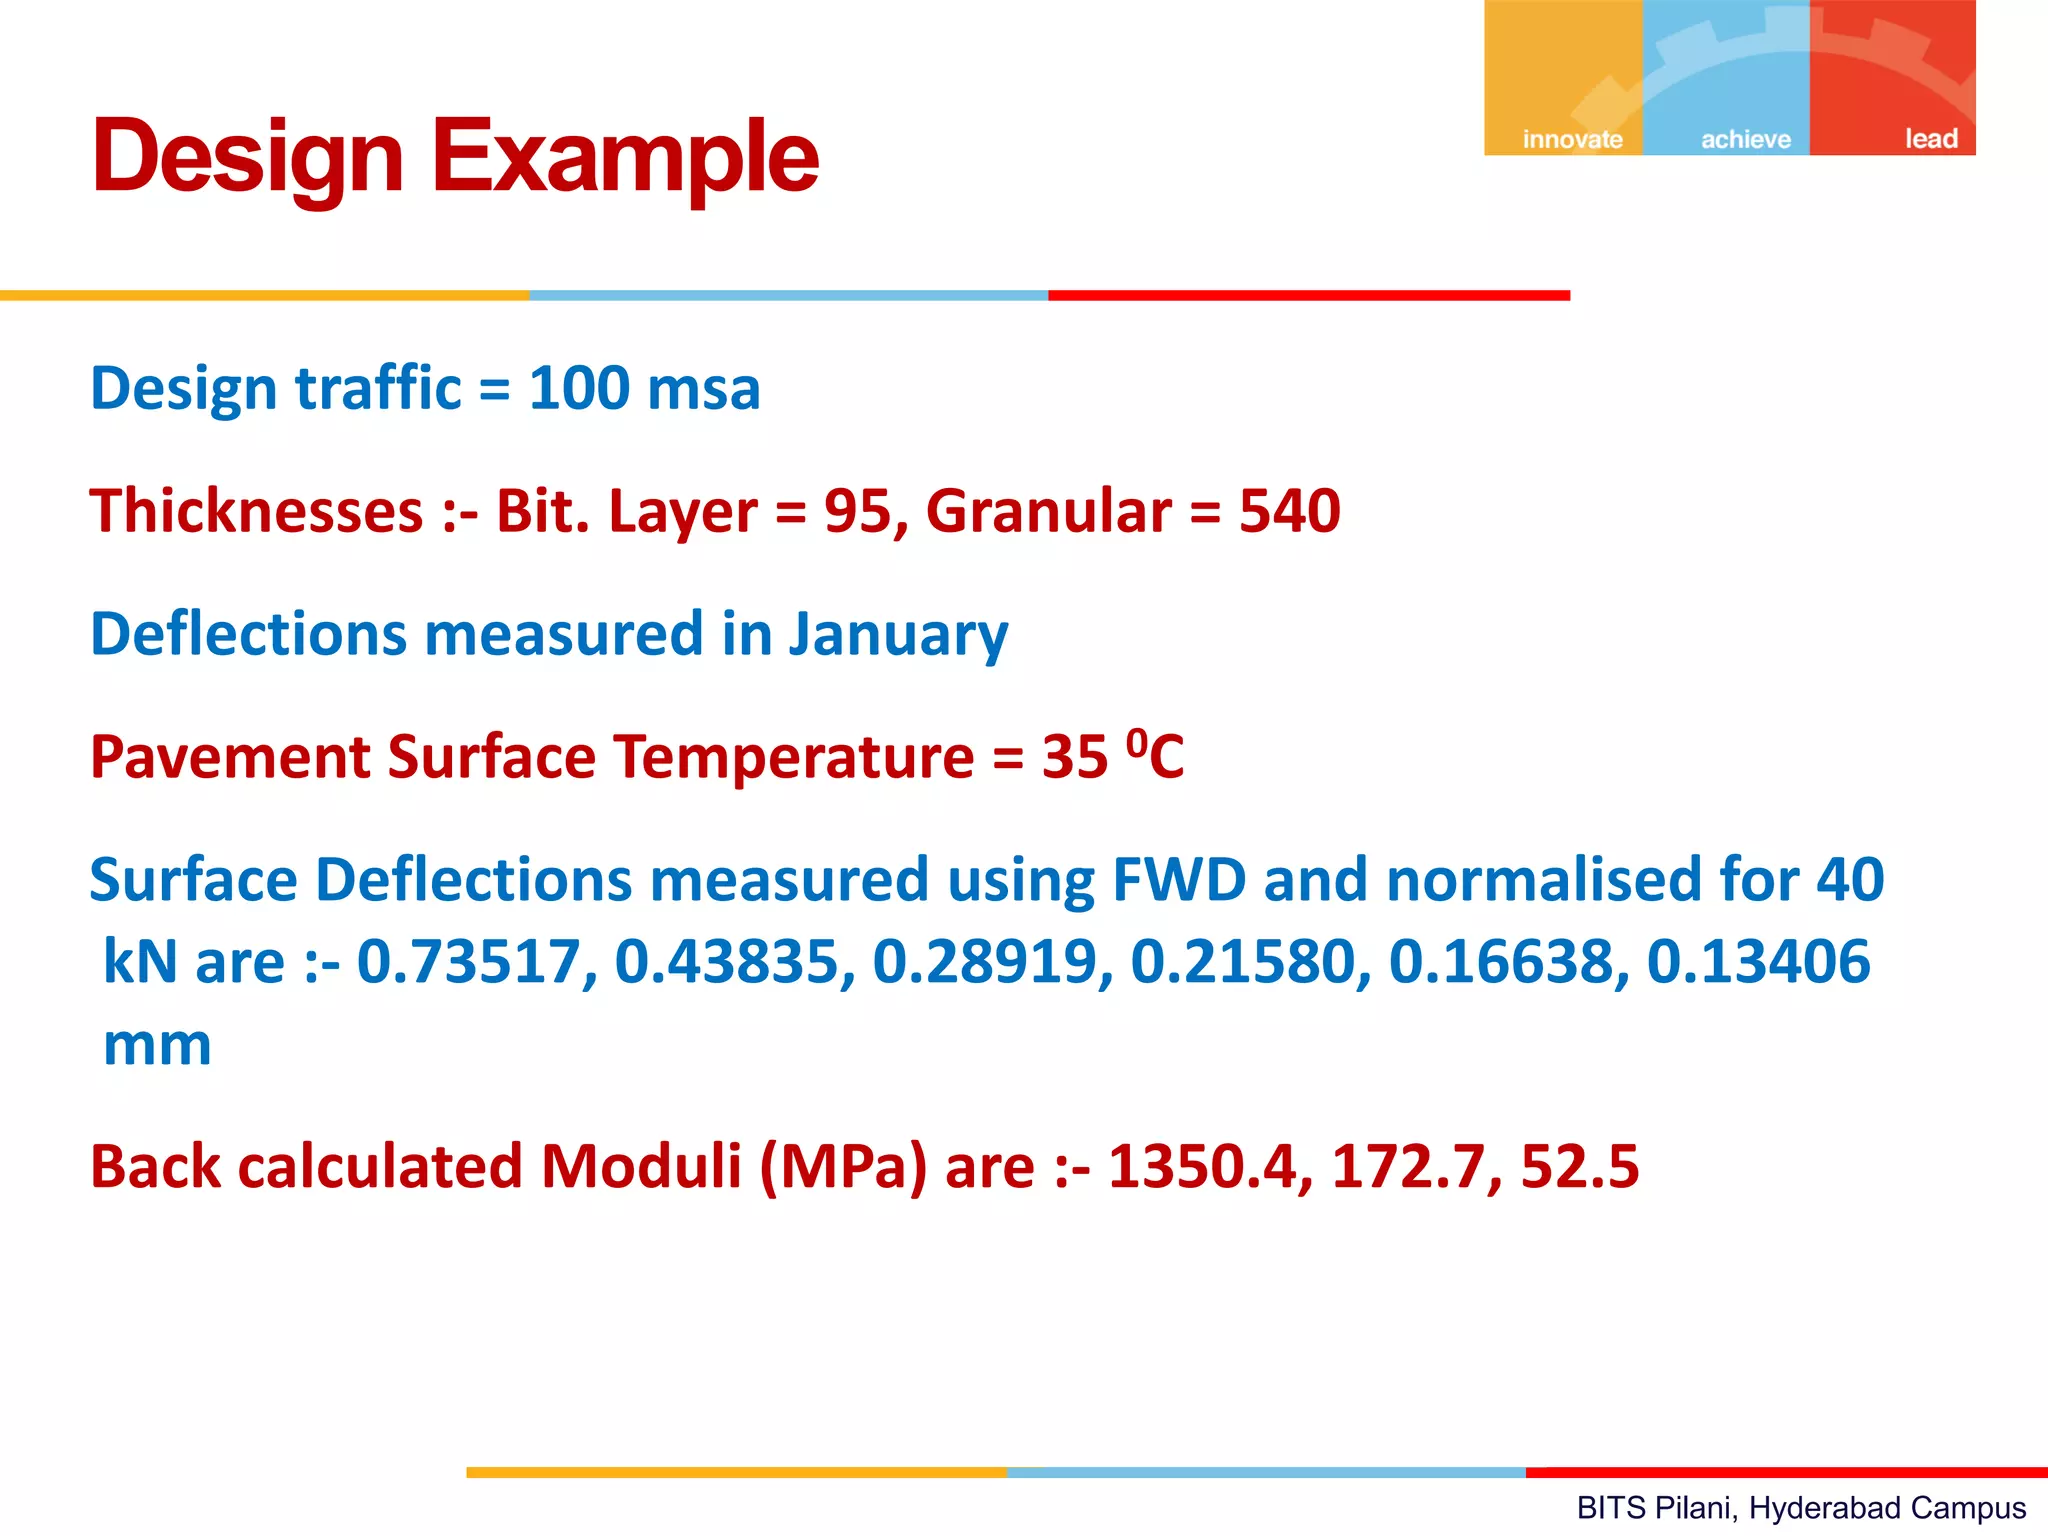
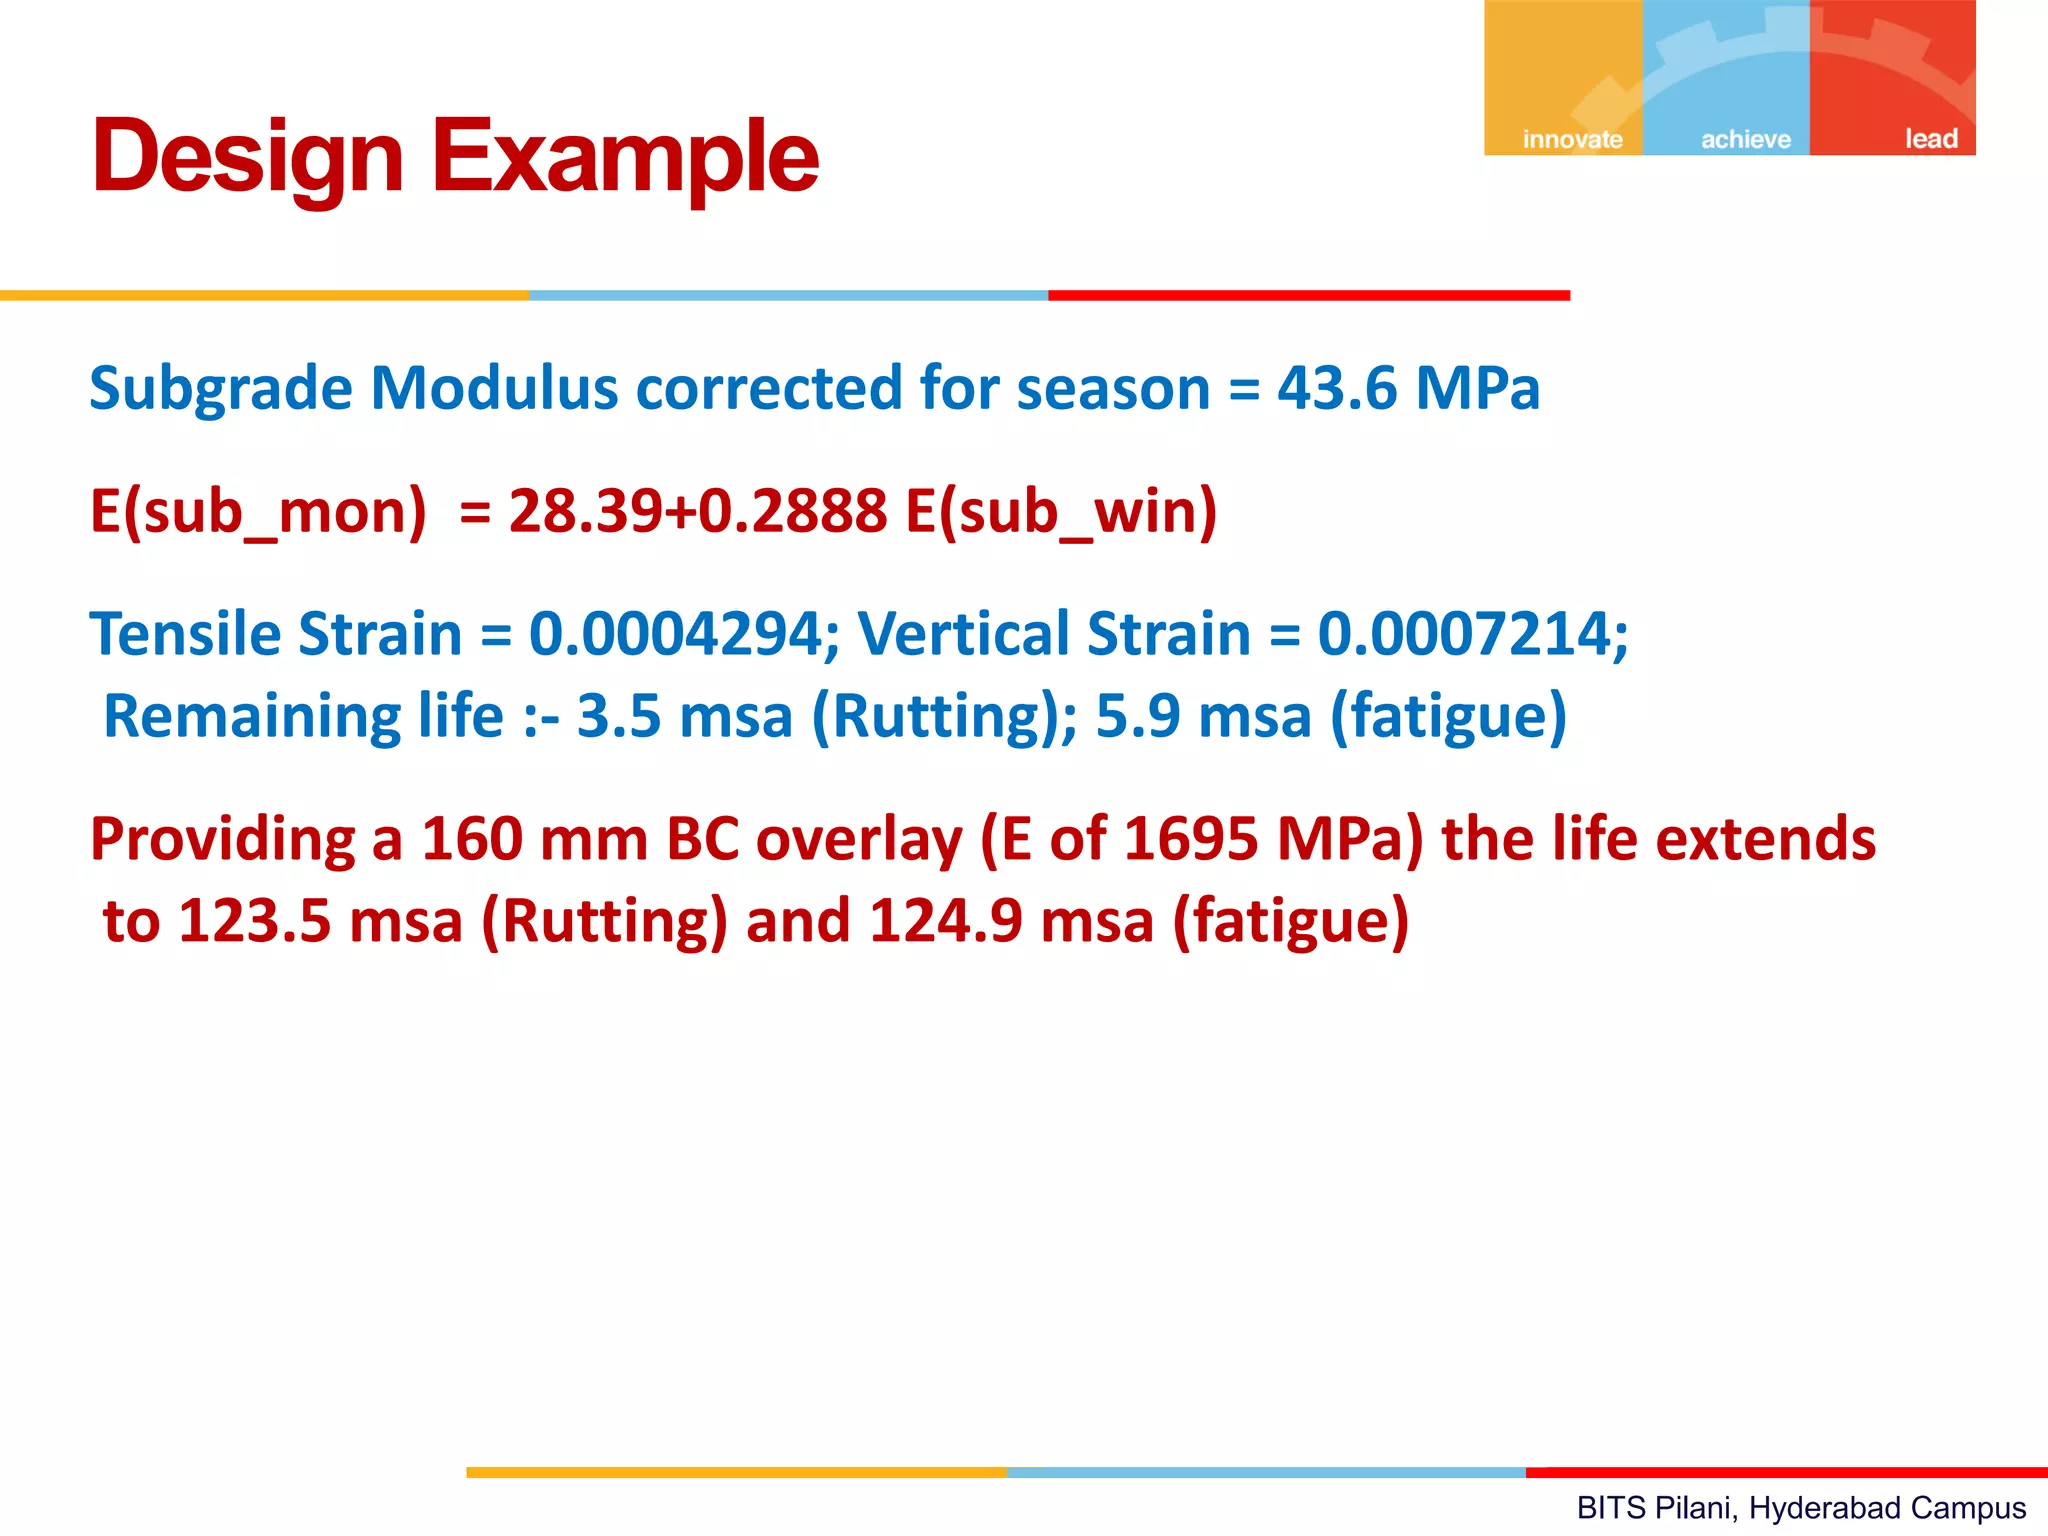
2. BITS Pilani, Hyderabad Campus
I take this opportunity to sincerely thank the IRC, MoRT&H, BIS,
CRRI, NHAI, PWDs, R&B, FHWA, NHI, ASTM, AASHTO, NCHRP,
Shell, BITS Pilani, Contractors, Consultants, Researchers, my
Teachers, my colleagues, my Alma mater, and my students. The
contents of this presentation is prepared, directly or indirectly
with the help of these resources, and only for the purpose of
exchange of knowledge.
Acknowledgements
11. BITS Pilani, Hyderabad Campus
Types of Maintenance
IRC: 82-2015
• Routine Maintenance
Filling of pot holes
• Preventive Maintenance
To extend the functional life and delay rehabilitation
• Periodic Maintenance
Application of Renewal Coat
12. BITS Pilani, Hyderabad Campus
All pavements deteriorate with time.
Depending on the initial condition, traffic loading,
and climatic conditions.
It is necessary to evaluate the functional and
structural condition of the pavement periodically.
Need for maintenance and rehabilitation can be
assessed based on the evaluation study.
PavementEvaluation
13. BITS Pilani, Hyderabad Campus
Evaluation of Pavement Performance
Functional Performance: The ability of pavement to
provide comfortable, safe, economical riding quality
to the road users.
[Pavement Condition Index (PCI), roughness, skid resistance]
Structural Performance: Related to the load carrying
capacity of the pavement.
[Pavement response to load application]
PavementEvaluation
14. BITS Pilani, Hyderabad Campus
Structural evaluation of pavements can be either
destructive or Non-destructive.
Destructive evaluation: the pavement is cut open to
find the in-situ condition, and the samples are
collected for testing in the laboratory.
Non-destructive evaluation: Load is applied on the
pavement for measuring the structural response.
Structural Evaluation
16. BITS Pilani, Hyderabad Campus
The general approach of structural evaluation is:
1. Application of specified load in a specified manner.
2. Measuring the surface deflection.
3. Back calculate the material properties from the
measured deflections to the applied loads.
GeneralApproach
17. BITS Pilani, Hyderabad Campus
NDT Evaluation
Static Load Testing of Pavements
Example : Plate Load Test
Plate Load Test
19. BITS Pilani, Hyderabad Campus
•The NDT load applications can be in different modes
i. Static
ii. Slow moving or Creep
iii. Vibratory
iv. Impulse
NDT Evaluation
20. BITS Pilani, Hyderabad Campus
Benkelman beam apparatus - Static/Creep Loading
Benkelman beam is an apparatus used for measuring
the surface deflection of pavement subjected to a
standard truck load
NDT Evaluation
21. BITS Pilani, Hyderabad Campus
Western American State Highway Officials (WASHO) Method –
Deflection is noted as the wheel load approaches the point.
Benkelman Beam Evaluation
of Pavements
Maximum Deflection noted
Deflection = 0
22. BITS Pilani, Hyderabad Campus
• Canadian Good Roads Association (CGRA) method–
Rebound deflection measured as the load is removed
from a point.
Benkelman Beam Evaluation
of Pavements
Deflection = 0
Maximum Initial Deflection
23. BITS Pilani, Hyderabad Campus
• Single maximum rebound deflection is measured.
• Structural response is measured under static or creep load
and doesn’t representative a fast moving truck.
• Structural capacity of the pavement is assessed based on a
single deflection measurement.
Benkelman Beam Evaluation
24. BITS Pilani, Hyderabad Campus
• Determining the structural deficiency and design of
overlay was a Research Project.
• The test Sections in different parts of the country were
evaluated by different educational institutions
• The project was coordinated by CSIR-CRRI and
reported as IRC:81-1997.
R-6 Research Project of
MoRTH
25. BITS Pilani, Hyderabad Campus
Outcomes from the project were:
1. Limiting the Deflection value
2. N = k1(1/Initial Deflection)K2
3. Effectiveness of overlay thickness in reducing deflection
4. Equivalence of materials (in terms of BM)
5. Corrections to be applied to measured surface deflections
6. The information was summarised to arrive at an
overlay thickness chart
R-6 Research Project of
MoRTH
27. BITS Pilani, Hyderabad Campus
Pavements that do not have adequate structural strength
to carry the projected future traffic will have to be
strengthened by providing additional layer/s
Overlay
Overlay
Existing
Pavement
Sub-grade
28. BITS Pilani, Hyderabad Campus
• Guidelines for Strengthening of Flexible Road Pavements
using Benkelman Beam Deflection T
echnique
• First version in 1981. First revision in 1997
• MORTH research scheme R – 6 entitled “Development of
Methods such as Benkelman beam deflection method for
evaluation of structural capacity of existing pavements and
also for strengthening of any weak pavement”
Indian Roads Congress
Overlay Design
29. BITS Pilani, Hyderabad Campus
• For evaluation of the strengthening requirement of existing
flexible road pavements using Benkelman beam technique
• Pavement performance is closely related to the elastic
deflection of pavement under wheel loads
• Elastic deflection under standard loading conditions depends
upon subgrade soil type, moisture condition, degree of
compaction, the thickness and quality of the pavement courses,
drainage conditions, pavement surface temperature, etc.
IRC:81 Scope and Principle
30. BITS Pilani, Hyderabad Campus
Benkelman beam is a simple apparatus commonly used for
measuring the surface deflection of a pavement under standard
loading conditions
Benkelman Beam
2.44 m 1.22 m
31. BITS Pilani, Hyderabad Campus
Slender beam of length 3.66m hinged at 2.44m from the pivot
Observed deflection
Rebound deflection
Benkelman Beam
32. BITS Pilani, Hyderabad Campus
• Static/Creep Loading using Benkelman beam apparatus
• Benkelman beam is used for measuring the pavement surface
deflection subjected to a standard truck load
Benkelman Beam
33. BITS Pilani, Hyderabad Campus
Length of beam from Hinge to Probe = 2.44 m
Length of beam from Hinge to Dial = 1.22 m
Distance from Hinge to front legs = 0.25 m
Distance from Hinge to rear legs = 1.66 m
Lateral spacing of front support legs = 0.33 m
CGRA Method – Beam
Details
34. BITS Pilani, Hyderabad Campus
5 tonne truck is recommended to apply load
Rear axle = 8170 kg (equally distributed over the two dual
wheel sets
Spacing between tyres = 30 – 40 mm
Tyres – 10 X 20, 12 ply
Tyre Pressure = 5.6 kg/cm2 (0.56 MPa)
CGRA Method – Loading
Details
35. BITS Pilani, Hyderabad Campus
Pressure measuring gauge
Thermometer (0-100 C)
Mandrel for making 4.5 cm deep hole in the pavement for
temperature measurement
Deflection Measurement –
Other Accessories
36. BITS Pilani, Hyderabad Campus
• Mark a Point on the pavement at 60 cm from pavement
edge for single lane roads and at 90 cm from pavement
edge for wider lanes
• For divided four lane highways, the point should be selected
at 1.5 m from edge
• Place the outer dual wheel set at the location (centred)
• Insert probe of the beam between the dual wheels.
• Probe will be on the selected point locking pin removed.
• Support frame levelled.
Deflection Measurement –
Procedure
37. BITS Pilani, Hyderabad Campus
Deflection Measurement –
Procedure
x
Direction of traffic
Pavement
Shoulder
0.9 m for a two lane
1.5 m for a divided
0.6 m for a single lane
38. BITS Pilani, Hyderabad Campus
• Beam plunger brought in contact with the stem of the dial
gauge. Initial reading in dial gauge noted
• Truck driven forward to a distance of 2.7 m. Observe
intermediate reading in the dial gauge
• Move the truck forward a further distance of 9 m and note
the final dial gauge reading
• Dial gauge readings are to be noted when either the rate of
deformation or rate of recovery is less than 0.05 mm
BBD Procedure
39. BITS Pilani, Hyderabad Campus
Benkelman Beam Placement
Placement of
Benkelman
Beam to
measure
Pavement
Deflection
40. BITS Pilani, Hyderabad Campus
• Measure the temperature every hour by inserting the
thermometer in the hole made in the bituminous surface
after filling the hole with glycerol
• Tyre pressure is checked at two to three hours interval
Deflection Measurement –
Procedure
41. BITS Pilani, Hyderabad Campus
Benkelman Beam –
Deflection Measurement
Initial Reading
Intermediate Reading
2.7 m
9 m Final Reading
42. BITS Pilani, Hyderabad Campus
• Computation of Rebound Deflection for the Point
• Subtract Final dial reading from Intermediate dia
reading. Subtract Intermediate Dial reading from
Initial reading.
• If difference between final and intermediate dial
readings is less than 0.025 mm, the actual
pavement rebound deflection is twice the difference
• If the difference is more than 0.025 mm compute the
rebound deflection as follows
Benkelman beam –
Deflection Measurement
43. BITS Pilani, Hyderabad Campus
Pavement rebound deflection = 2 (Final – Initial
readings) + 2.91 X 2 (difference between final and
intermediate readings)
Benkelman beam –
Deflection Measurement
44. BITS Pilani, Hyderabad Campus
Selection of Homogenous Sections
Benkelman beam Deflection
Survey
Classification Pavement Condition
Good No Cracking, rutting <10 mm
Fair No Cracking or cracking confined to a
crack in the wheel track, rutting
between 10 and 20 mm
Poor Extensive cracking and rutting>20mm
Sections with cracking exceeding 20
per cent shall be treated as failed
45. BITS Pilani, Hyderabad Campus
Selection of Homogenous Sections
• On the basis of surface condition survey, the total
stretch is divided into uniform sections
• Length of each section is kept at a minimum of 1 km
Benkelman beam Deflection
Survey
46. BITS Pilani, Hyderabad Campus
Deflection Measurements
• For each uniform section of road, minimum of 10 points
should be selected at equal distance in each lane of
traffic
• Points to be selected along outer wheel paths
• Interval between points should not be more than 50 m
• On roads with more than one lane, the points on the
adjacent lanes can be staggered
Benkelman beam Deflection
Survey
47. BITS Pilani, Hyderabad Campus
• In case of extreme deflection values, additional
deflection measurements to be made
• If the highest or lowest deflections differ from the
mean by more than one-third of mean then extra
deflection measurements should be made at 25 m on
either side of the point
• Measured Deflections have to be corrected to
correspond to a standard pavement temperature
• Measured deflections also have to be corrected to
correspond to worst condition
Benkelman beam Deflection
Survey
48. BITS Pilani, Hyderabad Campus
0.01 mm correction for each degree variation from
35 C
If measured deflection at 38 C = 0.8 mm, then the
corrected deflection = 0.8 – 3 X 0.01 = 0.77 mmfor
Seasonal Variation
Weakest Condition soon after monsoon. Deflection will
vary with variation in subgrade strength which is
affected by the variation in moisture content with
season
Benkelman beam Deflection
Survey
49. BITS Pilani, Hyderabad Campus
•Correction for Seasonal Variation
Field moisture content of the subgrade soil sample
has to be determined during the deflection survey
Soil type (classification) also has to be determined
Correction factors are available for different types
of subgrade soils, different rainfall conditions and
different field moisture contents
3-categories of soils – clayey with low plasticity (PI
< 15), clayey with high plasticity (PI > 15) and
sandy/gravelly
Benkelman beam Deflection
Survey
56. BITS Pilani, Hyderabad Campus
length of the uniform stretch selected
Characteristic deflection, Dc = Mean (X) of all the
measured deflections + k * standard deviation () of
measured deflections
For major arterial roads like NH & SH Dc
= X + 2
For all other roads
Dc = X +
Estimation of Characteristic
Deflection
57. BITS Pilani, Hyderabad Campus
Design of Overlay
involves the following steps
1. Selection of Design period
2. Projection of Commercial traffic for the design
period
3. Estimation cumulative standard axle load
repetitions
for the design period
4. Selection of characteristic rebound deflection for
the existing pavement on the basis of rebound
deflection survey conducted using Benkelman
beam
58. BITS Pilani, Hyderabad Campus
Traffic : A = P (1 + r)n+10
A = commercial vehicles per day in the year of
completion of construction
P = commercial vehicles per day at last count
r = Annual rate of increase of commercial vehicles
(7.5%)
n = Number of years between the last count and
the year of completion of overlay construction
Estimation of Traffic for
design period
59. BITS Pilani, Hyderabad Campus
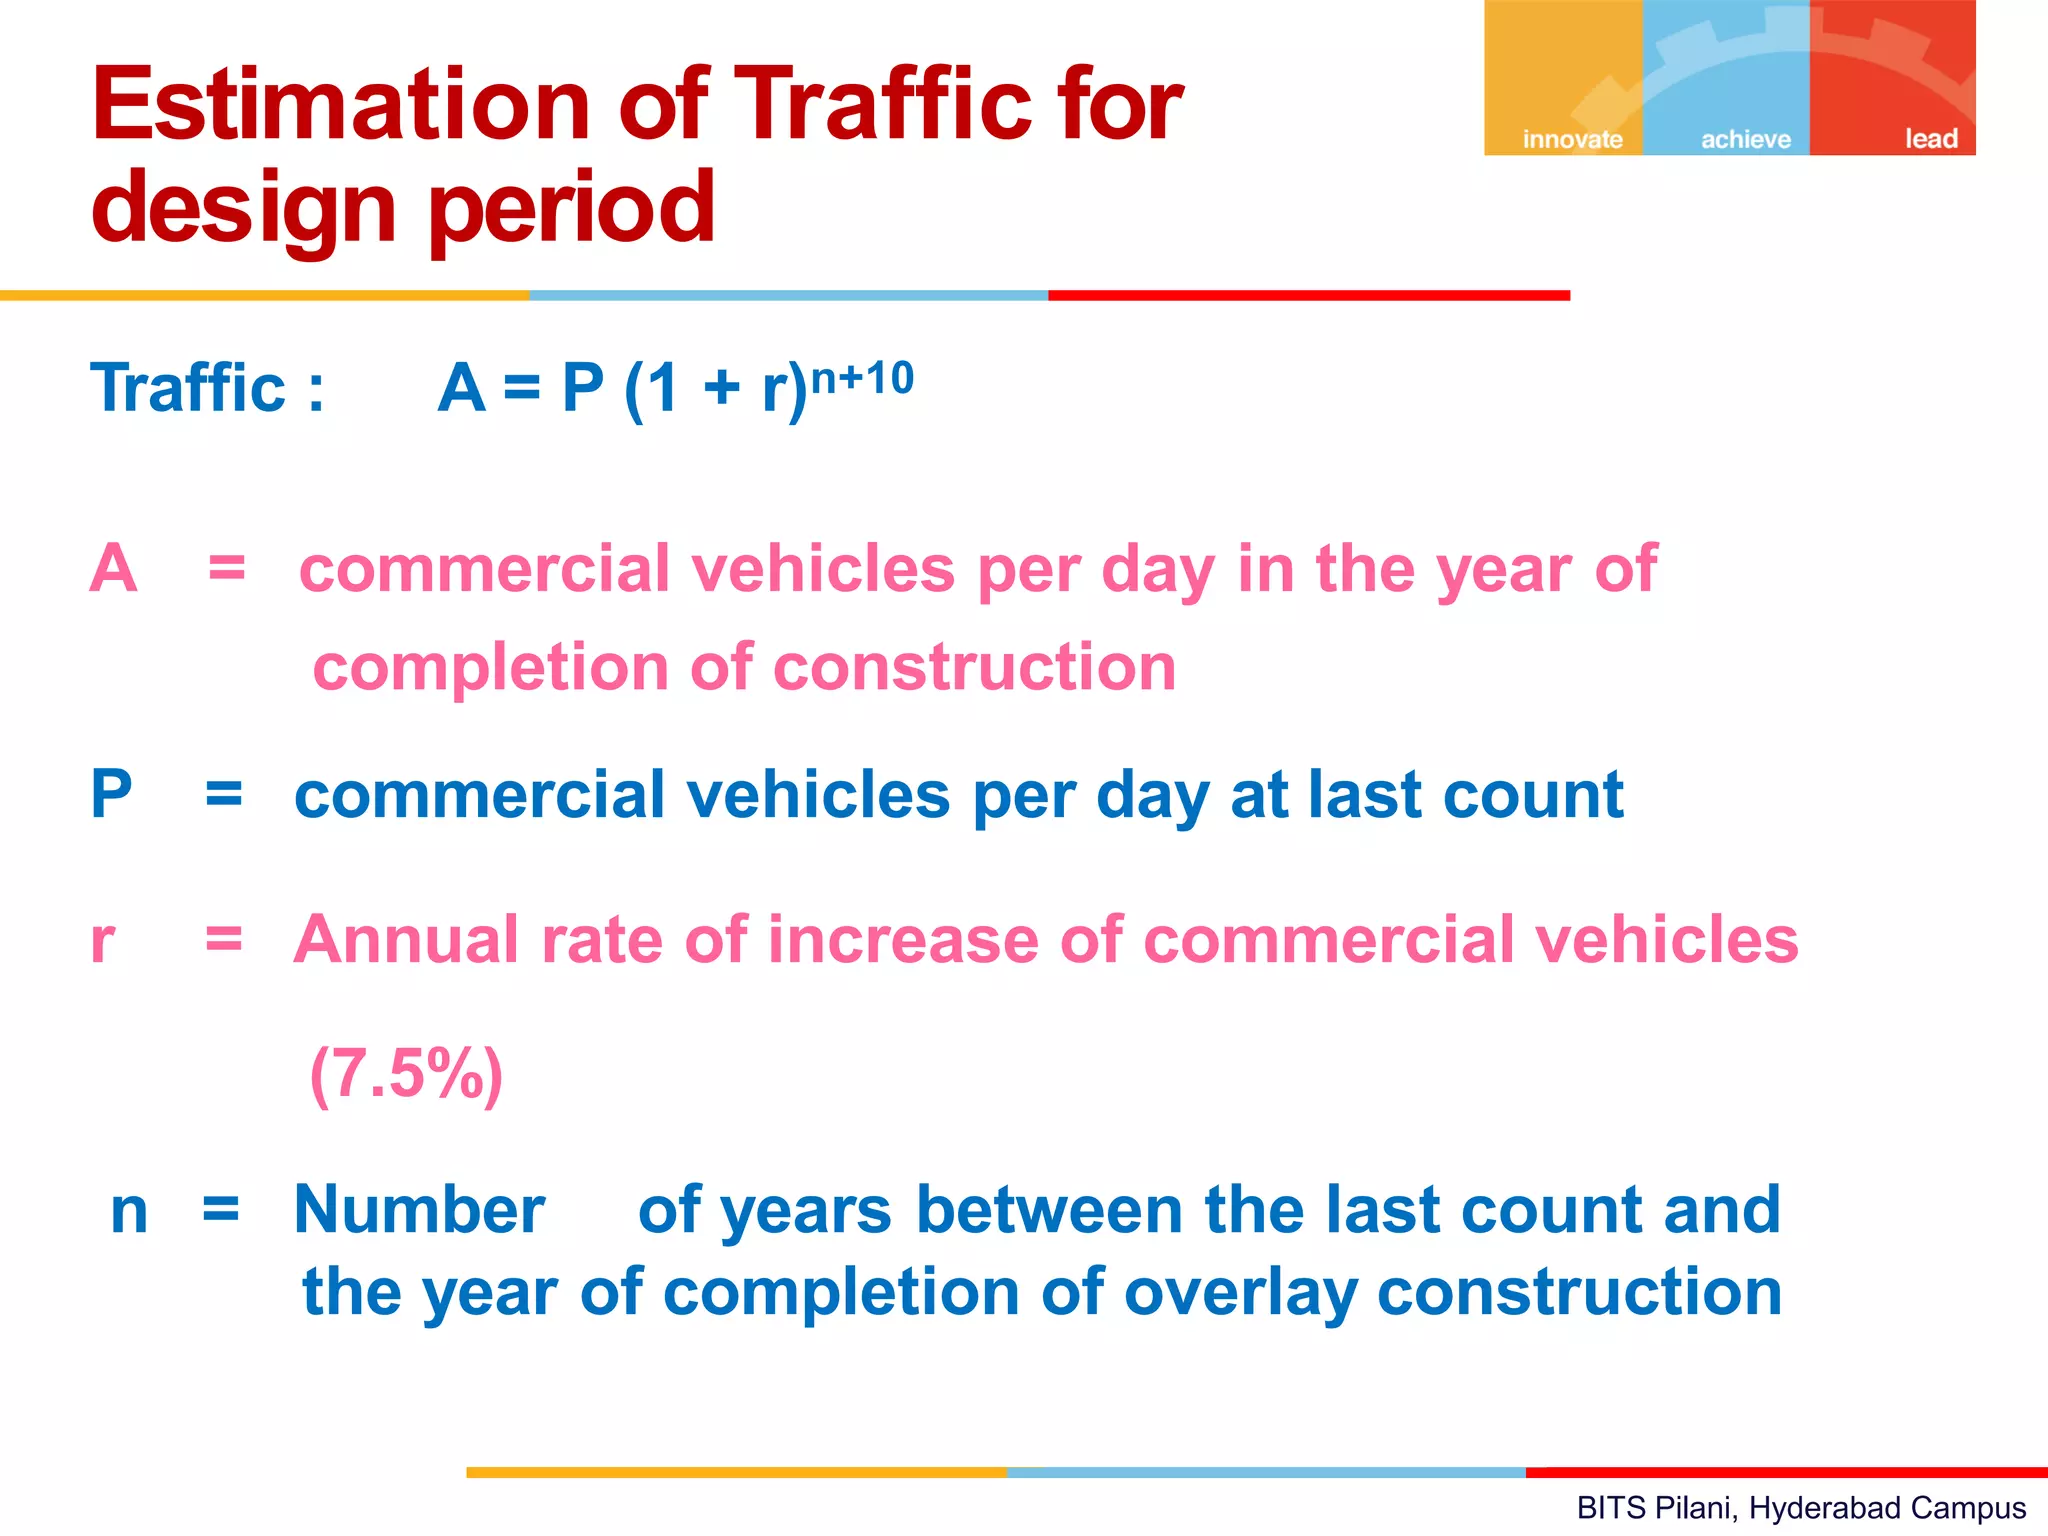
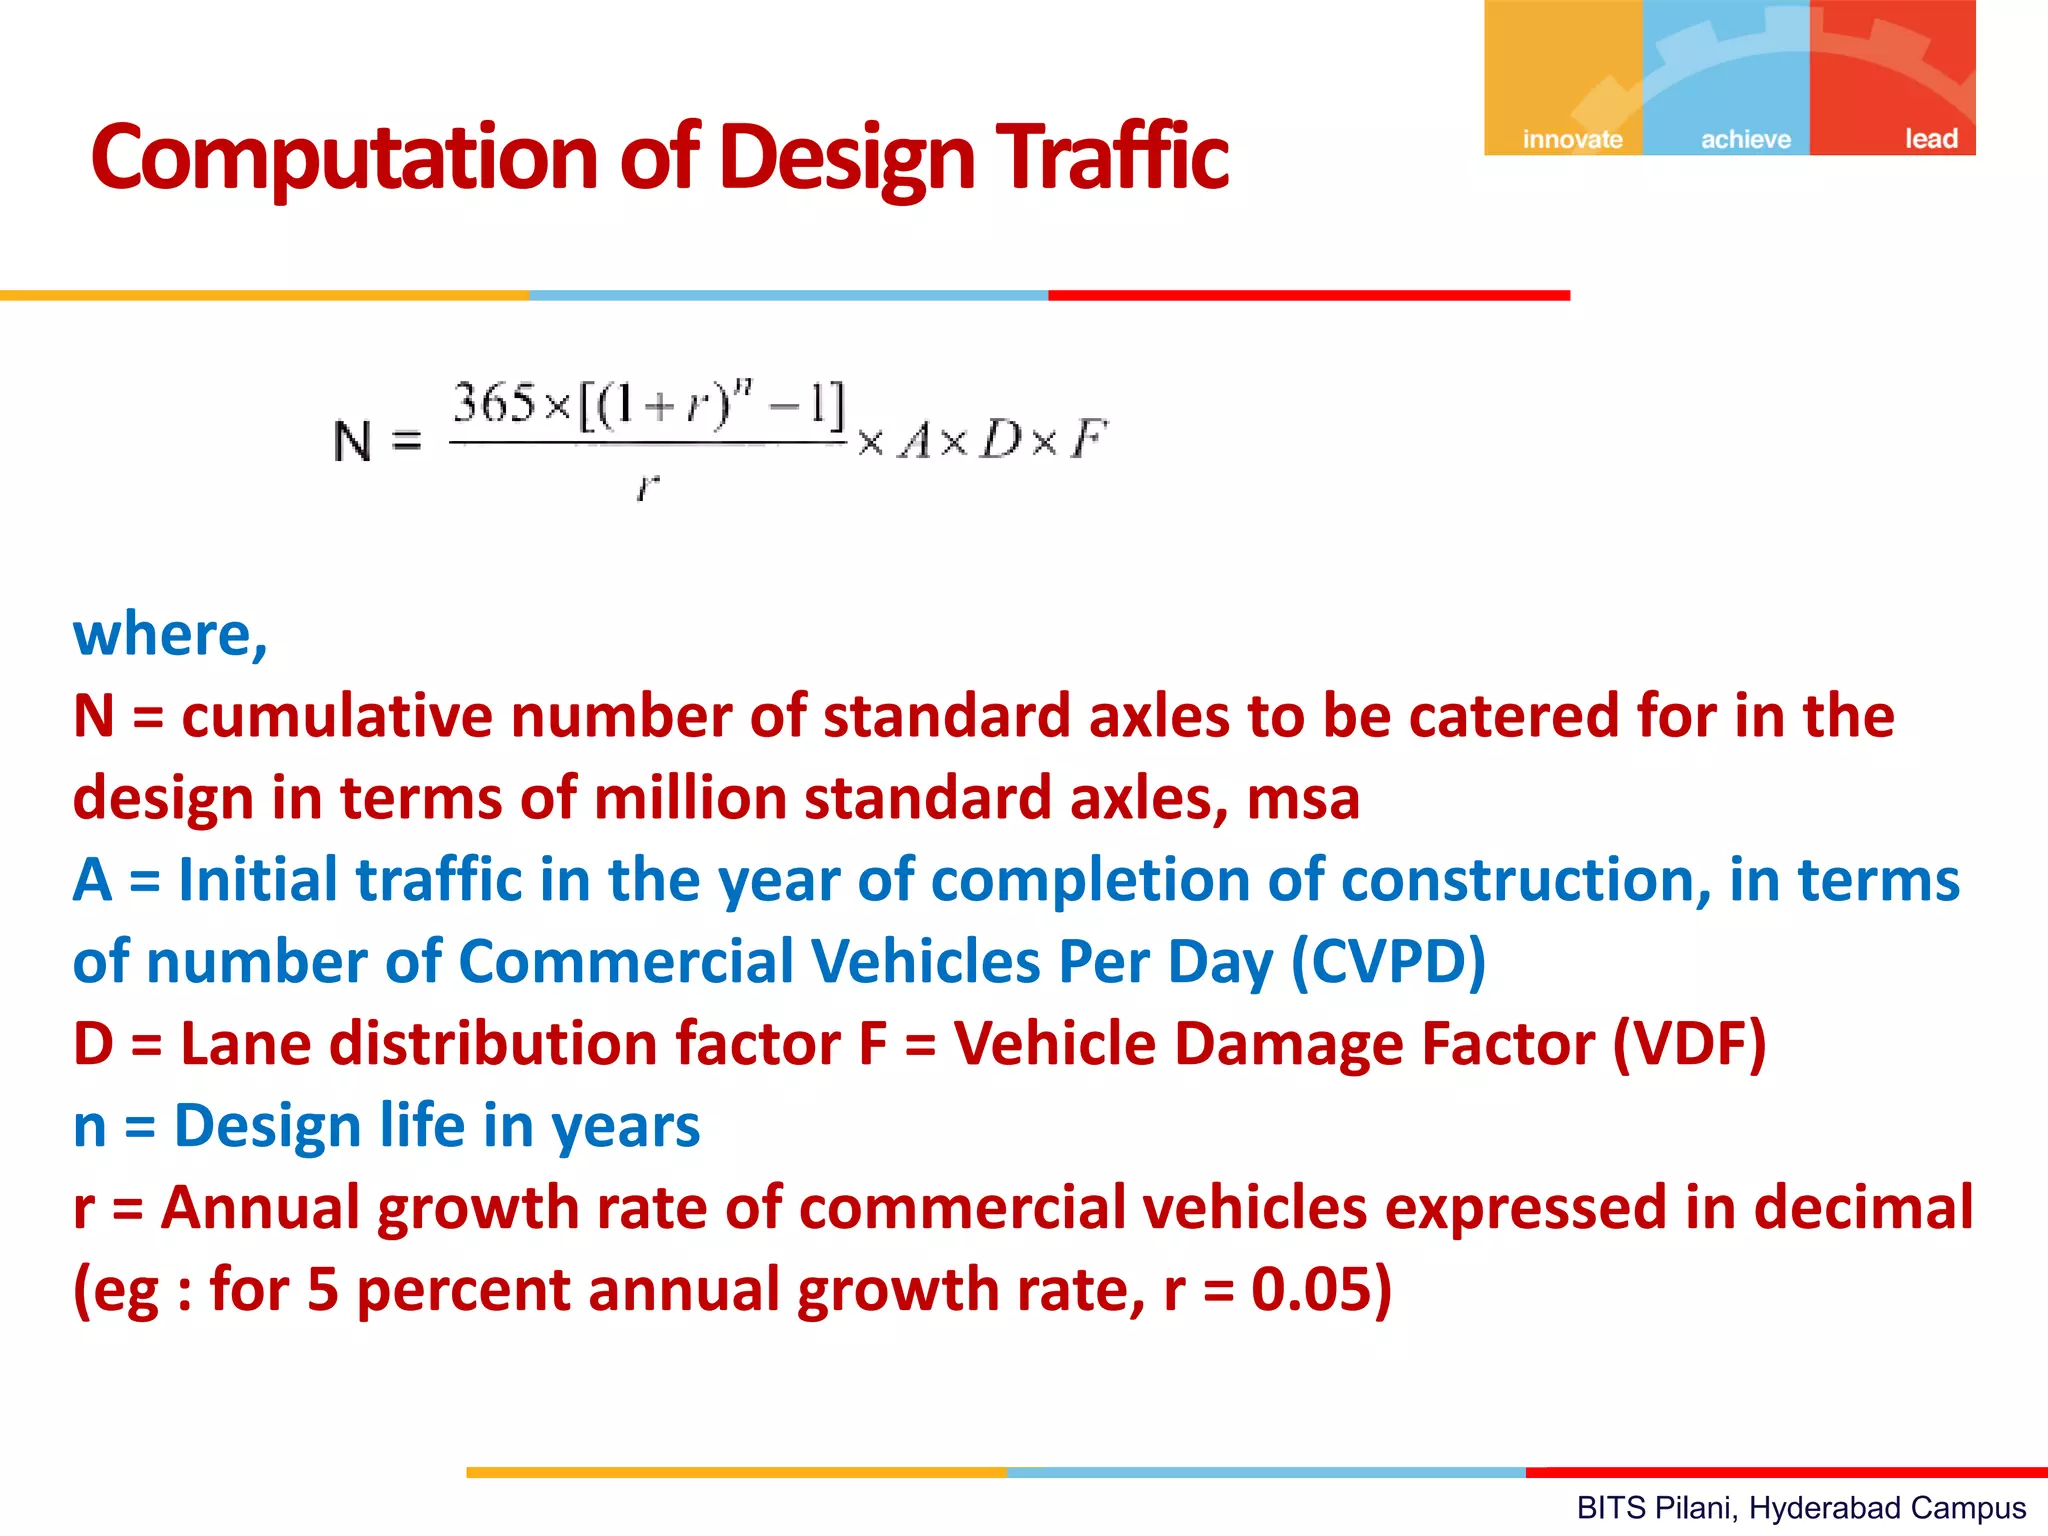
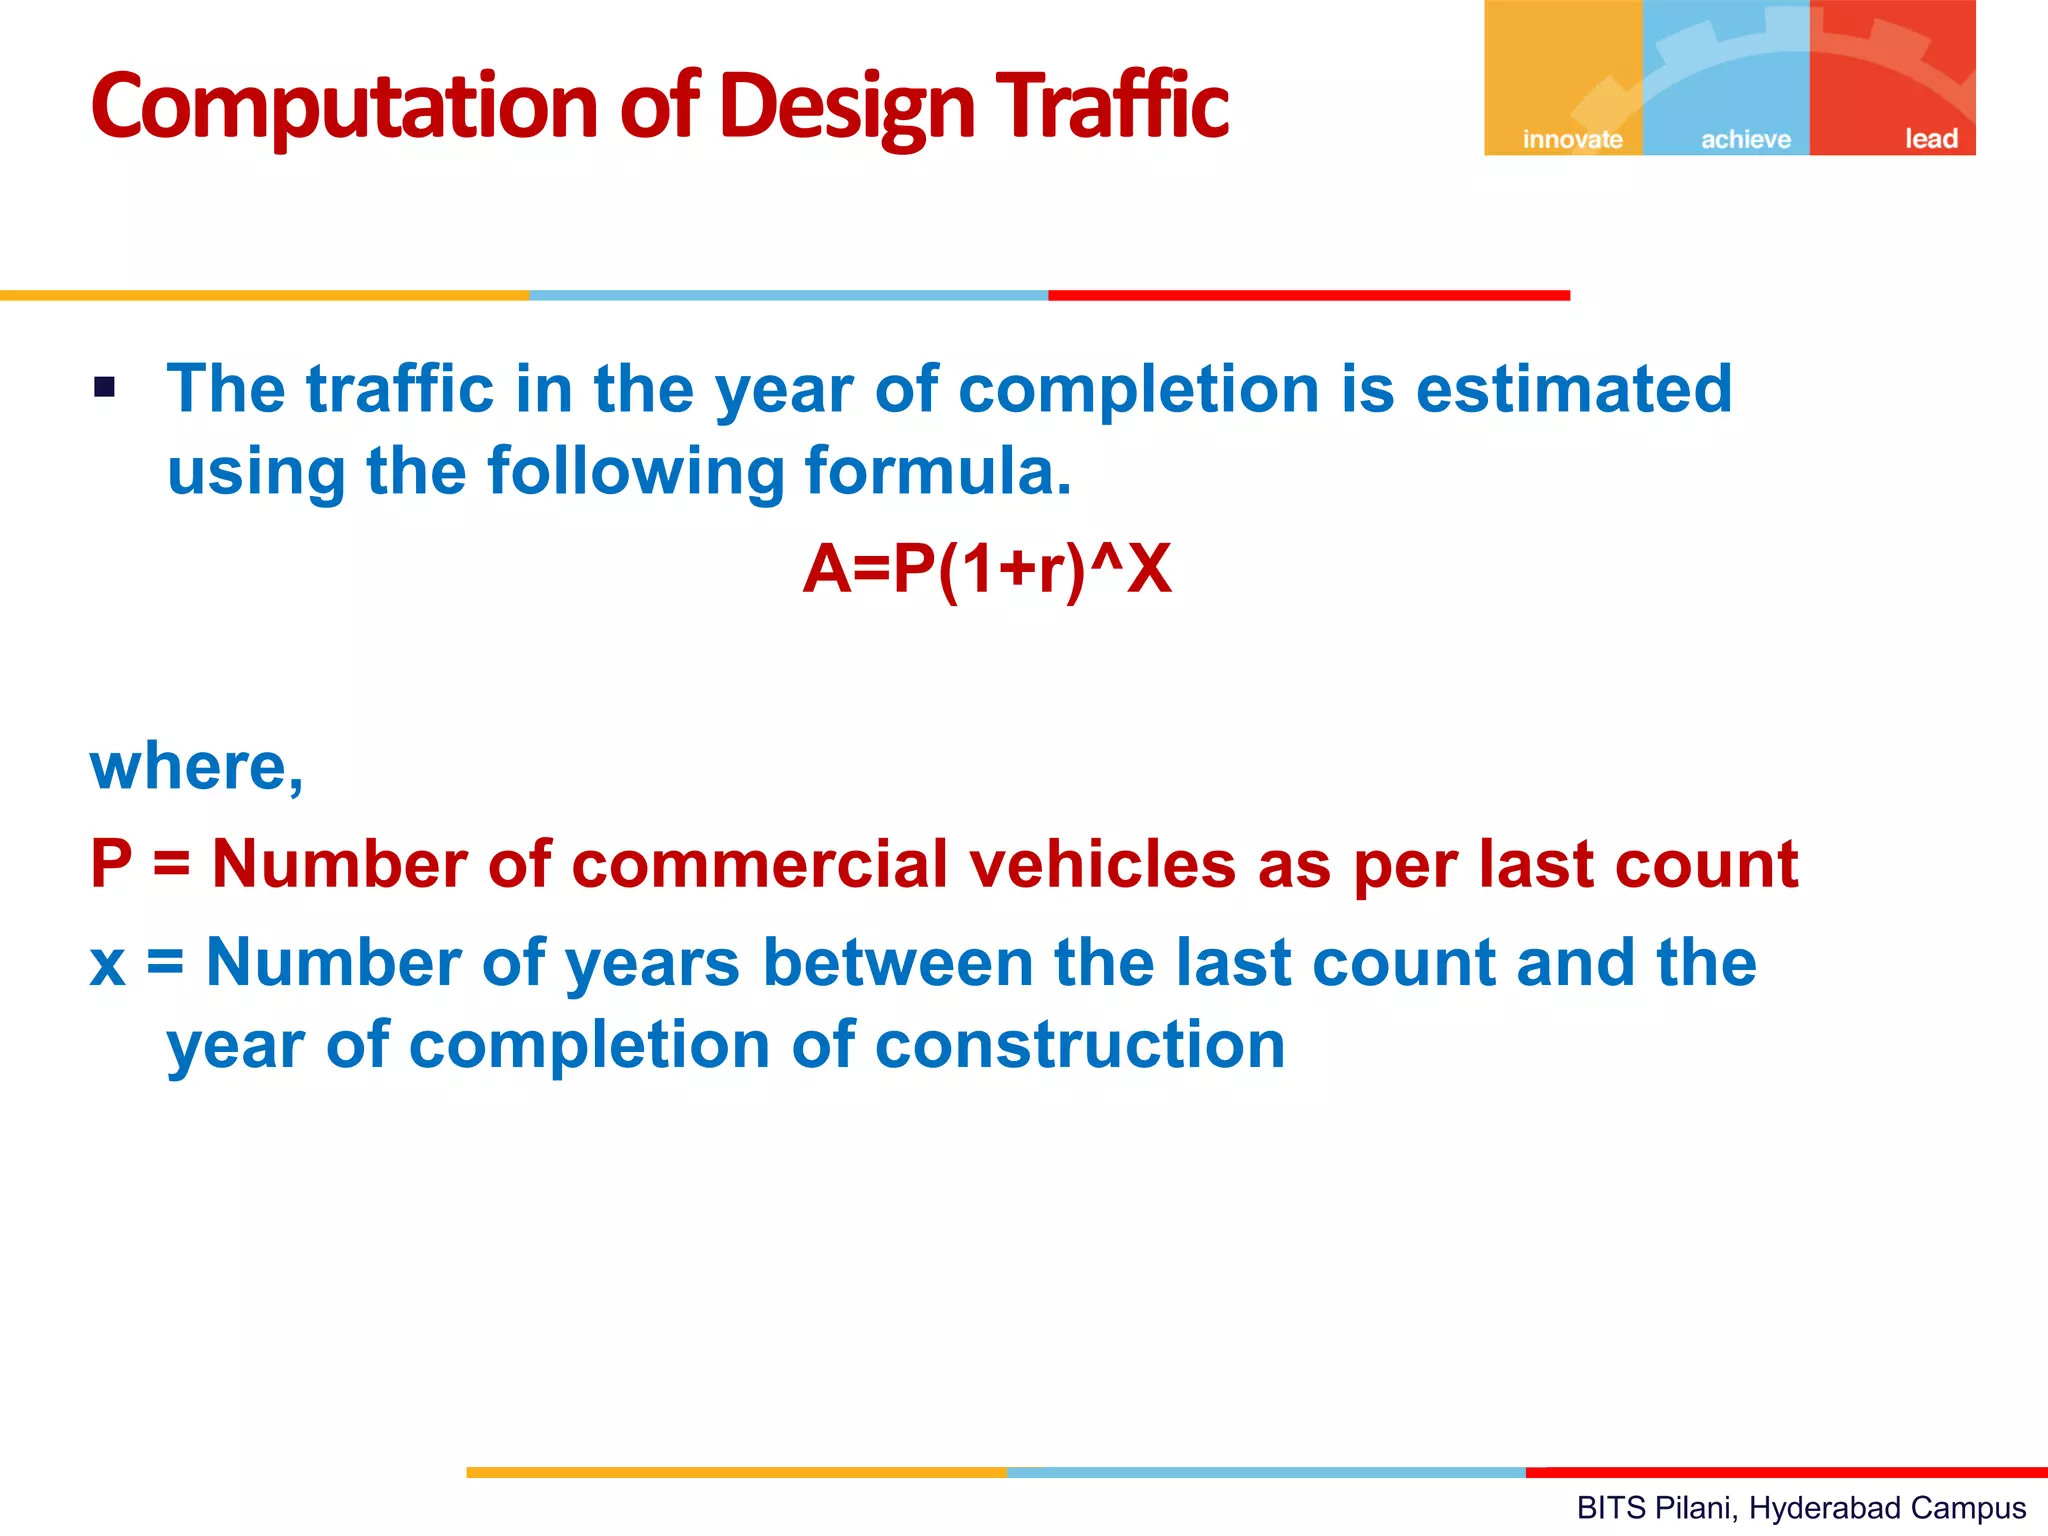
= 365 x A [(1+ r)x – 1] x F
-----------------------------
r
Where N = cumulative number of standard axles to be catered for
during the design period
A = Initial traffic in the year of completion of construction
modified to account for the lane distribution
r = Annual rate of growth of commercial vehicles (7.5%) x =
X= Design life, years (10 for major roads, 5 for less important roads)
F = Vehicle Damage Factor
Estimation of Traffic for
design period
60. BITS Pilani, Hyderabad Campus
Single Lane (3.75m width) – Total two-way
commercial traffic multiplied by two
2-lane single carriageway (2-way traffic) – 75% of total
two- way traffic
4-lane single carriageway – 40% of total two way
commercial traffic
Dual carriageway – 75 % of commercial volume in
each direction for dual 2-lane carriageway
For each additional lane, reduce the distribution factor
by 20%
Estimation of Traffic for
design period
61. BITS Pilani, Hyderabad Campus
To be obtained from axle load survey
Indicative VDF Values are
0-150 cvpd Initial traffic – 1.5 (Rolling/Plain) 0.5 (Hilly)
150-1500 cvpd – 3.5 (Rolling/Plain) 1.5 (Hilly)
> 1500 cvpd – 4.5 (Rolling/Plain) 2.5 (Hilly)
Estimation of Traffic for
design period
62. BITS Pilani, Hyderabad Campus
• Thickness charts give the overlay requirement in
terms of Bituminous Macadam construction
• BM can be converted into other materials using
equivalency factors
BM = 1.5 WBM / WMM
1 BM = 0.7 DBM / BC
• Minimum thickness of overlay = 50 mm BM with an
additional surfacing course of 50 mm DBM or 40 mm
BC
Overlay Design
64. BITS Pilani, Hyderabad Campus
A and B are for two different pavement systems having the
same maximum deflection but different deflection bowl
shapes
Maximum deflection alone does not give an indication of the
condition of different components of the pavement
Benkelman Beam Evaluation
of Pavements
A
B
71. BITS Pilani, Hyderabad Campus
Aging of Bitumen
From production toend of bituminous surface life
Shell Bitumen Hand Book- Redrawn
Aging
during
mixing
Aging during storage,
transport and application
Aging after 8
years Service
Aging
Index
Age, Years
0 years 8 years
73. BITS Pilani, Hyderabad Campus
Structural Evaluation- General
Structural Evaluation of Pavements involves the
application of standard load to the pavement and
measuring its responses in terms of stresses, strains
and deflections.
Benkleman Beam is used as the earlier equipment
for structural evaluation.
A static load is applied on the pavement surface and
rebound deflections are measured at one or more
locations.
Measurement of static load does not simulate the
loading conditions produced by moving conditions.
74. BITS Pilani, Hyderabad Campus
Benkleman Beam will under estimate the strength of
DBM and BC.
It is labor intensive and time consuming method and
test results are mostly affected by moving traffic on
the adjacent lanes.
It is unsafe for heavy traffic conditions (safety) .
Repeatability of test results is always a concern.
This method does not predict the properties of the
individual layers which is necessary for comprehensive
evaluation of pavement.
BenklemanBeam–Limitations
78. BITS Pilani, Hyderabad Campus
What is FWD?
Falling Weight Deflectometer (FWD) is the device
that measure the deflection response of structures
due to a load generated by the arrest of a falling
mass.
Data collected by FWD is generally used to calculate
the stiffness or stiffness-related parameters of
pavements or pavement layers.
FallingWeight Deflectometer
79. BITS Pilani, Hyderabad Campus
Factors Influencing the performance of flexible pavements
such as thickness, subgrade strength, quality of each layer,
pavement surface temperature.
When a moving wheel load passes over the pavement it
produces impulses.
Normal stresses at a location in the pavement will increase
from zero to peak value as the moving wheel load
approaches the location.
The time taken for the stress pulse to vary from zero to peak
value is termed as the rise of pulse.
The time period during which the magnitude of stress pulse
varies from 'zero-to-peak-to-zero' is the pulse duration.
FallingWeight Deflectometer
80. BITS Pilani, Hyderabad Campus
Peak load and the corresponding pavement responses are of
interest for pavement evaluation.
The resulting load-deflection data can be interpreted through
appropriate analytical techniques, such as back calculation
technique, to estimate the elastic moduli of the pavement layers.
The computed moduli are, in turn, used for
(i) The strength evaluation of different layers of in-service pavements
(ii) The estimation of the remaining life of in-service pavement
(iii) Determination of strengthening requirement, if any and
(iv) Evaluation of different rehabilitation alternatives (overlay, recycling,
partial reconstruction, etc.)
FallingWeight Deflectometer
81. BITS Pilani, Hyderabad Campus
FWD is an impulse loading device.
The load is applied by falling mass over a circular loading
plate and the deflected shape of the pavement surface i.e.
deflection bowl is measured.
Deflections are measured by displacement sensors placed
under the load and also at a distance of 0, 300, 600, 900,
1200, 1500 and 1800 mm.
Different magnitude of impulse load can be obtained by
selection of a suitable mass and an appropriate height of
fall.
Drop 100 to 600 mm can be used.
PrincipleofFWD(IRC115-2014)
82. BITS Pilani, Hyderabad Campus
Typical Falling Weight Deflectometer (FWD) include a circular
loading plate of 300 or 450 mm diameter.
In general 300 mm diameter load plate is recommended.
A rubber pad of 5 mm minimum thickness should be glued
to the bottom of the loading plate for uniform distribution of
load.
Alternatively, segmented loading plates (with two to four
segments) can be used for better load distribution.
Generaldetails ofFWD
83. BITS Pilani, Hyderabad Campus
The measured deflection are normalized for a standard target
load of 40 kN.
Can be increased to produce at least 10 µm at 1200 mm
distance.
Measured deflections can be normalized for 40 kN (linear)
(eg 0.8*40/45 if the measured deflection is 0.8 mm at 45 kN).
Calibration of FWD is essential for getting accurate and
reproducible results.
15 to 50 ms loading time.
6 to 9 deflection sensors (1 µm resolution or 2% of the load
cell reading).
Different sensor configurations.
Generaldetails ofFWD
84. BITS Pilani, Hyderabad Campus
A falling mass in the range of 50 to 350 kg is dropped from a
height of fall in the range of 100 to 600 mm to produce load
pulses of desired peak load and duration.
Heavier models use falling mass in the range of 200 to 700 kg.
The target peak load to be applied on bituminous pavements
is 40 kN (+/- 4 kN), which corresponds to the load on one dual
wheel set of a 80 kN standard axle load.
The target peak load can be decreased suitably if the peak
maximum (central) deflection measured with 40 kN load
exceeds the measuring capacity of the deflection transducer.
Generaldetails ofFWD
85. BITS Pilani, Hyderabad Campus
Typical geophone position configurations (number and radial
distances measured from center of load plate) commonly
used for flexible pavement evaluation are :
(i) 7 sensors at 0, 300, 600, 900, 1200, 1500 and 1800 mm radial
distances.
(ii) 7 sensors at 0, 200, 300, 450, 600, 900, 1500 mm radial
distances.
(iii) 6 sensors at 0, 300, 600, 900, 1200 and 1500 mm radial
distances and
(iv) 6 sensors at 0, 200, 300, 600, 900, 1200 mm radial
distances.
Displacement Sensors offsets for
FWD
87. BITS Pilani, Hyderabad Campus
Static calibration
• The load cells used in the FWD should be calibrated in a
standard laboratory and the readings of the load cells should
be matched to those of the reference load cell.
• The readings of the FWD load cells should be accurate to 2
percent of the reference load cell readings.
• The date of calibration of the load cell should not be earlier
than 365 days from the date of structural evaluation of
pavements using FWD.
Calibration ofFWD
88. BITS Pilani, Hyderabad Campus
Load repeatability
• For this test, FWD measurements should be carried out on a
level bituminous pavement surface, which does not have
any cracking.
• The range of load applied should generate peak central
deflections in the range of 250 m to 600 m.
• The standard deviation of the peak load in the load
repeatability test estimated from a minimum of twelve load
drops should be less than 5 percent of the mean value of
peak load.
• Load repeatability may be checked before using the FWD for
any major investigation.
Calibration ofFWD
89. BITS Pilani, Hyderabad Campus
Absolute calibration of deflection transducers
• Dismounted deflection transducers should be calibrated in a
laboratory (±2 percent of the reference deflections).
• The calibration of geophones should be done every year.
• Check for deflection repeatability.
• The standard deviation should be ±5% of the mean value wrt
the normalized deflections.
• The deflections produced in this test should 250 µm to 600 µm.
• Difference between max and min deflections should be ±4 µm.
Calibration of FWD
90. BITS Pilani, Hyderabad Campus
Construction history, performance data, etc. should be
collected.
Pavement Condition Survey – Rutting and cracking.
Data recorded for 50 m X 3.5 m blocks.
Uniform sections identified (Good, Fair, Poor) as per guidelines
given.
FWDEvaluation
93. BITS Pilani, Hyderabad Campus
The length of uniform section is 1.0 km.
The actual spacing can be obtained by multiplying the spacing
by the length of uniform section.
Deflections may be measured along the hard shoulders if the
same are proposed to form part of the new lane in case of
widening projects.
Guidelines forSelection of
Deflection Measurement
94. BITS Pilani, Hyderabad Campus
Positions of wheel paths must be identified by observing the
surface condition of the road. If the same cannot be done,
the following guidelines can be used for identifying the
outermost wheel path.
Outer wheel paths of outer lanes :-
i) For single-lane two-way carriageway :- at 0.6 m from the
outer edge of the outer lane.
ii) For two-lane two-way carriageway and for multi-lane single
carriageway :- at 1.0 m from the outer edge of outer lane.
iii) For divided carriageways with two or more lanes in each
direction :- 0.75 m from the outer edge of outer lane.
Positions ofwheelpaths
95. BITS Pilani, Hyderabad Campus
Outer wheel paths of inner lanes :-
i) For multi-lane single carriageway :- at 4.0 m from the outer
edge of outer lane.
ii) For divided carriageways with two lanes in each direction 4.2
m from the outer edge of outer lane.
iii) For divided carriageways with three lanes in each direction
4.2 m from the outer edge of outer lane for central lane and
at 5.2 m from the outer edge of outer lane for the lane
adjacent to median.
Positions ofwheelpaths
96. BITS Pilani, Hyderabad Campus
The following data should be recorded for each test point.
1. Identify the Section
2. Lane Position (outer lane, inner lane, etc.)
3. Transverse position of test point
4. Measurement spacing
5. Time of test
6. Air temperature and pavement temperature at 40 mm depth
7. Drop number
8. Peak values of load and deflections for each drop
9. Time history of load and deflections for one of the test points
of each road section
10. Number of sensors and the Load plate diameter
FWD-Data Collection
97. BITS Pilani, Hyderabad Campus
1. Mark the test point.
2. Centre the load plate over the test point.
3. Lower the loading plate onto the pavement.
4. Lower the frame holding the geophones.
5. Raise the mass to a pre-determined height for a target
load of 40 kN.
6. Drop one seating load, and do not record.
7. Raise the mass and drop it for recording the readings.
8. Repeat step 7 for two more times.
Stepsformeasuring deflection ata
testpoint
98. BITS Pilani, Hyderabad Campus
9. During steps 7 and 8, if the deflections measured are too large
or too small, the test may be repeated by changing the peak
load.
10. Raise the geophone frame and load plate and move to the next
test Location.
11. Record air and pavement temperatures at half hourly interval.
12. Record pavement surface temperature (optional).
13. Deflection measurements should not be made when the
pavement temperature is more than 45 °C. Guidelines given in
Clause 6.4.3 may be followed for deflection measurement in
colder areas and areas of altitude greater than 1000 m.
Stepsformeasuring deflection ata
testpoint
99. BITS Pilani, Hyderabad Campus
Pavement layer thicknesses are essential inputs to the process
of back calculation of layer moduli and, in turn, to the
estimation of remaining life and overlay requirements of the in-
service pavement.
Layer thicknesses can be obtained from historical data, by
coring bound layers and/or by excavating test pits and/or
through the non-destructive technique of Ground Penetrating
Radar (GPR) survey.
It is recommended that 0.6 m x 0.6 m test pits be excavated at
1.0 km interval or at suitable larger interval where other records
suggest uniformity of pavement composition in such larger
sections.
Determination ofPavement Layer
Thicknesses
100. BITS Pilani, Hyderabad Campus
Dynamic Cone Penetrometer (DCP) tests may be
conducted on the subgrade layer exposed in the test
pits to obtain the Dynamic Cone Penetrometer value
for in-situ subgrade.
The DCP values obtained with a 60° cone can used
to estimate the back calculated modulus value of
subgrade layer using equation:
DCP = Dynamic Cone Penetrometer value (mm/blow)
Dynamic ConePenetrometer (DCP)
101. BITS Pilani, Hyderabad Campus
Deflections should decrease with distance.
Deflection should not be more than the capacity of the
sensor.
No FWD test when the temperature is more than 45 degree
Celsius.
Collect layer thickness data.
Analysis ofData
102. BITS Pilani, Hyderabad Campus
Estimation ofsamplesize
The following equation can be used for estimating the sample
size (n)
n = sample size
z = normalized normal deviate which can be obtained from
standard
statistical tables for a selected confidence level
CV = coefficient of variation of deflection (standard
deviation/mean) expressed as percentage
ME = acceptable margin of error (as percentage of mean)
103. BITS Pilani, Hyderabad Campus
90% confidence level and 10% acceptable margin of error
(ME) recommended.
CV of 15, 30 and 45% may be considered for Good, Fair and
Poor sections (AASHTO 1993).
For a one sided confidence level of 90% for which the
standard normal deviate is 1.285 and for 10% ME, the values
of n for Good , fair and Poor sections are 4, 15, 33
If the uniform section length is 2.0 km and is fair, 15
observations should be made in 2.0 km , ie at a spacing of
2000/15 = 133 m.
Measurement scheme given for different carriageways.
Estimation ofsamplesize
104. BITS Pilani, Hyderabad Campus
A statistical technique popularly used for identification of
homogeneous sections is the "Cumulative Difference"
approach.
The series of cumulative differences (zj for the measured
sequence of a given variable 'x' (SCI, subgrade strength, etc.)
can be obtained using the following expression.
Identification ofhomogeneous
sections
105. BITS Pilani, Hyderabad Campus
Back Calculation is the process of selection and adjustment
of layer moduli using any technique (iteration, database
searching, closed-form solution, optimization) so that the
deflections computed using the adjusted layer moduli are
close to the measured deflections.
Backcalculation
106. BITS Pilani, Hyderabad Campus
BackCalculation InANutshell
Most back calculation programs, including those used to generate
the back calculated modulus data in the LTPP-computed parameter
tables, involve the use of numerical integration subroutines that
are capable of calculating FWD pavement deflections and other
parameters, given the stiffness's (or moduli) of the various
pavement layers and their thicknesses, etc.
If all assumptions are correct, meaning each layer is an elastic
layer, is isotropic and homogeneous, and all other boundary
conditions are correct, then it is possible to iterate various
combinations of moduli until there is a virtually perfect match
between measured and theoretical FWD deflections.
In this manner, a solution to the problem of deriving moduli from
deflections, instead of the other way around, is obtained.
107. BITS Pilani, Hyderabad Campus
Back calculate using KGPBACK.
Suitable moduli ranges are to be assigned.
Subgrade 20 to 100 MPa or 5 to 20 times CBR (in-situ CBR
estimated from DCP) OR from deflections measured at 1200
mm, 1500 mm and 1800 mm.
Granular 100 to 500 MPa.
Thick bituminous layers without much cracking (750 to 3000
MPa).
Distressed Bituminous layers (fair to Poor) 400 MPa to 1500
MPa.
Backcalculation using KGPBACK
108. BITS Pilani, Hyderabad Campus
IRC:37 performance criteria for design of bituminous
pavements can be used.
Rutting along wheel paths and cracking of bituminous layer
are the main distresses considered.
Performance Criteria
110. BITS Pilani, Hyderabad Campus
Indian Roads Congress (IRC:37-2001) adopts Linear Elastic
Layered Theory for analysis of flexible pavements.
Recommends that the pavements be modeled as Three –
Layer Systems with Bituminous surface, granular base and
subgrade.
Interfaces between layers are considered to be rough
The top two layers are assumed to be infinite in horizontal
direction while the subgrade in semi-infinite.
Computation ofStrains
111. BITS Pilani, Hyderabad Campus
Computation ofStrains
Inputs required for analysis
Thicknesses of the first
two layers
Elastic moduli of the
three layers
Poisson ratio values of
the three layers
112. BITS Pilani, Hyderabad Campus
Loading Considered Standard axle load (80 kN) – One dual
wheel set only is considered, tyre pressure 0.56 MPa (80 psi).
Computation ofCritical Strains
115. BITS Pilani, Hyderabad Campus
Correction for Temperature
The backcalculated modulus of bituminous layer obtained
from deflection survey conducted at a temperature “T2” °C
can be corrected to estimate the modulus corresponding to a
temperature of "T1" °C using equation.
Backcalculation ofLayerModuli
2
116. BITS Pilani, Hyderabad Campus
CorrectionforTemperature
The relationship can be extrapolated up to a temperature
range of 20 to 45 °C.
Temperature correction need not be applied to backcalculated
modulus values of thin bituminous layers (less than 40 mm)
and for "poor" sections.
In colder areas and areas of altitude greater than 1000 m
where the average daily temperature is less than 20 °C for
more than 4 months in a year, the standard pavement
temperature of 35 °C will not apply.
119. BITS Pilani, Hyderabad Campus
Computation ofDesign Traffic
where,
N = cumulative number of standard axles to be catered for in the
design in terms of million standard axles, msa
A = Initial traffic in the year of completion of construction, in terms
of number of Commercial Vehicles Per Day (CVPD)
D = Lane distribution factor F = Vehicle Damage Factor (VDF)
n = Design life in years
r = Annual growth rate of commercial vehicles expressed in decimal
(eg : for 5 percent annual growth rate, r = 0.05)
120. BITS Pilani, Hyderabad Campus
The traffic in the year of completion is estimated
using the following formula.
A=P(1+r)^X
where,
P = Number of commercial vehicles as per last count
x = Number of years between the last count and the
year of completion of construction
Computation ofDesign Traffic
121. BITS Pilani, Hyderabad Campus
i) Single-lane roads (3.75 m width)
Traffic tends to be more channelized on single-lane roads
than two-lane roads and to allow for this concentration of
wheel load repetitions, the design should be based on total
number of commercial vehicles in both directions.
ii) Two-lane single carriageway roads
The design should be based on 50 percent of the total
number of commercial vehicles in both directions. If vehicle
damage factor in one direction is higher, the design traffic in
the direction of higher VDF is recommended.
Distribution ofcommercial traffic
overthecarriageway
122. BITS Pilani, Hyderabad Campus
iii) Four-lane single carriageway roads
The design should be based on 40 percent of the total
number of commercial vehicles in both directions.
iv) Dual carriageway roads
The design of dual two-lane carriageway roads should be
based on 75 percent of the number of standard axles in each
direction. For dual three-lane carriageway and dual four-lane
carriageway, the distribution factor will be 60 percent and 45
percent respectively.
Distribution of commercial
traffic over the carriageway
123. BITS Pilani, Hyderabad Campus
The Vehicle Damage Factor (VDF) is a multiplier for
converting the number of commercial vehicles of different
axle loads to equivalent number of standard axle load (80
kN) repetitions.
It gives the equivalent number of standard axles per
commercial vehicle.
The vehicle damage factor is arrived at from axle load
surveys conducted on typical road sections so as to cover
various influencing factors such as traffic mix, type of
transportation, type of commodities carried, time of the
year, terrain, road condition and degree of enforcement.
VehicleDamage Factor(VDF)
125. BITS Pilani, Hyderabad Campus
The following equations are used to compute equivalent
axle load factors for different axles assembly.
Equivalent axleloadfactors
127. BITS Pilani, Hyderabad Campus
(i) Measurement of surface deflections of the in-service
pavement homogeneous section using FWD.
(ii) Normalization of the deflections to correspond to a
standard load of 40 kN.
(iii) Collection of information about layer type and layer
thicknesses.
(iv) Backcalculation of pavement layer moduli from the
normalized deflections using an appropriate backcalculation
software.
OVERLAYDESIGN
128. BITS Pilani, Hyderabad Campus
(v) Adjustment of the bituminous layer modulus
(backcalculated) to a standard temperature of 35 C
(vi) Adjustment of the subgrade modulus to correspond to
post-monsoon condition.
(vii)Analysis of the in-service pavement using elastic layer
theory with the backcalculated (corrected) moduli and
layer thicknesses collected from field as inputs.
OVERLAYDESIGN
129. BITS Pilani, Hyderabad Campus
(vii)This includes computation of critical Strains
o Horizontal Tensile Strain at the bottom fiber of bituminous
layer.
o Vertical Compressive Strain on top of subgrade. The loading
configuration and the locations of critical strains considered
for analysis will be similar to those adopted in IRC:37-2012.
(viii) Estimation of the remaining life of the pavement using the
fatigue and rutting performance criteria adopted in IRC:37. The
strain values obtained in step vii will be used to estimate the
remaining lives from fatigue and rutting consideration.
OVERLAYDESIGN
130. BITS Pilani, Hyderabad Campus
(ix) For design of bituminous overlay, a trial thickness of
overlay of an appropriate material has to be selected and
the critical strains have to be evaluated. The modulus value
of the bituminous overlay material may be selected as per
the guidelines given in IRC:37-2012.
(x) Design overlay thickness can be selected by trial in such a
way that the computed critical strains are less than the
permissible limits given by the performance criteria for the
design traffic level considered.
OVERLAYDESIGN
131. BITS Pilani, Hyderabad Campus
Available methods differ in terms of
(1) Pavement system considered
(2) Theory used for the analysis of pavement
(3) Backcalculated parameters and
(4) Backcalculation technique
Backcalculation Methods
132. BITS Pilani, Hyderabad Campus
Number of commercial backcalculation softwares available.
Different models were developed at IIT Kharagpur
o Regression
o ANN
o GA-based
o ANN-GA based
BACKGA – A GA based model is used currently
Backcalculation Models
133. BITS Pilani, Hyderabad Campus
• FWD pavement evaluation data includes
Load applied
Load plate radius
Surface deflections at different radial distances
• This data is used to Back calculate the material
properties of different layers in flexible pavements.
• Thicknesses of flexible pavement layers also can be
back calculated though layer thicknesses are usually
taken as inputs for back calculation.
Interpretation of FWD data
134. BITS Pilani, Hyderabad Campus
It is the process of selection and adjustment of layer
moduli using any technique (iteration, database
searching, closed-form solution, optimization) so that
the deflections computed using the adjusted layer
moduli are close to the measured deflections.
Back calculation
135. BITS Pilani, Hyderabad Campus
Major Highways-
Structural Overlay of
Pavements using FWD
(in place of BBD
Technique)
Major Application
136. BITS Pilani, Hyderabad Campus
• Pavement Evaluation Procedure
• Performance Criteria
• Back calculation of Inputs to be used in the
performance criteria
• Estimation of remaining life
• Design of overlay
Guidelines for an FWD-based
Overlay Design Method for India
137. BITS Pilani, Hyderabad Campus
These guidelines are meant for
evaluating the strengthening
requirement of existing flexible road
pavements using Falling Weight
Deflectometer technique.
The recommendations are mainly
based on the findings of MoRTH
Research study (R-81) “Structural
evaluation of pavements using Falling
Weight Deflectometer” and other
relevant information gathered from
other sources”
IRC:115-2014 ( Formulated by
IIT Kharagpur)
138. BITS Pilani, Hyderabad Campus
(i) Measurement of surface deflections of the in-service
pavement homogeneous section using FWD
(ii) Normalization of the deflections to correspond to a
standard load of 40 kN
(iii) Collection of information about layer type and layer
thicknesses
(iv) Backcalculation of pavement layer moduli from the
normalized deflections using an appropriate
backcalculation software (eg : E1, E2, E3)
OVERLAYDESIGN METHODOLOGY
139. BITS Pilani, Hyderabad Campus
(v) Adjustment of the bituminous layer modulus
(backcalculated) to a standard temperature of 35 C
OVERLAYDESIGN METHODOLOGY
E (T1) = λ E (T2)
Where λ, temperature correction factor =(1-0.238ln(T1))/(1-0.238ln(T2))
Where, E (T1) = backcalculated modulus at temperature T1
E (T2) = backcalculated modulus at temperature T2
140. BITS Pilani, Hyderabad Campus
(vi) Adjustment of the subgrade modulus to correspond to
post-monsoon condition
OVERLAYDESIGN METHODOLOGY
Seasonal Correction
Esub_mon = 28.39 + 0.2888 Esub_win
Esub_mon = 21.821+ 0.3641 Esub_sum
141. BITS Pilani, Hyderabad Campus
(vi) Analysis of the in-service
pavement using elastic layer
theory with back calculated
(corrected) moduli and layer
thicknesses collected from
field as inputs.
(vii) This includes computation of
critical Strains (a) Horizontal
Tensile Strain at the bottom
fiber of bituminous layer and
(b) Vertical Compressive
Strain on top of subgrade.
OVERLAYDESIGN METHODOLOGY
h1
h2
E1, 1
E2, 2
E3, 3
et
ez
Bituminous
Granular
Subgrade
142. BITS Pilani, Hyderabad Campus
(viii) Estimation of the remaining life of the pavement
using the fatigue and rutting performance criteria
adopted in IRC:37. The strain values obtained in
step vii will be used to estimate the remaining lives
from fatigue and rutting consideration
NF = 2.21 * 10-4 (1/et)3.89(1/Eac)0.854
OVERLAYDESIGN METHODOLOGY
NF = Cumulative std. Axle load repetitions before the pavement develops
20% fatigue cracking
et = Initial horizontal tensile strain at the bottom of bituminous layer
Eac = Elastic Modulus of bituminous layer, MPa
NR = 4.1656 * 10-8 (1/ez)4.5337
NR = Cumulative std. Axle load repetitions before the pavement develops 20
mm average rut depth
ez = Initial vertical strain on top of subgrade
143. BITS Pilani, Hyderabad Campus
For design of bituminous overlay, a trial thickness of overlay of
an appropriate material has to be selected and the critical
strains have to be evaluated. The modulus value of the
bituminous overlay material may be selected as per the
guidelines given in IRC:37-2012
(x) Design overlay thickness can be selected by trial in such a
way that the computed critical strains are less than the
permissible limits given by the performance criteria for the
design traffic level considered.
OVERLAYDESIGN METHODOLOGY
144. BITS Pilani, Hyderabad Campus
Design traffic = 100 msa
Thicknesses :- Bit. Layer = 95, Granular = 540
Deflections measured in January
Pavement Surface Temperature = 35 0C
Surface Deflections measured using FWD and normalised for 40
kN are :- 0.73517, 0.43835, 0.28919, 0.21580, 0.16638, 0.13406
mm
Back calculated Moduli (MPa) are :- 1350.4, 172.7, 52.5
Design Example
145. BITS Pilani, Hyderabad Campus
Subgrade Modulus corrected for season = 43.6 MPa
E(sub_mon) = 28.39+0.2888 E(sub_win)
Tensile Strain = 0.0004294; Vertical Strain = 0.0007214;
Remaining life :- 3.5 msa (Rutting); 5.9 msa (fatigue)
Providing a 160 mm BC overlay (E of 1695 MPa) the life extends
to 123.5 msa (Rutting) and 124.9 msa (fatigue)
Design Example
146. BITS Pilani, Hyderabad Campus
IRC:37-2012, "Tentative Guidelines for the Design of Flexible Pavements",
Indian Roads Congress, New Delhi.
B.B. Pandey, "Structural Evaluation of Pavements using Falling Weight
Deflectometer", IIT Kharagpur.
Dr. K. Sudhakar Reddy, “Pavement Evaluation and Rehabilitation IRC:81-
1997 & IRC:115-2014” IIT Kharagpur.
IRC:81-1997, "Guidelines for Strengthening of Flexible Road Pavements
Using Benkelman Beam Technique", Indian Roads Congress, New Delhi.
IRC:115-2014, "Guidelines For Structural Evaluation And Strengthening Of
Flexible Road Pavements Using Falling Weight Deflectometer (FWD)
Technique”, Indian Roads Congress, New Delhi
References