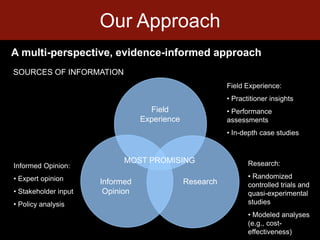
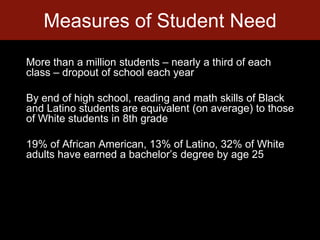
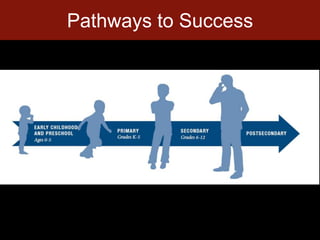
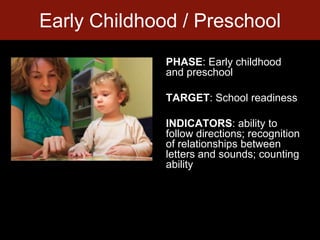
THE CENTER FORHigh Impact PhilanthropyPathways to Student SuccessHilary Rhodes, Senior AnalystKatherina Rosqueta, Executive DirectorCenter for High Impact Philanthropy School of Social Policy & PracticeMay 8, 2009
What the Center Does“If I had a million dollars to improve the educational outcomes of at-risk students, how could I spend it to have the greatest impact?”
Our ApproachA multi-perspective, evidence-informed approachSOURCES OF INFORMATIONField Experience: Practitioner insights Performance assessments In-depth case studiesField ExperienceMOST PROMISINGResearch: Randomized controlled trials and quasi-experimental studies Modeled analyses (e.g., cost-effectiveness)Informed Opinion: Expert opinion Stakeholder input Policy analysisResearchInformed Opinion
Measures of Student NeedMore than a million students – nearly a third of each class – dropout of school each yearBy end of high school, reading and math skills of Black and Latino students are equivalent (on average) to those of White students in 8th grade19% of African American, 13% of Latino, 32% of White adults have earned a bachelor’s degree by age 25
Economic Cost to IndividualSource: Planty, M., Hussar, W., Provasnik, S., Kena, G., Dinkes, R., KewalRemant, A., and Kemp, J. (2008). The Condition of Education 2008 (NCES 2008-031).  National Center for Education Statistics. U.S. Department of Education. Washington, DC. Retrieved 5/29/2008, from <http://nces.ed.gov/programs/coe/2008/pdf/20_2008.pdf>.
Economic Cost for SocietySource: Belfield, C & Levin, H. eds. (2007). The Price We Pay: Economic and Social Consequences of Inadequate Education.  Washington, DC: Brookings Institution Press.
Pathways to Success
PHASE: Early childhood and preschoolTARGET: School readinessINDICATORS: ability to follow directions; recognition of relationships between letters and sounds; counting abilityEarly Childhood / Preschool
Development impacted by poor health & social circumstances Restricted access preschool; where available, likely not high qualityObstacles in Early Childhood
Example of Early Childhood On-RampSupport one-on-one relationships to cultivate early literacy, social skills Jumpstart results:60% of participating  students better prepared for kindergarten than comparison group nationwide$1,600 - $3,100 per additional student better prepared for school
PHASE: Primary (elementary) schoolTARGET: Reading by the end of 3rd gradeINDICATORS: attendance; scores on math & reading assessments; social skills and emotional competenciesPrimary School
Obstacles in Primary SchoolEnrolled in schools with limited resources, poorer leadership and weaker teachersOutside of school, access to opportunities for enrichment restricted; health and social issues continue
Example of Primary School On-RampProfessional development & coaching in literacy instructionChildren’s Literacy Initiative:32 percentage points more students meet literacy benchmarks than comparison group at a strong implementation site$586 per additional student meeting benchmarks
PHASE: Secondary schoolTARGET: Master 9th grade curriculum on time and graduate on-timeINDICATORS: attendance; scores on math & reading assessments; risk behaviorsSecondary School
Obstacles in Secondary SchoolWaning student engagement & increasing negative behaviorsDeficits in school resources continue and deepenFew opportunities to develop “soft skills”
Example of Secondary School On-RampExtending learning time through apprenticeships, academic supports, and leadership developmentCitizen Schools:8 to 27 percentage point increase in on-time high school graduation $12,000 to $40,000  per additional on-time high school graduate
PHASE: Postsecondary education and beyondTARGET: Graduate from college or complete other postsecondary certification INDICATORS: college retention after 1st year; income; employment statusPostsecondary Education
Obstacles to Postsecondary EducationInsufficient academic preparation and supportsFinancial barriersSocial obstacles such as a lack of supportive peer networks
Examples of Postsecondary On-RampsLong-term, wraparound supports and tuition guaranteeIHDF & Say Yes:An additional 8-41 percentage points in on-time high school graduation, 34 percentage point increase in college completion$29,000 to $250,000 per additional high school and college graduate
Case Example: The Doe InitiativeLike many American cities, hard times befell Industrial City as its manufacturing base shrank and its tax base eroded. By 1996, it could no longer afford to educate its students and deeded its schools to the county. The city and county districts were different in important ways: one was urban, African American, and poor, and the other suburban, White, and affluent. Residents in both communities did not welcome the merger, as it played into a long history of race and class tensions.  While the merger addressed the financial needs of the urban schools, it did not resolve the stark differences in student achievement. A report released in 2000 showed that of the 20 worst elementary schools in the state, nearly half were the urban schools; the suburban ones, however, continued to far outpace the average. The report appalled the community and prompted the Doe Family Foundation to connect with the city’s local education fund (LEF), which had already begun working with the district to improve instruction.
Case Example: The Doe InitiativeEarly interviews with stakeholders revealed some of the challenges that lay ahead. Superintendent: “Bad teachers have been allowed to collect in urban schools. Bad teachers can survive there and have created a safe culture for themselves.”Principal: “Turnover is constant. For three years you train new teachers to be effective with these kids, and then they leave. That wears out the savviest principal.”Teacher: “It won’t work unless you get rid of my principal and those six teachers. Unless you can do that, you can keep your money.” Student: “I hate school. It's so dirty and the bathrooms are always clogged. There are never enough textbooks and we're not allowed to use the computer in the library. And the teachers don’t care about you. They just don't listen.” County parent: “They would be better off making a huge bonfire with that money instead of giving it to those elementary schools. At least then, the community would get a few minutes of heat and light.”
Case Example: The Doe InitiativeAt the onset, the Doe Family Foundation and LEF established an ambitious goal: 100% of the third graders in the nine urban schools would read at or above grade level by 2007. The partnership galvanized the following resources to achieve its aim:$5 million from the Doe Family Foundation $2.5 million from LEF $2.5 million from an assortment of city, business, and community organizations
QuestionsWhat else would you like to know? How could you find the answers?Based on your experience and our earlier discussion, what activities would you explore to address the situation? What activities would you avoid?
What They DidBuilt strong leadership teamsCultivated effective teaching practiceProvided financial incentivesPartnered with community organizations for family & student supports
What They AchievedTeacher turnover declinedTeacher instruction improved steadily over timeStudent achievement improved from 53.1% in 2003 to 80.2% in 2007Source: The Benwood Initiative <http://www.pefchattanooga.org/Home/Initiatives/BenwoodInitiative/tabid/64/Default.aspx>
Why It WorkedReal commitment to improving teacher quality from all partnersData clearly identified problem and its connection to instruction Superintendent a “merger” expert, able to build collaborative relationshipsExistence of strong public education fund already working with the district
In His Wordshttp://lmri.ucsb.edu/dropouts/videos/
One Program’s ResponseRaise expectations for student successEquip teachers with techniques that actively engage studentsIncrease rigor of student experienceFacilitate college application processProvide extensive support network
AVIDSnapshotSuccess rate: ~52 percentage point increase of college-ready students (88% AVID CA vs. 36% nationally)Cost per beneficiary: $291 per yearCost per impact: ~$1,700 per additional college-ready high school graduate

Pathways to Student Success: Slideshow

  • 1.
    THE CENTER FORHighImpact PhilanthropyPathways to Student SuccessHilary Rhodes, Senior AnalystKatherina Rosqueta, Executive DirectorCenter for High Impact Philanthropy School of Social Policy & PracticeMay 8, 2009
  • 2.
    What the CenterDoes“If I had a million dollars to improve the educational outcomes of at-risk students, how could I spend it to have the greatest impact?”
  • 3.
    Our ApproachA multi-perspective,evidence-informed approachSOURCES OF INFORMATIONField Experience: Practitioner insights Performance assessments In-depth case studiesField ExperienceMOST PROMISINGResearch: Randomized controlled trials and quasi-experimental studies Modeled analyses (e.g., cost-effectiveness)Informed Opinion: Expert opinion Stakeholder input Policy analysisResearchInformed Opinion
  • 4.
    Measures of StudentNeedMore than a million students – nearly a third of each class – dropout of school each yearBy end of high school, reading and math skills of Black and Latino students are equivalent (on average) to those of White students in 8th grade19% of African American, 13% of Latino, 32% of White adults have earned a bachelor’s degree by age 25
  • 5.
    Economic Cost toIndividualSource: Planty, M., Hussar, W., Provasnik, S., Kena, G., Dinkes, R., KewalRemant, A., and Kemp, J. (2008). The Condition of Education 2008 (NCES 2008-031). National Center for Education Statistics. U.S. Department of Education. Washington, DC. Retrieved 5/29/2008, from <http://nces.ed.gov/programs/coe/2008/pdf/20_2008.pdf>.
  • 6.
    Economic Cost forSocietySource: Belfield, C & Levin, H. eds. (2007). The Price We Pay: Economic and Social Consequences of Inadequate Education. Washington, DC: Brookings Institution Press.
  • 7.
  • 8.
    PHASE: Early childhoodand preschoolTARGET: School readinessINDICATORS: ability to follow directions; recognition of relationships between letters and sounds; counting abilityEarly Childhood / Preschool
  • 9.
    Development impacted bypoor health & social circumstances Restricted access preschool; where available, likely not high qualityObstacles in Early Childhood
  • 10.
    Example of EarlyChildhood On-RampSupport one-on-one relationships to cultivate early literacy, social skills Jumpstart results:60% of participating students better prepared for kindergarten than comparison group nationwide$1,600 - $3,100 per additional student better prepared for school
  • 11.
    PHASE: Primary (elementary)schoolTARGET: Reading by the end of 3rd gradeINDICATORS: attendance; scores on math & reading assessments; social skills and emotional competenciesPrimary School
  • 12.
    Obstacles in PrimarySchoolEnrolled in schools with limited resources, poorer leadership and weaker teachersOutside of school, access to opportunities for enrichment restricted; health and social issues continue
  • 13.
    Example of PrimarySchool On-RampProfessional development & coaching in literacy instructionChildren’s Literacy Initiative:32 percentage points more students meet literacy benchmarks than comparison group at a strong implementation site$586 per additional student meeting benchmarks
  • 14.
    PHASE: Secondary schoolTARGET:Master 9th grade curriculum on time and graduate on-timeINDICATORS: attendance; scores on math & reading assessments; risk behaviorsSecondary School
  • 15.
    Obstacles in SecondarySchoolWaning student engagement & increasing negative behaviorsDeficits in school resources continue and deepenFew opportunities to develop “soft skills”
  • 16.
    Example of SecondarySchool On-RampExtending learning time through apprenticeships, academic supports, and leadership developmentCitizen Schools:8 to 27 percentage point increase in on-time high school graduation $12,000 to $40,000 per additional on-time high school graduate
  • 17.
    PHASE: Postsecondary educationand beyondTARGET: Graduate from college or complete other postsecondary certification INDICATORS: college retention after 1st year; income; employment statusPostsecondary Education
  • 18.
    Obstacles to PostsecondaryEducationInsufficient academic preparation and supportsFinancial barriersSocial obstacles such as a lack of supportive peer networks
  • 19.
    Examples of PostsecondaryOn-RampsLong-term, wraparound supports and tuition guaranteeIHDF & Say Yes:An additional 8-41 percentage points in on-time high school graduation, 34 percentage point increase in college completion$29,000 to $250,000 per additional high school and college graduate
  • 20.
    Case Example: TheDoe InitiativeLike many American cities, hard times befell Industrial City as its manufacturing base shrank and its tax base eroded. By 1996, it could no longer afford to educate its students and deeded its schools to the county. The city and county districts were different in important ways: one was urban, African American, and poor, and the other suburban, White, and affluent. Residents in both communities did not welcome the merger, as it played into a long history of race and class tensions. While the merger addressed the financial needs of the urban schools, it did not resolve the stark differences in student achievement. A report released in 2000 showed that of the 20 worst elementary schools in the state, nearly half were the urban schools; the suburban ones, however, continued to far outpace the average. The report appalled the community and prompted the Doe Family Foundation to connect with the city’s local education fund (LEF), which had already begun working with the district to improve instruction.
  • 21.
    Case Example: TheDoe InitiativeEarly interviews with stakeholders revealed some of the challenges that lay ahead. Superintendent: “Bad teachers have been allowed to collect in urban schools. Bad teachers can survive there and have created a safe culture for themselves.”Principal: “Turnover is constant. For three years you train new teachers to be effective with these kids, and then they leave. That wears out the savviest principal.”Teacher: “It won’t work unless you get rid of my principal and those six teachers. Unless you can do that, you can keep your money.” Student: “I hate school. It's so dirty and the bathrooms are always clogged. There are never enough textbooks and we're not allowed to use the computer in the library. And the teachers don’t care about you. They just don't listen.” County parent: “They would be better off making a huge bonfire with that money instead of giving it to those elementary schools. At least then, the community would get a few minutes of heat and light.”
  • 22.
    Case Example: TheDoe InitiativeAt the onset, the Doe Family Foundation and LEF established an ambitious goal: 100% of the third graders in the nine urban schools would read at or above grade level by 2007. The partnership galvanized the following resources to achieve its aim:$5 million from the Doe Family Foundation $2.5 million from LEF $2.5 million from an assortment of city, business, and community organizations
  • 23.
    QuestionsWhat else wouldyou like to know? How could you find the answers?Based on your experience and our earlier discussion, what activities would you explore to address the situation? What activities would you avoid?
  • 24.
    What They DidBuiltstrong leadership teamsCultivated effective teaching practiceProvided financial incentivesPartnered with community organizations for family & student supports
  • 25.
    What They AchievedTeacherturnover declinedTeacher instruction improved steadily over timeStudent achievement improved from 53.1% in 2003 to 80.2% in 2007Source: The Benwood Initiative <http://www.pefchattanooga.org/Home/Initiatives/BenwoodInitiative/tabid/64/Default.aspx>
  • 26.
    Why It WorkedRealcommitment to improving teacher quality from all partnersData clearly identified problem and its connection to instruction Superintendent a “merger” expert, able to build collaborative relationshipsExistence of strong public education fund already working with the district
  • 27.
  • 28.
    One Program’s ResponseRaiseexpectations for student successEquip teachers with techniques that actively engage studentsIncrease rigor of student experienceFacilitate college application processProvide extensive support network
  • 29.
    AVIDSnapshotSuccess rate: ~52percentage point increase of college-ready students (88% AVID CA vs. 36% nationally)Cost per beneficiary: $291 per yearCost per impact: ~$1,700 per additional college-ready high school graduate