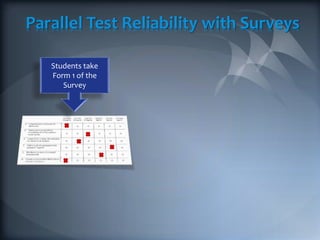
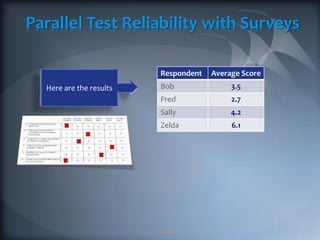
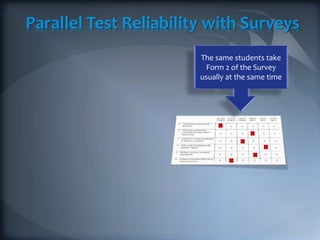
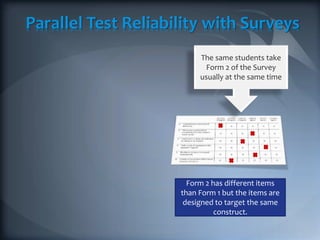
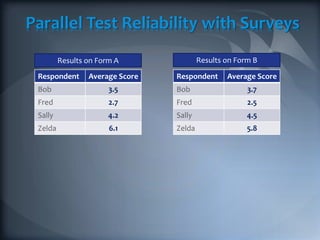
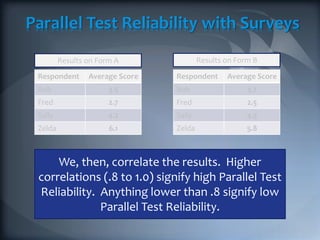
Parallel Test Reliability with Surveys
Students take
Form 1 of the
Survey
Parallel Test Reliability with Surveys
Respondent Average Score
Bob 3.5
Fred 2.7
Sally 4.2
Zelda 6.1
Here are the results
Parallel Test Reliability with Surveys
The same students take
Form 2 of the Survey
usually at the same time
Parallel Test Reliability with Surveys
Form 2 has different items
than Form 1 but the items are
designed to target the same
construct.
The same students take
Form 2 of the Survey
usually at the same time
Parallel Test Reliability with Surveys
Here are the results
Respondent Average Score
Bob 3.7
Fred 2.5
Sally 4.5
Zelda 5.8
The same students take
Form 2 of the Survey
usually at the same time
Parallel Test Reliability with Surveys
Respondent Average Score
Bob 3.7
Fred 2.5
Sally 4.5
Zelda 5.8
Respondent Average Score
Bob 3.5
Fred 2.7
Sally 4.2
Zelda 6.1
Results on Form A Results on Form B
Parallel Test Reliability with Surveys
Respondent Average Score
Bob 3.7
Fred 2.5
Sally 4.5
Zelda 5.8
Respondent Average Score
Bob 3.5
Fred 2.7
Sally 4.2
Zelda 6.1
Results on Form A Results on Form B
We, then, correlate the results. Higher
correlations (.8 to 1.0) signify high Parallel Test
Reliability. Anything lower than .8 signify low
Parallel Test Reliability.

Parallel test reliabilty with surveys

  • 1.
  • 2.
    Parallel Test Reliabilitywith Surveys Students take Form 1 of the Survey
  • 3.
    Parallel Test Reliabilitywith Surveys Respondent Average Score Bob 3.5 Fred 2.7 Sally 4.2 Zelda 6.1 Here are the results
  • 4.
    Parallel Test Reliabilitywith Surveys The same students take Form 2 of the Survey usually at the same time
  • 5.
    Parallel Test Reliabilitywith Surveys Form 2 has different items than Form 1 but the items are designed to target the same construct. The same students take Form 2 of the Survey usually at the same time
  • 6.
    Parallel Test Reliabilitywith Surveys Here are the results Respondent Average Score Bob 3.7 Fred 2.5 Sally 4.5 Zelda 5.8 The same students take Form 2 of the Survey usually at the same time
  • 7.
    Parallel Test Reliabilitywith Surveys Respondent Average Score Bob 3.7 Fred 2.5 Sally 4.5 Zelda 5.8 Respondent Average Score Bob 3.5 Fred 2.7 Sally 4.2 Zelda 6.1 Results on Form A Results on Form B
  • 8.
    Parallel Test Reliabilitywith Surveys Respondent Average Score Bob 3.7 Fred 2.5 Sally 4.5 Zelda 5.8 Respondent Average Score Bob 3.5 Fred 2.7 Sally 4.2 Zelda 6.1 Results on Form A Results on Form B We, then, correlate the results. Higher correlations (.8 to 1.0) signify high Parallel Test Reliability. Anything lower than .8 signify low Parallel Test Reliability.

Editor's Notes

  • #2 (less consensus among students on this factor)
  • #3 (less consensus among students on this factor)
  • #4 (less consensus among students on this factor)
  • #5 (less consensus among students on this factor)
  • #6 (less consensus among students on this factor)
  • #7 (less consensus among students on this factor)
  • #8 (less consensus among students on this factor)
  • #9 (less consensus among students on this factor)