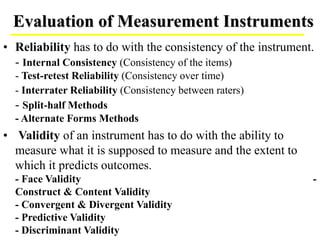
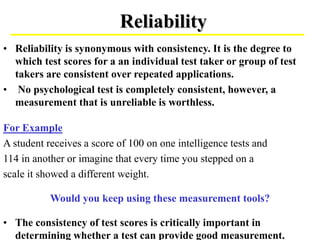
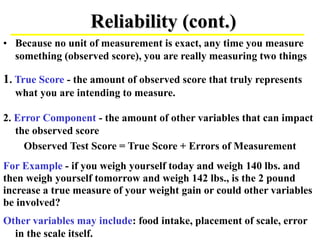
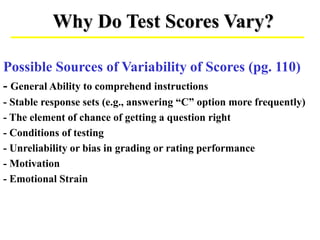
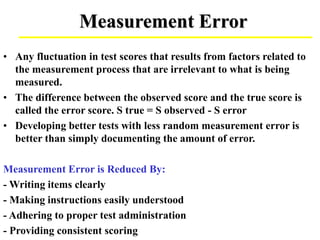
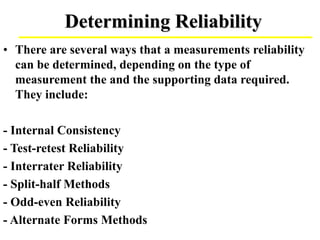
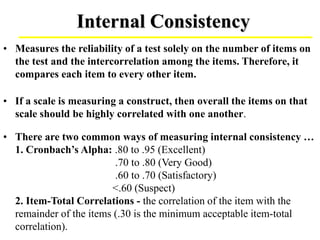
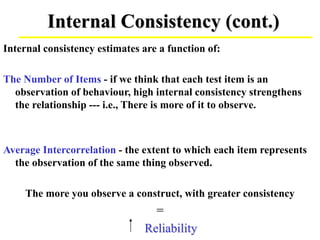
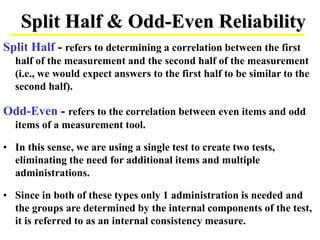
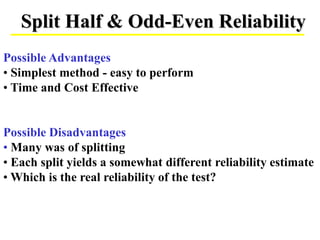
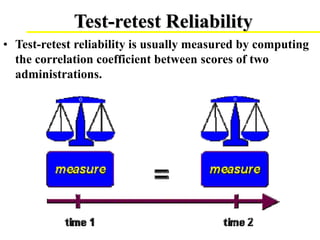
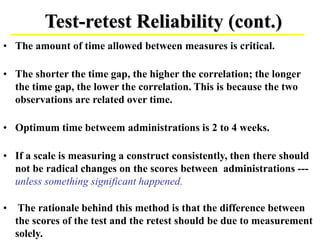
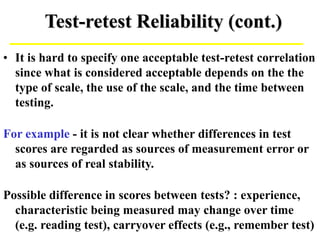
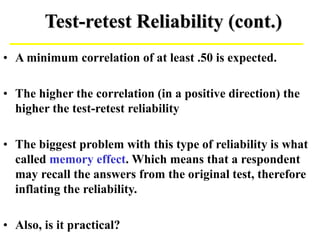
This document discusses various methods for evaluating the reliability of measurement instruments, including internal consistency, test-retest reliability, interrater reliability, split-half methods, and alternate forms methods. It provides details on calculating and interpreting each type of reliability. Factors that can influence reliability are also examined, such as the number of items, characteristics of test takers, heterogeneity of items and groups, and time between test administrations. The document emphasizes that reliability is important for ensuring measurement tools provide consistent results.
What makes a good testA test is considered good” if the .docxmecklenburgstrelitzh
What makes a good test?
A test is considered “good” if the following can be said about it:
· The test measures what it claims to measure. For example, a test of mental ability does, in fact, measure mental ability and not some other characteristic.
· The test measures what it claims to measure consistently or reliably. This means that, if a person were to take the test again, the person would get a similar test score.
· The test is job-relevant. In other words, the test measures 1 or more characteristics that are important to the job.
· By using the test, more effective decisions can be made about individuals.
· The degree to which a test has these qualities is indicated by 2 technical properties: reliability and validity.
Test Reliability
Reliability refers to how consistently a test measures a characteristic. If a person takes the test again, will he or she get a similar test score or a much different score? A test that yields similar scores for a person who repeats the test is said to measure a characteristic reliably.
How do we account for an individual who does not get exactly the same test score every time he or she takes the test? Some possible reasons are the following:
· Test taker's temporary psychological or physical state. Test performance can be influenced by a person's psychological or physical state at the time of testing. For example, differing levels of anxiety, fatigue, or motivation may affect the applicant's test results (unsystematic error).
· Environmental factors. Differences in the testing environment, such as room temperature, lighting, noise, or even the test administrator can influence an individual's test performance (unsystematic error).
· Test form. Many tests have more than 1 version or form. Items differ on each form, but each form is supposed to measure the same thing. Different forms of a test are known as parallel forms or alternateforms. These forms are designed to have similar measurement characteristics, but they contain different items. Because the forms are not exactly the same, a test taker might do better on 1 form than on another.
· Multiple raters. In certain tests, scoring is determined by a rater’s judgments of the test taker’s performance or responses. Differences in training, experience, and frame of reference among raters can produce different test scores for the test taker.
These factors are sources of chance or random measurement error in the assessment process. If there were no random errors of measurement, the individual would get the same test score, the individual's “true” score, each time. The degree to which test scores are unaffected by measurement errors is an indication of the reliability of the test. But, while psychometrics can give you a lot of this information, it is important to ask the client about how they experienced the process of taking the test. This will allow you to detect any potential unsystematic errors.
When selecting an assessment, you want to remember that r.
How to Create Map Views in the Odoo 17 ERPCeline George
The map views are useful for providing a geographical representation of data. They allow users to visualize and analyze the data in a more intuitive manner.
Instructions for Submissions thorugh G- Classroom.pptxJheel Barad
This presentation provides a briefing on how to upload submissions and documents in Google Classroom. It was prepared as part of an orientation for new Sainik School in-service teacher trainees. As a training officer, my goal is to ensure that you are comfortable and proficient with this essential tool for managing assignments and fostering student engagement.
How to Split Bills in the Odoo 17 POS ModuleCeline George
Bills have a main role in point of sale procedure. It will help to track sales, handling payments and giving receipts to customers. Bill splitting also has an important role in POS. For example, If some friends come together for dinner and if they want to divide the bill then it is possible by POS bill splitting. This slide will show how to split bills in odoo 17 POS.
We all have good and bad thoughts from time to time and situation to situation. We are bombarded daily with spiraling thoughts(both negative and positive) creating all-consuming feel , making us difficult to manage with associated suffering. Good thoughts are like our Mob Signal (Positive thought) amidst noise(negative thought) in the atmosphere. Negative thoughts like noise outweigh positive thoughts. These thoughts often create unwanted confusion, trouble, stress and frustration in our mind as well as chaos in our physical world. Negative thoughts are also known as “distorted thinking”.
The Indian economy is classified into different sectors to simplify the analysis and understanding of economic activities. For Class 10, it's essential to grasp the sectors of the Indian economy, understand their characteristics, and recognize their importance. This guide will provide detailed notes on the Sectors of the Indian Economy Class 10, using specific long-tail keywords to enhance comprehension.
For more information, visit-www.vavaclasses.com
How to Make a Field invisible in Odoo 17Celine George
It is possible to hide or invisible some fields in odoo. Commonly using “invisible” attribute in the field definition to invisible the fields. This slide will show how to make a field invisible in odoo 17.
Read| The latest issue of The Challenger is here! We are thrilled to announce that our school paper has qualified for the NATIONAL SCHOOLS PRESS CONFERENCE (NSPC) 2024. Thank you for your unwavering support and trust. Dive into the stories that made us stand out!
2024.06.01 Introducing a competency framework for languag learning materials ...Sandy Millin
http://sandymillin.wordpress.com/iateflwebinar2024
Published classroom materials form the basis of syllabuses, drive teacher professional development, and have a potentially huge influence on learners, teachers and education systems. All teachers also create their own materials, whether a few sentences on a blackboard, a highly-structured fully-realised online course, or anything in between. Despite this, the knowledge and skills needed to create effective language learning materials are rarely part of teacher training, and are mostly learnt by trial and error.
Knowledge and skills frameworks, generally called competency frameworks, for ELT teachers, trainers and managers have existed for a few years now. However, until I created one for my MA dissertation, there wasn’t one drawing together what we need to know and do to be able to effectively produce language learning materials.
This webinar will introduce you to my framework, highlighting the key competencies I identified from my research. It will also show how anybody involved in language teaching (any language, not just English!), teacher training, managing schools or developing language learning materials can benefit from using the framework.
2. Evaluation of Measurement Instruments
• Reliability has to do with the consistency of the instrument.
- Internal Consistency (Consistency of the items)
- Test-retest Reliability (Consistency over time)
- Interrater Reliability (Consistency between raters)
- Split-half Methods
- Alternate Forms Methods
• Validity of an instrument has to do with the ability to
measure what it is supposed to measure and the extent to
which it predicts outcomes.
- Face Validity -
Construct & Content Validity
- Convergent & Divergent Validity
- Predictive Validity
- Discriminant Validity
3. Reliability
• Reliability is synonymous with consistency. It is the degree to
which test scores for a an individual test taker or group of test
takers are consistent over repeated applications.
• No psychological test is completely consistent, however, a
measurement that is unreliable is worthless.
For Example
A student receives a score of 100 on one intelligence tests and
114 in another or imagine that every time you stepped on a
scale it showed a different weight.
Would you keep using these measurement tools?
• The consistency of test scores is critically important in
determining whether a test can provide good measurement.
4. Reliability (cont.)
• Because no unit of measurement is exact, any time you measure
something (observed score), you are really measuring two things
1. True Score - the amount of observed score that truly represents
what you are intending to measure.
2. Error Component - the amount of other variables that can impact
the observed score
Observed Test Score = True Score + Errors of Measurement
For Example - if you weigh yourself today and weigh 140 lbs. and
then weigh yourself tomorrow and weigh 142 lbs., is the 2 pound
increase a true measure of your weight gain or could other variables
be involved?
Other variables may include: food intake, placement of scale, error
in the scale itself.
5. Why Do Test Scores Vary?
Possible Sources of Variability of Scores (pg. 110)
- General Ability to comprehend instructions
- Stable response sets (e.g., answering “C” option more frequently)
- The element of chance of getting a question right
- Conditions of testing
- Unreliability or bias in grading or rating performance
- Motivation
- Emotional Strain
6. Measurement Error
• Any fluctuation in test scores that results from factors related to
the measurement process that are irrelevant to what is being
measured.
• The difference between the observed score and the true score is
called the error score. S true = S observed - S error
• Developing better tests with less random measurement error is
better than simply documenting the amount of error.
Measurement Error is Reduced By:
- Writing items clearly
- Making instructions easily understood
- Adhering to proper test administration
- Providing consistent scoring
7. Determining Reliability
• There are several ways that a measurements reliability
can be determined, depending on the type of
measurement the and the supporting data required.
They include:
- Internal Consistency
- Test-retest Reliability
- Interrater Reliability
- Split-half Methods
- Odd-even Reliability
- Alternate Forms Methods
8. Internal Consistency
• Measures the reliability of a test solely on the number of items on
the test and the intercorrelation among the items. Therefore, it
compares each item to every other item.
• If a scale is measuring a construct, then overall the items on that
scale should be highly correlated with one another.
• There are two common ways of measuring internal consistency …
1. Cronbach’s Alpha: .80 to .95 (Excellent)
.70 to .80 (Very Good)
.60 to .70 (Satisfactory)
<.60 (Suspect)
2. Item-Total Correlations - the correlation of the item with the
remainder of the items (.30 is the minimum acceptable item-total
correlation).
9. Internal Consistency (cont.)
Internal consistency estimates are a function of:
The Number of Items - if we think that each test item is an
observation of behaviour, high internal consistency strengthens
the relationship --- i.e., There is more of it to observe.
Average Intercorrelation - the extent to which each item represents
the observation of the same thing observed.
The more you observe a construct, with greater consistency
=
Reliability
10. Split Half & Odd-Even Reliability
Split Half - refers to determining a correlation between the first
half of the measurement and the second half of the measurement
(i.e., we would expect answers to the first half to be similar to the
second half).
Odd-Even - refers to the correlation between even items and odd
items of a measurement tool.
• In this sense, we are using a single test to create two tests,
eliminating the need for additional items and multiple
administrations.
• Since in both of these types only 1 administration is needed and
the groups are determined by the internal components of the test,
it is referred to as an internal consistency measure.
11. Split Half & Odd-Even Reliability
Possible Advantages
• Simplest method - easy to perform
• Time and Cost Effective
Possible Disadvantages
• Many was of splitting
• Each split yields a somewhat different reliability estimate
• Which is the real reliability of the test?
12. Test-retest Reliability
• Test-retest reliability is usually measured by computing
the correlation coefficient between scores of two
administrations.
13. Test-retest Reliability (cont.)
• The amount of time allowed between measures is critical.
• The shorter the time gap, the higher the correlation; the longer
the time gap, the lower the correlation. This is because the two
observations are related over time.
• Optimum time betweem administrations is 2 to 4 weeks.
• If a scale is measuring a construct consistently, then there should
not be radical changes on the scores between administrations ---
unless something significant happened.
• The rationale behind this method is that the difference between
the scores of the test and the retest should be due to measurement
solely.
14. Test-retest Reliability (cont.)
• It is hard to specify one acceptable test-retest correlation
since what is considered acceptable depends on the the
type of scale, the use of the scale, and the time between
testing.
For example - it is not clear whether differences in test
scores are regarded as sources of measurement error or
as sources of real stability.
Possible difference in scores between tests? : experience,
characteristic being measured may change over time
(e.g. reading test), carryover effects (e.g., remember test)
15. Test-retest Reliability (cont.)
• A minimum correlation of at least .50 is expected.
• The higher the correlation (in a positive direction) the
higher the test-retest reliability
• The biggest problem with this type of reliability is what
called memory effect. Which means that a respondent
may recall the answers from the original test, therefore
inflating the reliability.
• Also, is it practical?
16. Interrater Reliability
• Whenever you use humans as a part of your measurement
procedure, you have to worry about whether the results you get
are reliable or consistent. People are notorious for their
inconsistency. We are easily distractible. We get tired of doing
repetitive tasks. We daydream. We misinterpret.
17. Interrater Reliability (cont.)
• For some scales it is important to assess interrater
reliability.
• Interrater reliability means that if two different raters
scored the scale using the scoring rules, they should
attain the same result.
• Interrater reliability is usually measured by computing
the correlation coefficient between the scores of two
raters for the set of respondents.
• Here the criterion of acceptability is pretty high (e.g., a
correlation of at least .9), but what is considered
acceptable will vary from situation to situation.
18. Parallel/Alternate Forms Method
Parallel/Alternate Forms Method - refers to the
administration of two alternate forms of the same
measurement device and then comparing the
scores.
• Both forms are administered to the same person and
the scores are correlated. If the two produce the
same results, then the instrument is considered
reliable.
19. Parallel/Alternate Forms Method (cont.)
• A correlation between these two forms is computed just
as the test-retest method.
Advantages
• Eliminates the problem of memory effect.
• Reactivity effects (i.e., experience of taking the test) are
also partially controlled.
• Can address a wider array of sampling of the entire
domain than the test-retest method.
20. Parallel/Alternate Forms Method (cont.)
Possible Disadvantages
• Are the two forms of the test actually measuring
the same thing.
• More Expensive
• Requires additional work to develop two
measurement tools.
21. Factors Affecting Reliability
• Administrator Factors
• Number of Items on the instrument
• The Instrument Taker
• Heterogeneity of the Items
• Heterogeneity of the Group Members
• Length of Time between Test and Retest
22. • Poor or unclear directions given during
administration or inaccurate scoring can affect
reliability.
For Example - say you were told that your scores on
being social determined your promotion. The result
is more likely to be what you think they want than
what your behavior is.
Administrator Factors
23. • The larger the number of items, the greater the
chance for high reliability.
For Example -it makes sense when you ponder that
twenty questions on your leadership style is more
likely to get a consistent result than four questions.
• Remedy: Use longer tests or accumulate
scores from short tests.
Number of Items on the Instrument
24. For Example -If you took an instrument in August
when you had a terrible flu and then in December
when you were feeling quite good, we might see a
difference in your response consistency. If you were
under considerable stress of some sort or if you were
interrupted while answering the instrument
questions, you might give different responses.
The Test Taker
25. Heterogeneity of the Items -- The greater the
heterogeneity (differences in the kind of questions or
difficulty of the question) of the items, the greater
the chance for high reliability correlation
coefficients.
Heterogeneity of the Group Members -- The greater
the heterogeneity of the group members in the
preferences, skills or behaviors being tested, the
greater the chance for high reliability correlation
coefficients.
Heterogeneity
26. • The shorter the time, the greater the chance for high
reliability correlation coefficients.
• As we have experiences, we tend to adjust our views a little
from time to time. Therefore, the time interval between the
first time we took an instrument and the second time is
really an "experience" interval.
• Experience happens, and it influences how we see things.
Because internal consistency has no time lapse, one can
expect it to have the highest reliability correlation
coefficient.
Length of Time between Test and Retest
27. How High Should Reliability Be?
• A highly reliable test is always preferable to a test with
lower reliability.
.80 > greater (Excellent)
.70 to .80 (Very Good)
.60 to .70 (Satisfactory)
<.60 (Suspect)
• A reliability coefficient of .80 indicates that 20% of the
variability in test scores is due to measurement error.
28. Generalizability Theory
Theory of measurement that attempts to determine the
sources of consistency and inconsistency
• It is necessary to obtain multiple observations for the sample
group of individuals on all the variables that might contribute to
causing measurement error (e.g., scores across occasions, across
scorers, across alternative forms).
• Allows for the evaluation of interaction effects from different
types of error sources.
• Allows for the evaluation of interaction effects from different
types of error sources.
29. Generalizability Theory (cont.)
• If feasible, it is a more thorough procedure for identifying the
error component that may enter scores.
• Useful when associated with complex methods:
1. The conditions of measurement affect test scores.
2. Test scores are used for several different purposes.
For Example - measurement involving subjectivity (e.g.,
interviews, rating scales) involve bias. Therefore, human
judgement could be considered “conditions of measurement”
30. Standard Error of Measurement (SEM)
• SEM is a statistic that obtains the confidence interval for many
obtained scores. It represents the hypothetical distribution we
would have if someone took a test an infinite # of times.
• A measure that allows one to predict the range of fluctuation that
is likely to occur in a single individual's score because of
irrelevant, chance factors. This measurement is used in analyzing
the reliability of the test in obtaining the "true" score.
• Indicates how much variability in test scores can be expected as
a result of measurement error.
• SEM is a function of two factors: reliability of test & variability
of test scores. Formula for SEM is :
SM = SD(Sq root of 1 minus reliability)
31. Standard Error of Measurement (cont.)
• The most common use of the SEM is the production of the
confidence intervals. The SEM is an estimate of how much
error there is in a test.
• The SEM can be looked at in the same way as Standard
Deviations. Sixty eight percent of the time the true score
would be between plus one SEM and minus one SEM. We
could be 68% sure that the students true score would be
between +/- one SEM. Between +/- two SEM the true score
would be found 96% of the time (e.g., SEM x +/- two SEM)
• Or, if the student took the test 100 times, 64 times the true
score would fall between +/- one SEM.