
Download to read offline
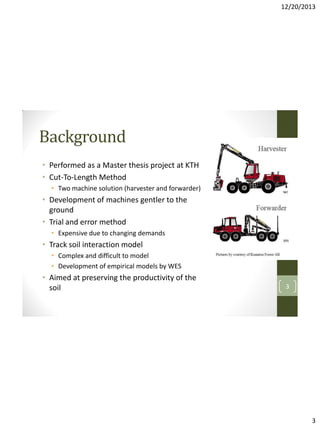
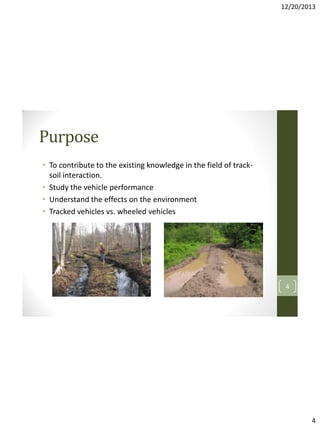
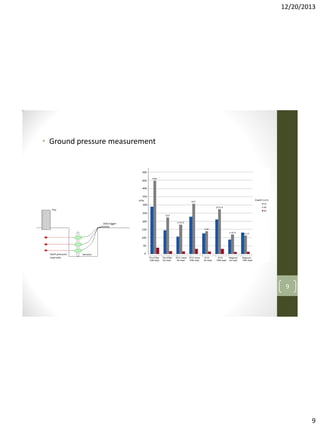
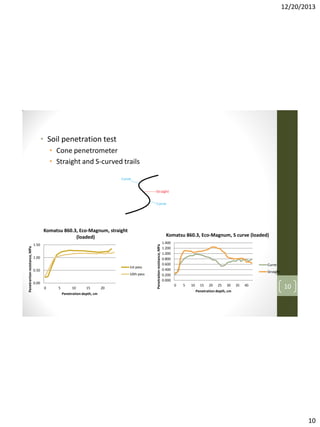
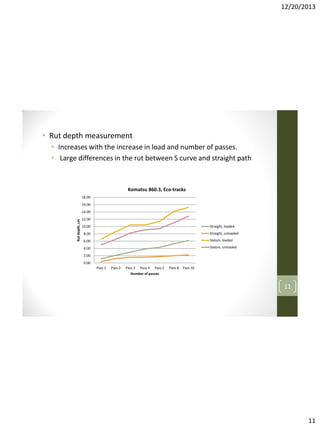

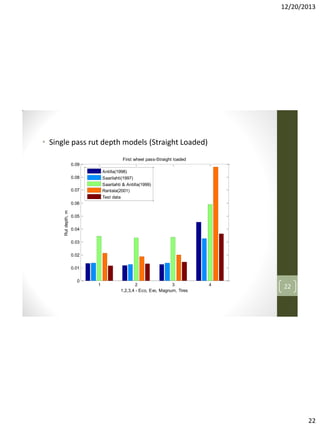
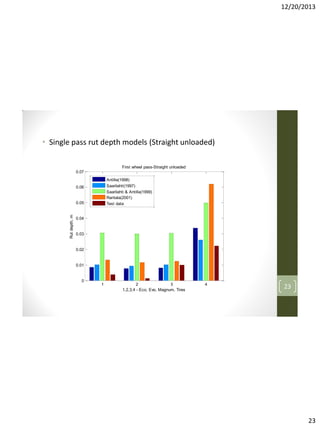
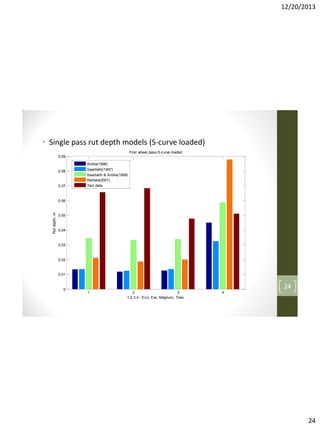
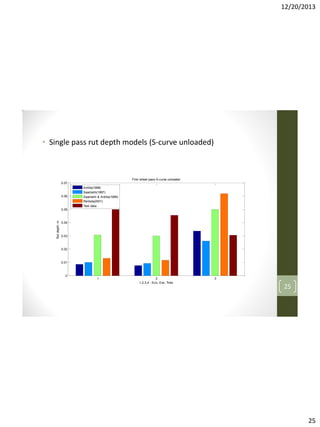
The document is a master thesis project that investigates the mobility of tracked forestry machines on Nordic forest soil, comparing their performance with wheeled vehicles. It examines ground pressure, performance parameters, rut depth, and environmental impacts while utilizing empirical models and field test data. The results indicate that tracked vehicles perform better on soft soil due to lower ground pressure and higher tractive force, but existing rut depth models require further validation against new data.


