Download as PDF, PPTX
![Reshaping
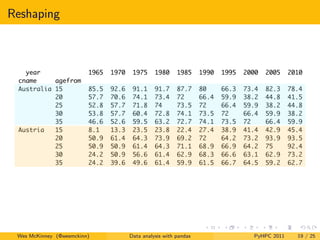
In [5]: df.unstack(’agefrom’).stack(’year’)
Wes McKinney (@wesmckinn) Data analysis with pandas PyHPC 2011 20 / 25](https://image.slidesharecdn.com/slides-111118222930-phpapp01/85/pandas-a-Foundational-Python-Library-for-Data-Analysis-and-Statistics-20-320.jpg)

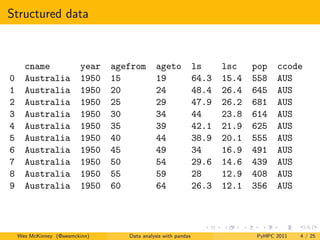
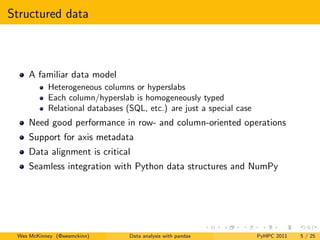
Pandas is a Python library for data analysis and manipulation. It provides high performance tools for structured data, including DataFrame objects for tabular data with row and column indexes. Pandas aims to have a clean and consistent API that is both performant and easy to use for tasks like data cleaning, aggregation, reshaping and merging of data.


![Getting Started with Apache Spark: Big Data Made Simple [Free Meetup]](https://cdn.slidesharecdn.com/ss_thumbnails/apachesparkgettingstarted-260203175547-8361bcc3-thumbnail.jpg?width=640&height=640&fit=bounds)


