Downloaded 96 times


![Quick StartQuick Start
In [1]: import numpy as np
In [2]: a = np.array([1,2,3,4,5,6,7,8,9])
In [3]: a
Out[3]: array([1, 2, 3, 4, 5, 6, 7, 8, 9])
In [4]: b = a.reshape((3,3))
In [5]: b
Out[5]:
array([[1, 2, 3],
[4, 5, 6],
[7, 8, 9]])
In [6]: b * 10 + 4
Out[6]:
array([[14, 24, 34],
[44, 54, 64],
[74, 84, 94]])](https://image.slidesharecdn.com/introductiontonumpy-190402030015/85/Introduction-to-NumPy-6-320.jpg)
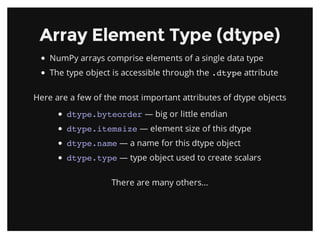
![Array dtypes are usually inferred automatically
But can also be specified explicitly
In [16]: a = np.array([1,2,3])
In [17]: a.dtype
Out[17]: dtype('int64')
In [18]: b = np.array([1,2,3,4.567])
In [19]: b.dtype
Out[19]: dtype('float64')
In [20]: a = np.array([1,2,3], dtype=np.float32)
In [21]: a.dtype
Out[21]: dtype('int64')
In [22]: a
Out[22]: array([ 1., 2., 3.], dtype=float32)](https://image.slidesharecdn.com/introductiontonumpy-190402030015/85/Introduction-to-NumPy-11-320.jpg)

![Array CreationArray Creation
Explicitly from a list of values
As a range of values
By specifying the number of elements
In [2]: np.array([1,2,3,4])
Out[2]: array([1, 2, 3, 4])
In [3]: np.arange(10)
Out[3]: array([0, 1, 2, 3, 4, 5, 6, 7, 8, 9])
In [4]: np.linspace(0, 1, 5)
Out[4]: array([ 0. , 0.25, 0.5 , 0.75, 1. ])](https://image.slidesharecdn.com/introductiontonumpy-190402030015/85/Introduction-to-NumPy-13-320.jpg)
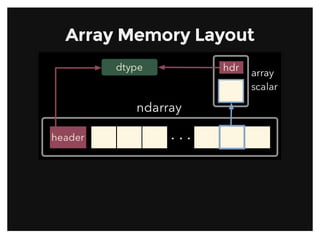
![Zero-initialized
One-initialized
Uninitialized
In [4]: np.zeros((2,2))
Out[4]:
array([[ 0., 0.],
[ 0., 0.]])
In [5]: np.ones((1,5))
Out[5]: array([[ 1., 1., 1., 1., 1.]])
In [4]: np.empty((1,3))
Out[4]: array([[ 2.12716633e-314, 2.12716633e-314, 2.15203762e-314]])](https://image.slidesharecdn.com/introductiontonumpy-190402030015/85/Introduction-to-NumPy-14-320.jpg)
![Constant diagonal value
Multiple diagonal values
In [6]: np.eye(3)
Out[6]:
array([[ 1., 0., 0.],
[ 0., 1., 0.],
[ 0., 0., 1.]])
In [7]: np.diag([1,2,3,4])
Out[7]:
array([[1, 0, 0, 0],
[0, 2, 0, 0],
[0, 0, 3, 0],
[0, 0, 0, 4]])](https://image.slidesharecdn.com/introductiontonumpy-190402030015/85/Introduction-to-NumPy-15-320.jpg)
![Array ViewsArray Views
Simple assigments do not make copies of arrays (same semantics as
Python). Slicing operations do not make copies either; they return views
on the original array.
Array views contain a pointer to the original data, but may have different
shape or stride values. Views always have flags.owndata equal to
False.
In [2]: a = np.arange(10)
In [3]: b = a[3:7]
In [4]: b
Out[4]: array([3, 4, 5, 6])
In [5]: b[:] = 0
In [6]: a
Out[6]: array([0, 1, 3, 0, 0, 0, 0, 7, 8, 9])
In [7]: b.flags.owndata
Out[7]: False](https://image.slidesharecdn.com/introductiontonumpy-190402030015/85/Introduction-to-NumPy-20-320.jpg)

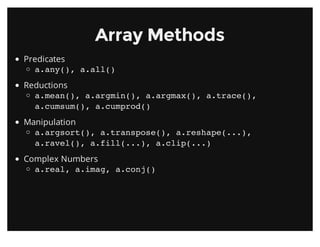
![AxisAxis
Array method reductions take an optional axis parameter that specifies
over which axes to reduce
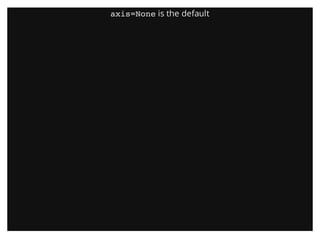
axis=None reduces into a single scalar
In [7]: a.sum
()
Out[7]: 105](https://image.slidesharecdn.com/introductiontonumpy-190402030015/85/Introduction-to-NumPy-23-320.jpg)
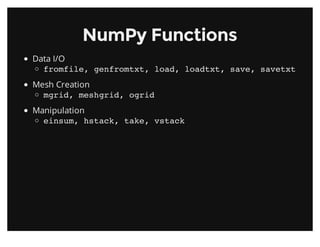
![axis=0 reduces into the zeroth dimension
axis=0 reduces into the first dimension
In [8]: a.sum(axis=0)
Out[8]: array([15, 18, 21, 24,
27])
In [9]: a.sum(axis=1)
Out[9]: array([10, 35, 60])](https://image.slidesharecdn.com/introductiontonumpy-190402030015/85/Introduction-to-NumPy-25-320.jpg)
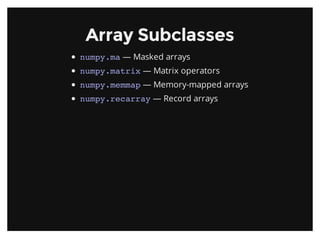
![Square Peg in a Round HoleSquare Peg in a Round Hole
If the dimensions do not match up, np.newaxis may be useful
In [16]: a = np.arange(6).reshape((2, 3))
In [17]: b = np.array([10, 100])
In [18]: a * b
---------------------------------------------------------------------------
ValueError Traceback (most recent call last)
in ()
----> 1 a * b
ValueError: operands could not be broadcast together with shapes (2,3) (2)
In [19]: b[:,np.newaxis].shape
Out[19]: (2, 1)
In [20]: a *b[:,np.newaxis]
Out[20]:
array([[ 0, 10, 20],
[300, 400, 500]])](https://image.slidesharecdn.com/introductiontonumpy-190402030015/85/Introduction-to-NumPy-29-320.jpg)
![Fancy IndexingFancy Indexing
NumPy arrays may be used to index into other arrays
In [2]: a = np.arange(15).reshape((3,5))
In [3]: a
Out[3]:
array([[ 0, 1, 2, 3, 4],
[ 5, 6, 7, 8, 9],
[10, 11, 12, 13, 14]])
In [4]: i = np.array([[0,1], [1, 2]])
In [5]: j = np.array([[2, 1], [4, 4]])
In [6]: a[i,j]
Out[6]:
array([[ 2, 6],
[ 9, 14]])](https://image.slidesharecdn.com/introductiontonumpy-190402030015/85/Introduction-to-NumPy-31-320.jpg)
![Boolean arrays can also be used as indices into other arrays
In [2]: a = np.arange(15).reshape((3,5))
In [3]: a
Out[3]:
array([[ 0, 1, 2, 3, 4],
[ 5, 6, 7, 8, 9],
[10, 11, 12, 13, 14]])
In [4]: b = (a % 3 == 0)
In [5]: b
Out[5]:
array([[ True, False, False, True, False],
[False, True, False, False, True],
[False, False, True, False, False]], dtype=bool)
In [6]: a[b]
Out[6]: array([ 0, 3, 6, 9, 12])](https://image.slidesharecdn.com/introductiontonumpy-190402030015/85/Introduction-to-NumPy-32-320.jpg)
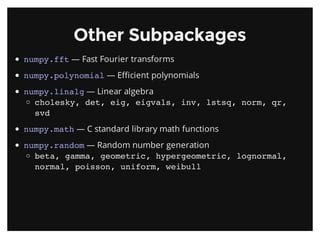
![FFTFFT
import numpy as np
t = np.linspace(0,120,4000)
PI = np.pi
signal = 12*np.sin(3 * 2*PI*t) # 3 Hz
signal += 6*np.sin(8 * 2*PI*t) # 8 Hz
signal += 1.5*np.random.random(len(t)) # noise
FFT = abs(np.fft.fft(signal))
freqs = np.fft.fftfreq(signal.size, t[1]-t[0])](https://image.slidesharecdn.com/introductiontonumpy-190402030015/85/Introduction-to-NumPy-37-320.jpg)


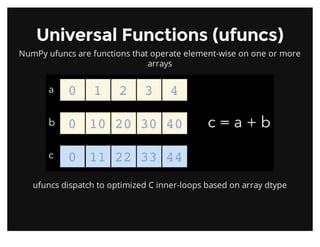
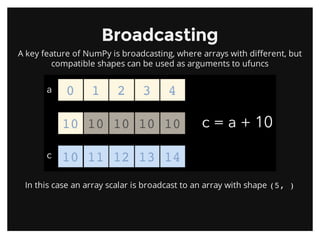
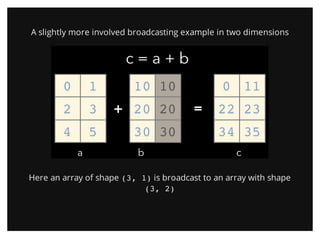
NumPy is a Python library used for working with multi-dimensional arrays and matrices for scientific computing. It allows fast operations on large data sets and arrays. NumPy arrays can be created from lists or ranges of values and support element-wise operations via universal functions. NumPy is the foundation of the Python scientific computing stack and provides key features like broadcasting for efficient computations.


![NUMPY [Autosaved] .pptx](https://cdn.slidesharecdn.com/ss_thumbnails/numpyautosaved-240106041504-989a0cc3-thumbnail.jpg?width=640&height=640&fit=bounds)


![[DSC Europe 25] Srba Markovic - From Pilot to Production: Overcoming AI Deplo...](https://cdn.slidesharecdn.com/ss_thumbnails/yjjmrtytmwbalxlba7px-4-srba-markovic-from-pilot-to-production-overcoming-ai-deployment-blockers-with-260114111931-4a892d44-thumbnail.jpg?width=640&height=640&fit=bounds)


![[DSC Europe 25] Slobodan Dolinic - Smart and Intelligent Green Region.pptx](https://cdn.slidesharecdn.com/ss_thumbnails/0bribinjsp6ghwtvsvor-2-sigre-slobodan-dolinic-260115093812-c9c10e90-thumbnail.jpg?width=640&height=640&fit=bounds)


![[DSC Europe 25] Dragan Jerosimovic - The Anatomy of a Narrative Simulation.pdf](https://cdn.slidesharecdn.com/ss_thumbnails/vzputuprdqr6zwbrwdcw-1-dragan-jerosimovic-the-anatomy-of-a-narrative-simulation-260114111931-9d04fba2-thumbnail.jpg?width=640&height=640&fit=bounds)
![[DSC Europe 25] Ivan Lukovic & Marija Djukic - From Data to Value: Why Maturi...](https://cdn.slidesharecdn.com/ss_thumbnails/ahrfps8xr6knowwhacxh-1-ivan-marija-dsc-2025-ld-v1-presentation-260115093812-be21adfc-thumbnail.jpg?width=640&height=640&fit=bounds)


![[DSC Europe 25] Ivica Milaric - The Future of Gaming and AI Tools.pptx](https://cdn.slidesharecdn.com/ss_thumbnails/tijgzsmgse2kj2y5pzzp-5-ivica-milaric-the-future-of-gaming-x-ai-tools-260114111931-87c2b3ac-thumbnail.jpg?width=640&height=640&fit=bounds)

