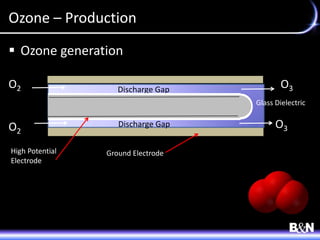
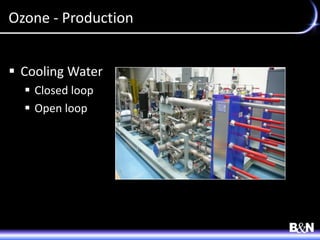
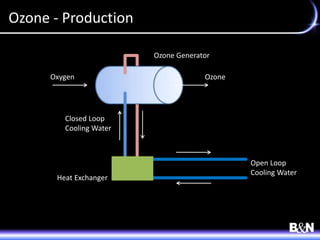
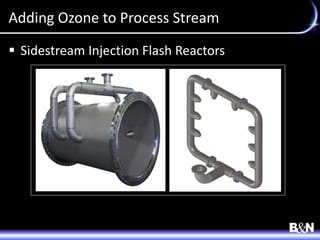
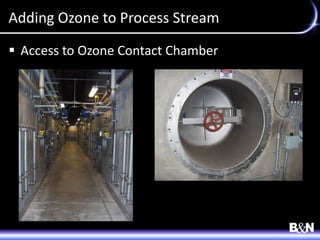
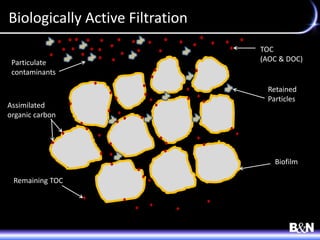
Ozone and Biologically Active Filtration
for Disinfection Byproduct Control
Tom Bell-Games, P.E.
Overview
 Ozone
 Use in Treatment
 Production
 System Components
 Operational and Design Considerations
 Safety
 Biologically Active Filtration
 Process Description
 Use in Treatment
 Operational and Design Considerations
 Demonstration Studies
 Applications in Ohio
Ozone
 O2 + energy O- + O-
 O- + O2 O3
 2O3 3O2
 Formed naturally during lightning storms
 Stratospheric (UV from sun + oxygen)
 Tropospheric (hydrocarbons, nitrogen oxide +
sunlight)
 Inherently unstable
Use of Ozone in Water Treatment
 Ozone discovered in mid- 1800’s
 First ozone generator manufactured by Von
Siemens in Berlin, 1857
 Disinfection of drinking water – Oudshoorn,
Netherlands, 1893; Nice, 1906
 49 installations by 1916
 Development of chlorine following WWI
 119 installations by 1940
Use of Ozone in Water Treatment, cont’d.
 > 2,000 by mid-1980’s
 Additional applications driven by recent
regulations within U.S.
 DBP precursors
 Organic micropollutants
 Cryptosporidium deactivation
 AOP
 Improvements in ozone generation systems,
methods of application, and analytical
instrumentation
Use of Ozone in Water Treatment
 Applications for ozone in water treatment:
 Reduction/removal of organics
 Reduction/removal of inorganics
 Enhanced flocculation/coagulation
 Reduction of disinfection byproduct precursors
 Enhanced disinfection
 Taste and odor control
 Ultrapure water systems, bottled water production,
etc.
Use of Ozone in Water Treatment
 DBP Reduction
 Some direct chemical oxidation of a fraction of NOM
 Partial oxidation: high molecular weight NOM
converted to low MW organics
 Increases biodegradable fraction of TOC (assimilable
organic carbon or AOC)
 Increase in AOC by 10 to 20 times
 Low MW compounds more easily transported across
cell membrane
 Low MW compounds more easily attacked by
metabolic enzymes
Ozone – Possible Points of Application
 Pre-ozonation
 Intermediate ozonation
 Post treatment
Ozone – System Components
 Oxygen source
 Supplemental air (nitrogen boost)
 Ozone generator
 Cooling water
 Contactor (basin or pipeline)
 Injection system (diffusion or sidestream
injection)
 Ozone destruct systems
 Ancillary instrumentation
Ozone – Production
Oxygen Source
 Air-fed
 Ambient air
 Complex chemical reactions
 Oxygen-fed
 LOX
 On-site generation (PSA)
Ozone Production – Preconditioning
 Preconditioning of inlet gas to avoid generation
of nitrogen oxides within the generator
 Air filters (dust)
 Air drying (humidity)
 Ambient air – 21% oxygen
 GOX – 95% oxygen
 Addition of small quantity of air (N) if using LOX
Ozone – Production
 Ozone generation
Ozone – Production
 Ozone generation
O3
O3
O2
O2
Corona Discharge Tube
Ozone – Production
 Ozone generation
O3O2
O2
O3
Discharge GapDischarge Gap
Discharge Gap
Glass Dielectric
Ground ElectrodeHigh Potential
Electrode
Ozone - Production
 Cooling Water
 Closed loop
 Open loop
Ozone - Production
Oxygen Ozone
Heat Exchanger
Closed Loop
Cooling Water
Open Loop
Cooling Water
Ozone Generator
Adding Ozone to Process Stream
 Diffusion
 Sidestream Injection
Adding Ozone to Process Stream
 Ceramic, Fine Bubble Diffusion
 Ozone Resistant Materials
 316 Stainless Steel
 Viton
 PTFE (Teflon)
 PVDF (Kynar)
Adding Ozone to Process Stream
 Diffusion
CAT
To Ozone Destruct
Adding Ozone to Process Stream
 Sidestream Injection
 Eductors
 Flash Reactors
Ozone Gas
Adding Ozone to Process Stream
Typical Sidestream Injection System
Sidestream
Pump
Venturi
Injector
Ozone Gas Feed
Ozone Gas Feed
Flash Reactor
Figure courtesy MWH Americas
Adding Ozone to Process Stream
 Sidestream Injection Flash Reactors
Adding Ozone to Process Stream
 Access to Ozone Contact Chamber
Ozone – Destruction
 Prevent release of off-gas ozone into
atmosphere
 Prevent adverse impact on downstream
equipment and processes from ozone residual
in process flow
Ozone – Destruction
 Off-gas destruction
 Thermal
 Catalyst (magnesium oxide)
Ozone – Destruction
 Ozone residual quenching
 Calcium thiosulfate
 Sodium thiosulfate
 Sodium bisulfite
 Hydrogen peroxide
Ozone – Operational and Design Considerations
 Ozone Demand
 Typical Types of Process Control
 Ozone gas concentration
 Ozone feed water flow (sidestream injection)
 Ozone residual at various points along contactor
 Mixing and contact time (HRT)
 UV254
 ORP
Ozone – Operational and Design Considerations
 Ozonation Byproducts
 Bromate (MCL 10 µg/L)
 Br− + O3 → BrO−
 Bromate mitigation strategies
Ozone – Operational and Design Considerations
 Hydraulics
 Seasonal variations in influent water quality
(temperature, pH, TOC)
 Dose and flow variations
 Method of application
 Oxygen vs. Air
 Materials of construction
 Gas phase
 Liquid Phase
Ozone – Safety
Oxygen
 LOX and Oxygen Gas
 Atmosphere
 78% Nitrogen
 21% Oxygen
 0.9% Argon
 0.03% Carbon Dioxide
 Oxygen >23% health issues
 Combustion in high-purity oxygen environment
 Oxygen heavier than air
Ozone – Safety
Ozone
 Concentrations detectible by scent
 0.01 – 0.05 ppm
 OSHA exposure limits
 8 hour continuous exposure @ 0.1 ppm
 15 minute continuous exposure @ 0.3 ppm
 Lethal limit
 1 minute exposure @ 10,000 ppm (1%)
 Health effects
 Acute: headache, dry and irritated mucous membranes
 Chronic: exacerbates asthma, emphysema, etc.
 Ozone heavier than air
Ozone – Safety
Equipment
 Ambient ozone and oxygen sensors
 Visual and audible alarm systems
 2-stage ventilation
 Proper Personal Protection Equipment (PPE)
 Training
 Maintenance (regular maintenance/monitoring
and prompt repair)
BAF – Process Description
 Same general filtration concepts as rapid sand
filtration
 Filters continue to be used for particle removal
while also removing AOC
 Biology establishes naturally – no need to
“seed” the filters
 Monitor development of biology through HPC
Biologically Active Filtration
Biofilm
TOC
(AOC & DOC)
Assimilated
organic carbon
Remaining TOC
Particulate
contaminants
Retained
Particles
BAF – Effect on Contaminants
 TOC removal affected by nature of NOM
 TOC removal by both physico-chemical and
biological processes
 Typically very high AOC removal
 Typically, 20-30% reduction in DBPFP with
Ozone + BAF
BAF – Operational and Design Considerations
 BAF filters can consistently meet particulate
removal standards
 BAF filters can be optimized for conventional
filter performance parameters
 Headloss
 Ripening time
 Low temperature – decreased organics removal
 Easily biodegradable compounds removed
within standard contact time of conv. filters
BAF – Operational and Design Considerations
 Backwashing with chlorinated backwash water
generally not an issue
 Backwashing with non-chlorinated water results
in slightly greater biomass
 Use of chlorinated backwash as a biomass
control strategy
 Performance typically fully recovered within the
filter cycle
BAF – Operational and Design Considerations
 Air scour as a supplement to hydraulic backwash
 Operating parameters typically unchanged
 Filter run time
 Rate of head loss
 Backwash frequency
 Potential for reduced filter run times if DOC
fraction is high (> 6 mg/L)
 Increase in filter media effective size may be
warranted
 Opportunity to optimize filtration
BAF – Operational and Design Considerations
 Ozonation by-products (e.g. aldehydes)
generally readily removed by BAF
 TOC removal generally independent of EBCT if
EBCT in range of 4 to 20 minutes
 BAF can be effective in reducing subsequent
regrowth in distribution system
 GAC generally more effective than anthracite or
sand
 Coal-based GAC generally better than wood-
based GAC
BAF – Operational and Design Considerations
 Control strategies similar to conventional
filtration
 HPC can be used to measure biological activity
 HPC affected by:
 Length of time since start-up
 Water temperature
 Media type
 Presence / absence of chlorine in backwash water
BAF – Operational and Design Considerations
 Implementation Considerations
 Most plants able to switch to BAF without change to
historical practices
 Most plants report improved particulate removal
and reduced turbidity
 Potential release of manganese in some systems
 Filters exposed to sunlight may exhibit growth of
algae
 Potential filter gas binding (not common)
Pilot-scale Demonstration
 Pilot-scale demonstration used to evaluate
water specific performance
 Dose-TOC reduction
 Various filter media configurations
 Sand / anthracite
 Sand / GAC
 Performance for other specific contaminants
Pilot-scale Demonstration
 Initial bench-scale evaluation of background
ozone demand
 4 to 6 weeks for establishment of biology
 6 weeks for official Ohio EPA approval
 Additional time for evaluation of other
conditions or optimization of operation
Applications in Ohio
 Ozone
 Columbus – Hap Cremean, in design
 Biologically Active Filtration
 GCWW – Richard Miller
 Others
Ozone and Biologically Active Filtration
for Disinfection Byproduct Control
Tom Bell-Games, P.E.
tom.bell-games@burgessniple.com

Ozone - Ohio AWWA 2011

  • 1.
    Ozone and BiologicallyActive Filtration for Disinfection Byproduct Control Tom Bell-Games, P.E.
  • 2.
    Overview  Ozone  Usein Treatment  Production  System Components  Operational and Design Considerations  Safety  Biologically Active Filtration  Process Description  Use in Treatment  Operational and Design Considerations  Demonstration Studies  Applications in Ohio
  • 3.
    Ozone  O2 +energy O- + O-  O- + O2 O3  2O3 3O2  Formed naturally during lightning storms  Stratospheric (UV from sun + oxygen)  Tropospheric (hydrocarbons, nitrogen oxide + sunlight)  Inherently unstable
  • 4.
    Use of Ozonein Water Treatment  Ozone discovered in mid- 1800’s  First ozone generator manufactured by Von Siemens in Berlin, 1857  Disinfection of drinking water – Oudshoorn, Netherlands, 1893; Nice, 1906  49 installations by 1916  Development of chlorine following WWI  119 installations by 1940
  • 5.
    Use of Ozonein Water Treatment, cont’d.  > 2,000 by mid-1980’s  Additional applications driven by recent regulations within U.S.  DBP precursors  Organic micropollutants  Cryptosporidium deactivation  AOP  Improvements in ozone generation systems, methods of application, and analytical instrumentation
  • 6.
    Use of Ozonein Water Treatment  Applications for ozone in water treatment:  Reduction/removal of organics  Reduction/removal of inorganics  Enhanced flocculation/coagulation  Reduction of disinfection byproduct precursors  Enhanced disinfection  Taste and odor control  Ultrapure water systems, bottled water production, etc.
  • 7.
    Use of Ozonein Water Treatment  DBP Reduction  Some direct chemical oxidation of a fraction of NOM  Partial oxidation: high molecular weight NOM converted to low MW organics  Increases biodegradable fraction of TOC (assimilable organic carbon or AOC)  Increase in AOC by 10 to 20 times  Low MW compounds more easily transported across cell membrane  Low MW compounds more easily attacked by metabolic enzymes
  • 8.
    Ozone – PossiblePoints of Application  Pre-ozonation  Intermediate ozonation  Post treatment
  • 9.
    Ozone – SystemComponents  Oxygen source  Supplemental air (nitrogen boost)  Ozone generator  Cooling water  Contactor (basin or pipeline)  Injection system (diffusion or sidestream injection)  Ozone destruct systems  Ancillary instrumentation
  • 10.
    Ozone – Production OxygenSource  Air-fed  Ambient air  Complex chemical reactions  Oxygen-fed  LOX  On-site generation (PSA)
  • 11.
    Ozone Production –Preconditioning  Preconditioning of inlet gas to avoid generation of nitrogen oxides within the generator  Air filters (dust)  Air drying (humidity)  Ambient air – 21% oxygen  GOX – 95% oxygen  Addition of small quantity of air (N) if using LOX
  • 12.
    Ozone – Production Ozone generation
  • 13.
    Ozone – Production Ozone generation O3 O3 O2 O2 Corona Discharge Tube
  • 14.
    Ozone – Production Ozone generation O3O2 O2 O3 Discharge GapDischarge Gap Discharge Gap Glass Dielectric Ground ElectrodeHigh Potential Electrode
  • 15.
    Ozone - Production Cooling Water  Closed loop  Open loop
  • 16.
    Ozone - Production OxygenOzone Heat Exchanger Closed Loop Cooling Water Open Loop Cooling Water Ozone Generator
  • 17.
    Adding Ozone toProcess Stream  Diffusion  Sidestream Injection
  • 18.
    Adding Ozone toProcess Stream  Ceramic, Fine Bubble Diffusion  Ozone Resistant Materials  316 Stainless Steel  Viton  PTFE (Teflon)  PVDF (Kynar)
  • 19.
    Adding Ozone toProcess Stream  Diffusion CAT To Ozone Destruct
  • 20.
    Adding Ozone toProcess Stream  Sidestream Injection  Eductors  Flash Reactors Ozone Gas
  • 21.
    Adding Ozone toProcess Stream Typical Sidestream Injection System Sidestream Pump Venturi Injector Ozone Gas Feed Ozone Gas Feed Flash Reactor Figure courtesy MWH Americas
  • 22.
    Adding Ozone toProcess Stream  Sidestream Injection Flash Reactors
  • 23.
    Adding Ozone toProcess Stream  Access to Ozone Contact Chamber
  • 24.
    Ozone – Destruction Prevent release of off-gas ozone into atmosphere  Prevent adverse impact on downstream equipment and processes from ozone residual in process flow
  • 25.
    Ozone – Destruction Off-gas destruction  Thermal  Catalyst (magnesium oxide)
  • 26.
    Ozone – Destruction Ozone residual quenching  Calcium thiosulfate  Sodium thiosulfate  Sodium bisulfite  Hydrogen peroxide
  • 27.
    Ozone – Operationaland Design Considerations  Ozone Demand  Typical Types of Process Control  Ozone gas concentration  Ozone feed water flow (sidestream injection)  Ozone residual at various points along contactor  Mixing and contact time (HRT)  UV254  ORP
  • 28.
    Ozone – Operationaland Design Considerations  Ozonation Byproducts  Bromate (MCL 10 µg/L)  Br− + O3 → BrO−  Bromate mitigation strategies
  • 29.
    Ozone – Operationaland Design Considerations  Hydraulics  Seasonal variations in influent water quality (temperature, pH, TOC)  Dose and flow variations  Method of application  Oxygen vs. Air  Materials of construction  Gas phase  Liquid Phase
  • 30.
    Ozone – Safety Oxygen LOX and Oxygen Gas  Atmosphere  78% Nitrogen  21% Oxygen  0.9% Argon  0.03% Carbon Dioxide  Oxygen >23% health issues  Combustion in high-purity oxygen environment  Oxygen heavier than air
  • 31.
    Ozone – Safety Ozone Concentrations detectible by scent  0.01 – 0.05 ppm  OSHA exposure limits  8 hour continuous exposure @ 0.1 ppm  15 minute continuous exposure @ 0.3 ppm  Lethal limit  1 minute exposure @ 10,000 ppm (1%)  Health effects  Acute: headache, dry and irritated mucous membranes  Chronic: exacerbates asthma, emphysema, etc.  Ozone heavier than air
  • 32.
    Ozone – Safety Equipment Ambient ozone and oxygen sensors  Visual and audible alarm systems  2-stage ventilation  Proper Personal Protection Equipment (PPE)  Training  Maintenance (regular maintenance/monitoring and prompt repair)
  • 33.
    BAF – ProcessDescription  Same general filtration concepts as rapid sand filtration  Filters continue to be used for particle removal while also removing AOC  Biology establishes naturally – no need to “seed” the filters  Monitor development of biology through HPC
  • 34.
    Biologically Active Filtration Biofilm TOC (AOC& DOC) Assimilated organic carbon Remaining TOC Particulate contaminants Retained Particles
  • 35.
    BAF – Effecton Contaminants  TOC removal affected by nature of NOM  TOC removal by both physico-chemical and biological processes  Typically very high AOC removal  Typically, 20-30% reduction in DBPFP with Ozone + BAF
  • 36.
    BAF – Operationaland Design Considerations  BAF filters can consistently meet particulate removal standards  BAF filters can be optimized for conventional filter performance parameters  Headloss  Ripening time  Low temperature – decreased organics removal  Easily biodegradable compounds removed within standard contact time of conv. filters
  • 37.
    BAF – Operationaland Design Considerations  Backwashing with chlorinated backwash water generally not an issue  Backwashing with non-chlorinated water results in slightly greater biomass  Use of chlorinated backwash as a biomass control strategy  Performance typically fully recovered within the filter cycle
  • 38.
    BAF – Operationaland Design Considerations  Air scour as a supplement to hydraulic backwash  Operating parameters typically unchanged  Filter run time  Rate of head loss  Backwash frequency  Potential for reduced filter run times if DOC fraction is high (> 6 mg/L)  Increase in filter media effective size may be warranted  Opportunity to optimize filtration
  • 39.
    BAF – Operationaland Design Considerations  Ozonation by-products (e.g. aldehydes) generally readily removed by BAF  TOC removal generally independent of EBCT if EBCT in range of 4 to 20 minutes  BAF can be effective in reducing subsequent regrowth in distribution system  GAC generally more effective than anthracite or sand  Coal-based GAC generally better than wood- based GAC
  • 40.
    BAF – Operationaland Design Considerations  Control strategies similar to conventional filtration  HPC can be used to measure biological activity  HPC affected by:  Length of time since start-up  Water temperature  Media type  Presence / absence of chlorine in backwash water
  • 41.
    BAF – Operationaland Design Considerations  Implementation Considerations  Most plants able to switch to BAF without change to historical practices  Most plants report improved particulate removal and reduced turbidity  Potential release of manganese in some systems  Filters exposed to sunlight may exhibit growth of algae  Potential filter gas binding (not common)
  • 42.
    Pilot-scale Demonstration  Pilot-scaledemonstration used to evaluate water specific performance  Dose-TOC reduction  Various filter media configurations  Sand / anthracite  Sand / GAC  Performance for other specific contaminants
  • 43.
    Pilot-scale Demonstration  Initialbench-scale evaluation of background ozone demand  4 to 6 weeks for establishment of biology  6 weeks for official Ohio EPA approval  Additional time for evaluation of other conditions or optimization of operation
  • 44.
    Applications in Ohio Ozone  Columbus – Hap Cremean, in design  Biologically Active Filtration  GCWW – Richard Miller  Others
  • 45.
    Ozone and BiologicallyActive Filtration for Disinfection Byproduct Control Tom Bell-Games, P.E. tom.bell-games@burgessniple.com

Editor's Notes

  • #4 Unstable, short half-life – quickly reverts to oxygen, donating oxygen atom for oxidation When ozone decomposes in water, free radicals of hydrogen peroxy (HO2) and hydroxyl (OH) are formed with strong oxidizing capacity
  • #6 Generation: was 2-4% concentration by weight; now 10-16% Application: formerly by diffusion; now sidestream injection (high transfer efficiency, >95%); less expensive installation and operating costs
  • #7 NOM typically not completely mineralized by ozone; rather – partially oxidized and more readily biodegradable (combined with other processes, 20-60% removal of DOC) Pesticides – (e.g. diazinon) 80 to 90% removal Herbicides (e.g. atrazine) > 90% removal MTBE and chlorinated VOC’s MIB & Geosmin – 30-80% removal; increased to 60-90% removal when coupled with hydrogen peroxide (AOP)
  • #8 Source of NOM influences composition of organic matter and influences biodegradability. In general, without modification, only a small fraction of NOM is biodegradable.
  • #9 Pre: pre-oxidation; improve flocculation/coagulation Intermediate: degrade organics prior to BAF Post: part of an AOP; supplemental disinfection
  • #10 Must be generated on-site due to inherent instability Cooling water – open- and closed-loops systems required Ozone destruct: both off-gas and process flow ozone residual Ancillary instrumentation: sampling, oxygen and ozone sensors
  • #11 Air fed – complex chem reactions due to various forms of nitrogen On-site generation (typically where LOX not readily available) If using LOX, system also includes LOX tanks and vaporizers (typical of larger installations) On-site generation with pressure swing adsorption
  • #12 Preconditioning required regardless of the source of oxygen For constant energy consumption, production increases by 1.7 to 2.5 when using GOX Nitrogen from air addition facilitates molecular collisions which generate O3
  • #13 O2 – either on-site generation (typically very large systems or where LOX not readily available) or LOX If using LOX, system also includes LOX tanks and vaporizers
  • #19 Transfer efficiency typically >85%, depending on installation.
  • #20 Typically 20 ft sidewater depth. Cost of deep contactor is a factor; operating costs for maintenance of diffusers also a potential issue. Ozone transfers into liquid phase as bubbles rise. Residual pressure from ozone generators drives the gas. May have 2-3 zones of application May be con-current or counter-current (more efficient)
  • #23 Wider choice in contactor type, geometry, and baffling. Reduced overall cost. Improved operational efficiency.
  • #24 Depending on configuration: man-way side ports, access from top, or both.
  • #27 Very rapid reaction (within a few seconds). Carrier water used to facilitate mixing.
  • #28 Dose = ozone demand + residual required for treatment UV254 preferentially absorbed by unsaturated chemical bonds. Bulk of bonds associated with organic matter. High UV to TOC ratio can be indicative of greater complexity which may cause the NOM to be less biodegradable. As UV254 drops, indicates more biodegradable TOC. High UV-TOC ratio more typical of soil-based humic substances
  • #29 Check for elevated levels of bromide (> 50 ug/L Br-) Bromate mitigation strategies include: decreased ozone dose; lower pH; alternative disinfectants (chlorine dioxide, ammonia, etc.)
  • #30 Lower temp – more efficient Higher Ozone concentration – more efficient Incr. detention time – more efficient In general, lower pH – more efficient ozone use
  • #36 AOC removals near 100%
  • #38 Biomass reduction about 20% when backwashed with chlorinated water (1 mg/L) Recovery (with respect to removal of aldehydes) in about 12 hours Reduction in DBP FP not significant BW w/ non-chlorinated water generally preferential for routine backwashing
  • #39 Generally, BAF does not lead to unacceptable filtration performance.
  • #42 Manganese release from old media when pre-chlorination in past resulted in manganese removal (sim. to greensand). Best to remove and replace media. Filters exposed to sunlight more common in warmer climates. Air binding – negative head operating condition or air bubble carried over from rapid mix. Not typical of conventional designs.
  • #43 GAC generally able to hold more biomass