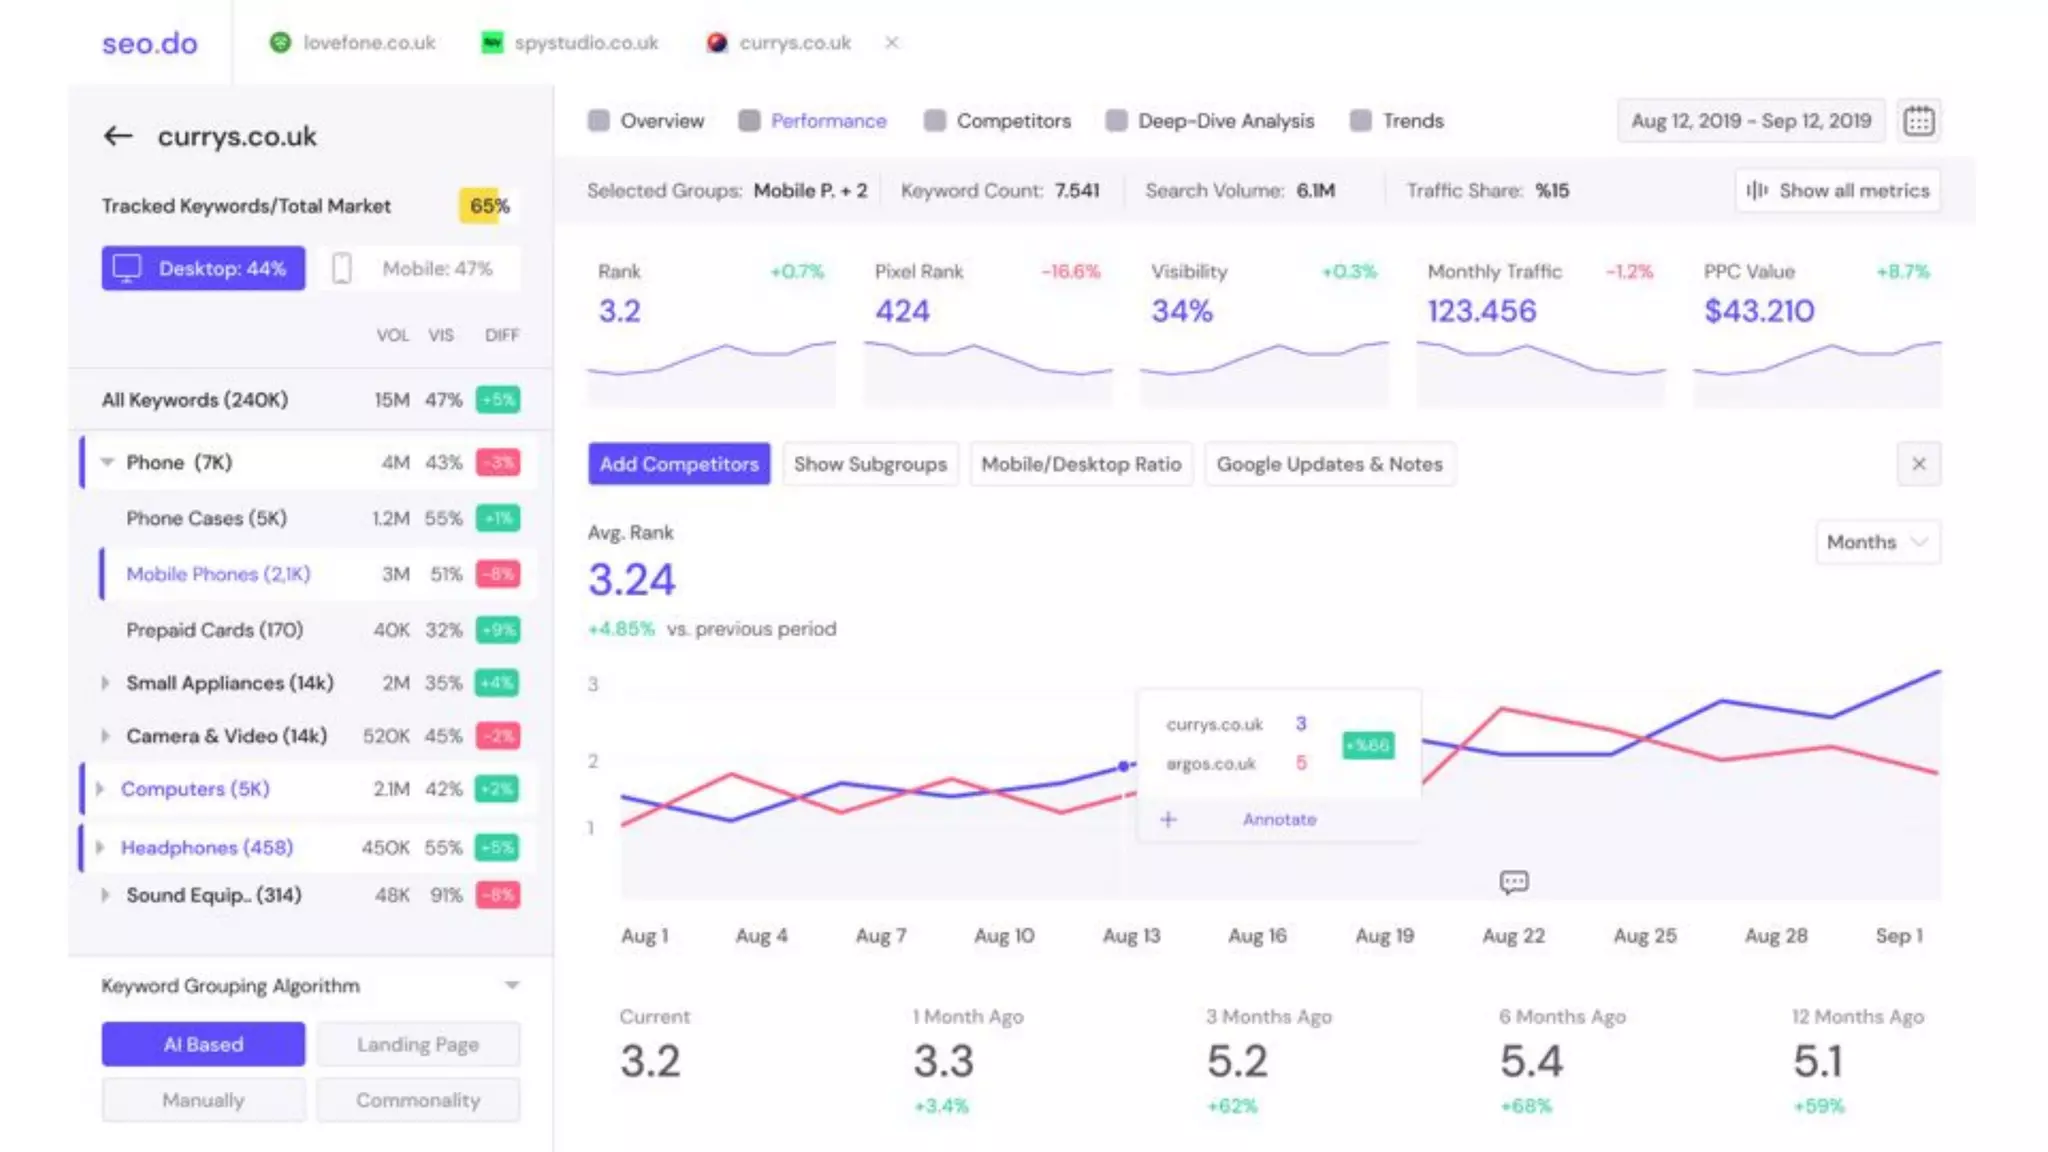
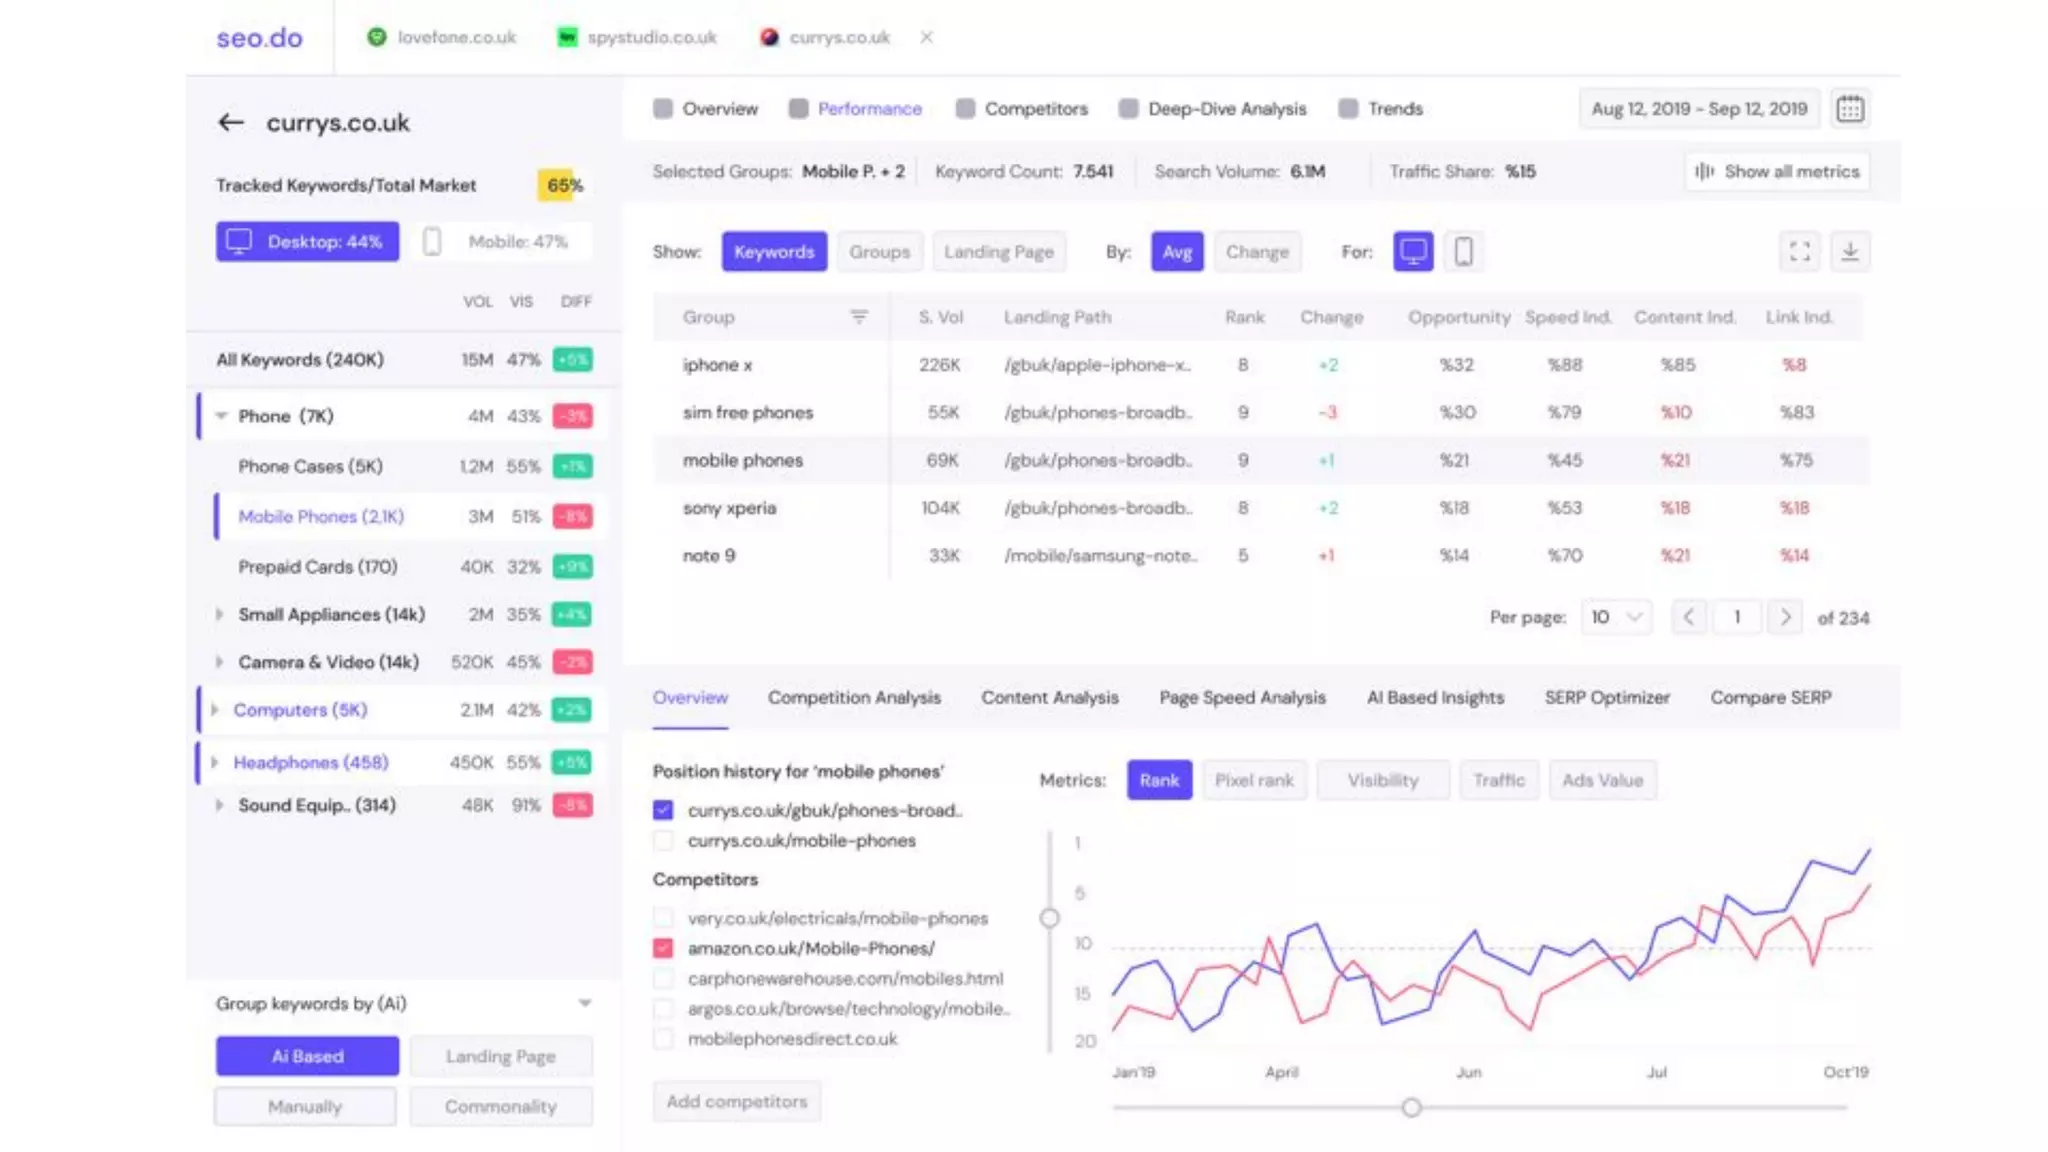
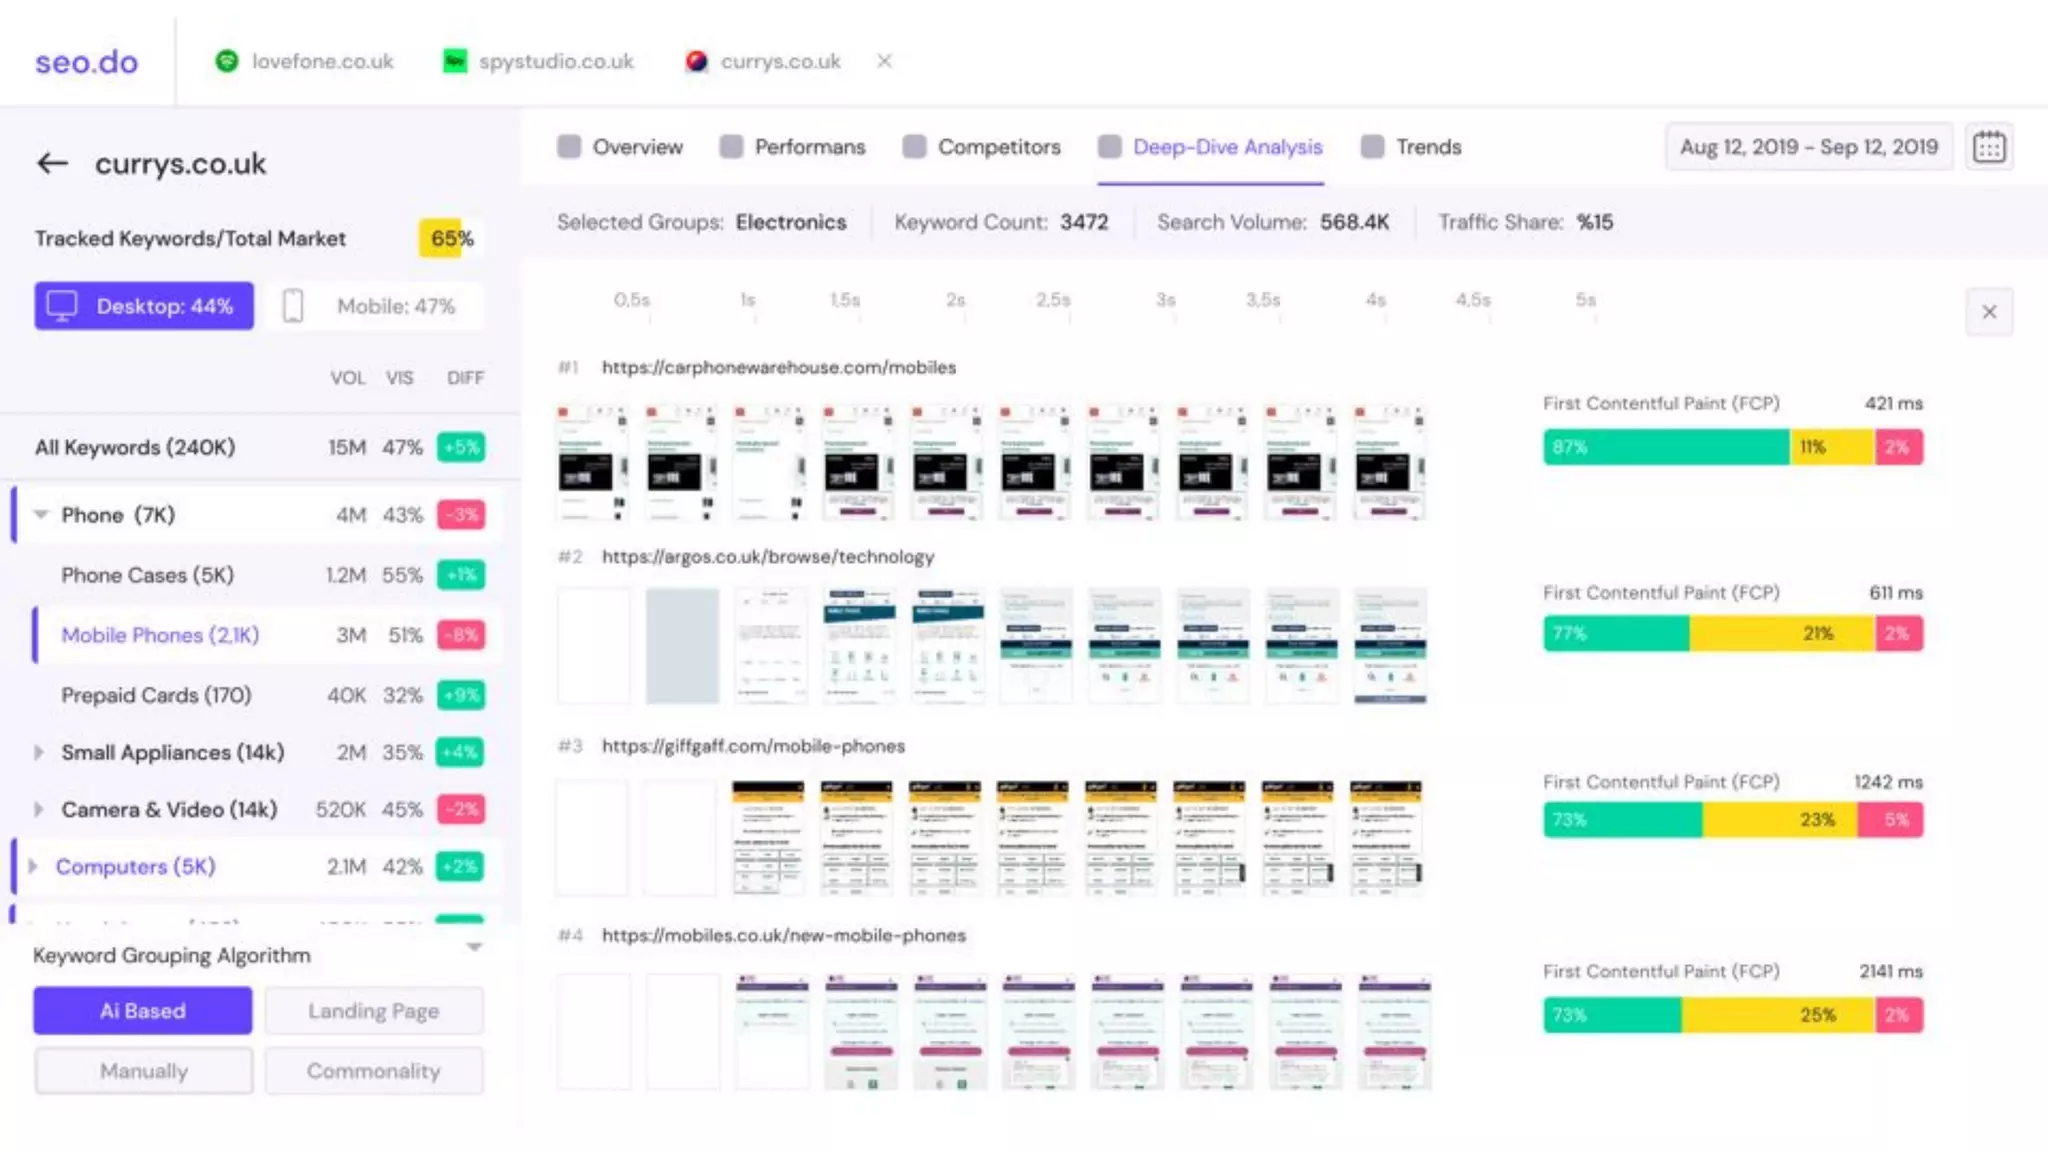
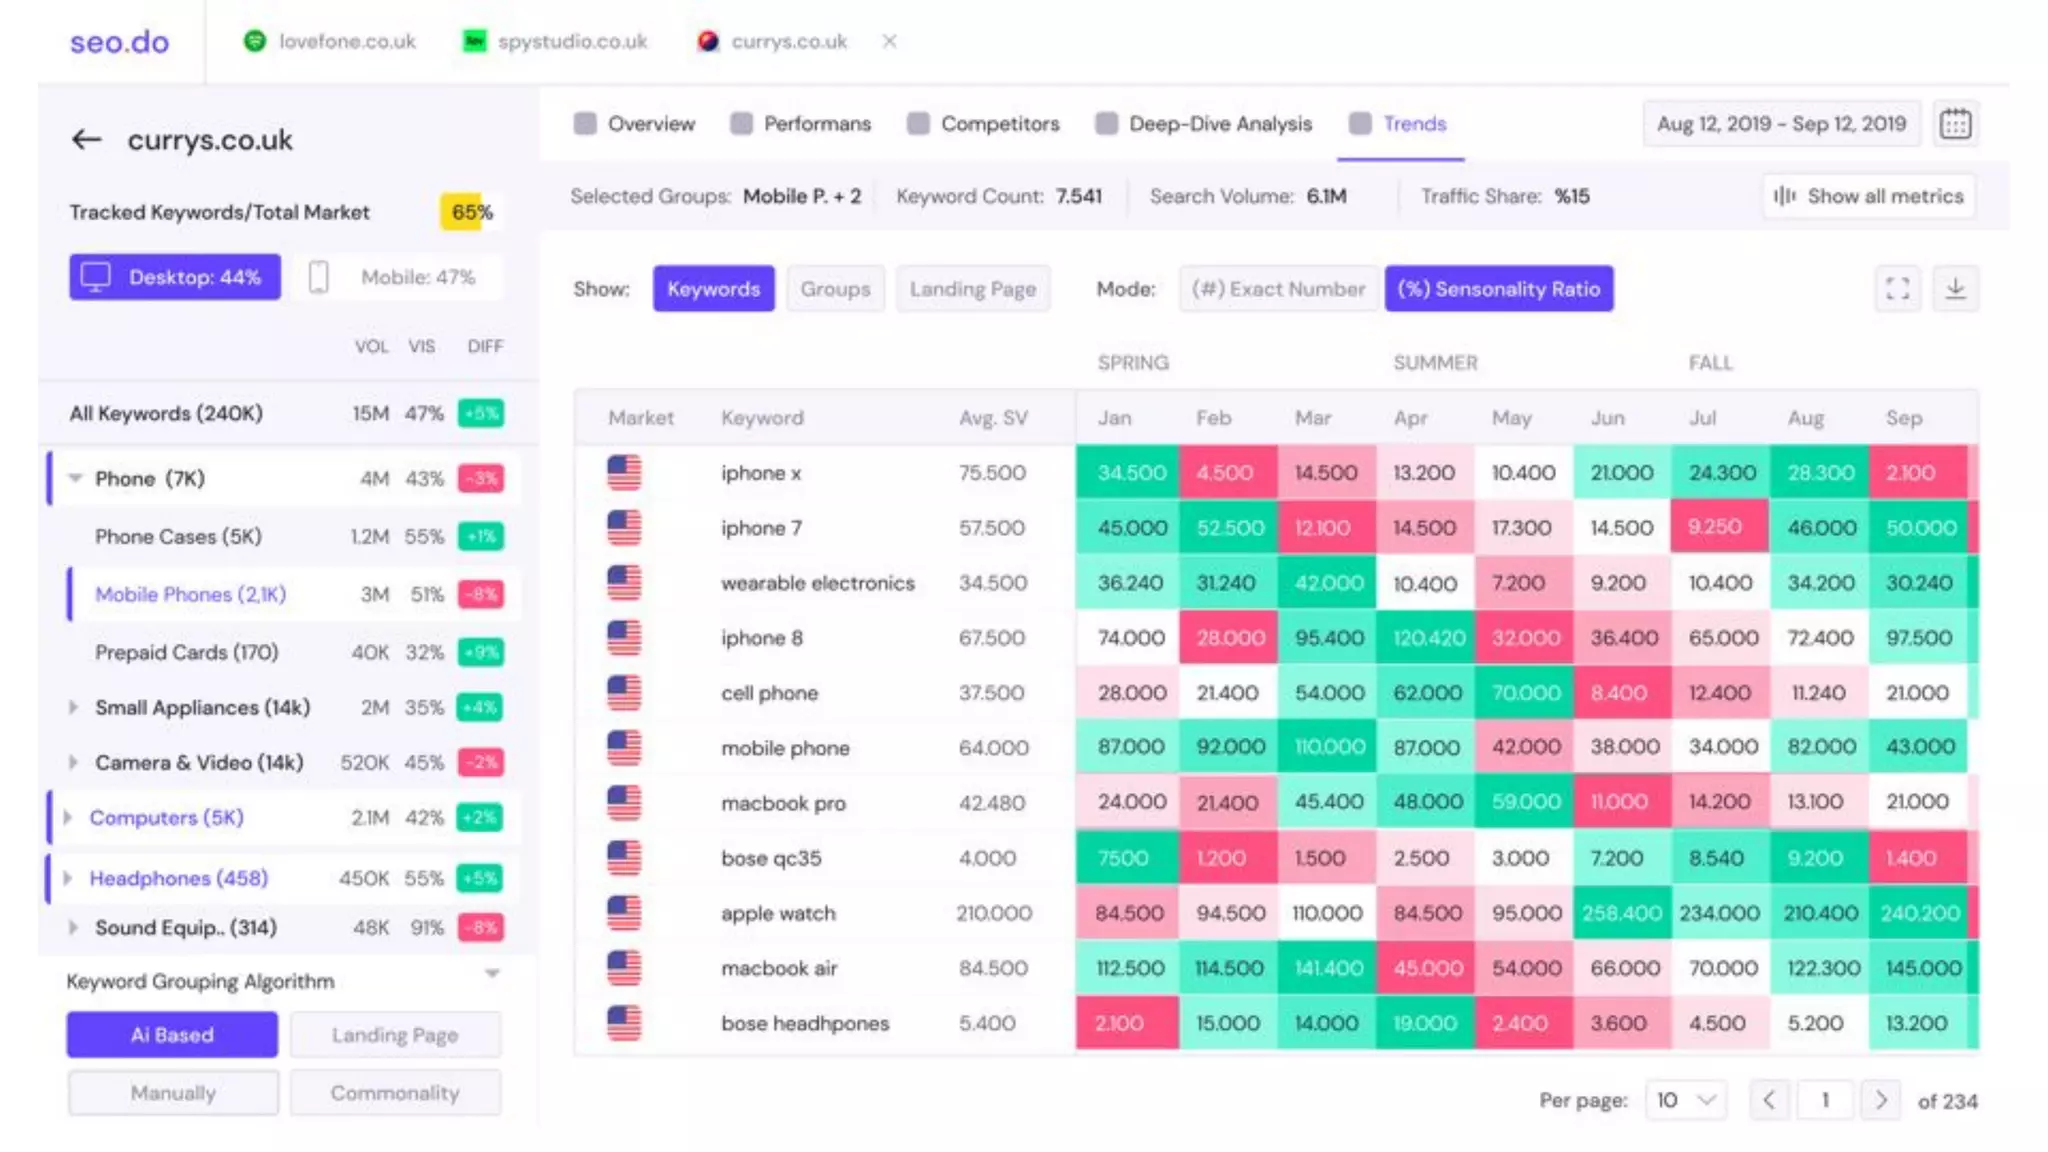
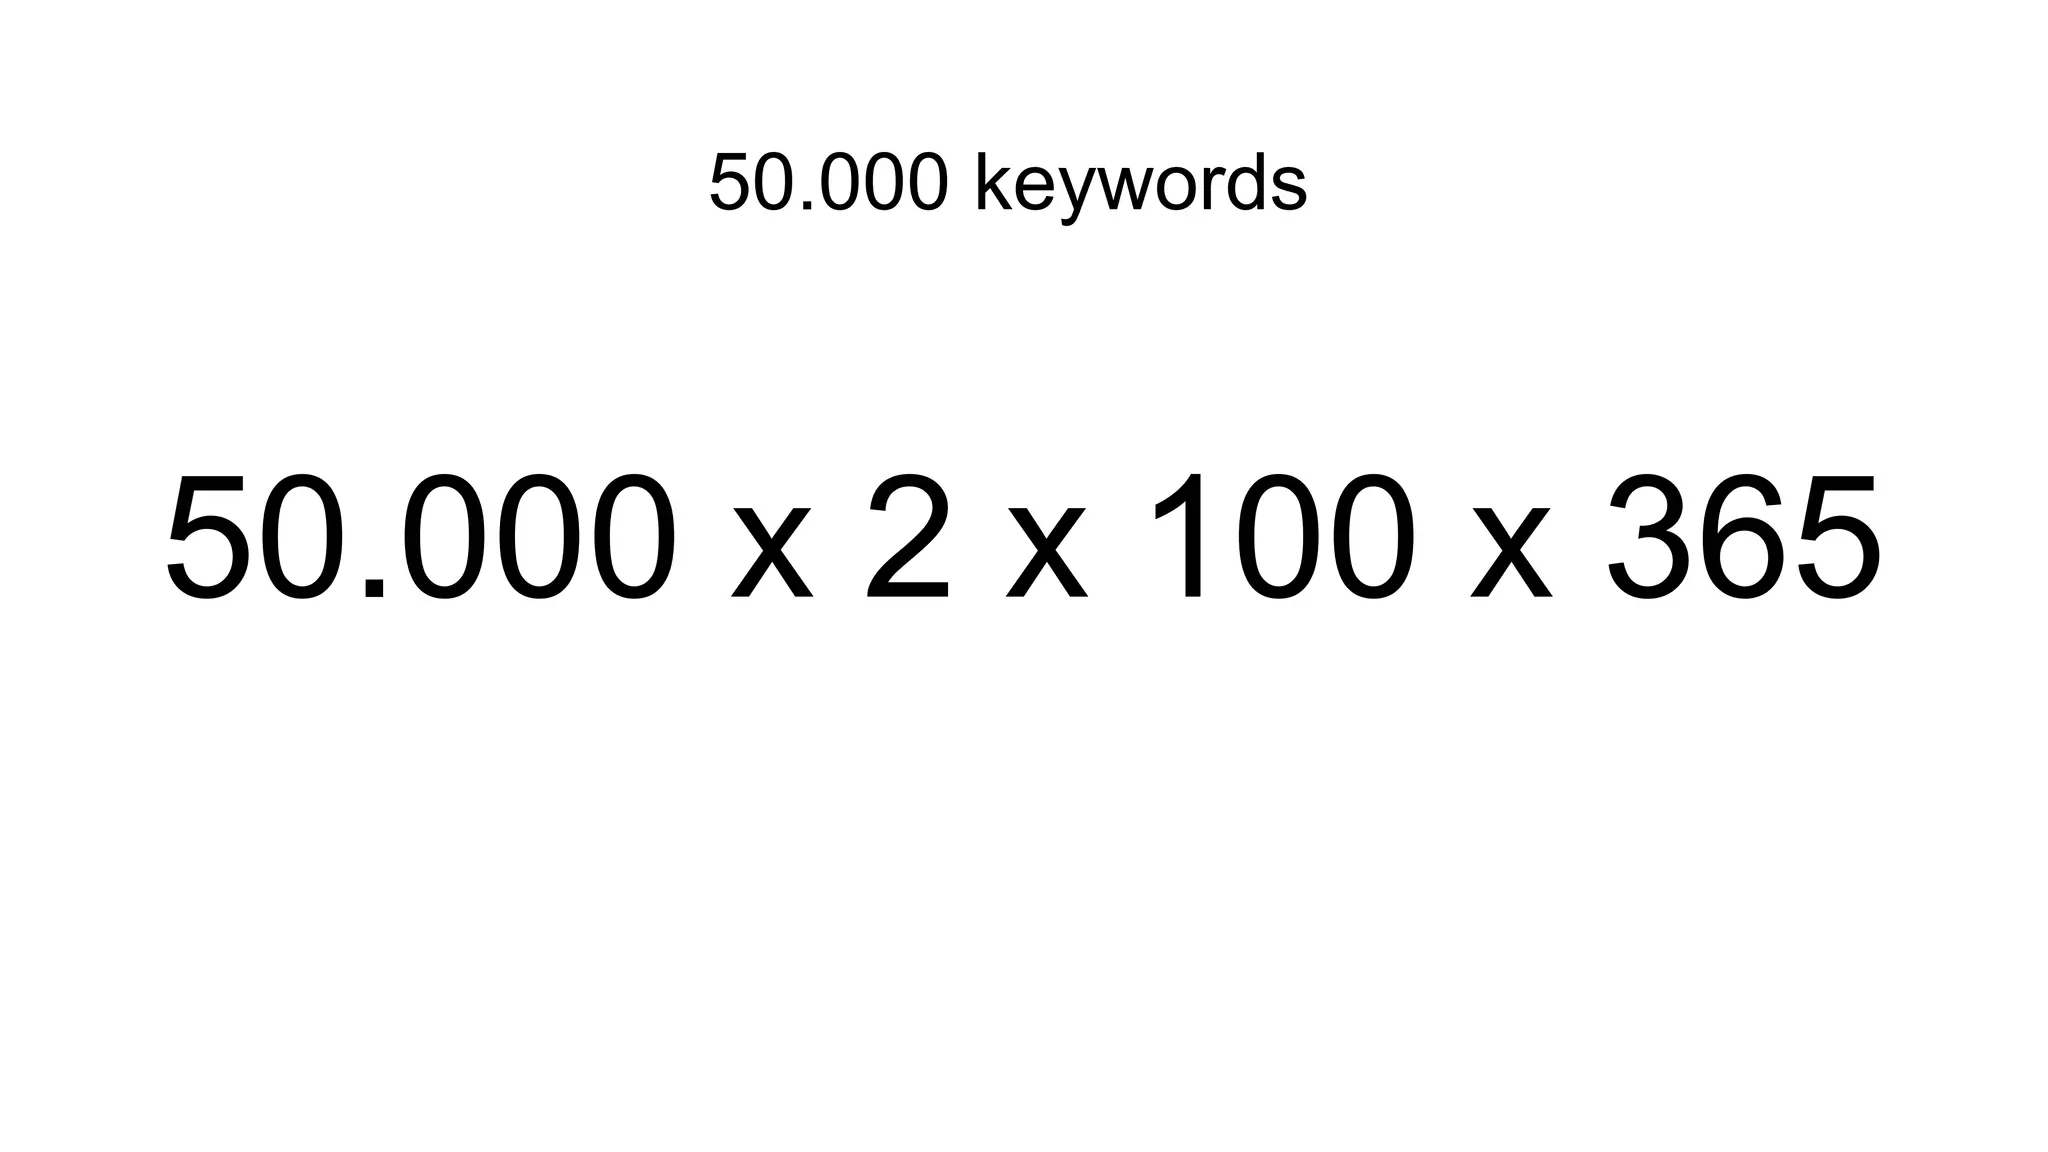
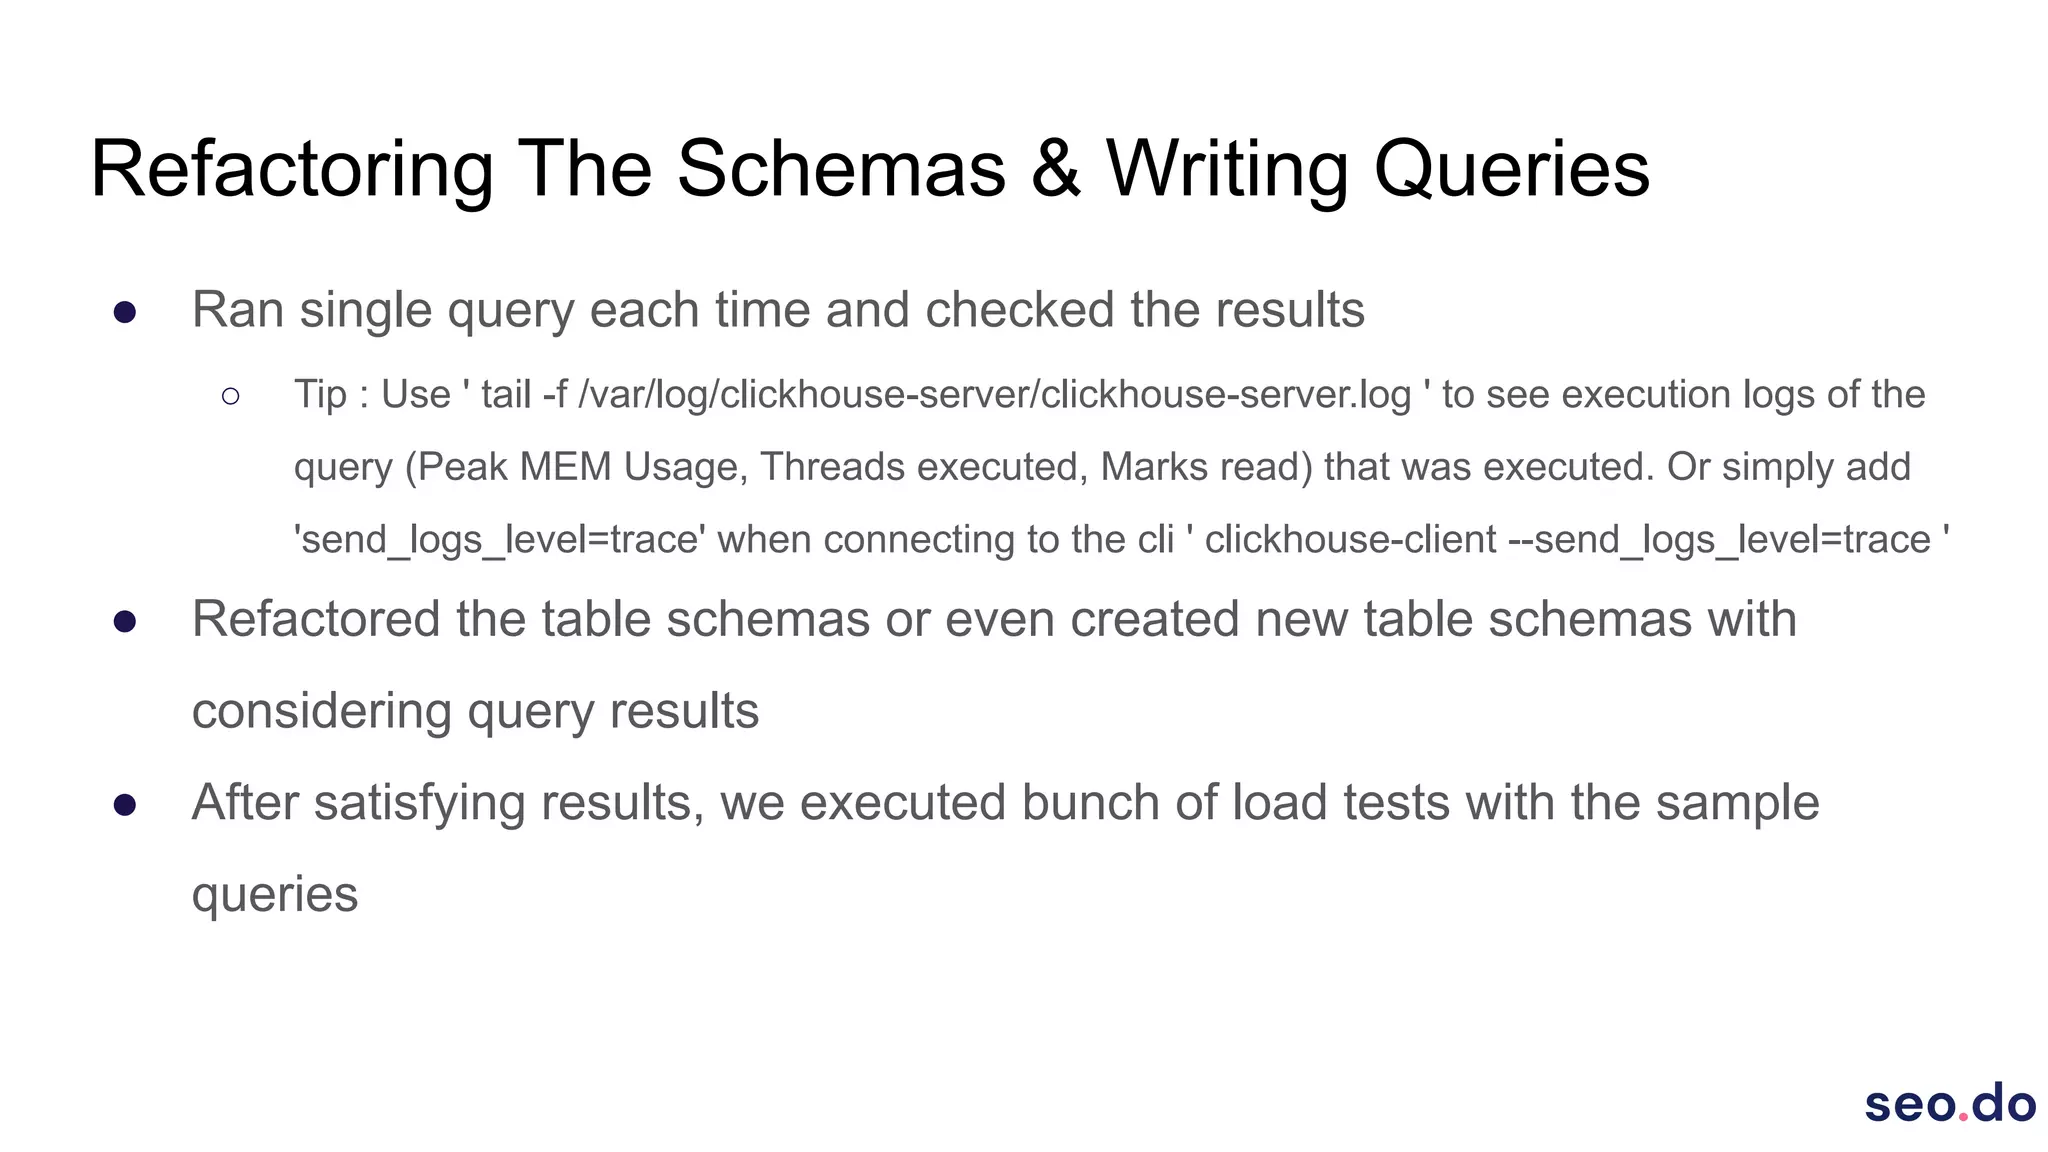
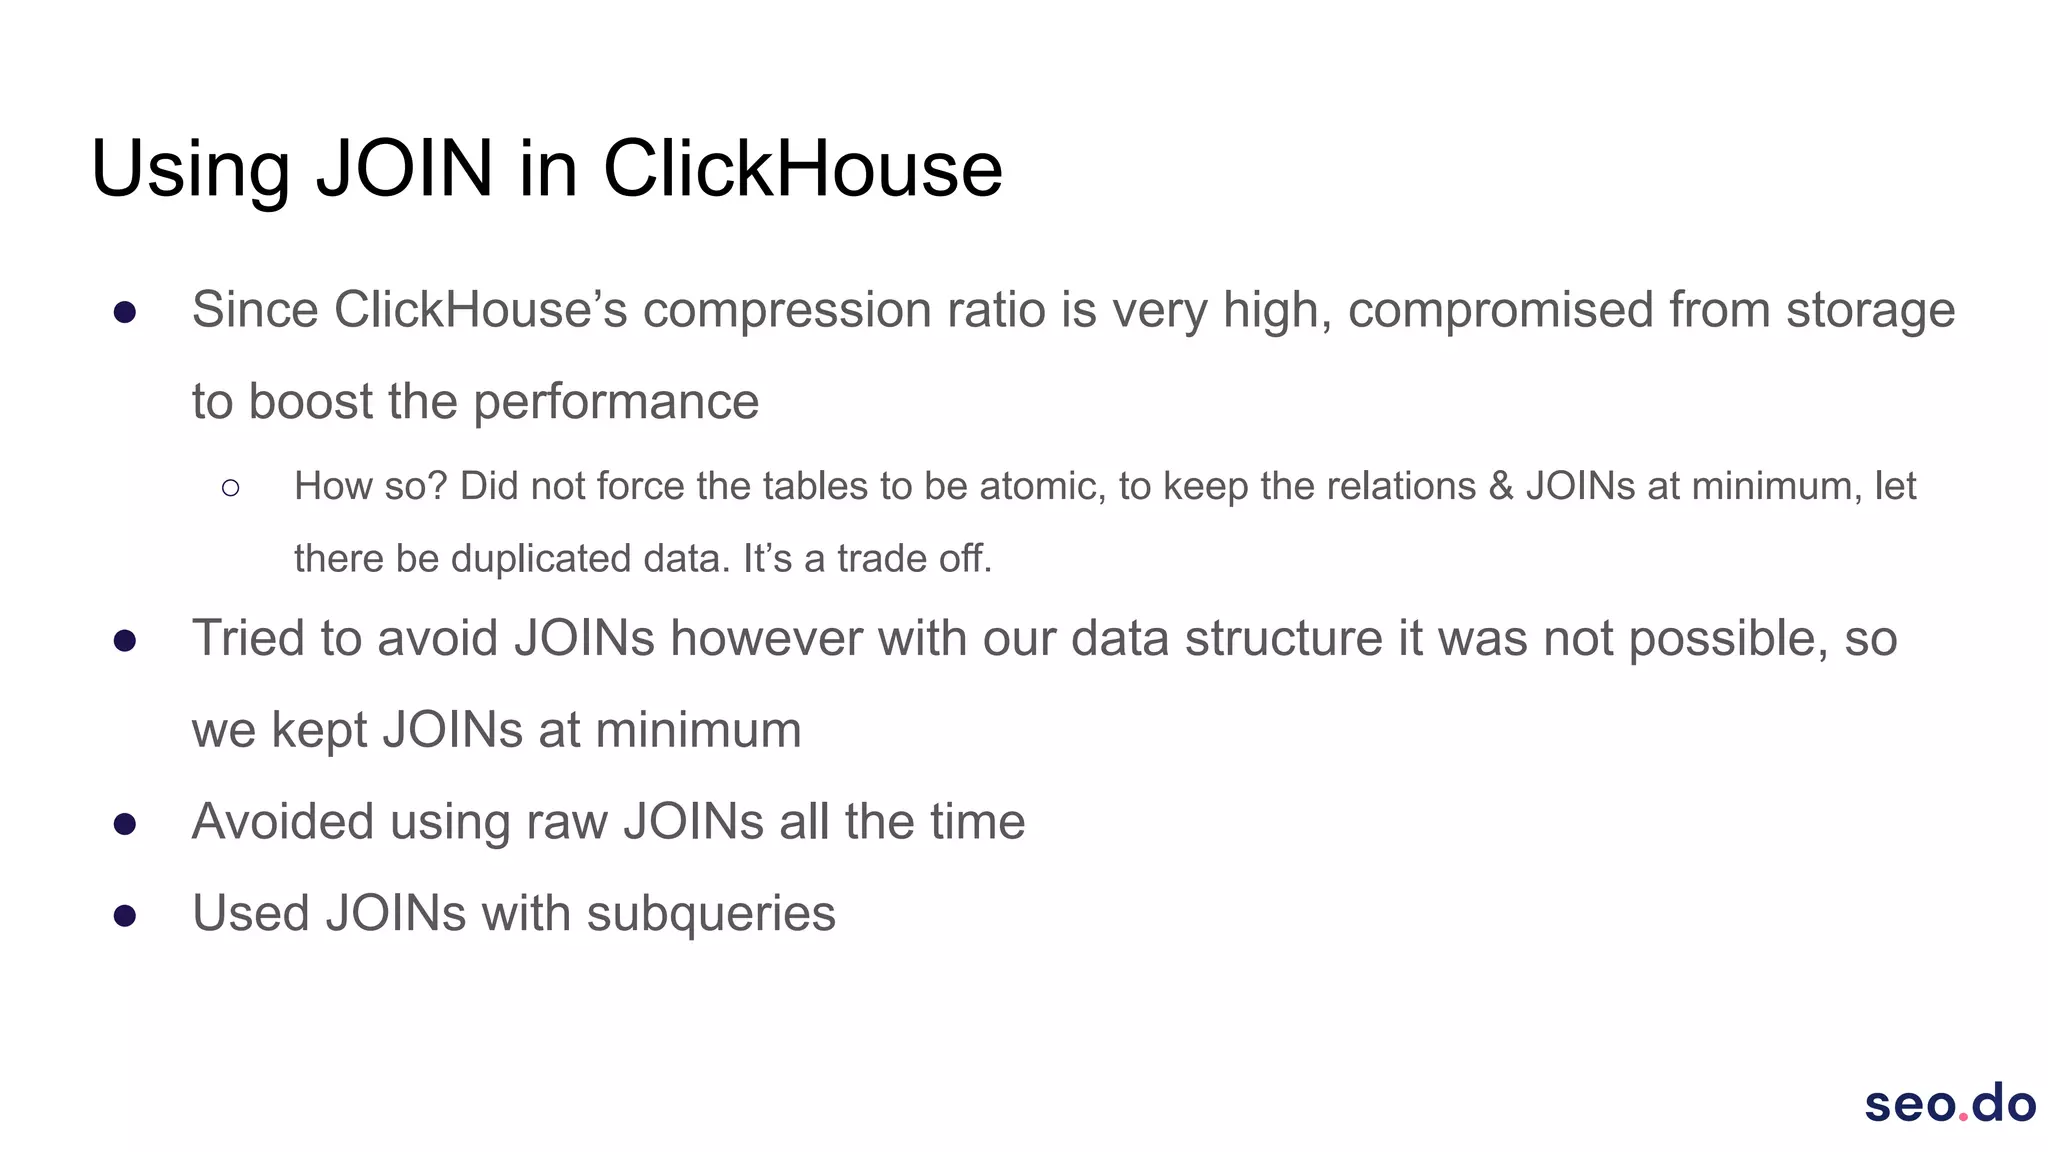
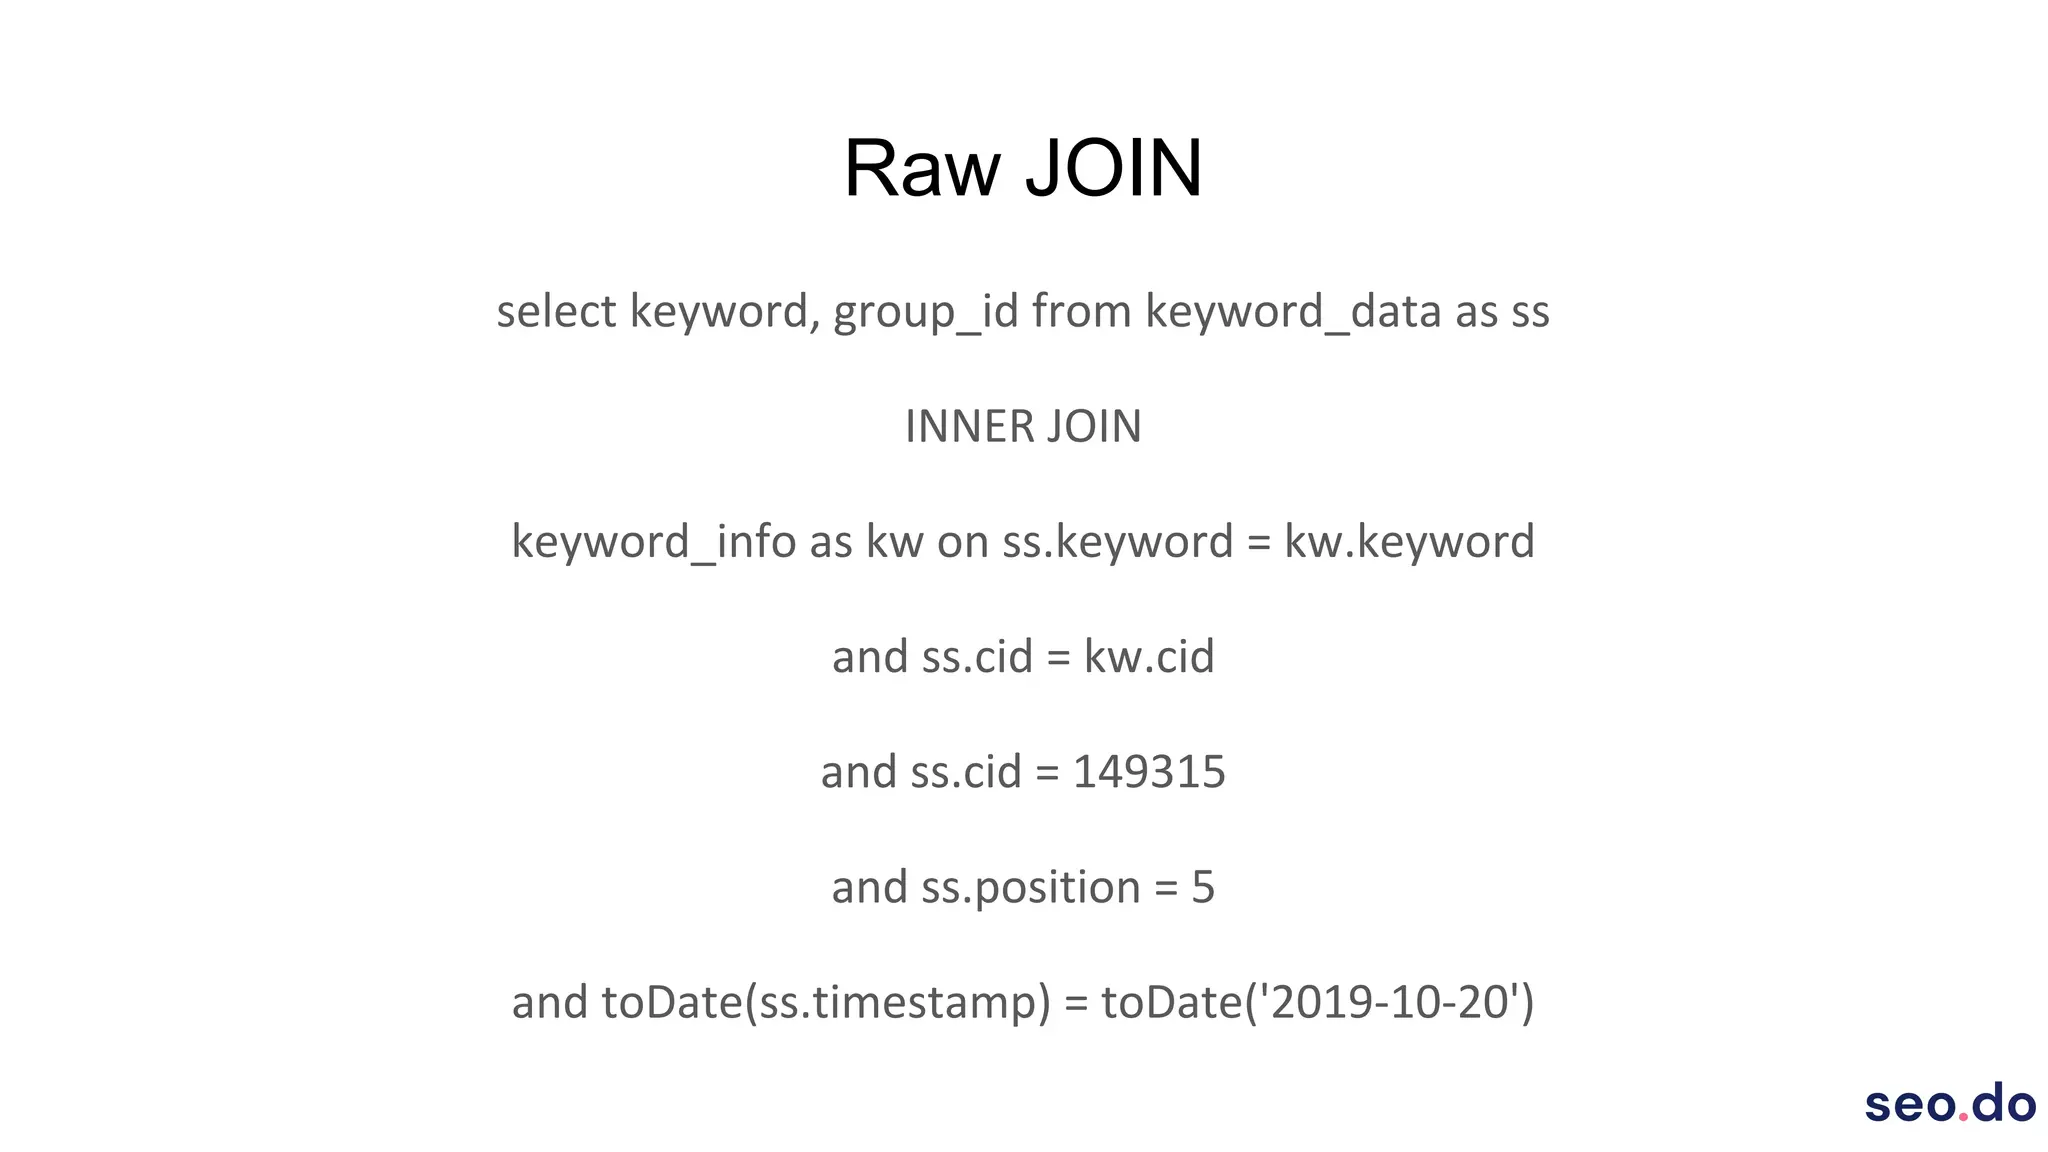
Our Story w/ Clickhouse @seo.do
Metehan Çetinkaya
What is seo.do?
What is seo.do?
Yandex Metrica for SEO professionals.
50.000 keywords
50.000 keywords
50.000 x 2 x 100 x 365
50.000 keywords
50.000 x 2 x 100 x 365
3.6 billion rows per client
How did our use case comply with ClickHouse?
● Continuous data insertion
○ Since there is no lock implementation in ClickHouse, inserting data to the database does not
affect query performance
● No updates / deletes necessary
○ We don't have a use case for UPDATE & DELETE operations, to delete obsolete data we
simply use PARTITION and it's operations
■ You can still update the data with using ALTER mutations
● Billions of rows to be processed
○ Time series data which will be aggregated constantly to create reports etc.
● SQL dialect close to Standard SQL
How did our use case comply with ClickHouse?
● Very handy built-in functions
○ avgIf, sumIf, countIf, order by if, date conversion functions (toWeek, toMonth etc.), splitByChar
■ ‘ SELECT fullName, age, avgIf(wage, age BETWEEN 18 and 25) as youthWageAvg
from people where country_id = 745261’
● High compression ratio
○ Compression ratio totally depends on the data and since our data is timeseries and there are
repeated strings, compression ratio for us is around 1:15
● Continuous development and great community
How did we design our table schemas?
Understanding ClickHouse Index Structure
● Index structure is not similar to traditional RDBMS's index structure, no
B+Tree, does not create unique constraint
● Data is physically sorted on disk
○ There is a background job to sort and merge the data and it will take place eventually
● Need to choose primary key / sorting key by considering query conditions
○ To keep the reads at minimum, need to consider all possible queries with conditions and then
choose the primary key
How did we design our table schemas?
What Did We Do?
● Created initial table schemas on single server by considering our data
structure and possible queries
● Inserted billions of dummy data which completely simulated our actual case
○ Since the data we will have is time series, we created the actual data for one day, and
replicate it for 180 days
● Wrote sample queries, few queries for each dimension we would query the
data
Refactoring The Schemas & Writing Queries
● Ran single query each time and checked the results
○ Tip : Use ' tail -f /var/log/clickhouse-server/clickhouse-server.log ' to see execution logs of the
query (Peak MEM Usage, Threads executed, Marks read) that was executed. Or simply add
'send_logs_level=trace' when connecting to the cli ' clickhouse-client --send_logs_level=trace '
● Refactored the table schemas or even created new table schemas with
considering query results
● After satisfying results, we executed bunch of load tests with the sample
queries
Using JOIN in ClickHouse
● Since ClickHouse’s compression ratio is very high, compromised from storage
to boost the performance
○ How so? Did not force the tables to be atomic, to keep the relations & JOINs at minimum, let
there be duplicated data. It’s a trade off.
● Tried to avoid JOINs however with our data structure it was not possible, so
we kept JOINs at minimum
● Avoided using raw JOINs all the time
● Used JOINs with subqueries
Raw JOIN
select keyword, group_id from keyword_data as ss
INNER JOIN
keyword_info as kw on ss.keyword = kw.keyword
and ss.cid = kw.cid
and ss.cid = 149315
and ss.position = 5
and toDate(ss.timestamp) = toDate('2019-10-20')
Raw JOIN
● Took 5 seconds to complete
○ Slow and keeping system resources busy for long (This is important because ClickHouse can
fully utilize system resources under load, average query response time will be high)
● Processed 369.74 million rows
● Executed the query with 8 threads
○ Executed the query on a server which had 16 cores. By default ClickHouse sets max_threads
setting to half the number of physical core count, so this query utilized all the cores available
to ClickHouse
● Peak Memory Usage : 90 Megabytes
JOIN With Sub Query
select keyword, group_id from
(select keyword from keyword_data PREWHERE position = 5 where cid = 149315
and toDate(timestamp) = '2019-10-20') as ss
INNER JOIN
(select keyword, group_id from keyword_info where cid = 149315) as kw
on ss.keyword = kw.keyword
JOIN With Sub Query
● Took 100 milliseconds
○ 50 times faster than raw join and releases resources quickly
● Processed 65.54 thousand rows
● Executed the query with 2 threads
○ Was able to execute the query with 6 less threads. It is very important for us to keep thread
count at minimum for each query since our QPS rate will be high. If we were to ignore this, we
would have to solve our performance problems with new replicas in the future which means
new servers and constant money spend
● Peak Memory Usage : 5 Megabytes
Creating ClickHouse Cluster
● Replication
○ High Availability
○ Load Scaling
● Sharding
○ Data size
○ Split data into smaller parts
Creating ClickHouse Cluster
● Created a cluster with 6 servers (2 shards and 3 replicas)
● Set up ZooKeeper with 3 additional servers
○ Since latency is a critical point for ZooKeeper and ClickHouse can utilize all available system
resources we don’t run ZooKeeper on the same server with ClickHouse (ZooKeeper Cluster
with 3 servers can handle failure of 1 server)
● Used Clickhouse's internal load balancer mechanism to distribute queries
over the replicas
○ HAProxy or CHProxy could be used as separate load balancer
Chaos Testing
● Cluster is set up & running
● Developed a dummy API which will execute random queries with Golang Gin
○ This is not a performance test so we just went with the fastest way for us
● Created a basic load test which will make requests to our Go API
continuously, with this way we will be able to monitor ClickHouse behavior
with failures
Without Data Loss
● Initiated the load test
● Killed the ClickHouse in a random node during the load test
○ We are actually trying to simulate ClickHouse failure & temporary server crash in this scenario
● Monitored ClickHouse's load balancer's behavior and system's load
● Restarted the ClickHouse in that server
○ Load test is still being executed in the meantime
What Happened?
● Since the ClickHouse Server in chosen shard was unreachable, ClickHouse
load balancer stopped making requests to that node
● Queries started to be distributed over the remaining 2 replicas
● After restarting the Clickhouse Server, chosen node did not get any requests
for another 10 minutes then it started to receive requests
○ Because ClickHouse load balancer distributes queries with considering error counts
○ Error count is halved each minute
○ Maximum error count is 1000 by default
With Data Loss
● Chose an another shard randomly
● This time we didn’t just kill the ClickHouse Server, we formatted disks as well.
● CH configuration lost, all the data is lost
● Chosen node is still in ZooKeeper config
● Reconfigured the server and Reinstalled the CH
● Copied metadata from a running replica
● Monitored ClickHouse behavior and system's load
What Happened?
● Like in the previous case, chosen node did not get any requests
● After configuration of the server is completed, replication took place
● Like in the other scenario, chosen node started getting requests after 10
minutes
Deciding the API Framework
● Developed API endpoints which execute sample queries with Flask, Golang
Gin and FastAPI
● Initiated the load tests for three of them separately (10K requests per minute,
ran for 20 minutes)
● Monitored the results
Deciding the API Framework
● Flask
○ Was not able to handle all the requests so after some time errors started to raise
○ Average response time was 3 seconds and %10 of the incoming requests resulted with errors
● Gin
○ Was able to handle all the requests without errors
○ Average response time was 350 milliseconds and there was no error at all
● FastAPI
○ Was able to handle all the requests without errors as well
○ Average response time was 300 milliseconds without errors

Our Story With ClickHouse at seo.do

  • 1.
    Our Story w/Clickhouse @seo.do Metehan Çetinkaya
  • 2.
  • 3.
    What is seo.do? YandexMetrica for SEO professionals.
  • 14.
  • 15.
  • 16.
    50.000 keywords 50.000 x2 x 100 x 365 3.6 billion rows per client
  • 17.
    How did ouruse case comply with ClickHouse? ● Continuous data insertion ○ Since there is no lock implementation in ClickHouse, inserting data to the database does not affect query performance ● No updates / deletes necessary ○ We don't have a use case for UPDATE & DELETE operations, to delete obsolete data we simply use PARTITION and it's operations ■ You can still update the data with using ALTER mutations ● Billions of rows to be processed ○ Time series data which will be aggregated constantly to create reports etc. ● SQL dialect close to Standard SQL
  • 18.
    How did ouruse case comply with ClickHouse? ● Very handy built-in functions ○ avgIf, sumIf, countIf, order by if, date conversion functions (toWeek, toMonth etc.), splitByChar ■ ‘ SELECT fullName, age, avgIf(wage, age BETWEEN 18 and 25) as youthWageAvg from people where country_id = 745261’ ● High compression ratio ○ Compression ratio totally depends on the data and since our data is timeseries and there are repeated strings, compression ratio for us is around 1:15 ● Continuous development and great community
  • 19.
    How did wedesign our table schemas? Understanding ClickHouse Index Structure ● Index structure is not similar to traditional RDBMS's index structure, no B+Tree, does not create unique constraint ● Data is physically sorted on disk ○ There is a background job to sort and merge the data and it will take place eventually ● Need to choose primary key / sorting key by considering query conditions ○ To keep the reads at minimum, need to consider all possible queries with conditions and then choose the primary key
  • 20.
    How did wedesign our table schemas? What Did We Do? ● Created initial table schemas on single server by considering our data structure and possible queries ● Inserted billions of dummy data which completely simulated our actual case ○ Since the data we will have is time series, we created the actual data for one day, and replicate it for 180 days ● Wrote sample queries, few queries for each dimension we would query the data
  • 21.
    Refactoring The Schemas& Writing Queries ● Ran single query each time and checked the results ○ Tip : Use ' tail -f /var/log/clickhouse-server/clickhouse-server.log ' to see execution logs of the query (Peak MEM Usage, Threads executed, Marks read) that was executed. Or simply add 'send_logs_level=trace' when connecting to the cli ' clickhouse-client --send_logs_level=trace ' ● Refactored the table schemas or even created new table schemas with considering query results ● After satisfying results, we executed bunch of load tests with the sample queries
  • 22.
    Using JOIN inClickHouse ● Since ClickHouse’s compression ratio is very high, compromised from storage to boost the performance ○ How so? Did not force the tables to be atomic, to keep the relations & JOINs at minimum, let there be duplicated data. It’s a trade off. ● Tried to avoid JOINs however with our data structure it was not possible, so we kept JOINs at minimum ● Avoided using raw JOINs all the time ● Used JOINs with subqueries
  • 23.
    Raw JOIN select keyword,group_id from keyword_data as ss INNER JOIN keyword_info as kw on ss.keyword = kw.keyword and ss.cid = kw.cid and ss.cid = 149315 and ss.position = 5 and toDate(ss.timestamp) = toDate('2019-10-20')
  • 24.
    Raw JOIN ● Took5 seconds to complete ○ Slow and keeping system resources busy for long (This is important because ClickHouse can fully utilize system resources under load, average query response time will be high) ● Processed 369.74 million rows ● Executed the query with 8 threads ○ Executed the query on a server which had 16 cores. By default ClickHouse sets max_threads setting to half the number of physical core count, so this query utilized all the cores available to ClickHouse ● Peak Memory Usage : 90 Megabytes
  • 25.
    JOIN With SubQuery select keyword, group_id from (select keyword from keyword_data PREWHERE position = 5 where cid = 149315 and toDate(timestamp) = '2019-10-20') as ss INNER JOIN (select keyword, group_id from keyword_info where cid = 149315) as kw on ss.keyword = kw.keyword
  • 26.
    JOIN With SubQuery ● Took 100 milliseconds ○ 50 times faster than raw join and releases resources quickly ● Processed 65.54 thousand rows ● Executed the query with 2 threads ○ Was able to execute the query with 6 less threads. It is very important for us to keep thread count at minimum for each query since our QPS rate will be high. If we were to ignore this, we would have to solve our performance problems with new replicas in the future which means new servers and constant money spend ● Peak Memory Usage : 5 Megabytes
  • 27.
    Creating ClickHouse Cluster ●Replication ○ High Availability ○ Load Scaling ● Sharding ○ Data size ○ Split data into smaller parts
  • 28.
    Creating ClickHouse Cluster ●Created a cluster with 6 servers (2 shards and 3 replicas) ● Set up ZooKeeper with 3 additional servers ○ Since latency is a critical point for ZooKeeper and ClickHouse can utilize all available system resources we don’t run ZooKeeper on the same server with ClickHouse (ZooKeeper Cluster with 3 servers can handle failure of 1 server) ● Used Clickhouse's internal load balancer mechanism to distribute queries over the replicas ○ HAProxy or CHProxy could be used as separate load balancer
  • 29.
    Chaos Testing ● Clusteris set up & running ● Developed a dummy API which will execute random queries with Golang Gin ○ This is not a performance test so we just went with the fastest way for us ● Created a basic load test which will make requests to our Go API continuously, with this way we will be able to monitor ClickHouse behavior with failures
  • 30.
    Without Data Loss ●Initiated the load test ● Killed the ClickHouse in a random node during the load test ○ We are actually trying to simulate ClickHouse failure & temporary server crash in this scenario ● Monitored ClickHouse's load balancer's behavior and system's load ● Restarted the ClickHouse in that server ○ Load test is still being executed in the meantime
  • 31.
    What Happened? ● Sincethe ClickHouse Server in chosen shard was unreachable, ClickHouse load balancer stopped making requests to that node ● Queries started to be distributed over the remaining 2 replicas ● After restarting the Clickhouse Server, chosen node did not get any requests for another 10 minutes then it started to receive requests ○ Because ClickHouse load balancer distributes queries with considering error counts ○ Error count is halved each minute ○ Maximum error count is 1000 by default
  • 32.
    With Data Loss ●Chose an another shard randomly ● This time we didn’t just kill the ClickHouse Server, we formatted disks as well. ● CH configuration lost, all the data is lost ● Chosen node is still in ZooKeeper config ● Reconfigured the server and Reinstalled the CH ● Copied metadata from a running replica ● Monitored ClickHouse behavior and system's load
  • 33.
    What Happened? ● Likein the previous case, chosen node did not get any requests ● After configuration of the server is completed, replication took place ● Like in the other scenario, chosen node started getting requests after 10 minutes
  • 34.
    Deciding the APIFramework ● Developed API endpoints which execute sample queries with Flask, Golang Gin and FastAPI ● Initiated the load tests for three of them separately (10K requests per minute, ran for 20 minutes) ● Monitored the results
  • 35.
    Deciding the APIFramework ● Flask ○ Was not able to handle all the requests so after some time errors started to raise ○ Average response time was 3 seconds and %10 of the incoming requests resulted with errors ● Gin ○ Was able to handle all the requests without errors ○ Average response time was 350 milliseconds and there was no error at all ● FastAPI ○ Was able to handle all the requests without errors as well ○ Average response time was 300 milliseconds without errors