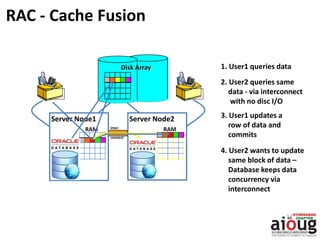
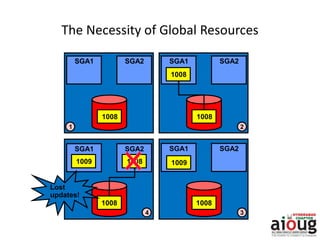
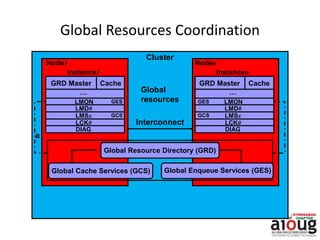
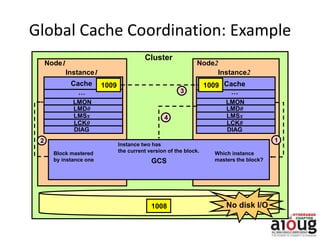
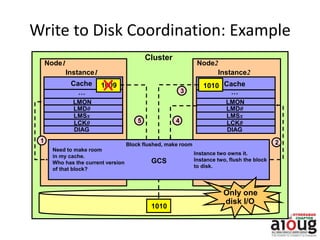
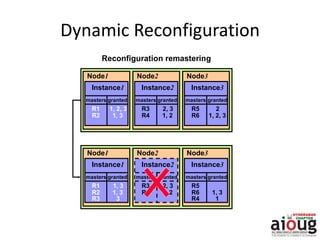
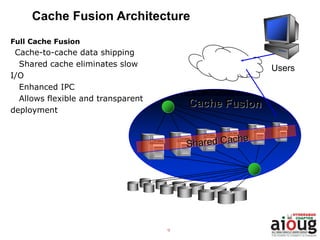
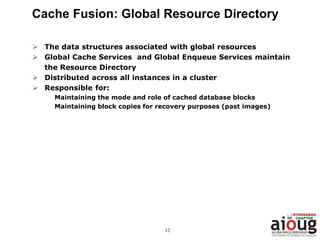
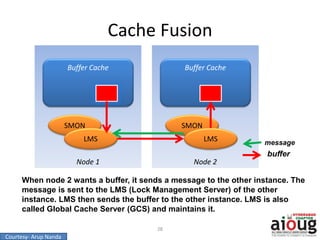
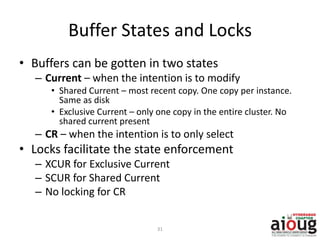
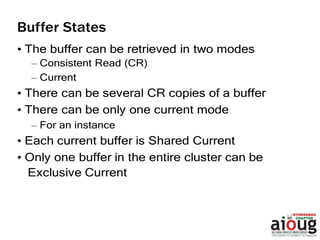
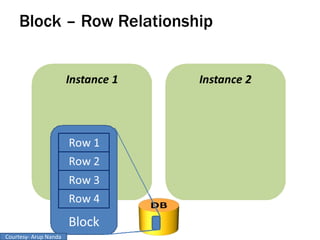
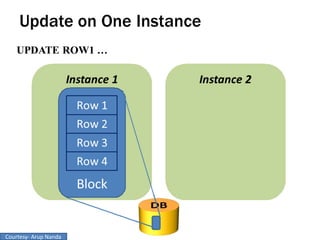
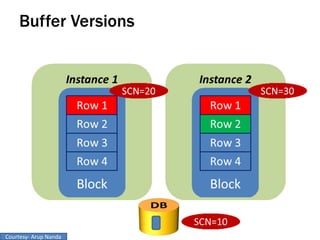
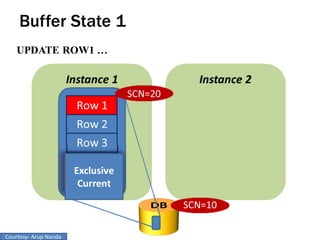
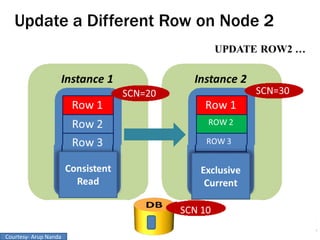
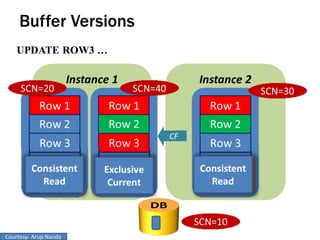
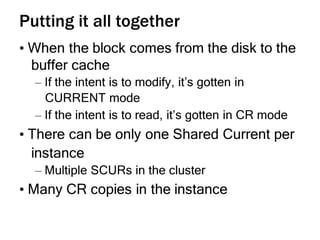
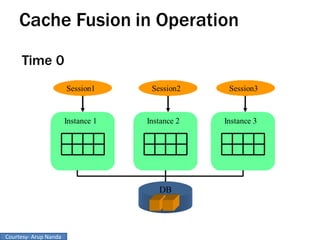
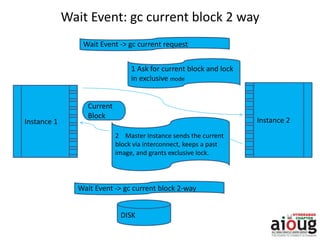
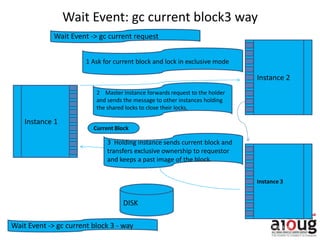
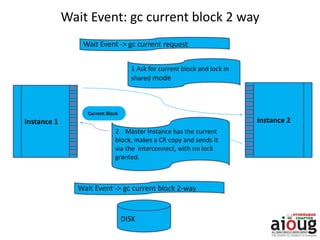
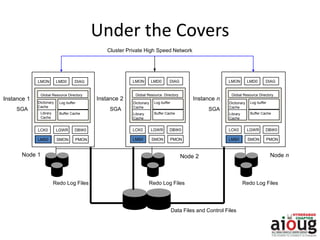
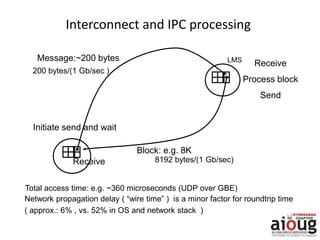
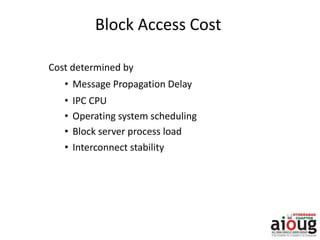
RAC Cache Fusion
History of RAC
 1977 – ARCnet developed by Data Point
 1980 – Digital Equipment Corporation(DEC) release VAX Cluster Product for VAX/VMS ( First
Commercial Launch)
 1988 – First Database to support clustering was launched with Oracle Version 6.0 for Digital Vax
operating system on nCUBE machine. Lock Manager by Oracle is not scalable
 1989 - Oracle 6.2 gave birth to Oracle Parallel Server (OPS) with Oracle’s DLM( Dynamic Lock
Manager) worked well with Digital VAX’s Clusters.
 1990 – Oracle 7.0 started using Vendor Clusterware where almost all UNIX vendors have started
clustering technology.
 1997 – Oracle 8 released along with Generic Lock Manager (OLM) integrated with Oracle Code
with an additional layer called Operating System Dependent (OSD)
 OLM integrated with Kernel and named as Integrated Distributed Lock Manger (IDLM) in later
versions.
 Oracle Real Application Clusters from Oracle 9i used the same IDLM and the story
continuous………
RAC - Cache Fusion
Server Node2
RAM
Disk Array 1. User1 queries data
2. User2 queries same
data - via interconnect
with no disc I/O
3. User1 updates a
row of data and
commits
4. User2 wants to update
same block of data –
Database keeps data
concurrency via
interconnect
inter
connect
RAM
Server Node1
The Necessity of Global Resources
1008
SGA1 SGA2
1008
SGA1 SGA2
1008
1008
SGA1 SGA2
1008
SGA1 SGA2
1009 1008 1009
Lost
updates!
1 2
34
Global Resources Coordination
a
LMON
LMD0
LMSx
DIAG
…
LCK0
CacheGRD Master
GES
GCS
LMON
LMD0
LMSx
DIAG
…
Cache
LCK0
GRD Master
GES
GCS
Node1
Instance1
Noden
Instancen
Cluster
Interconnect
Global
resources
Global Enqueue Services (GES)Global Cache Services (GCS)
Global Resource Directory (GRD)
Global Cache Coordination: Example
Node1
Instance1
Node2
Instance2
…
Cache
Cluster
1009
1008
12
3
GCS
4
No disk I/O
LMON
LMD0
LMSx
…
LCK0
Cache 1009
DIAG
LMON
LMD0
LMSx
LCK0
DIAG
Block mastered
by instance one
Which instance
masters the block?
Instance two has
the current version of the block.
Write to Disk Coordination: Example
Node1
Instance1
Node2
Instance2
Cache
Cluster
1010
1010
1
3
2
GCS
45
Only one
disk I/O
LMON
LMD0
LMSx
LCK0
DIAG
LMON
LMD0
LMSx
LCK0
DIAG
……
Cache 1009
Need to make room
in my cache.
Who has the current version
of that block?
Instance two owns it.
Instance two, flush the block
to disk.
Block flushed, make room
Dynamic Reconfiguration
Node1
Instance1
masters
R1
granted
R2 1, 3
1, 2, 3
Node2
Instance2
masters
R3
granted
R4 1, 2
2, 3
Node3
Instance3
masters
R5
granted
R6 1, 2, 3
2
Node1
Instance1
masters
R1
granted
R2 1, 3
1, 3
Node2
Instance2
masters
R3
granted
R4 1, 2
2, 3
Node3
Instance3
masters
R5
granted
R6 1, 3
R3 3 R4 1
Reconfiguration remastering
9
Cache Fusion Architecture
Full Cache Fusion
Cache-to-cache data shipping
Shared cache eliminates slow
I/O
Enhanced IPC
Allows flexible and transparent
deployment
Users
10
Cache Fusion: Inter Instance Block Requests
Readers and writers
accessing instance A
gain access to blocks in
instance B’s buffer
cache
All types of block
contention and access
Coordination by Global
Cache/Enqueue
Services
Read
Request
for Block
Cache A
Read
Write
Write
Lock Status
Block in
Cache B
Read
Read
Write
Write
11
Cache Fusion Details: GES & GCS
Global Enqueue Service (GES)
 Co-ordinates the requests of all global enqueue (any non-buffer
cache resources)
 Deadlock detection and Timeout of requests
 Manages resource caching/cleanup
Global Cache Service (GCS)
 Guarantees cache coherency
 Manages caching of shared data via Cache Fusion
 Minimizes access time to data which is not in local cache and
would otherwise be read from disk or rolled back
 Implements fast direct memory access over high-speed
interconnects for all data blocks and types
 Uses an efficient and scalable messaging protocol
 Maintains block mode for blocks with Global role
 Responsible for block transfers between instances
12
Cache Fusion: Global Resource Directory
 The data structures associated with global resources
 Global Cache Services and Global Enqueue Services maintain
the Resource Directory
 Distributed across all instances in a cluster
 Responsible for:
Maintaining the mode and role of cached database blocks
Maintaining block copies for recovery purposes (past images)
13
Cache Fusion Details: Instance Processes
Role of LMON:
Check for instance transition
Reconfiguration
Cleaning up of Cached Enqueue Resources
Role of LMD:
Receive and Process GES messages
Deadlock Detection and Request Timeout
Role of LMSn (0-9) – Higher in 11g and 12c
Receive and Process GCS messages
Buffer Cache Operations & Transfers
14
Cache Fusion Details: Resource Modes
3 Resource Modes for global cache resources
(cached database blocks)
S – shared – used for blocks read into cache – any number of instances can
hold blocks in S mode
X – exclusive – used for blocks updated in cache – only 1 instance can have a
block with X mode
N – null – used for blocks not currently in cache
15
Cache Fusion Details: Resource Roles
2 Resource Roles for global cache resources
L – local – block can be manipulated by instance without further global requests
Block can be held in X, S, or Null mode
Block can be served to other instances
G – global – block manipulation needs further instance coordination
Blocks can be dirty on many nodes
Instances can use a global status for consistent read when held in X mode
by another instance
16
Cache Fusion Details: Past Images
 Only applicable to blocks with the Global Resource
roles
 Copy of dirty block when the block is transferred to
another instance
 Used for recovery purposes if necessary
 Maintained until it, or later version is written to disk
The past image concept was introduced in the RAC version of Oracle 9i to
maintain data integrity. In an Oracle database, a typical data block is not
written to the disk immediately, even after it is dirtied. When the same
dirty data block is requested by another instance for write or read
purposes, an image of the block is created at the owning instance, and
only that block is shipped to the requesting instance. This backup image
of the block is called the past image (PI) and is kept in memory. In the
event of failure, Oracle can reconstruct the current version of the block
by reading PIs. It is also possible to have more than one past image in the
memory depending on how many times the data block was requested in
the dirty stage
Cache Fusion Details: Past Images
Buffer States and Locks
• Buffers can be gotten in two states
– Current – when the intention is to modify
• Shared Current – most recent copy. One copy per instance.
Same as disk
• Exclusive Current – only one copy in the entire cluster. No
shared current present
– CR – when the intention is to only select
• Locks facilitate the state enforcement
– XCUR for Exclusive Current
– SCUR for Shared Current
– No locking for CR
18 Wait Events in RAC
Mode/Role Local Global
Null : N NL NG
Shared : S SL SG
Exclusive :X XL XG
Local
SL – When an instance has a resource in SL form, it can serve a copy of the block to other
instances.
XL– When an instance has a resource in XL form, it has sole ownership . It has exclusive
lock to modify the block. All changes to the blocks are in its local buffer cache. If another
instance wants the block, the other instance will contact the instance via GCS.
NL – A NL form is used to protect Consistent Read block, If a block held in SL mode and
other instance wants in X mode, the current instance will send the block to the requesting
instance and downgrade its role to NL
Mode/Role Local Global
Null : N NL NG
Shared : S SL SG
Exclusive :X XL XG
Global
SG – In SG Form the block is present in one or more instances. An instance can read the
block form disk and serve it to other instances.
XG – In XG form, a block can have one or more PI’s, indicating multiple copies of the block
in several instances' buffer cache. The instance with the XG role has the latest copy of the
block and is the most likely candidate to write to the block to disk. GCS can ask the
instance with the XG role to write the block to disk or to server it to another instance.
NG – After discarding the PI’s when instructed by GCS, the block is kept in the buffer
cache with NG role. This serves only as the CR copy of the block.
LOCK MODE DESCRIPTION
NL0 Null Local and No past Images
SL0 Shared Local with no past image
XL0 Exclusive Local with no past image
NG0 Null Global – Instance owns current block image
SG0 Global Shared Lock – Instance owns current image
XG0 Global Exclusive Lock – Instance own current image
NG1 Global Null – Instance Owns the Past Image Block.
SG1 Shared Global – Instance owns past Image
XG1 Global Exclusive Lock – Instance owns Past Image.
There are 3 characters that distinguish lock or block access modes. The first letter
represents the lock mode, the second character represents the lock role, and the third
character (a number) indicates any past images for the lock in the local instance.
Node 1
Cluster Coordination
22
Buffer Cache Buffer Cache
DBWR DBWR
LMS LMS
SCN1
DBWR must get a lock on the database block before
writing to the disk. This is called a Block Lock.
Node 2
Database
SCN2
Checkpoint!
Checkpoint!
Courtesy- Arup Nanda
Checking for Buffers
How exactly is this “check”
performed?
• By checking for a lock on the block
• The request comes to the Grant
Queue of the block
• GCS checks that no other instance
has any lock
• Instance 1 can read from the disk
• i.e. Instance 1 is granted the lock
25
Block
SID1
SID2
SID3
Grant
Queue
Convert
Queue
SID5
SID6
SID7
Wait Events in RAC
Courtesy- Arup Nanda
Master Instance
• Only one instance holds the grant and
convert queues of a specific block
• This instance is called Master Instance of that
block
• Master instance varies for each block
• The memory structure that shows the master
instance of a buffer is called Global Resource
Directory (GRD)
• That is replicated across all instances
• The requesting instance must check the GRD
to find the master instance
• Then make a request to the master instance
for the lock
26
Block
SID1
SID2
SID3
Grant
Queue
Convert
Queue
SID5
SID6
SID7
Courtesy- Arup Nanda
Scenario 1
• Session connected to Instance 1 wants to select a block from
the table
• Activities by Instance 1
1. Check its own buffer cache to see if the block exists
1. If it is found, can it just use it?
2. If it not found, can it select from the disk?
2. If not, then check the other instances
• How will it know which copy of the block is the best source?
27
Instance 1 Instance 2
Session
Courtesy- Arup Nanda
Node 2Node 1
Cache Fusion
28
Buffer Cache Buffer Cache
SMON SMON
LMS LMS
When node 2 wants a buffer, it sends a message to the other instance. The
message is sent to the LMS (Lock Management Server) of the other
instance. LMS then sends the buffer to the other instance. LMS is also
called Global Cache Server (GCS) and maintains it.
message
buffer
Courtesy- Arup Nanda
Grant Scenario 2
1. Check its buffer cache to see if the block exists
2. And the buffer is found. Can Instance1 use it?
Not really. The buffer may be old; it may have been changed
3. LMS of node1 sends message to master of the buffer
3. Master checks the GES and doesn’t sees any lock
4. Instance 1 is granted the global block lock
5. No buffer actually gets transferred
29
Grant Scenario 3
• Instance 1 is the master
– Then it doesn’t have to make a request for the grant
• In summary, here are the possible scenarios when Instance1
requests a buffer
– Instance1 is the master; so no more processing is required
– No one has the lock on the buffer, the grant is made by the
master immediately
– Another instance has the buffer in an incompatible mode.
It has to be changed.
30
Buffer States and Locks
• Buffers can be gotten in two states
– Current – when the intention is to modify
• Shared Current – most recent copy. One copy per instance.
Same as disk
• Exclusive Current – only one copy in the entire cluster. No
shared current present
– CR – when the intention is to only select
• Locks facilitate the state enforcement
– XCUR for Exclusive Current
– SCUR for Shared Current
– No locking for CR
31
Courtesy- Arup Nanda
Wait Event: gc current block 2 way
DISK
Wait Event -> gc current block 2-way
Instance 1 Instance 2
2 Master Instance sends the current
block via interconnect, keeps a past
image, and grants exclusive lock.
1 Ask for current block and lock
in exclusive mode
Wait Event -> gc current request
Requesting Instance Master Instance
Current
Block
DISK
Wait Event -> gc current block 3 - way
Instance 1
Instance 2
2 Master Instance forwards request to the holder
and sends the message to other instances holding
the shared locks to close their locks.
1 Ask for current block and lock in exclusive mode
Wait Event -> gc current request
Requesting Instance
Holding Instance
Instance 3
3 Holding instance sends current block and
transfers exclusive ownership to requestor
and keeps a past image of the block.
Current Block
Wait Event: gc current block3 way
Master Instance
Wait Event: gc current block 2 way
DISK
Wait Event -> gc current block 2-way
Instance 1 Instance 2
2 Master Instance has the current
block, makes a CR copy and sends it
via the interconnect, with no lock
granted.
1 Ask for current block and lock in
shared mode
Wait Event -> gc current request
Requesting Instance Master Instance
Current Block
DISK
Wait Event -> gc current block 3 - way
Instance 1
Instance 2
2 Master Instance forwards request
to the holder no lock granted.
1 Ask for current block and lock in share mode
Wait Event -> gc current request
Requesting Instance
Holding Instance
Instance 3
3 Holding instance makes a CR copy and
forwards it to the requestor.
Current Block
Wait Event: gc current block3 way
Master Instance
Under the Covers
Redo Log Files
Node nNode 2
Data Files and Control Files
Redo Log Files Redo Log Files
Dictionary
Cache
Log buffer
LCK0 LGWR DBW0
SMON PMON
Library
Cache
Global Resource Directory
LMS0
Instance 2
SGA
Instance n
Cluster Private High Speed Network
Buffer Cache
LMON LMD0 DIAG
Dictionary
Cache
Log buffer
LCK0 LGWR DBW0
SMON PMON
Library
Cache
Global Resource Directory
LMS0
Buffer Cache
LMON LMD0 DIAG
Dictionary
Cache
Log buffer
LCK0 LGWR DBW0
SMON PMON
Library
Cache
Global Resource Directory
LMS0
Buffer Cache
LMON LMD0 DIAG
Instance 1
Node 1
SGA SGA
Interconnect and IPC processing
Message:~200 bytes
Block: e.g. 8K
LMS
Initiate send and wait
Receive
Process block
Send
Receive
200 bytes/(1 Gb/sec )
8192 bytes/(1 Gb/sec)
Total access time: e.g. ~360 microseconds (UDP over GBE)
Network propagation delay ( “wire time” ) is a minor factor for roundtrip time
( approx.: 6% , vs. 52% in OS and network stack )
Block Access Cost
Cost determined by
• Message Propagation Delay
• IPC CPU
• Operating system scheduling
• Block server process load
• Interconnect stability
Block Access Latency
• Defined as roundtrip time
• Latency variation (and CPU cost ) correlates
with
• processing time in Oracle and OS kernel
• db_block_size
• interconnect saturation
• load on node ( CPU starvation )
• ~300 microseconds is lowest measured with
UDP over Gigabit Ethernet and 2K blocks
• ~ 120 microseconds is lowest measured with
RDS over Infiniband and 2K blocks
Infrastructure: Private Interconnect
• Network between the nodes of a RAC cluster
MUST be private
• Supported links: GbE, IB ( IPoIB: 10.2 )
• Supported transport protocols: UDP, RDS
(10.2.0.3 and above)
• Use multiple or dual-ported NICs for
redundancy and increase bandwidth with NIC
bonding
• Large ( Jumbo ) Frames for GbE recommended
Infrastructure: Interconnect Bandwidth
• Bandwidth requirements depend on
– CPU power per cluster node
– Application-driven data access frequency
– Number of nodes and size of the working set
– Data distribution between PQ slaves
• Typical utilization approx. 10-30% in OLTP
– 10000-12000 8K blocks per sec to saturate 1 x Gb
Ethernet ( 75-80% of theoretical bandwidth )
• Multiple NICs generally not required for
performance and scalability
Common Problems and Symptoms
Misconfigured or Faulty Interconnect Can Cause:
• Dropped packets/fragments
• Buffer overflows
• Packet reassembly failures or timeouts
• Ethernet Flow control kicks in
• TX/RX errors
“lost blocks” at the RDBMS level, responsible for
64% of escalations
“Lost Blocks”: NIC Receive Errors
Db_block_size = 8K
ifconfig –a:
eth0 Link encap:Ethernet HWaddr 00:0B:DB:4B:A2:04
inet addr:130.35.25.110 Bcast:130.35.27.255 Mask:255.255.252.0
UP BROADCAST RUNNING MULTICAST MTU:1500 Metric:1
RX packets:21721236 errors:135 dropped:0 overruns:0 frame:95
TX packets:273120 errors:0 dropped:0 overruns:0 carrier:0
…
“Lost Blocks”: IP Packet Reassembly Failures
netstat –s
Ip:
84884742 total packets received
…
1201 fragments dropped after timeout
…
3384 packet reassembles failed
Top 5 Timed Events Avg %Total
~~~~~~~~~~~~~~~~~~ wait Call
Event Waits Time(s)(ms) Time Wait Class
----------------------------------------------------------------------------------------------------
log file sync 286,038 49,872 174 41.7 Commit
gc buffer busy 177,315 29,021 164 24.3 Cluster
gc cr block busy 110,348 5,703 52 4.8 Cluster
gc cr block lost 4,272 4,953 1159 4.1 Cluster
cr request retry 6,316 4,668 739 3.9 Other
Finding a Problem with the
Interconnect or IPC
Should never be here
CPU Saturation or Memory Depletion
Top 5 Timed Events Avg %Total
~~~~~~~~~~~~~~~~~~ wait Call
Event Waits Time(s)(ms) Time Wait Class
----------------- --------- ------- ---- ----- ----------
db file sequential 1,312,840 21,590 16 21.8 User I/O
read
gc current block 275,004 21,054 77 21.3 Cluster
congested
gc cr grant congested 177,044 13,495 76 13.6 Cluster
gc current block 1,192,113 9,931 8 10.0 Cluster
2-way
gc cr block congested 85,975 8,917 104 9.0 Cluster
“Congested”: LMS could not de-queue messages fast enough
Cause : Long run queues and paging on the cluster nodes
Health Check
Look for:
• High impact of “lost blocks” , e.g.
gc cr block lost 1159 ms
• IO capacity saturation , e.g.
gc cr block busy 52 ms
• Overload and memory depletion, e.g
gc current block congested 14 ms
All events with these tags are potential issue, if their % of db time is significant.
Compare with the lowest measured latency
( target , c.f. SESSION HISTORY reports or SESSION HISTOGRAM view )
Application and Database Design
General Principles
• No fundamentally different design and coding
practices for RAC
• Badly tuned SQL and schema will not run
better
• Serializing contention makes applications less
scalable
• Standard SQL and schema tuning solves > 80%
of performance problems
Scalability Pitfalls
• Serializing contention on a small set of
data/index blocks
– monotonically increasing key
– frequent updates of small cached tables
– segment without ASSM or Free List Group (FLG)
• Full table scans
• Frequent hard parsing
• Concurrent DDL ( e.g. truncate/drop )
Index Block Contention: Optimal Design
• Monotonically increasing sequence
numbers
– Randomize or cache
– Large ORACLE sequence number caches
• Hash or range partitioning
– Local indexes
Data Block Contention: Optimal Design
• Small tables with high row density and
frequent updates and reads can become
“globally hot” with serialization e.g.
– Queue tables
– session/job status tables
– last trade lookup tables
• Higher PCTFREE for table reduces # of rows per
block
Large Contiguous Scans
• Query Tuning
• Use parallel execution
– Intra- or inter instance parallelism
– Direct reads
– GCS messaging minimal
Event Statistics to Drive Analysis
• Global cache (“gc” ) events and statistics
• Indicate that Oracle searches the cache hierarchy to find
data fast
• as “normal” as an IO ( e.g. db file sequential read )
• GC events tagged as “busy” or “congested” consuming
a significant amount of database time should be
investigated
• At first, assume a load or IO problem on one or several of
the cluster nodes
Global Cache Event Semantics
All Global Cache Events will follow the following format:
GC …
• CR, current
– Buffer requests and received for read or write
• block, grant
– Received block or grant to read from disk
• 2-way, 3-way
– Immediate response to remote request after N-hops
• busy
– Block or grant was held up because of contention
• congested
– Block or grant was delayed because LMS was busy or could
not get the CPU
“Normal” Global Cache Access
Statistics
Top 5 Timed Events Avg %Total
~~~~~~~~~~~~~~~~~~ wait Call
Event Waits Time(s) (ms) Time Wait Class
-------------- -------- --------- ---- ---- ----------
CPU time 4,580 65.4
log file sync 276,281 1,501 5 21.4 Commit
log file parallel 298,045 923 3 13.2 System I/O
write
gc current block 605,628 631 1 9.0 Cluster
3-way
gc cr block 3-way 514,218 533 1 7.6 Cluster
Reads from remote cache instead of disk Avg latency is 1 ms or less
Top 5 Timed Events Avg %Total
~~~~~~~~~~~~~~~~~~ wait Call
Event Waits Time(s) (ms) Time Wait Class
------------------------------ ------------ -----------
log file sync 286,038 49,872 174 41.7 Commit
gc buffer busy 177,315 29,021 164 24.3 Cluster
gc cr block busy 110,348 5,703 52 4.8 Cluster
“Abnormal” Global Cache Statistics
“busy” indicates contention
Avg time is too high
Drill-down: An IO capacity problem
Symptom of Full Table Scans
IO contention
Top 5 Timed Events Avg %Total
wait Call
Event Waits Time(s) (ms) Time Wait Class
---------------- -------- ------- ---- ---- ----------
db file scattered read 3,747,683 368,301 98 33.3 User I/O
gc buffer busy 3,376,228 233,632 69 21.1 Cluster
db file parallel read 1,552,284 225,218 145 20.4 User I/O
gc cr multi block 35,588,800 101,888 3 9.2 Cluster
request
read by other session 1,263,599 82,915 66 7.5 User I/O
Drill-down: SQL Statements
“Culprit”: Query that overwhelms IO subsystem on one node
Physical Reads Executions per Exec %Total
-------------- ----------- ------------- ------
182,977,469 1,055 173,438.4 99.3
SELECT SHELL FROM ES_SHELL WHERE MSG_ID = :msg_id ORDER BY
ORDER_NO ASC
The same query reads from the interconnect:
Cluster CWT % of CPU
Wait Time (s) Elapsd Tim Time(s) Executions
------------- ---------- ----------- --------------
341,080.54 31.2 17,495.38 1,055
SELECT SHELL FROM ES_SHELL WHERE MSG_ID = :msg_id ORDER BY
ORDER_NO ASC
GC
Tablespace Subobject Obj. Buffer % of
Name Object Name Name Type Busy Capture
---------- -------------------- ---------- ----- ------------ -------
ESSMLTBL ES_SHELL SYS_P537 TABLE 311,966 9.91
ESSMLTBL ES_SHELL SYS_P538 TABLE 277,035 8.80
ESSMLTBL ES_SHELL SYS_P527 TABLE 239,294 7.60
…
Drill-Down: Top Segments
Apart from being the table with the highest IO demand
it was the table with the highest number of block transfers
AND global serialization
Summary: Practical Performance Analysis
Diagnostics Flow
• Start with simple validations :
– Private Interconnect used ?
– Lost blocks and failures ?
– Load and load distribution issues ?
• Check avg latencies, busy, congested events and
their significance
• Check OS statistics ( CPU, disk , virtual memory )
• Identify SQL and Segments
MOST OF THE TIME, A PERFORMANCE PROBLEM IS NOT A
RAC PROBLEM
Actions
– Interconnect issues must be fixed first
– If IO wait time is dominant , fix IO issues
• At this point, performance may already be good
– Fix “bad” plans
– Fix serialization
– Fix schema
Thank You

Oracle rac cachefusion - High Availability Day 2015

  • 1.
  • 2.
    History of RAC 1977 – ARCnet developed by Data Point  1980 – Digital Equipment Corporation(DEC) release VAX Cluster Product for VAX/VMS ( First Commercial Launch)  1988 – First Database to support clustering was launched with Oracle Version 6.0 for Digital Vax operating system on nCUBE machine. Lock Manager by Oracle is not scalable  1989 - Oracle 6.2 gave birth to Oracle Parallel Server (OPS) with Oracle’s DLM( Dynamic Lock Manager) worked well with Digital VAX’s Clusters.  1990 – Oracle 7.0 started using Vendor Clusterware where almost all UNIX vendors have started clustering technology.  1997 – Oracle 8 released along with Generic Lock Manager (OLM) integrated with Oracle Code with an additional layer called Operating System Dependent (OSD)  OLM integrated with Kernel and named as Integrated Distributed Lock Manger (IDLM) in later versions.  Oracle Real Application Clusters from Oracle 9i used the same IDLM and the story continuous………
  • 3.
    RAC - CacheFusion Server Node2 RAM Disk Array 1. User1 queries data 2. User2 queries same data - via interconnect with no disc I/O 3. User1 updates a row of data and commits 4. User2 wants to update same block of data – Database keeps data concurrency via interconnect inter connect RAM Server Node1
  • 4.
    The Necessity ofGlobal Resources 1008 SGA1 SGA2 1008 SGA1 SGA2 1008 1008 SGA1 SGA2 1008 SGA1 SGA2 1009 1008 1009 Lost updates! 1 2 34
  • 5.
    Global Resources Coordination a LMON LMD0 LMSx DIAG … LCK0 CacheGRDMaster GES GCS LMON LMD0 LMSx DIAG … Cache LCK0 GRD Master GES GCS Node1 Instance1 Noden Instancen Cluster Interconnect Global resources Global Enqueue Services (GES)Global Cache Services (GCS) Global Resource Directory (GRD)
  • 6.
    Global Cache Coordination:Example Node1 Instance1 Node2 Instance2 … Cache Cluster 1009 1008 12 3 GCS 4 No disk I/O LMON LMD0 LMSx … LCK0 Cache 1009 DIAG LMON LMD0 LMSx LCK0 DIAG Block mastered by instance one Which instance masters the block? Instance two has the current version of the block.
  • 7.
    Write to DiskCoordination: Example Node1 Instance1 Node2 Instance2 Cache Cluster 1010 1010 1 3 2 GCS 45 Only one disk I/O LMON LMD0 LMSx LCK0 DIAG LMON LMD0 LMSx LCK0 DIAG …… Cache 1009 Need to make room in my cache. Who has the current version of that block? Instance two owns it. Instance two, flush the block to disk. Block flushed, make room
  • 8.
    Dynamic Reconfiguration Node1 Instance1 masters R1 granted R2 1,3 1, 2, 3 Node2 Instance2 masters R3 granted R4 1, 2 2, 3 Node3 Instance3 masters R5 granted R6 1, 2, 3 2 Node1 Instance1 masters R1 granted R2 1, 3 1, 3 Node2 Instance2 masters R3 granted R4 1, 2 2, 3 Node3 Instance3 masters R5 granted R6 1, 3 R3 3 R4 1 Reconfiguration remastering
  • 9.
    9 Cache Fusion Architecture FullCache Fusion Cache-to-cache data shipping Shared cache eliminates slow I/O Enhanced IPC Allows flexible and transparent deployment Users
  • 10.
    10 Cache Fusion: InterInstance Block Requests Readers and writers accessing instance A gain access to blocks in instance B’s buffer cache All types of block contention and access Coordination by Global Cache/Enqueue Services Read Request for Block Cache A Read Write Write Lock Status Block in Cache B Read Read Write Write
  • 11.
    11 Cache Fusion Details:GES & GCS Global Enqueue Service (GES)  Co-ordinates the requests of all global enqueue (any non-buffer cache resources)  Deadlock detection and Timeout of requests  Manages resource caching/cleanup Global Cache Service (GCS)  Guarantees cache coherency  Manages caching of shared data via Cache Fusion  Minimizes access time to data which is not in local cache and would otherwise be read from disk or rolled back  Implements fast direct memory access over high-speed interconnects for all data blocks and types  Uses an efficient and scalable messaging protocol  Maintains block mode for blocks with Global role  Responsible for block transfers between instances
  • 12.
    12 Cache Fusion: GlobalResource Directory  The data structures associated with global resources  Global Cache Services and Global Enqueue Services maintain the Resource Directory  Distributed across all instances in a cluster  Responsible for: Maintaining the mode and role of cached database blocks Maintaining block copies for recovery purposes (past images)
  • 13.
    13 Cache Fusion Details:Instance Processes Role of LMON: Check for instance transition Reconfiguration Cleaning up of Cached Enqueue Resources Role of LMD: Receive and Process GES messages Deadlock Detection and Request Timeout Role of LMSn (0-9) – Higher in 11g and 12c Receive and Process GCS messages Buffer Cache Operations & Transfers
  • 14.
    14 Cache Fusion Details:Resource Modes 3 Resource Modes for global cache resources (cached database blocks) S – shared – used for blocks read into cache – any number of instances can hold blocks in S mode X – exclusive – used for blocks updated in cache – only 1 instance can have a block with X mode N – null – used for blocks not currently in cache
  • 15.
    15 Cache Fusion Details:Resource Roles 2 Resource Roles for global cache resources L – local – block can be manipulated by instance without further global requests Block can be held in X, S, or Null mode Block can be served to other instances G – global – block manipulation needs further instance coordination Blocks can be dirty on many nodes Instances can use a global status for consistent read when held in X mode by another instance
  • 16.
    16 Cache Fusion Details:Past Images  Only applicable to blocks with the Global Resource roles  Copy of dirty block when the block is transferred to another instance  Used for recovery purposes if necessary  Maintained until it, or later version is written to disk
  • 17.
    The past imageconcept was introduced in the RAC version of Oracle 9i to maintain data integrity. In an Oracle database, a typical data block is not written to the disk immediately, even after it is dirtied. When the same dirty data block is requested by another instance for write or read purposes, an image of the block is created at the owning instance, and only that block is shipped to the requesting instance. This backup image of the block is called the past image (PI) and is kept in memory. In the event of failure, Oracle can reconstruct the current version of the block by reading PIs. It is also possible to have more than one past image in the memory depending on how many times the data block was requested in the dirty stage Cache Fusion Details: Past Images
  • 18.
    Buffer States andLocks • Buffers can be gotten in two states – Current – when the intention is to modify • Shared Current – most recent copy. One copy per instance. Same as disk • Exclusive Current – only one copy in the entire cluster. No shared current present – CR – when the intention is to only select • Locks facilitate the state enforcement – XCUR for Exclusive Current – SCUR for Shared Current – No locking for CR 18 Wait Events in RAC
  • 19.
    Mode/Role Local Global Null: N NL NG Shared : S SL SG Exclusive :X XL XG Local SL – When an instance has a resource in SL form, it can serve a copy of the block to other instances. XL– When an instance has a resource in XL form, it has sole ownership . It has exclusive lock to modify the block. All changes to the blocks are in its local buffer cache. If another instance wants the block, the other instance will contact the instance via GCS. NL – A NL form is used to protect Consistent Read block, If a block held in SL mode and other instance wants in X mode, the current instance will send the block to the requesting instance and downgrade its role to NL
  • 20.
    Mode/Role Local Global Null: N NL NG Shared : S SL SG Exclusive :X XL XG Global SG – In SG Form the block is present in one or more instances. An instance can read the block form disk and serve it to other instances. XG – In XG form, a block can have one or more PI’s, indicating multiple copies of the block in several instances' buffer cache. The instance with the XG role has the latest copy of the block and is the most likely candidate to write to the block to disk. GCS can ask the instance with the XG role to write the block to disk or to server it to another instance. NG – After discarding the PI’s when instructed by GCS, the block is kept in the buffer cache with NG role. This serves only as the CR copy of the block.
  • 21.
    LOCK MODE DESCRIPTION NL0Null Local and No past Images SL0 Shared Local with no past image XL0 Exclusive Local with no past image NG0 Null Global – Instance owns current block image SG0 Global Shared Lock – Instance owns current image XG0 Global Exclusive Lock – Instance own current image NG1 Global Null – Instance Owns the Past Image Block. SG1 Shared Global – Instance owns past Image XG1 Global Exclusive Lock – Instance owns Past Image. There are 3 characters that distinguish lock or block access modes. The first letter represents the lock mode, the second character represents the lock role, and the third character (a number) indicates any past images for the lock in the local instance.
  • 22.
    Node 1 Cluster Coordination 22 BufferCache Buffer Cache DBWR DBWR LMS LMS SCN1 DBWR must get a lock on the database block before writing to the disk. This is called a Block Lock. Node 2 Database SCN2 Checkpoint! Checkpoint! Courtesy- Arup Nanda
  • 23.
  • 25.
    Checking for Buffers Howexactly is this “check” performed? • By checking for a lock on the block • The request comes to the Grant Queue of the block • GCS checks that no other instance has any lock • Instance 1 can read from the disk • i.e. Instance 1 is granted the lock 25 Block SID1 SID2 SID3 Grant Queue Convert Queue SID5 SID6 SID7 Wait Events in RAC Courtesy- Arup Nanda
  • 26.
    Master Instance • Onlyone instance holds the grant and convert queues of a specific block • This instance is called Master Instance of that block • Master instance varies for each block • The memory structure that shows the master instance of a buffer is called Global Resource Directory (GRD) • That is replicated across all instances • The requesting instance must check the GRD to find the master instance • Then make a request to the master instance for the lock 26 Block SID1 SID2 SID3 Grant Queue Convert Queue SID5 SID6 SID7 Courtesy- Arup Nanda
  • 27.
    Scenario 1 • Sessionconnected to Instance 1 wants to select a block from the table • Activities by Instance 1 1. Check its own buffer cache to see if the block exists 1. If it is found, can it just use it? 2. If it not found, can it select from the disk? 2. If not, then check the other instances • How will it know which copy of the block is the best source? 27 Instance 1 Instance 2 Session Courtesy- Arup Nanda
  • 28.
    Node 2Node 1 CacheFusion 28 Buffer Cache Buffer Cache SMON SMON LMS LMS When node 2 wants a buffer, it sends a message to the other instance. The message is sent to the LMS (Lock Management Server) of the other instance. LMS then sends the buffer to the other instance. LMS is also called Global Cache Server (GCS) and maintains it. message buffer Courtesy- Arup Nanda
  • 29.
    Grant Scenario 2 1.Check its buffer cache to see if the block exists 2. And the buffer is found. Can Instance1 use it? Not really. The buffer may be old; it may have been changed 3. LMS of node1 sends message to master of the buffer 3. Master checks the GES and doesn’t sees any lock 4. Instance 1 is granted the global block lock 5. No buffer actually gets transferred 29
  • 30.
    Grant Scenario 3 •Instance 1 is the master – Then it doesn’t have to make a request for the grant • In summary, here are the possible scenarios when Instance1 requests a buffer – Instance1 is the master; so no more processing is required – No one has the lock on the buffer, the grant is made by the master immediately – Another instance has the buffer in an incompatible mode. It has to be changed. 30
  • 31.
    Buffer States andLocks • Buffers can be gotten in two states – Current – when the intention is to modify • Shared Current – most recent copy. One copy per instance. Same as disk • Exclusive Current – only one copy in the entire cluster. No shared current present – CR – when the intention is to only select • Locks facilitate the state enforcement – XCUR for Exclusive Current – SCUR for Shared Current – No locking for CR 31
  • 33.
  • 34.
  • 36.
  • 37.
  • 38.
  • 39.
  • 40.
  • 42.
  • 43.
  • 44.
  • 45.
  • 46.
  • 47.
  • 48.
    Wait Event: gccurrent block 2 way DISK Wait Event -> gc current block 2-way Instance 1 Instance 2 2 Master Instance sends the current block via interconnect, keeps a past image, and grants exclusive lock. 1 Ask for current block and lock in exclusive mode Wait Event -> gc current request Requesting Instance Master Instance Current Block
  • 49.
    DISK Wait Event ->gc current block 3 - way Instance 1 Instance 2 2 Master Instance forwards request to the holder and sends the message to other instances holding the shared locks to close their locks. 1 Ask for current block and lock in exclusive mode Wait Event -> gc current request Requesting Instance Holding Instance Instance 3 3 Holding instance sends current block and transfers exclusive ownership to requestor and keeps a past image of the block. Current Block Wait Event: gc current block3 way Master Instance
  • 50.
    Wait Event: gccurrent block 2 way DISK Wait Event -> gc current block 2-way Instance 1 Instance 2 2 Master Instance has the current block, makes a CR copy and sends it via the interconnect, with no lock granted. 1 Ask for current block and lock in shared mode Wait Event -> gc current request Requesting Instance Master Instance Current Block
  • 51.
    DISK Wait Event ->gc current block 3 - way Instance 1 Instance 2 2 Master Instance forwards request to the holder no lock granted. 1 Ask for current block and lock in share mode Wait Event -> gc current request Requesting Instance Holding Instance Instance 3 3 Holding instance makes a CR copy and forwards it to the requestor. Current Block Wait Event: gc current block3 way Master Instance
  • 52.
    Under the Covers RedoLog Files Node nNode 2 Data Files and Control Files Redo Log Files Redo Log Files Dictionary Cache Log buffer LCK0 LGWR DBW0 SMON PMON Library Cache Global Resource Directory LMS0 Instance 2 SGA Instance n Cluster Private High Speed Network Buffer Cache LMON LMD0 DIAG Dictionary Cache Log buffer LCK0 LGWR DBW0 SMON PMON Library Cache Global Resource Directory LMS0 Buffer Cache LMON LMD0 DIAG Dictionary Cache Log buffer LCK0 LGWR DBW0 SMON PMON Library Cache Global Resource Directory LMS0 Buffer Cache LMON LMD0 DIAG Instance 1 Node 1 SGA SGA
  • 53.
    Interconnect and IPCprocessing Message:~200 bytes Block: e.g. 8K LMS Initiate send and wait Receive Process block Send Receive 200 bytes/(1 Gb/sec ) 8192 bytes/(1 Gb/sec) Total access time: e.g. ~360 microseconds (UDP over GBE) Network propagation delay ( “wire time” ) is a minor factor for roundtrip time ( approx.: 6% , vs. 52% in OS and network stack )
  • 54.
    Block Access Cost Costdetermined by • Message Propagation Delay • IPC CPU • Operating system scheduling • Block server process load • Interconnect stability
  • 55.
    Block Access Latency •Defined as roundtrip time • Latency variation (and CPU cost ) correlates with • processing time in Oracle and OS kernel • db_block_size • interconnect saturation • load on node ( CPU starvation ) • ~300 microseconds is lowest measured with UDP over Gigabit Ethernet and 2K blocks • ~ 120 microseconds is lowest measured with RDS over Infiniband and 2K blocks
  • 56.
    Infrastructure: Private Interconnect •Network between the nodes of a RAC cluster MUST be private • Supported links: GbE, IB ( IPoIB: 10.2 ) • Supported transport protocols: UDP, RDS (10.2.0.3 and above) • Use multiple or dual-ported NICs for redundancy and increase bandwidth with NIC bonding • Large ( Jumbo ) Frames for GbE recommended
  • 57.
    Infrastructure: Interconnect Bandwidth •Bandwidth requirements depend on – CPU power per cluster node – Application-driven data access frequency – Number of nodes and size of the working set – Data distribution between PQ slaves • Typical utilization approx. 10-30% in OLTP – 10000-12000 8K blocks per sec to saturate 1 x Gb Ethernet ( 75-80% of theoretical bandwidth ) • Multiple NICs generally not required for performance and scalability
  • 58.
  • 59.
    Misconfigured or FaultyInterconnect Can Cause: • Dropped packets/fragments • Buffer overflows • Packet reassembly failures or timeouts • Ethernet Flow control kicks in • TX/RX errors “lost blocks” at the RDBMS level, responsible for 64% of escalations
  • 60.
    “Lost Blocks”: NICReceive Errors Db_block_size = 8K ifconfig –a: eth0 Link encap:Ethernet HWaddr 00:0B:DB:4B:A2:04 inet addr:130.35.25.110 Bcast:130.35.27.255 Mask:255.255.252.0 UP BROADCAST RUNNING MULTICAST MTU:1500 Metric:1 RX packets:21721236 errors:135 dropped:0 overruns:0 frame:95 TX packets:273120 errors:0 dropped:0 overruns:0 carrier:0 …
  • 61.
    “Lost Blocks”: IPPacket Reassembly Failures netstat –s Ip: 84884742 total packets received … 1201 fragments dropped after timeout … 3384 packet reassembles failed
  • 62.
    Top 5 TimedEvents Avg %Total ~~~~~~~~~~~~~~~~~~ wait Call Event Waits Time(s)(ms) Time Wait Class ---------------------------------------------------------------------------------------------------- log file sync 286,038 49,872 174 41.7 Commit gc buffer busy 177,315 29,021 164 24.3 Cluster gc cr block busy 110,348 5,703 52 4.8 Cluster gc cr block lost 4,272 4,953 1159 4.1 Cluster cr request retry 6,316 4,668 739 3.9 Other Finding a Problem with the Interconnect or IPC Should never be here
  • 63.
    CPU Saturation orMemory Depletion Top 5 Timed Events Avg %Total ~~~~~~~~~~~~~~~~~~ wait Call Event Waits Time(s)(ms) Time Wait Class ----------------- --------- ------- ---- ----- ---------- db file sequential 1,312,840 21,590 16 21.8 User I/O read gc current block 275,004 21,054 77 21.3 Cluster congested gc cr grant congested 177,044 13,495 76 13.6 Cluster gc current block 1,192,113 9,931 8 10.0 Cluster 2-way gc cr block congested 85,975 8,917 104 9.0 Cluster “Congested”: LMS could not de-queue messages fast enough Cause : Long run queues and paging on the cluster nodes
  • 64.
    Health Check Look for: •High impact of “lost blocks” , e.g. gc cr block lost 1159 ms • IO capacity saturation , e.g. gc cr block busy 52 ms • Overload and memory depletion, e.g gc current block congested 14 ms All events with these tags are potential issue, if their % of db time is significant. Compare with the lowest measured latency ( target , c.f. SESSION HISTORY reports or SESSION HISTOGRAM view )
  • 65.
  • 66.
    General Principles • Nofundamentally different design and coding practices for RAC • Badly tuned SQL and schema will not run better • Serializing contention makes applications less scalable • Standard SQL and schema tuning solves > 80% of performance problems
  • 67.
    Scalability Pitfalls • Serializingcontention on a small set of data/index blocks – monotonically increasing key – frequent updates of small cached tables – segment without ASSM or Free List Group (FLG) • Full table scans • Frequent hard parsing • Concurrent DDL ( e.g. truncate/drop )
  • 68.
    Index Block Contention:Optimal Design • Monotonically increasing sequence numbers – Randomize or cache – Large ORACLE sequence number caches • Hash or range partitioning – Local indexes
  • 69.
    Data Block Contention:Optimal Design • Small tables with high row density and frequent updates and reads can become “globally hot” with serialization e.g. – Queue tables – session/job status tables – last trade lookup tables • Higher PCTFREE for table reduces # of rows per block
  • 70.
    Large Contiguous Scans •Query Tuning • Use parallel execution – Intra- or inter instance parallelism – Direct reads – GCS messaging minimal
  • 71.
    Event Statistics toDrive Analysis • Global cache (“gc” ) events and statistics • Indicate that Oracle searches the cache hierarchy to find data fast • as “normal” as an IO ( e.g. db file sequential read ) • GC events tagged as “busy” or “congested” consuming a significant amount of database time should be investigated • At first, assume a load or IO problem on one or several of the cluster nodes
  • 72.
    Global Cache EventSemantics All Global Cache Events will follow the following format: GC … • CR, current – Buffer requests and received for read or write • block, grant – Received block or grant to read from disk • 2-way, 3-way – Immediate response to remote request after N-hops • busy – Block or grant was held up because of contention • congested – Block or grant was delayed because LMS was busy or could not get the CPU
  • 73.
    “Normal” Global CacheAccess Statistics Top 5 Timed Events Avg %Total ~~~~~~~~~~~~~~~~~~ wait Call Event Waits Time(s) (ms) Time Wait Class -------------- -------- --------- ---- ---- ---------- CPU time 4,580 65.4 log file sync 276,281 1,501 5 21.4 Commit log file parallel 298,045 923 3 13.2 System I/O write gc current block 605,628 631 1 9.0 Cluster 3-way gc cr block 3-way 514,218 533 1 7.6 Cluster Reads from remote cache instead of disk Avg latency is 1 ms or less
  • 74.
    Top 5 TimedEvents Avg %Total ~~~~~~~~~~~~~~~~~~ wait Call Event Waits Time(s) (ms) Time Wait Class ------------------------------ ------------ ----------- log file sync 286,038 49,872 174 41.7 Commit gc buffer busy 177,315 29,021 164 24.3 Cluster gc cr block busy 110,348 5,703 52 4.8 Cluster “Abnormal” Global Cache Statistics “busy” indicates contention Avg time is too high
  • 75.
    Drill-down: An IOcapacity problem Symptom of Full Table Scans IO contention Top 5 Timed Events Avg %Total wait Call Event Waits Time(s) (ms) Time Wait Class ---------------- -------- ------- ---- ---- ---------- db file scattered read 3,747,683 368,301 98 33.3 User I/O gc buffer busy 3,376,228 233,632 69 21.1 Cluster db file parallel read 1,552,284 225,218 145 20.4 User I/O gc cr multi block 35,588,800 101,888 3 9.2 Cluster request read by other session 1,263,599 82,915 66 7.5 User I/O
  • 76.
    Drill-down: SQL Statements “Culprit”:Query that overwhelms IO subsystem on one node Physical Reads Executions per Exec %Total -------------- ----------- ------------- ------ 182,977,469 1,055 173,438.4 99.3 SELECT SHELL FROM ES_SHELL WHERE MSG_ID = :msg_id ORDER BY ORDER_NO ASC The same query reads from the interconnect: Cluster CWT % of CPU Wait Time (s) Elapsd Tim Time(s) Executions ------------- ---------- ----------- -------------- 341,080.54 31.2 17,495.38 1,055 SELECT SHELL FROM ES_SHELL WHERE MSG_ID = :msg_id ORDER BY ORDER_NO ASC
  • 77.
    GC Tablespace Subobject Obj.Buffer % of Name Object Name Name Type Busy Capture ---------- -------------------- ---------- ----- ------------ ------- ESSMLTBL ES_SHELL SYS_P537 TABLE 311,966 9.91 ESSMLTBL ES_SHELL SYS_P538 TABLE 277,035 8.80 ESSMLTBL ES_SHELL SYS_P527 TABLE 239,294 7.60 … Drill-Down: Top Segments Apart from being the table with the highest IO demand it was the table with the highest number of block transfers AND global serialization
  • 78.
  • 79.
    Diagnostics Flow • Startwith simple validations : – Private Interconnect used ? – Lost blocks and failures ? – Load and load distribution issues ? • Check avg latencies, busy, congested events and their significance • Check OS statistics ( CPU, disk , virtual memory ) • Identify SQL and Segments MOST OF THE TIME, A PERFORMANCE PROBLEM IS NOT A RAC PROBLEM
  • 80.
    Actions – Interconnect issuesmust be fixed first – If IO wait time is dominant , fix IO issues • At this point, performance may already be good – Fix “bad” plans – Fix serialization – Fix schema
  • 81.