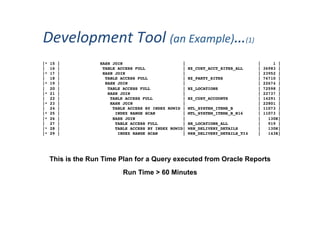
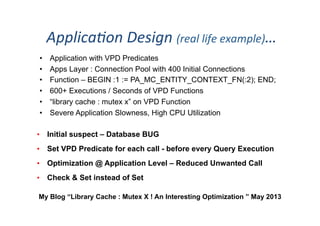
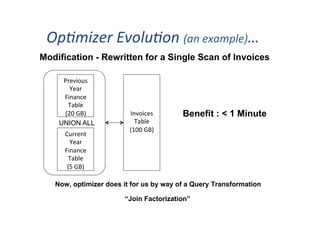
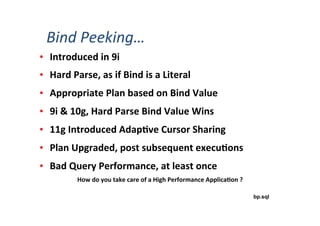
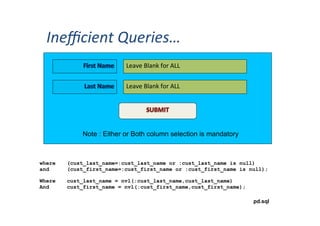
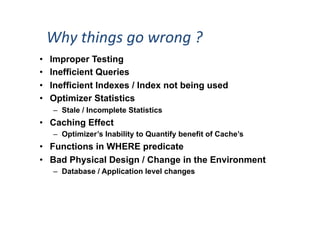
Database	
  /	
  Application	
  Design	
  
Hyderabad	
  –	
  30th	
  May	
  2015	
  
About	
  me…	
  
Vivek	
  Sharma,	
  
Blog	
  url	
  :	
  h3p://viveklsharma.wordpress.com	
  
Email	
  :	
  vlsharma@hotmail.com	
  
A	
  Regular	
  Speaker	
  for	
  AIOUG	
  	
  
Speaker	
  of	
  the	
  Year	
  –	
  Sangam	
  2012	
  
This	
  Session	
  for…	
  
•  Application Developers – Proactive
•  Development DBA’s – Proactive
•  Production DBA’s – Reactive
Cri3cal	
  to	
  know	
  (in	
  the	
  order	
  of	
  priority)…	
  
A Mantra for a Successful Development Project
“Don’t treat Database as a Block Box”
•  Your Underlying Database
•  Your Development Tool
•  Your Application Data
Development	
  Tool	
  (an	
  Example)…(1)	
  
|* 15 | HASH JOIN | | 1 |
| 16 | TABLE ACCESS FULL | HZ_CUST_ACCT_SITES_ALL | 36983 |
|* 17 | HASH JOIN | | 23952 |
| 18 | TABLE ACCESS FULL | HZ_PARTY_SITES | 76710 |
|* 19 | HASH JOIN | | 22674 |
| 20 | TABLE ACCESS FULL | HZ_LOCATIONS | 72598 |
|* 21 | HASH JOIN | | 22737 |
| 22 | TABLE ACCESS FULL | HZ_CUST_ACCOUNTS | 14291 |
|* 23 | HASH JOIN | | 22801 |
| 24 | TABLE ACCESS BY INDEX ROWID | MTL_SYSTEM_ITEMS_B | 11073 |
|* 25 | INDEX RANGE SCAN | MTL_SYSTEM_ITEMS_B_N16 | 11073 |
|* 26 | HASH JOIN | | 130K|
| 27 | TABLE ACCESS FULL | HR_LOCATIONS_ALL | 919 |
|* 28 | TABLE ACCESS BY INDEX ROWID| WSH_DELIVERY_DETAILS | 130K|
|* 29 | INDEX RANGE SCAN | WSH_DELIVERY_DETAILS_TI4 | 143K|
This is the Run Time Plan for a Query executed from Oracle Reports
Run Time > 60 Minutes
Development	
  Tool	
  (an	
  Example)…(2)	
  
This is the Run Time Plan for the same Query, when executed from SQL*Plus
Run Time < 1 Minute
| 18 | NESTED LOOPS | | 127 |
| 19 | MERGE JOIN | | 72 |
| 20 | TABLE ACCESS BY INDEX ROWID | WSH_TRIP_STOPS | 187 |
|* 21 | INDEX RANGE SCAN | WSH_TRIP_STOPS_N1 | 187 |
|* 22 | SORT JOIN | | 72 |
| 23 | TABLE ACCESS BY INDEX ROWID| WSH_TRIPS | 72 |
|* 24 | INDEX RANGE SCAN | WSH_TRIPS_U1 | 72 |
| 25 | TABLE ACCESS BY INDEX ROWID | WSH_DELIVERY_LEGS | 2 |
|* 26 | INDEX RANGE SCAN | WSH_DELIVERY_LEGS_N2 | 2 |
|* 27 | INDEX RANGE SCAN | WSH_DELIVERY_ASSIGNMENTS_N1 | 3 |
| 28 | TABLE ACCESS BY INDEX ROWID | WSH_DELIVERY_ASSIGNMENTS | 4 |
|* 29 | INDEX RANGE SCAN | WSH_DELIVERY_ASSIGNMENTS_N1 | 4 |
|* 30 | TABLE ACCESS BY INDEX ROWID | WSH_DELIVERY_DETAILS | 1 |
|* 31 | INDEX RANGE SCAN | WSH_DELIVERY_DETAILS_TI4 | 1 |
Development	
  Tool	
  (an	
  Example)…(3)	
  
10053 CBO Trace Reveals problem with Bind Peeking
*******************************************
Peeked values of the binds in SQL statement
*******************************************
----- Bind Info (kkscoacd) -----
Bind#0
oacdty=02 mxl=22(01) mxlc=00 mal=00 scl=00 pre=00
oacflg=00 fl2=1000000 frm=00 csi=00 siz=72 off=0
No bind buffers allocated
Bind#1
oacdty=02 mxl=22(01) mxlc=00 mal=00 scl=00 pre=00
oacflg=00 fl2=1000000 frm=00 csi=00 siz=0 off=24
No bind buffers allocated
Bind#2
oacdty=02 mxl=22(01) mxlc=00 mal=00 scl=00 pre=00
oacflg=00 fl2=1000000 frm=00 csi=00 siz=0 off=48
No bind buffers allocated
Bind#3
No oacdef for this bind.
Bind#4
No oacdef for this bind.
Development	
  Tool	
  (Few	
  more	
  points)…(4)	
  
•  Enqueue – TM Contention
•  Array Fetch Size
•  Bind Variables
Update	
  dept	
  set	
  deptno=:1,	
  dname=:2,	
  loca3on=:3	
  where	
  rowid=:4;	
  
Database	
  (Few	
  Concepts)…	
  
•  Understanding Architecture
–  SGA (the Shared Pool / the Buffer Cache)
–  Read Consistency
–  Locking and Concurrency
•  Optimizer
–  Statistics
–  Various Query Transformations
•  Database Objects
–  Table Design / Constraints
–  Indexing Strategy
–  Partitioning
Can’t	
  list	
  ALL.	
  These	
  are	
  just	
  few…	
  
Oracle	
  Waits	
  (to	
  name	
  a	
  few)…	
  
•  db file sequential read
•  db file scattered read
•  read by other session
•  direct path read
•  Latches / Mutexes
Single Block Reads
Multi Block Reads
Block Level Contention
Smart Scans - Exadata
Concurrency
Elimina3ng	
  Waits	
  cri3cal	
  for	
  Response	
  Sensi3ve	
  Applica3on	
  
Mul3	
  Block	
  Read	
  (concept)…	
  
A	
  Full	
  Table	
  Scan	
  of	
  a	
  24	
  Block	
  Table	
  with	
  dfmrc	
  =	
  4	


Segment	
  
Header	


Block	
  1	


Block	
  2	


CACHED	


Block	
  4	


Block	
  5	


Block	
  6	


Block	
  7	


Block	
  8	


Block	
  9	
  
CACHED	


Block	
  10	


Block	
  11	
  
CACHED	


Block	
  12	


Block	
  13	


Block	
  14	
  
CACHED	


Block	
  15	
  
CACHED	


Block	
  16	


Block	
  17	


Block	
  18	
  
CACHED	


Block	
  19	


Block	
  20	


Block	
  21	


Block	
  22	


Block	
  23	
  
db	
  file	
  scaOered	
  reads	
  Count	
  
db	
  file	
  sequen3al	
  reads	
  Count	
  
5	
  
4	
  
Coding	
  Standard	
  (Mul3ple	
  Parents)…	
  
12
Parent
(select *
from emp)
Child
Parent
(select *
from dept)
Child
Parent
(SELECT *
FROM EMP)
Child
Parent
(select *
from emp e)
Child
A	
  Parent	
  requires	
  at	
  least	
  one	
  Child	
  Cursor	


Obvious Problem
Coding	
  Standard	
  (Mul3ple	
  Childs)…	
  
My Blog “Authorization Check Failed ! Multiple Child Cursors..” Dec 2013
Child 0
(Schema
X)
Child 1
(Schema
Y)
Child 2
(Schema
X with
OICA=10)
Child 3
(Schema
X with
different
bind
length)
Parent	
  
(select	
  *	
  from	
  emp	
  where	
  
ename=:b1)	
  
Obvious – but a problem Problem
Bind_graduation.sql
Applica3on	
  Design	
  (real	
  life	
  example)…	
  
My Blog “Library Cache : Mutex X ! An Interesting Optimization ” May 2013
•  Application with VPD Predicates
•  Apps Layer : Connection Pool with 400 Initial Connections
•  Function – BEGIN :1 := PA_MC_ENTITY_CONTEXT_FN(:2); END;
•  600+ Executions / Seconds of VPD Functions
•  “library cache : mutex x” on VPD Function
•  Severe Application Slowness, High CPU Utilization
•  Initial suspect – Database BUG
•  Set VPD Predicate for each call - before every Query Execution
•  Optimization @ Application Level – Reduced Unwanted Call
•  Check & Set instead of Set
Op3mizer	
  Evolu3on	
  (an	
  example)…	
  
Requirement – Sales Tax Report
Join Financial Year Table to Invoices Table
DB Version 8174 v/s Now
15
Previous	
  
Year	
  	
  
Finance	
  
Table	
  
(20	
  GB)	
  
Current	
  
Year	
  	
  
Finance	
  
Table	
  
(5	
  GB)	
  
Invoices	
  
Table	
  
(100	
  GB)	
  
Invoices	
  
Table	
  
(100	
  GB)	
  
UNION ALL
Issue :
UAT – 5 Minutes
Prod – 60 Minutes
Issue :
UAT – 5 Minutes
Prod – 60 Minutes
2 Scans of 100 GB
Op3mizer	
  Evolu3on	
  (an	
  example)…	
  
Modification - Rewritten for a Single Scan of Invoices
16
Now, optimizer does it for us by way of a Query Transformation
“Join Factorization”
Previous	
  
Year	
  	
  
Finance	
  
Table	
  
(20	
  GB)	
  
Current	
  
Year	
  	
  
Finance	
  
Table	
  
(5	
  GB)	


Invoices	
  
Table	
  
(100	
  GB)	
  
UNION ALL
Benefit : < 1 Minute
Why	
  things	
  go	
  wrong	
  ?	
  
•  Improper Testing
•  Inefficient Queries
•  Inefficient Indexes / Index not being used
•  Optimizer Statistics
–  Stale / Incomplete Statistics
•  Caching Effect
–  Optimizer’s Inability to Quantify benefit of Cache’s
•  Functions in WHERE predicate
•  Bad Physical Design / Change in the Environment
–  Database / Application level changes
Improper	
  Tes3ng…	
  
•  Explain Plan Trap
•  Issue with Autotrace
•  Bind with Bind / Literal with Literal
•  UAT Equivalent to Production
ep.sql
Inves3ga3ng	
  Query	
  Performance…	
  
•  Use dbms_xplan.display_cursor – Current Plan
•  Use dbms_xplan.display_awr – History
•  Divide & Rule – Smaller Query, Easier to work
•  Test with Bind for Bind & Literal for Literal – v$sql_bind_capture
•  Gather_Plan_Statistics / Statistics_level – allstats last
•  Compare E-Rows & A-Rows – Issue if high discrepancy
qp.sql
Gather_Plan_Sta3s3cs	
  /	
  Sta3s3cs_Level	
  Cri3cal	
  for	
  Inves3ga3on	
  
•  Introduced	
  in	
  9i	
  	
  
•  Hard	
  Parse,	
  as	
  if	
  Bind	
  is	
  a	
  Literal	
  
•  Appropriate	
  Plan	
  based	
  on	
  Bind	
  Value	
  
•  9i	
  &	
  10g,	
  Hard	
  Parse	
  Bind	
  Value	
  Wins	
  
•  11g	
  Introduced	
  Adap3ve	
  Cursor	
  Sharing	
  
•  Plan	
  Upgraded,	
  post	
  subsequent	
  execu3ons	
  
•  Bad	
  Query	
  Performance,	
  at	
  least	
  once	
  
bp.sql
How	
  do	
  you	
  take	
  care	
  of	
  a	
  High	
  Performance	
  Applica3on	
  ?	
  
Bind	
  Peeking…	
  
Why	
  things	
  go	
  wrong	
  ?	
  
•  Improper Testing
•  Inefficient Queries
•  Inefficient Indexes / Index not being used
•  Optimizer Statistics
–  Stale / Incomplete Statistics
•  Caching Effect
–  Optimizer’s Inability to Quantify benefit of Cache’s
•  Functions in WHERE predicate
•  Bad Physical Design / Change in the Environment
–  Database / Application level changes
Inefficient	
  Queries…	
  
Leave	
  Blank	
  for	
  ALL	
  
Leave	
  Blank	
  for	
  ALL	
  
Note : Either or Both column selection is mandatory
where (cust_last_name=:cust_last_name or :cust_last_name is null)
and (cust_first_name=:cust_first_name or :cust_first_name is null);
pd.sql
Where cust_last_name = nvl(:cust_last_name,cust_last_name)
And cust_first_name = nvl(:cust_first_name,cust_first_name);
Why	
  things	
  go	
  wrong	
  ?	
  
•  Improper Testing
•  Inefficient Queries
•  Inefficient Indexes / Index not being used
•  Optimizer Statistics
–  Stale / Incomplete Statistics
•  Caching Effect
–  Optimizer’s Inability to Quantify benefit of Cache’s
•  Functions in WHERE predicate
•  Bad Physical Design / Change in the Environment
–  Database / Application level changes
Indexes	
  not	
  being	
  used…	
  
•  Mismatch in Column Data Type & Bind Variable
•  Avoid masking an Indexed column with a Function
•  Feed additional Statistics on Column Dependency
•  User NULLS instead of using Too Higher or Lower Range
•  Histograms, wherever required
•  Reduce Throwaway – Better Indexing
ne.sql
Indexes	
  not	
  being	
  used	
  (a	
  real	
  life	
  example)…	
  
25
l_sql_stmt :=l_sql_stmt||
'SELECT invoice_id from A_INV AI
WHERE AI. REQUEST_ID IS NULL
AND AI.APPROVAL_READY_FLAG <> ''S''
AND AI.INVOICE_TYPE<>''INVOICE REQUEST’’
AND AI.CANCELLED_DATE IS NULL
AND NOT (NVL(AI.PAYMENT_STATUS,''N'') = ''Y''
AND NVL(AI.HISTORICAL_FLAG,''N'') = ''Y''
AND NVL(AI.REVALIDATION_FLAG,''N'') = ''N'')
AND ……
•  The 3 Predicates (in RED) filters out 96% of Data
•  Mismatch in Column Data Type & Bind Variable
•  Indexes exists on NVL but not getting used
•  Query Run Time = Around 70 Minutes
Indexes	
  not	
  being	
  used	
  (a	
  real	
  life	
  example)…	
  
26
26
l_sql_stmt1 := l_sql_stmt1||'INSERT INTO A_INV_RIDS
SELECT ROWID FROM A_INV AI WHERE CASE WHEN
PAYMENT_STATUS=''Y'' THEN 0 ELSE 1 END = 1 ';
l_sql_stmt2 := l_sql_stmt2||'INSERT INTO A_INV_RIDS
SELECT ROWID FROM A_INV AI WHERE CASE WHEN
HISTORICAL_FLAG=''Y'' THEN 0 ELSE 1 END = 1 ';
l_sql_stmt3 := l_sql_stmt3||'INSERT INTO A_INV_RIDS
SELECT ROWID FROM A_INV AI WHERE CASE WHEN
NVL(REVALIDATION_FLAG,''N'')=''N'' THEN 0 ELSE 1 END = 1 ';
•  Introduced a GTT & Three New Indexes using CASE
•  Populated the ROWID’s in the GTT
•  SubQuery Factoring joining Original Table with GTT
•  Only the filtered rows were then joined to other Tables
•  Query Run Time = Around 3 Minutes
Why	
  things	
  go	
  wrong	
  ?	
  
•  Improper Testing
•  Inefficient Queries
•  Inefficient Indexes / Index not being used
•  Optimizer Statistics
–  Stale / Incomplete Statistics
•  Caching Effect
–  Optimizer’s Inability to Quantify benefit of Cache’s
•  Functions in WHERE predicate
•  Bad Physical Design / Change in the Environment
–  Database / Application level changes
os.sql
•  Upto Date Statistics – Object / System Statistics
•  Column Level relevant Inputs to Optimizer
•  Co-Related Column Stats
Op3mizer	
  Sta3s3cs…	
  
Why	
  things	
  go	
  wrong	
  ?	
  
•  Improper Testing
•  Inefficient Queries
•  Inefficient Indexes / Index not being used
•  Optimizer Statistics
–  Stale / Incomplete Statistics
•  Caching Effect
–  Optimizer’s Inability to Quantify benefit of Cache’s
•  Functions in WHERE predicate
•  Bad Physical Design / Change in the Environment
–  Database / Application level changes
cf.sql
Benefits	
  Elapsed	
  3me.	
  	
  
Op3mizer’s	
  Inability	
  to	
  Quan3fy	


•  Buffer Cache
•  Result Cache
•  Scalar Subquery Caching
Caching	
  Effect…	
  
31
TABLE_CACHED_BLOCK	
  Preference	
  (1	
  –	
  Default	
  to	
  255)	
  
•  Most Important Statistics
•  Affects Optimizer Choice of Execution Plan
•  Measure of I/O’s to read a Table via an Index
•  Assumes, each Table Block read is a new Block
Clustering	
  Factor	
  (12c	
  Enhancement)…	
  
Why	
  things	
  go	
  wrong	
  ?	
  
•  Improper Testing
•  Inefficient Queries
•  Inefficient Indexes / Index not being used
•  Optimizer Statistics
–  Stale / Incomplete Statistics
•  Caching Effect
–  Optimizer’s Inability to Quantify benefit of Cache’s
•  Functions in WHERE predicate
•  Bad Physical Design / Change in the Environment
–  Database / Application level changes
•  Improper	
  Cardinality	
  Calcula3on	
  
•  Impact	
  on	
  Indexes	
  
•  Selec3vity	
  guess	
  of	
  1%	
  
fs.sql
Avoid	
  Using	
  Func3ons	
  in	
  WHERE	
  Predicate	
  
Associate	
  Sta3s3s3cs	
  for	
  Func3ons	
  to	
  provide	
  beOer	
  Selec3vity	
  
Func3ons	
  in	
  WHERE	
  Predicate…	
  
Why	
  things	
  go	
  wrong	
  ?	
  
•  Improper Testing
•  Inefficient Queries
•  Inefficient Indexes / Index not being used
•  Optimizer Statistics
–  Stale / Incomplete Statistics
•  Caching Effect
–  Optimizer’s Inability to Quantify benefit of Cache’s
•  Functions in WHERE predicate
•  Bad Physical Design / Change in the Environment
–  Database / Application level changes
•  Column	
  Ordering	
  maOers	
  ?	
  
•  Column	
  Skip	
  consumes	
  CPU	
  
•  Frequently	
  Queried	
  columns	
  @	
  Start	
  
Performance	
  v/s	
  Storage	
  Space	
  
Bad	
  Physical	
  Design…	
  
Bad	
  Physical	
  Design…(1)	
  
In terms of performance –
Is there any difference between the two queries ?
select	
  id,	
  n1	
  from	
  T1	
  where	
  n2=:b1	


Table	
   Num	
  Rows	
   Num	
  Blocks	
  
T1	
   100000	
   846	
  
T2	
   100000	
   846	
  
select	
  id,	
  n1	
  from	
  T2	
  where	
  n2=:b1	
  
No	
  Indexes.	
  Id,	
  n1	
  and	
  n2	
  are	
  NUMBER	
  Datatype	


Bad	
  Physical	
  Design…(2)	
  
Column_ID	
   T1	
   T2	
  
1	
   ID	
   ID	
  
2	
   N1	
   N1	
  
3	
   N2	
   N3	
  
4	
   N3	
   N4	
  
5	
   N4	
   N5	
  
6	
   N5	
   N6	
  
7	
   N6	
   N7	
  
8	
   N7	
   N8	
  
9	
   N8	
   N9	
  
10	
   N9	
   V6	
  
11	
   V6	
   N10	
  
12	
   N10	
   N11	
  
13	
   N11	
   N2	
  
Bad	
  Physical	
  Design…(3)	
  
38
•  Table	
  A	
  with	
  13	
  Columns	
  (A1..A13)	


In terms of performance –
Is there any difference between the two queries ?
select A1 from A where rowid=‘some_value’;
select A13 from A where rowid=‘some_value’;
Addi3onal	
  CPU	
  Cycles	
  for	
  Column	
  Skipping	


CPU	
  Cycles	
  for	
  Table	
  Column	
  Skip	
   20	
  
CPU	
  Cycles	
  for	
  Scanning	
  Table	
  Row	
   130	
  
Bad	
  Physical	
  Design…(4)	
  
0
5000
10000
15000
20000
25000
30000
1 4 7 10 13 16 19 22 25 28 31 34 37 40 43 46 49
CPU Cycles
1st Column 13th Column
Bad	
  Physical	
  Design…(5)	
  
In terms of performance –
Is there any difference between the two queries ?
select	
  id,	
  n1	
  from	
  T1	
  where	
  n2=:b1	


Table	
   Num	
  Rows	
   Num	
  Blocks	
  
T1	
   100000	
   846	
  
T2	
   100000	
   846	
  
select	
  id,	
  n1	
  from	
  T2	
  where	
  n2=:b1	
  
No	
  Indexes.	
  Id,	
  n1	
  and	
  n2	
  are	
  NUMBER	
  Datatype	


co.sql
THANK	
  YOU	
  

Database and application performance vivek sharma

  • 1.
    Database  /  Application  Design   Hyderabad  –  30th  May  2015  
  • 2.
    About  me…   Vivek  Sharma,   Blog  url  :  h3p://viveklsharma.wordpress.com   Email  :  vlsharma@hotmail.com   A  Regular  Speaker  for  AIOUG     Speaker  of  the  Year  –  Sangam  2012  
  • 3.
    This  Session  for…   •  Application Developers – Proactive •  Development DBA’s – Proactive •  Production DBA’s – Reactive
  • 4.
    Cri3cal  to  know  (in  the  order  of  priority)…   A Mantra for a Successful Development Project “Don’t treat Database as a Block Box” •  Your Underlying Database •  Your Development Tool •  Your Application Data
  • 5.
    Development  Tool  (an  Example)…(1)   |* 15 | HASH JOIN | | 1 | | 16 | TABLE ACCESS FULL | HZ_CUST_ACCT_SITES_ALL | 36983 | |* 17 | HASH JOIN | | 23952 | | 18 | TABLE ACCESS FULL | HZ_PARTY_SITES | 76710 | |* 19 | HASH JOIN | | 22674 | | 20 | TABLE ACCESS FULL | HZ_LOCATIONS | 72598 | |* 21 | HASH JOIN | | 22737 | | 22 | TABLE ACCESS FULL | HZ_CUST_ACCOUNTS | 14291 | |* 23 | HASH JOIN | | 22801 | | 24 | TABLE ACCESS BY INDEX ROWID | MTL_SYSTEM_ITEMS_B | 11073 | |* 25 | INDEX RANGE SCAN | MTL_SYSTEM_ITEMS_B_N16 | 11073 | |* 26 | HASH JOIN | | 130K| | 27 | TABLE ACCESS FULL | HR_LOCATIONS_ALL | 919 | |* 28 | TABLE ACCESS BY INDEX ROWID| WSH_DELIVERY_DETAILS | 130K| |* 29 | INDEX RANGE SCAN | WSH_DELIVERY_DETAILS_TI4 | 143K| This is the Run Time Plan for a Query executed from Oracle Reports Run Time > 60 Minutes
  • 6.
    Development  Tool  (an  Example)…(2)   This is the Run Time Plan for the same Query, when executed from SQL*Plus Run Time < 1 Minute | 18 | NESTED LOOPS | | 127 | | 19 | MERGE JOIN | | 72 | | 20 | TABLE ACCESS BY INDEX ROWID | WSH_TRIP_STOPS | 187 | |* 21 | INDEX RANGE SCAN | WSH_TRIP_STOPS_N1 | 187 | |* 22 | SORT JOIN | | 72 | | 23 | TABLE ACCESS BY INDEX ROWID| WSH_TRIPS | 72 | |* 24 | INDEX RANGE SCAN | WSH_TRIPS_U1 | 72 | | 25 | TABLE ACCESS BY INDEX ROWID | WSH_DELIVERY_LEGS | 2 | |* 26 | INDEX RANGE SCAN | WSH_DELIVERY_LEGS_N2 | 2 | |* 27 | INDEX RANGE SCAN | WSH_DELIVERY_ASSIGNMENTS_N1 | 3 | | 28 | TABLE ACCESS BY INDEX ROWID | WSH_DELIVERY_ASSIGNMENTS | 4 | |* 29 | INDEX RANGE SCAN | WSH_DELIVERY_ASSIGNMENTS_N1 | 4 | |* 30 | TABLE ACCESS BY INDEX ROWID | WSH_DELIVERY_DETAILS | 1 | |* 31 | INDEX RANGE SCAN | WSH_DELIVERY_DETAILS_TI4 | 1 |
  • 7.
    Development  Tool  (an  Example)…(3)   10053 CBO Trace Reveals problem with Bind Peeking ******************************************* Peeked values of the binds in SQL statement ******************************************* ----- Bind Info (kkscoacd) ----- Bind#0 oacdty=02 mxl=22(01) mxlc=00 mal=00 scl=00 pre=00 oacflg=00 fl2=1000000 frm=00 csi=00 siz=72 off=0 No bind buffers allocated Bind#1 oacdty=02 mxl=22(01) mxlc=00 mal=00 scl=00 pre=00 oacflg=00 fl2=1000000 frm=00 csi=00 siz=0 off=24 No bind buffers allocated Bind#2 oacdty=02 mxl=22(01) mxlc=00 mal=00 scl=00 pre=00 oacflg=00 fl2=1000000 frm=00 csi=00 siz=0 off=48 No bind buffers allocated Bind#3 No oacdef for this bind. Bind#4 No oacdef for this bind.
  • 8.
    Development  Tool  (Few  more  points)…(4)   •  Enqueue – TM Contention •  Array Fetch Size •  Bind Variables Update  dept  set  deptno=:1,  dname=:2,  loca3on=:3  where  rowid=:4;  
  • 9.
    Database  (Few  Concepts)…   •  Understanding Architecture –  SGA (the Shared Pool / the Buffer Cache) –  Read Consistency –  Locking and Concurrency •  Optimizer –  Statistics –  Various Query Transformations •  Database Objects –  Table Design / Constraints –  Indexing Strategy –  Partitioning Can’t  list  ALL.  These  are  just  few…  
  • 10.
    Oracle  Waits  (to  name  a  few)…   •  db file sequential read •  db file scattered read •  read by other session •  direct path read •  Latches / Mutexes Single Block Reads Multi Block Reads Block Level Contention Smart Scans - Exadata Concurrency Elimina3ng  Waits  cri3cal  for  Response  Sensi3ve  Applica3on  
  • 11.
    Mul3  Block  Read  (concept)…   A  Full  Table  Scan  of  a  24  Block  Table  with  dfmrc  =  4     Segment   Header       Block  1     Block  2     CACHED     Block  4     Block  5     Block  6     Block  7     Block  8         Block  9   CACHED       Block  10     Block  11   CACHED     Block  12     Block  13     Block  14   CACHED     Block  15   CACHED     Block  16         Block  17     Block  18   CACHED     Block  19     Block  20     Block  21     Block  22     Block  23   db  file  scaOered  reads  Count   db  file  sequen3al  reads  Count   5   4  
  • 12.
    Coding  Standard  (Mul3ple  Parents)…   12 Parent (select * from emp) Child Parent (select * from dept) Child Parent (SELECT * FROM EMP) Child Parent (select * from emp e) Child A  Parent  requires  at  least  one  Child  Cursor     Obvious Problem
  • 13.
    Coding  Standard  (Mul3ple  Childs)…   My Blog “Authorization Check Failed ! Multiple Child Cursors..” Dec 2013 Child 0 (Schema X) Child 1 (Schema Y) Child 2 (Schema X with OICA=10) Child 3 (Schema X with different bind length) Parent   (select  *  from  emp  where   ename=:b1)   Obvious – but a problem Problem Bind_graduation.sql
  • 14.
    Applica3on  Design  (real  life  example)…   My Blog “Library Cache : Mutex X ! An Interesting Optimization ” May 2013 •  Application with VPD Predicates •  Apps Layer : Connection Pool with 400 Initial Connections •  Function – BEGIN :1 := PA_MC_ENTITY_CONTEXT_FN(:2); END; •  600+ Executions / Seconds of VPD Functions •  “library cache : mutex x” on VPD Function •  Severe Application Slowness, High CPU Utilization •  Initial suspect – Database BUG •  Set VPD Predicate for each call - before every Query Execution •  Optimization @ Application Level – Reduced Unwanted Call •  Check & Set instead of Set
  • 15.
    Op3mizer  Evolu3on  (an  example)…   Requirement – Sales Tax Report Join Financial Year Table to Invoices Table DB Version 8174 v/s Now 15 Previous   Year     Finance   Table   (20  GB)   Current   Year     Finance   Table   (5  GB)   Invoices   Table   (100  GB)   Invoices   Table   (100  GB)   UNION ALL Issue : UAT – 5 Minutes Prod – 60 Minutes Issue : UAT – 5 Minutes Prod – 60 Minutes 2 Scans of 100 GB
  • 16.
    Op3mizer  Evolu3on  (an  example)…   Modification - Rewritten for a Single Scan of Invoices 16 Now, optimizer does it for us by way of a Query Transformation “Join Factorization” Previous   Year     Finance   Table   (20  GB)   Current   Year     Finance   Table   (5  GB)           Invoices   Table   (100  GB)   UNION ALL Benefit : < 1 Minute
  • 17.
    Why  things  go  wrong  ?   •  Improper Testing •  Inefficient Queries •  Inefficient Indexes / Index not being used •  Optimizer Statistics –  Stale / Incomplete Statistics •  Caching Effect –  Optimizer’s Inability to Quantify benefit of Cache’s •  Functions in WHERE predicate •  Bad Physical Design / Change in the Environment –  Database / Application level changes
  • 18.
    Improper  Tes3ng…   • Explain Plan Trap •  Issue with Autotrace •  Bind with Bind / Literal with Literal •  UAT Equivalent to Production ep.sql
  • 19.
    Inves3ga3ng  Query  Performance…   •  Use dbms_xplan.display_cursor – Current Plan •  Use dbms_xplan.display_awr – History •  Divide & Rule – Smaller Query, Easier to work •  Test with Bind for Bind & Literal for Literal – v$sql_bind_capture •  Gather_Plan_Statistics / Statistics_level – allstats last •  Compare E-Rows & A-Rows – Issue if high discrepancy qp.sql Gather_Plan_Sta3s3cs  /  Sta3s3cs_Level  Cri3cal  for  Inves3ga3on  
  • 20.
    •  Introduced  in  9i     •  Hard  Parse,  as  if  Bind  is  a  Literal   •  Appropriate  Plan  based  on  Bind  Value   •  9i  &  10g,  Hard  Parse  Bind  Value  Wins   •  11g  Introduced  Adap3ve  Cursor  Sharing   •  Plan  Upgraded,  post  subsequent  execu3ons   •  Bad  Query  Performance,  at  least  once   bp.sql How  do  you  take  care  of  a  High  Performance  Applica3on  ?   Bind  Peeking…  
  • 21.
    Why  things  go  wrong  ?   •  Improper Testing •  Inefficient Queries •  Inefficient Indexes / Index not being used •  Optimizer Statistics –  Stale / Incomplete Statistics •  Caching Effect –  Optimizer’s Inability to Quantify benefit of Cache’s •  Functions in WHERE predicate •  Bad Physical Design / Change in the Environment –  Database / Application level changes
  • 22.
    Inefficient  Queries…   Leave  Blank  for  ALL   Leave  Blank  for  ALL   Note : Either or Both column selection is mandatory where (cust_last_name=:cust_last_name or :cust_last_name is null) and (cust_first_name=:cust_first_name or :cust_first_name is null); pd.sql Where cust_last_name = nvl(:cust_last_name,cust_last_name) And cust_first_name = nvl(:cust_first_name,cust_first_name);
  • 23.
    Why  things  go  wrong  ?   •  Improper Testing •  Inefficient Queries •  Inefficient Indexes / Index not being used •  Optimizer Statistics –  Stale / Incomplete Statistics •  Caching Effect –  Optimizer’s Inability to Quantify benefit of Cache’s •  Functions in WHERE predicate •  Bad Physical Design / Change in the Environment –  Database / Application level changes
  • 24.
    Indexes  not  being  used…   •  Mismatch in Column Data Type & Bind Variable •  Avoid masking an Indexed column with a Function •  Feed additional Statistics on Column Dependency •  User NULLS instead of using Too Higher or Lower Range •  Histograms, wherever required •  Reduce Throwaway – Better Indexing ne.sql
  • 25.
    Indexes  not  being  used  (a  real  life  example)…   25 l_sql_stmt :=l_sql_stmt|| 'SELECT invoice_id from A_INV AI WHERE AI. REQUEST_ID IS NULL AND AI.APPROVAL_READY_FLAG <> ''S'' AND AI.INVOICE_TYPE<>''INVOICE REQUEST’’ AND AI.CANCELLED_DATE IS NULL AND NOT (NVL(AI.PAYMENT_STATUS,''N'') = ''Y'' AND NVL(AI.HISTORICAL_FLAG,''N'') = ''Y'' AND NVL(AI.REVALIDATION_FLAG,''N'') = ''N'') AND …… •  The 3 Predicates (in RED) filters out 96% of Data •  Mismatch in Column Data Type & Bind Variable •  Indexes exists on NVL but not getting used •  Query Run Time = Around 70 Minutes
  • 26.
    Indexes  not  being  used  (a  real  life  example)…   26 26 l_sql_stmt1 := l_sql_stmt1||'INSERT INTO A_INV_RIDS SELECT ROWID FROM A_INV AI WHERE CASE WHEN PAYMENT_STATUS=''Y'' THEN 0 ELSE 1 END = 1 '; l_sql_stmt2 := l_sql_stmt2||'INSERT INTO A_INV_RIDS SELECT ROWID FROM A_INV AI WHERE CASE WHEN HISTORICAL_FLAG=''Y'' THEN 0 ELSE 1 END = 1 '; l_sql_stmt3 := l_sql_stmt3||'INSERT INTO A_INV_RIDS SELECT ROWID FROM A_INV AI WHERE CASE WHEN NVL(REVALIDATION_FLAG,''N'')=''N'' THEN 0 ELSE 1 END = 1 '; •  Introduced a GTT & Three New Indexes using CASE •  Populated the ROWID’s in the GTT •  SubQuery Factoring joining Original Table with GTT •  Only the filtered rows were then joined to other Tables •  Query Run Time = Around 3 Minutes
  • 27.
    Why  things  go  wrong  ?   •  Improper Testing •  Inefficient Queries •  Inefficient Indexes / Index not being used •  Optimizer Statistics –  Stale / Incomplete Statistics •  Caching Effect –  Optimizer’s Inability to Quantify benefit of Cache’s •  Functions in WHERE predicate •  Bad Physical Design / Change in the Environment –  Database / Application level changes
  • 28.
    os.sql •  Upto DateStatistics – Object / System Statistics •  Column Level relevant Inputs to Optimizer •  Co-Related Column Stats Op3mizer  Sta3s3cs…  
  • 29.
    Why  things  go  wrong  ?   •  Improper Testing •  Inefficient Queries •  Inefficient Indexes / Index not being used •  Optimizer Statistics –  Stale / Incomplete Statistics •  Caching Effect –  Optimizer’s Inability to Quantify benefit of Cache’s •  Functions in WHERE predicate •  Bad Physical Design / Change in the Environment –  Database / Application level changes
  • 30.
    cf.sql Benefits  Elapsed  3me.     Op3mizer’s  Inability  to  Quan3fy       •  Buffer Cache •  Result Cache •  Scalar Subquery Caching Caching  Effect…  
  • 31.
    31 TABLE_CACHED_BLOCK  Preference  (1  –  Default  to  255)   •  Most Important Statistics •  Affects Optimizer Choice of Execution Plan •  Measure of I/O’s to read a Table via an Index •  Assumes, each Table Block read is a new Block Clustering  Factor  (12c  Enhancement)…  
  • 32.
    Why  things  go  wrong  ?   •  Improper Testing •  Inefficient Queries •  Inefficient Indexes / Index not being used •  Optimizer Statistics –  Stale / Incomplete Statistics •  Caching Effect –  Optimizer’s Inability to Quantify benefit of Cache’s •  Functions in WHERE predicate •  Bad Physical Design / Change in the Environment –  Database / Application level changes
  • 33.
    •  Improper  Cardinality  Calcula3on   •  Impact  on  Indexes   •  Selec3vity  guess  of  1%   fs.sql Avoid  Using  Func3ons  in  WHERE  Predicate   Associate  Sta3s3s3cs  for  Func3ons  to  provide  beOer  Selec3vity   Func3ons  in  WHERE  Predicate…  
  • 34.
    Why  things  go  wrong  ?   •  Improper Testing •  Inefficient Queries •  Inefficient Indexes / Index not being used •  Optimizer Statistics –  Stale / Incomplete Statistics •  Caching Effect –  Optimizer’s Inability to Quantify benefit of Cache’s •  Functions in WHERE predicate •  Bad Physical Design / Change in the Environment –  Database / Application level changes
  • 35.
    •  Column  Ordering  maOers  ?   •  Column  Skip  consumes  CPU   •  Frequently  Queried  columns  @  Start   Performance  v/s  Storage  Space   Bad  Physical  Design…  
  • 36.
    Bad  Physical  Design…(1)   In terms of performance – Is there any difference between the two queries ? select  id,  n1  from  T1  where  n2=:b1     Table   Num  Rows   Num  Blocks   T1   100000   846   T2   100000   846   select  id,  n1  from  T2  where  n2=:b1   No  Indexes.  Id,  n1  and  n2  are  NUMBER  Datatype      
  • 37.
    Bad  Physical  Design…(2)   Column_ID   T1   T2   1   ID   ID   2   N1   N1   3   N2   N3   4   N3   N4   5   N4   N5   6   N5   N6   7   N6   N7   8   N7   N8   9   N8   N9   10   N9   V6   11   V6   N10   12   N10   N11   13   N11   N2  
  • 38.
    Bad  Physical  Design…(3)   38 •  Table  A  with  13  Columns  (A1..A13)       In terms of performance – Is there any difference between the two queries ? select A1 from A where rowid=‘some_value’; select A13 from A where rowid=‘some_value’; Addi3onal  CPU  Cycles  for  Column  Skipping       CPU  Cycles  for  Table  Column  Skip   20   CPU  Cycles  for  Scanning  Table  Row   130  
  • 39.
    Bad  Physical  Design…(4)   0 5000 10000 15000 20000 25000 30000 1 4 7 10 13 16 19 22 25 28 31 34 37 40 43 46 49 CPU Cycles 1st Column 13th Column
  • 40.
    Bad  Physical  Design…(5)   In terms of performance – Is there any difference between the two queries ? select  id,  n1  from  T1  where  n2=:b1     Table   Num  Rows   Num  Blocks   T1   100000   846   T2   100000   846   select  id,  n1  from  T2  where  n2=:b1   No  Indexes.  Id,  n1  and  n2  are  NUMBER  Datatype       co.sql
  • 41.