Downloaded 173 times


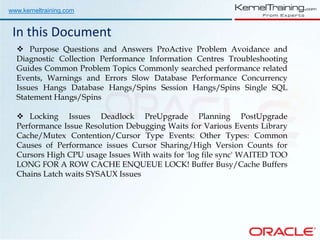
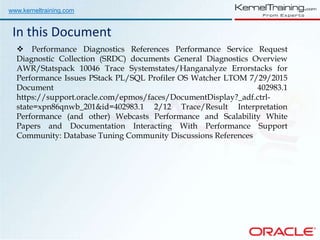


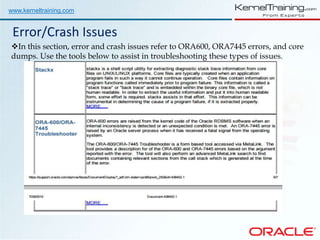
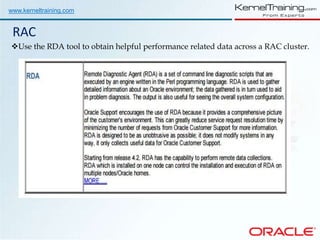


This document serves as a comprehensive guide to troubleshoot performance issues in Oracle databases, detailing common problems, diagnostics, and resolutions. It includes references to specific guides, frequently asked questions, and best practices for proactive problem avoidance related to database performance. The document applies to multiple versions of Oracle Database and emphasizes the importance of early detection and proper diagnostic collection for effective issue resolution.