Downloaded 816 times
![Few words about Yury
• Google Yury Oracle [LinkedIn, twitter, blog, email, mobile, …]
- Email me to get the presentation
• Sr. Oracle DBA at Pythian, Oracle ACE and OCM
• Started as Oracle DBA
- with 7.2 (in 1997, 14+)
• First international appearance
- 2005 - Hotsos Symposium 2005
• Professional Education
- Jonathan Lewis (2003 – 3 days), Tom Kyte (2004 – 3 days), Tanel
Põder (2008 – 2 days ), Cary Millsap (2011 – 3 days) …
• Education (Master Degree in Computer science)
- OCP 7/8/8i/9/10/11 + OCM 9i/10g/11g
• Oracle DBA consultant experience (14+ years)
• Pythian Oracle Clients support (2+ years)
- 140+ Clients around the world
- Different products, different load, different problems
6 © 2009/2010 Pythian](https://image.slidesharecdn.com/20110811awr12-120313072235-phpapp01/85/Oracle-AWR-Data-mining-6-320.jpg)
![Background
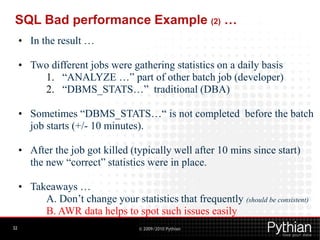
• AWR is one of many RDBMS performance data sources
Jonathan Lewis / Tom Kyte / Tanel Põder / Cary Millsap
• Sometimes it isn’t the best source (aggregation)
• SQL Extended trace (event 10046)
• RAW trace
• tkprof
• TRCAnlzr [ID 224270.1]
• Method-R state of art tools
• PL/SQL Profiler
• LTOM (Session Trace Collector)
• others
• Sometimes it is the best source!
• Sometimes it is the only one available!
7 © 2009/2010 Pythian](https://image.slidesharecdn.com/20110811awr12-120313072235-phpapp01/85/Oracle-AWR-Data-mining-7-320.jpg)

![Google Yury Oracle [LinkedIn, twitter, blog, email, mobile, …]
Additionalget the presentation
Email me to Resources
• www.oracle.com/scan
• www.pythian.com/exadata
• www.pythian.com/news/tag/exadata - Exadata
Mission
Blog
Let you remember/consider AWR
• www.pythian.com/news_and_events/in_the_news
Article: “Making the Most time youExadata”
next of Oracle troubleshoot
Performance issue!
My Oracle Support notes 888828.1 and 757552.1
Thank you!
Pythian
•Like Pythian on facebook: http://on.fb.me/pythianfacebook
•Follow us on LinkedIn: http://linkd.in/pythian
•Follow Pythian on Twitter @pythian (www.twitter.com/pythian)
40 © 2009/2010 Pythian](https://image.slidesharecdn.com/20110811awr12-120313072235-phpapp01/85/Oracle-AWR-Data-mining-40-320.jpg)

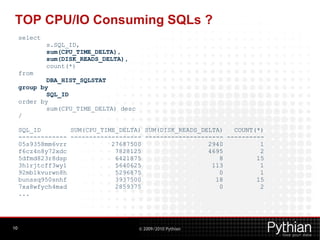
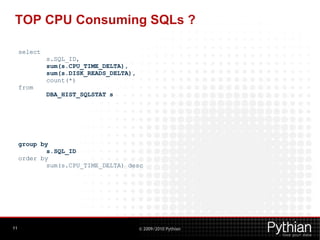
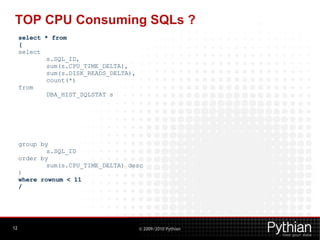
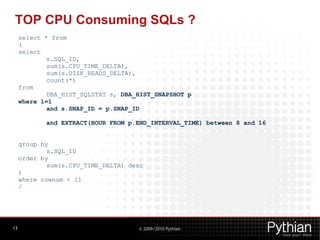
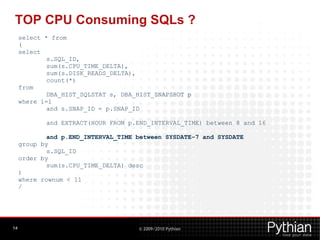
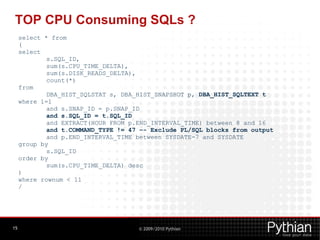
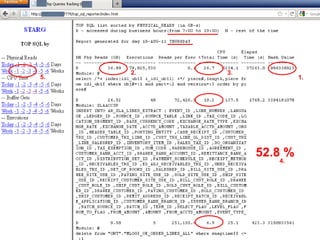
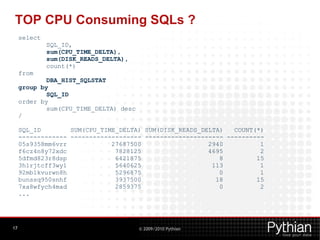
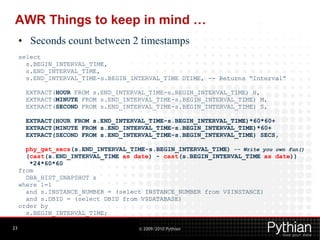
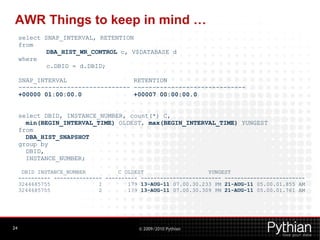
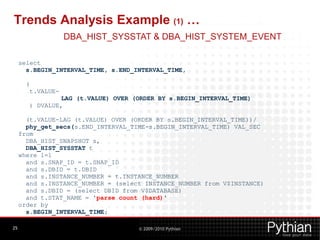
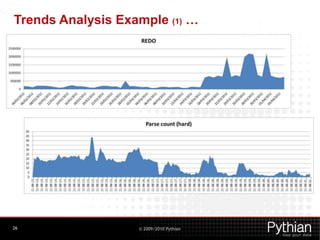
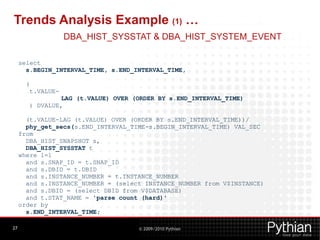
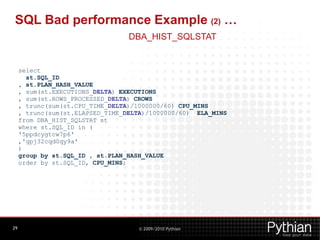
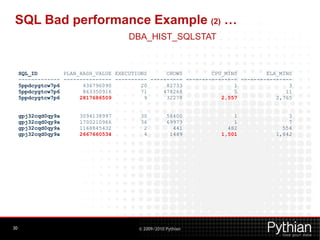
The document provides an overview of analyzing performance data using the Automatic Workload Repository (AWR) in Oracle databases. It discusses how AWR collects snapshots of data from V$ views over time and stores them in database history views. It highlights some key views used in AWR analysis and factors to consider like snapshot intervals and timestamps. Examples are provided to show how to query AWR views to identify top SQL statements by CPU usage and analyze performance metrics trends over time.


![Getting Started with Apache Spark: Big Data Made Simple [Free Meetup]](https://cdn.slidesharecdn.com/ss_thumbnails/apachesparkgettingstarted-260203175547-8361bcc3-thumbnail.jpg?width=640&height=640&fit=bounds)


