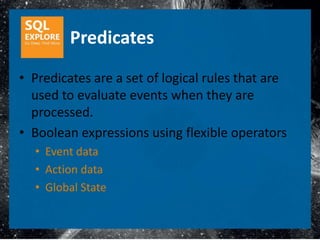
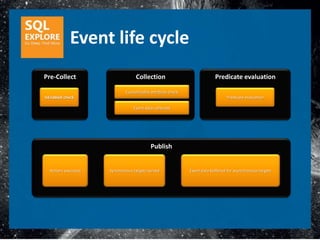
Performance
  Tuning
 Principles
Principles of performance tuning

•   The Goal:
    • Minimum response time and Maximum throughput
    • Reduce network traffic, disk I/O, memory usage and CPU time
•   This is achieved through understanding:
    • Application requirements
    • Logical and physical structure of the data
    • Tradeoffs between conflicting uses of the database. (OLTP vs.
      DSS)

•   Start optimizing in early stage of development.
    It tends to be much harder later.
Principles of performance tuning


•   Good design will reduce performance problems:
    •   Architecture
    •   Application & queries
    •   Database
    •   Hardware

•   Identify the areas that will yield the largest performance boosts
    • Over widest variety of situations
    • Focus attention on these areas

•   Consider Peak load, Not average ones.
    • Performance issues arise when loads are high
Measuring
Performance
    and
 Detecting
Bottlenecks
Measuring Performance

•   The procedure
    1. Create a baseline

    2. Find bottlenecks

    3. Tune system

    4. Compare performance with baseline

    5. Repeat
Measuring Performance

• Performance Monitor
• SQL Traces & SQL Server Profiler
     • And derivatives
•   Extended Events
•   SQL Server Management Studio
•   Activity Monitor
•   Dynamic Management Views
•   Database Tuning Advisor
Performance
Tuning Tools
Performance Monitor
Performance Monitor

• Primarily used to discover hardware bottlenecks
• Can display values that relate to
  processor, memory and disk activities
• And many more counters…


•   Tips
    • Run during heavy load
    • Run it periodically
    • Compare with historical data to analyze server
      activity trends.
Demo:
Perfmon
 Basics
Hardware Counters in
            Performance Monitor

• Processor:% Processor Time
   •  If more than 80-90% for long periods, you might have a CPU
     bottleneck.

• System: Processor Queue Length
   •  Should be less than 4 per processor.
   •  If higher for long periods, you have CPU problem.

• Network Interface: Bytes received/sec
• Network Interface: Bytes sent/sec
   • Compare to adapter bandwidth
Hardware Counters in
               Performance Monitor

• Memory: Memory: Page Faults/sec, pages/sec
   • monitor disk paging which might cause high disk usage and thus, reduce
     performance significantly.
• SQL Server: Memory Manager: Total Server Memory
•                                         ,Target Server
  Memory
   •  Counters should be identical or close

• SQL Server: Buffer Manager: Buffer Cache Hit Ratio
   •  Should be 90% or higher
Hardware Counters in
           Performance Monitor


• PhysicalDisk: Avg. Disk sec/read, sec/write
    • Determines how long a read or write operation takes.
     Should be lower than 20ms (0.02s) at all times

• PhysicalDisk: Avg. Disk reads/sec, writes/sec
    • Determines how many read or write operations occur.
    • A single 15krpm disk supports ~180 iops
• PhysicalDisk: Current Disk Queue Length:
    • Watch out for high values.
• SQL Server: Buffer Manager : Page Reads/sec
                        ,Page Writes/sec
    • Monitor disk activity caused by SQL server
SQL Server Counters in
                     Performance Monitor

• SQLServer: Access Methods : Full scans/sec
   • How many tables scans occur per sec
• SQLServer: SQL Statistics : Batch Requests/sec
   • How many batches are executed per sec
   • Compare to next counter (should be higher)
• SQLServer: SQL Statistics : Compilations/sec
   • How many plans are compiled per sec
   • Compare to next counter (should be higher)
• SQLServer: SQL Statistics : Recompilations/sec
   • How many plans are recompiled per sec
SQL Server Counters in
                          Performance Monitor

• SQLServer: Locks : Lock requests/sec
•     SQLServer: Locks : Lock waits/sec
•     SQLServer: Locks : Average Wait Time (ms)
   • Lock statistics (requests vs. waits)

• And many more
   •   Mirroring
   •   Replication
   •   Service broker
   •   Fulltext Search
   •   SQL Agent
   •   …
Demo:
Perfmon for
 Baselines
Performance Counters Analysis

• Perfmon
• PAL/Relog
  • Console applications for perfmon logs analysis
  • Use to load performance log into a SQL Server database
  • Continue analysis with queries & reports (Excel/SSRS)
  • Use aggregate functions for minimum, maximum and
    average values.
  • Investigate work-hours vs. off-hours, weekdays vs.
    weekends
Demo:
 PAL
Demo:
Resource
 Monitor
Demo:
Custom SQL
 Counters
SQL Trace

•   Instruments the server to generate events
    • Event producer is integrated in SQL server:
        •   Connection Manager
        •   Relational Engine
        •   Storage Engine
        •   Lock and Log Manager

    • Provides a general purpose trace event model
        • Producers (SQL Server, Analysis Services)
        • Consumers (SQL Profiler, SMO Based applications)
SQL Trace Event Examples
•   Capture detailed data from:
    • Connection Manager
        • Batch, RPC, Connection, Disconnect
    • Relational Engine
        • Stored Procedures, SQL statements, Query plans
    • Lock manager
        • Locks, deadlock graph,
    • Auditing
        • Object access (success/failure)
        • Object creation
        • Permissions grant/deny/revoke
SQL Trace

•   Powerful (server side) filtering
    • Thresholds, ranges and equalities
       • Duration > 1000
       • SPID in (10,11,12) (expressed as multiple ==)
    • Include / exclude
       • SQL like ‘exec sp_trace%’
       • Application name not like ‘%profiler%’
    • You may filter by any column
       • DBID, Reads / Writes, Roll name, Severity…
SQL Trace

• Totally configurable
  • Which events to trace
  • Which data to collect (columns)
  • Pick your destination
     • Trace File (.TRC)
         • Server side
         • Client side (via consumer)
     • Consumer application (e.g. SQL Profiler)
     • SQL Server table (via SQL Profiler)
SQL Trace

• Other features:

  • File roll-over on size limit

  • Stop traces based on time and/or size

  • Auto-start traces
    (with jobs or stored procedures)
SQL Trace
SQL Server Profiler
• Used to start, stop, view and analyze SQL traces
• Adds overhead to the low-overhead trace
• Helps discover:
   • Expensive queries
   • Very large sort & hash operations
   • Table searches & updates
   • Index usage
   • Missing join predicates
   • Missing statistics
SQL Server Profiler
• Trace management / analysis client
• Input sources:
   • Real time trace
   • Trace file/table
• Analytical capabilities
   • Filtering, aggregation and sorting
       • find the worst queries
       • counts of events by class
   • Grouping
       • By Application name / host name / SPID
SQL Server Profiler
• Debugging & QA
  • Trace SQL exceptions

  • Multi-user replay
     •   Use the template “TSQL_Replay”
     •   Display resultsets, errors
     •   Measure playback duration
     •   Allows breakpoints & debugging
SQL Trace Tips
• Create your own templates and share them
   • Tdf files in .ToolsProfilerTemplatesMicrosoft SQL Server
• Be selective – don’t trace everything
• The events you would normally trace are RPC:Completed and
  SQL:Batch Completed
• The columns you would usually trace are: TextData, CPU,
  duration, reads, writes, StartTime, EndTime,
• You should also consider adding DatabaseName, HostName,
  RowCounts
• Play with your filters until you get the right balance – enough
  data to analyze, but not too much data.
SQL Trace Tips
• Use Profiler to define your trace.

• Don’t use Profiler to start the trace.

• Instead, save trace definition to script and execute the script
  to get a low-overhead server side script.

• Compare SQL traces before & after performance tuning, to
  show improvement.
Demo:
 Trace
  Best
Practices
SQL Trace Analysis
• Use SQL Profiler for line-by-line analysis

• To find offending queries & stored procedures:
   • Load into a table and aggregate by Textdata
   • Use free tools such as ClearTrace or DBSophic Trace Analyzer

• Get a top 10 list of offending queries, handle them one by
  one, collect another trace and repeat the process until
  requirements are satisfied
Demo:
Tracing
Blocks
Demo:
 Trace
Analyzer
Dynamic Management Objects

• Dynamic management views and functions (DMV) return server
  state information that can be used to monitor the health of a
  server instance, diagnose problems, and tune performance.
• In General, statistics returned by DMVs is not persisted.
• Low overhead
   – Many DMVs expose information that needs to be
      maintained anyway
DMV Categories
Category                            Prefix
Common Language Runtime (CLR)       Sys.dm_clr_*
Database                            Sys.dm_db_*
Indexing                            Sys.dm_db_index_*
Database Mirroring                  Sys.dm_db_mirroring_*
Execution                           Sys.dm_exec_*
Full-Text Search                    Sys.dm_fts_*
I/O                                 Sys.dm_io_*
Query Notifications                 Sys.dm_qn_*
Replication                         Sys.dm_repl_*
Service Broker                      Sys.dm_broker_*
SQL Server Operating System         Sys.dm_os_*
Transactions                        Sys.dm_tran_*
DMV Categories

Category                          Prefix
Change Data Capture               Sys.dm_cdc_*
Object                            Sys.dm_sql_*
Resource Governor                 Sys.dm_resource_governor_*
SQL Server Extended Events        Sys.dm_xe_*
                                  Sys.dm_cryptographic_*
Security                          Sys.dm_provider_*
                                  Sys.dm_audit_*
DMV Examples
• Execution plans
   ‒ sys.dm_exec_query_stats
   ‒ sys.dm_exec_sql_text
   ‒ sys.dm_exec_cached_plans
• Indexes
   ‒ sys.dm_db_index_operational_stats
   ‒ sys.dm_db_index_physical_stats
   ‒ sys.dm_db_missing_index_details
• Database I/O
   ‒ sys.dm_db_file_space_usage
   ‒ sys.dm_io_virtual_file_stats
Demo:
  DMVs and
    sys2
Enhancements
SSMS

• Activity Monitor
  • New features!
• Built in reports
• Execution plans
• Time and IO statistics
Demo:
   SSMS
Tips&Tricks
Database Tuning Advisor

An automatic tuning tool that copes with:
• Retrieval, update & cursor operations
• Multiple databases (single server)
• Optimizer’s plan choices & cost functions
• Single- and multi-column indexes
• Indexes for foreign keys
• Disk space increase & decrease
• “Only add” vs. “replace & add” indexes
• Partitioning & Indexed views
   (Enterprise edition only)
Database Tuning Advisor
•   Goal: Determine Optimal Index Requirements based on query statements
•   Steps:
    • Analyze your SQL workload
        – SQL Script file
        – Trace file
    • Tune a workload
        – Runs a sample selection of queries from the workload through the Query
          Processor with different index combinations and compares query costs
    • Recommend changes
        – Adding, dropping or changing indexes
        – Partitioning
    • Implement changes / save to script
Database Tuning Advisor
DBA has full control over tuning effort, disk space, etc.
DTA Tips
• Use with caution!

• Treat recommendations as such, not all should
  be implemented.

• Creating many indexes isn’t always better.

• It’s always easier to add indexes than to remove
  DTA recommended indexes later.
Extended
   Events:
Tzahi Hakikat
& Keren Bartal
Introducing
                  SQL Server
                2012 Extended
                    Events
                Enhancements

Keren Bartal
Tzahi Hakikat
888 holdings
Agenda

•   About us
•   Introduction to Extended Events
•   Extended Events 2008
•   Extended Events Practical Terminology
•   Extended Events 2012 Enhancements
•   Summary
Agenda

•   About us
•   Introduction to Extended Events
•   Extended Events 2008
•   Extended Events Practical Terminology
•   Extended Events 2012 Enhancements
•   Summary
About 888

• 888.com is a global online gaming company.
• Our purpose is to provide quality
  entertainment for people who enjoy
  gambling.
• Giving them the opportunity to do so in a
  safe, fun, fair, regulated and secure
  environment.
888 Database Environment

50 Production Instances

300 Development Instances

400 Databases

250 TB Of Data

24*7 Availability

99.95 Uptime
Agenda

•   About us
•   Introduction to Extended Events
•   Extended Events 2008
•   Extended Events Practical Terminology
•   Extended Events 2012 Enhancements
•   Summary
Extended Events
• General event-handling system for windows
  servers
• Used for problem diagnosis and info gathering
  and auditing
• The Extended Events infrastructure supports
  the correlation of data from SQL Server and
  OS
Extended Events
• Support 7 different types of targets
• Event and consumer agnostic
  – Any event can be processed by any consumer
  – New events can be added, immediately useable
• Rich predicate system for filtering
• Less overhead than server-side trace queues
  – 10,000 events processed will consume 1% of
    single 2GHz processor
Agenda

•   About us
•   Introduction to Extended Events
•   Extended Events 2008
•   Extended Events Practical Terminology
•   Extended Events 2012 Enhancements
•   Summary
Extended Events 2008

                        •

            Profiler-   •

                        •
                        •
Extended Events 2008
        drawbacks
• XE required extensive understanding of
  system catalog views and DMVs
• Event Sessions could only be managed
  through the use of DDL commands
• Reading target data requires the use of
  XQuery
Extended Event Metadata
•   Catalog views for defined session info
     –   server_event_sessions
     –   server_event_session_target
     –   server_event_session_fields
     –   server_event_session_actions
     –   server_event_session_events
•   DMVs for Event System Metadata
     –   dm_xe_package
     –   dm_xe_objects
     –   dm_xe_object_columns
     –   dm_xe_map_values
•   DMVs for currently active session info
     –   dm_xe_sessions
     –   dm_xe_session_targets
     –   dm_xe_events
     –   dm_xe_event_actions
     –   dm_xe_object_columns
Demo
Capture errors with XE 2008

• Find events and actions
• Create a new event session
• View the output
Agenda

•   About us
•   Introduction to Extended Events
•   Extended Events 2008
•   Extended Events Practical Terminology
•   Extended Events 2012 Enhancements
•   Summary
Extended Events Objects


                          Module


                          Packages


Events    Targets   Actions          Types   Predicates   Maps
Packages
• Packages are metadata containers
• Packages register at module load time
• 9 available packages
     • package0 - XE system objects (default)
     • sqlserver - SQL Server related objects
     • sqlos - SQL Server Operating System (SQLOS) related
       objects
• SQL audit uses private XE package
Events

•   An event is a well known point in code
•   Unique schema for each event
•   Supports optional fields
•   Events fire synchronously
•   264 events in 2008 R2
•   618 events in 2012
Actions
• programmatic response or series of responses
  to an event
• Can be added to any event
• Adds data to the event payload
• Actions are invoked synchronously
• Trigger a memory dump
Demo
Capture errors using the XE UI

• Create an event session
• Configure action
• Watch live data
Targets
• Target is an event consumer
  – Can be synchronous or asynchronous
• Target types
  –   event_file
  –   event_counter
  –   histogram
  –   etw_classic_sync_target
  –   pair_matching
  –   ring_buffer
  –   event_stream
Demo
Monitor locks
Present different types of targets

•   Ring buffer
•   Event file
•   Event counter
•   Histogram
•   Pair Matching
•   Etw_classic_sync_target
Predicates
• Predicates are a set of logical rules that are
  used to evaluate events when they are
  processed.
• Boolean expressions using flexible operators
  • Event data
  • Action data
  • Global State
Demo
Activity Tracking

Present different types of Predicates

• Event Predicates
• Action Predicates
• Global Predicates
Event Session
• The materialization of combination of metadata
  elements of XE architecture
• Multiple targets per session
• Event can be in many sessions
   – Actions/Predicates are per event
• Event Session can specify what to do if target can't
  keep up
• Event Session defines data retention
• Event session can add or remove events on runtime
Event Session
Event life cycle
Pre-Collect                       Collection                             Predicate evaluation

                             Customizable attribute check
IsEnabled check                                                                Predicate evaluation

                                 Event data collected


                                          Publish


  Actions executed   Synchronous targets served             Event data buffered for asynchronous targets
Agenda

•   About us
•   Introduction to Extended Events
•   Extended Events 2008
•   Extended Events Practical Terminology
•   Extended Events 2012 Enhancements
•   Summary
Extended Events 2012
        Enhancements
• User Interface
  – Advanced & Wizard UI for creating and managing
  – Display & Analysis
• Expanded to other systems
  – Analysis Services, Replication, PDW
• Managed code
  – Powershell object model for runtime and meta
    data
  – Reader API for XEL files and near real time stream
User Interface

• Event Session list
  – Provides a list of Event Sessions
• New Session Wizard
  – Provides a simplified experience for creating an
    Event Session
• Extended Events display
  – Tabbed windows that display Extended Events
    trace data
Demo
Capture queries and group by query hash

• Grouping
• Aggregation
• Save XE to a table
Extended Events Management
        API
• Management API provides the ability to create
  and modify event sessions
• Provides a complete object model for XE
  usage by managed applications
• Provides a XEReader API for reading event files
  and event streams coming from a running
  event session on a server
Agenda

•   About us
•   Introduction to Extended Events
•   Extended Events 2008
•   Extended Events Practical Terminology
•   Extended Events 2012 Enhancements
•   Summary
Extended Event Use Cases

• Proactive monitoring
  – Application errors
  – Errors log
  – Event grouping
• Troubleshooting
  – Page Split
  – blocking
• Audit
  – Monitor the access of privileged and non privileged
    users
The Profiler’s grave
Summary

• SQL Server 2012 offers simplified diagnostic
  tracing with Extended Events
  – Management Studio integration provides SQL
    Server Profiler functionality for Extended Events
    allowing Event Sessions to be created, modified,
    and scripted
  – Management API allows managed applications to
    be developed that leverage Extended Events

SQL Explore 2012: P&T Part 1

  • 1.
  • 2.
    Principles of performancetuning • The Goal: • Minimum response time and Maximum throughput • Reduce network traffic, disk I/O, memory usage and CPU time • This is achieved through understanding: • Application requirements • Logical and physical structure of the data • Tradeoffs between conflicting uses of the database. (OLTP vs. DSS) • Start optimizing in early stage of development. It tends to be much harder later.
  • 3.
    Principles of performancetuning • Good design will reduce performance problems: • Architecture • Application & queries • Database • Hardware • Identify the areas that will yield the largest performance boosts • Over widest variety of situations • Focus attention on these areas • Consider Peak load, Not average ones. • Performance issues arise when loads are high
  • 4.
    Measuring Performance and Detecting Bottlenecks
  • 5.
    Measuring Performance • The procedure 1. Create a baseline 2. Find bottlenecks 3. Tune system 4. Compare performance with baseline 5. Repeat
  • 6.
    Measuring Performance • PerformanceMonitor • SQL Traces & SQL Server Profiler • And derivatives • Extended Events • SQL Server Management Studio • Activity Monitor • Dynamic Management Views • Database Tuning Advisor
  • 7.
  • 8.
  • 9.
    Performance Monitor • Primarilyused to discover hardware bottlenecks • Can display values that relate to processor, memory and disk activities • And many more counters… • Tips • Run during heavy load • Run it periodically • Compare with historical data to analyze server activity trends.
  • 10.
  • 11.
    Hardware Counters in Performance Monitor • Processor:% Processor Time •  If more than 80-90% for long periods, you might have a CPU bottleneck. • System: Processor Queue Length •  Should be less than 4 per processor. •  If higher for long periods, you have CPU problem. • Network Interface: Bytes received/sec • Network Interface: Bytes sent/sec • Compare to adapter bandwidth
  • 12.
    Hardware Counters in Performance Monitor • Memory: Memory: Page Faults/sec, pages/sec • monitor disk paging which might cause high disk usage and thus, reduce performance significantly. • SQL Server: Memory Manager: Total Server Memory • ,Target Server Memory •  Counters should be identical or close • SQL Server: Buffer Manager: Buffer Cache Hit Ratio •  Should be 90% or higher
  • 13.
    Hardware Counters in Performance Monitor • PhysicalDisk: Avg. Disk sec/read, sec/write • Determines how long a read or write operation takes.  Should be lower than 20ms (0.02s) at all times • PhysicalDisk: Avg. Disk reads/sec, writes/sec • Determines how many read or write operations occur. • A single 15krpm disk supports ~180 iops • PhysicalDisk: Current Disk Queue Length: • Watch out for high values. • SQL Server: Buffer Manager : Page Reads/sec ,Page Writes/sec • Monitor disk activity caused by SQL server
  • 14.
    SQL Server Countersin Performance Monitor • SQLServer: Access Methods : Full scans/sec • How many tables scans occur per sec • SQLServer: SQL Statistics : Batch Requests/sec • How many batches are executed per sec • Compare to next counter (should be higher) • SQLServer: SQL Statistics : Compilations/sec • How many plans are compiled per sec • Compare to next counter (should be higher) • SQLServer: SQL Statistics : Recompilations/sec • How many plans are recompiled per sec
  • 15.
    SQL Server Countersin Performance Monitor • SQLServer: Locks : Lock requests/sec • SQLServer: Locks : Lock waits/sec • SQLServer: Locks : Average Wait Time (ms) • Lock statistics (requests vs. waits) • And many more • Mirroring • Replication • Service broker • Fulltext Search • SQL Agent • …
  • 16.
  • 17.
    Performance Counters Analysis •Perfmon • PAL/Relog • Console applications for perfmon logs analysis • Use to load performance log into a SQL Server database • Continue analysis with queries & reports (Excel/SSRS) • Use aggregate functions for minimum, maximum and average values. • Investigate work-hours vs. off-hours, weekdays vs. weekends
  • 18.
  • 19.
  • 20.
  • 21.
    SQL Trace • Instruments the server to generate events • Event producer is integrated in SQL server: • Connection Manager • Relational Engine • Storage Engine • Lock and Log Manager • Provides a general purpose trace event model • Producers (SQL Server, Analysis Services) • Consumers (SQL Profiler, SMO Based applications)
  • 22.
    SQL Trace EventExamples • Capture detailed data from: • Connection Manager • Batch, RPC, Connection, Disconnect • Relational Engine • Stored Procedures, SQL statements, Query plans • Lock manager • Locks, deadlock graph, • Auditing • Object access (success/failure) • Object creation • Permissions grant/deny/revoke
  • 23.
    SQL Trace • Powerful (server side) filtering • Thresholds, ranges and equalities • Duration > 1000 • SPID in (10,11,12) (expressed as multiple ==) • Include / exclude • SQL like ‘exec sp_trace%’ • Application name not like ‘%profiler%’ • You may filter by any column • DBID, Reads / Writes, Roll name, Severity…
  • 24.
    SQL Trace • Totallyconfigurable • Which events to trace • Which data to collect (columns) • Pick your destination • Trace File (.TRC) • Server side • Client side (via consumer) • Consumer application (e.g. SQL Profiler) • SQL Server table (via SQL Profiler)
  • 25.
    SQL Trace • Otherfeatures: • File roll-over on size limit • Stop traces based on time and/or size • Auto-start traces (with jobs or stored procedures)
  • 26.
  • 27.
    SQL Server Profiler •Used to start, stop, view and analyze SQL traces • Adds overhead to the low-overhead trace • Helps discover: • Expensive queries • Very large sort & hash operations • Table searches & updates • Index usage • Missing join predicates • Missing statistics
  • 28.
    SQL Server Profiler •Trace management / analysis client • Input sources: • Real time trace • Trace file/table • Analytical capabilities • Filtering, aggregation and sorting • find the worst queries • counts of events by class • Grouping • By Application name / host name / SPID
  • 29.
    SQL Server Profiler •Debugging & QA • Trace SQL exceptions • Multi-user replay • Use the template “TSQL_Replay” • Display resultsets, errors • Measure playback duration • Allows breakpoints & debugging
  • 30.
    SQL Trace Tips •Create your own templates and share them • Tdf files in .ToolsProfilerTemplatesMicrosoft SQL Server • Be selective – don’t trace everything • The events you would normally trace are RPC:Completed and SQL:Batch Completed • The columns you would usually trace are: TextData, CPU, duration, reads, writes, StartTime, EndTime, • You should also consider adding DatabaseName, HostName, RowCounts • Play with your filters until you get the right balance – enough data to analyze, but not too much data.
  • 31.
    SQL Trace Tips •Use Profiler to define your trace. • Don’t use Profiler to start the trace. • Instead, save trace definition to script and execute the script to get a low-overhead server side script. • Compare SQL traces before & after performance tuning, to show improvement.
  • 32.
    Demo: Trace Best Practices
  • 33.
    SQL Trace Analysis •Use SQL Profiler for line-by-line analysis • To find offending queries & stored procedures: • Load into a table and aggregate by Textdata • Use free tools such as ClearTrace or DBSophic Trace Analyzer • Get a top 10 list of offending queries, handle them one by one, collect another trace and repeat the process until requirements are satisfied
  • 34.
  • 35.
  • 36.
    Dynamic Management Objects •Dynamic management views and functions (DMV) return server state information that can be used to monitor the health of a server instance, diagnose problems, and tune performance. • In General, statistics returned by DMVs is not persisted. • Low overhead – Many DMVs expose information that needs to be maintained anyway
  • 37.
    DMV Categories Category Prefix Common Language Runtime (CLR) Sys.dm_clr_* Database Sys.dm_db_* Indexing Sys.dm_db_index_* Database Mirroring Sys.dm_db_mirroring_* Execution Sys.dm_exec_* Full-Text Search Sys.dm_fts_* I/O Sys.dm_io_* Query Notifications Sys.dm_qn_* Replication Sys.dm_repl_* Service Broker Sys.dm_broker_* SQL Server Operating System Sys.dm_os_* Transactions Sys.dm_tran_*
  • 38.
    DMV Categories Category Prefix Change Data Capture Sys.dm_cdc_* Object Sys.dm_sql_* Resource Governor Sys.dm_resource_governor_* SQL Server Extended Events Sys.dm_xe_* Sys.dm_cryptographic_* Security Sys.dm_provider_* Sys.dm_audit_*
  • 39.
    DMV Examples • Executionplans ‒ sys.dm_exec_query_stats ‒ sys.dm_exec_sql_text ‒ sys.dm_exec_cached_plans • Indexes ‒ sys.dm_db_index_operational_stats ‒ sys.dm_db_index_physical_stats ‒ sys.dm_db_missing_index_details • Database I/O ‒ sys.dm_db_file_space_usage ‒ sys.dm_io_virtual_file_stats
  • 40.
    Demo: DMVsand sys2 Enhancements
  • 41.
    SSMS • Activity Monitor • New features! • Built in reports • Execution plans • Time and IO statistics
  • 42.
    Demo: SSMS Tips&Tricks
  • 43.
  • 44.
    Database Tuning Advisor Anautomatic tuning tool that copes with: • Retrieval, update & cursor operations • Multiple databases (single server) • Optimizer’s plan choices & cost functions • Single- and multi-column indexes • Indexes for foreign keys • Disk space increase & decrease • “Only add” vs. “replace & add” indexes • Partitioning & Indexed views (Enterprise edition only)
  • 45.
    Database Tuning Advisor • Goal: Determine Optimal Index Requirements based on query statements • Steps: • Analyze your SQL workload – SQL Script file – Trace file • Tune a workload – Runs a sample selection of queries from the workload through the Query Processor with different index combinations and compares query costs • Recommend changes – Adding, dropping or changing indexes – Partitioning • Implement changes / save to script
  • 46.
    Database Tuning Advisor DBAhas full control over tuning effort, disk space, etc.
  • 47.
    DTA Tips • Usewith caution! • Treat recommendations as such, not all should be implemented. • Creating many indexes isn’t always better. • It’s always easier to add indexes than to remove DTA recommended indexes later.
  • 48.
    Extended Events: Tzahi Hakikat & Keren Bartal
  • 49.
    Introducing SQL Server 2012 Extended Events Enhancements Keren Bartal Tzahi Hakikat 888 holdings
  • 50.
    Agenda • About us • Introduction to Extended Events • Extended Events 2008 • Extended Events Practical Terminology • Extended Events 2012 Enhancements • Summary
  • 51.
    Agenda • About us • Introduction to Extended Events • Extended Events 2008 • Extended Events Practical Terminology • Extended Events 2012 Enhancements • Summary
  • 52.
    About 888 • 888.comis a global online gaming company. • Our purpose is to provide quality entertainment for people who enjoy gambling. • Giving them the opportunity to do so in a safe, fun, fair, regulated and secure environment.
  • 54.
    888 Database Environment 50Production Instances 300 Development Instances 400 Databases 250 TB Of Data 24*7 Availability 99.95 Uptime
  • 55.
    Agenda • About us • Introduction to Extended Events • Extended Events 2008 • Extended Events Practical Terminology • Extended Events 2012 Enhancements • Summary
  • 56.
    Extended Events • Generalevent-handling system for windows servers • Used for problem diagnosis and info gathering and auditing • The Extended Events infrastructure supports the correlation of data from SQL Server and OS
  • 57.
    Extended Events • Support7 different types of targets • Event and consumer agnostic – Any event can be processed by any consumer – New events can be added, immediately useable • Rich predicate system for filtering • Less overhead than server-side trace queues – 10,000 events processed will consume 1% of single 2GHz processor
  • 58.
    Agenda • About us • Introduction to Extended Events • Extended Events 2008 • Extended Events Practical Terminology • Extended Events 2012 Enhancements • Summary
  • 59.
    Extended Events 2008 • Profiler- • • •
  • 60.
    Extended Events 2008 drawbacks • XE required extensive understanding of system catalog views and DMVs • Event Sessions could only be managed through the use of DDL commands • Reading target data requires the use of XQuery
  • 61.
    Extended Event Metadata • Catalog views for defined session info – server_event_sessions – server_event_session_target – server_event_session_fields – server_event_session_actions – server_event_session_events • DMVs for Event System Metadata – dm_xe_package – dm_xe_objects – dm_xe_object_columns – dm_xe_map_values • DMVs for currently active session info – dm_xe_sessions – dm_xe_session_targets – dm_xe_events – dm_xe_event_actions – dm_xe_object_columns
  • 62.
    Demo Capture errors withXE 2008 • Find events and actions • Create a new event session • View the output
  • 63.
    Agenda • About us • Introduction to Extended Events • Extended Events 2008 • Extended Events Practical Terminology • Extended Events 2012 Enhancements • Summary
  • 64.
    Extended Events Objects Module Packages Events Targets Actions Types Predicates Maps
  • 65.
    Packages • Packages aremetadata containers • Packages register at module load time • 9 available packages • package0 - XE system objects (default) • sqlserver - SQL Server related objects • sqlos - SQL Server Operating System (SQLOS) related objects • SQL audit uses private XE package
  • 66.
    Events • An event is a well known point in code • Unique schema for each event • Supports optional fields • Events fire synchronously • 264 events in 2008 R2 • 618 events in 2012
  • 67.
    Actions • programmatic responseor series of responses to an event • Can be added to any event • Adds data to the event payload • Actions are invoked synchronously • Trigger a memory dump
  • 68.
    Demo Capture errors usingthe XE UI • Create an event session • Configure action • Watch live data
  • 69.
    Targets • Target isan event consumer – Can be synchronous or asynchronous • Target types – event_file – event_counter – histogram – etw_classic_sync_target – pair_matching – ring_buffer – event_stream
  • 70.
    Demo Monitor locks Present differenttypes of targets • Ring buffer • Event file • Event counter • Histogram • Pair Matching • Etw_classic_sync_target
  • 71.
    Predicates • Predicates area set of logical rules that are used to evaluate events when they are processed. • Boolean expressions using flexible operators • Event data • Action data • Global State
  • 72.
    Demo Activity Tracking Present differenttypes of Predicates • Event Predicates • Action Predicates • Global Predicates
  • 73.
    Event Session • Thematerialization of combination of metadata elements of XE architecture • Multiple targets per session • Event can be in many sessions – Actions/Predicates are per event • Event Session can specify what to do if target can't keep up • Event Session defines data retention • Event session can add or remove events on runtime
  • 74.
  • 75.
    Event life cycle Pre-Collect Collection Predicate evaluation Customizable attribute check IsEnabled check Predicate evaluation Event data collected Publish Actions executed Synchronous targets served Event data buffered for asynchronous targets
  • 76.
    Agenda • About us • Introduction to Extended Events • Extended Events 2008 • Extended Events Practical Terminology • Extended Events 2012 Enhancements • Summary
  • 77.
    Extended Events 2012 Enhancements • User Interface – Advanced & Wizard UI for creating and managing – Display & Analysis • Expanded to other systems – Analysis Services, Replication, PDW • Managed code – Powershell object model for runtime and meta data – Reader API for XEL files and near real time stream
  • 78.
    User Interface • EventSession list – Provides a list of Event Sessions • New Session Wizard – Provides a simplified experience for creating an Event Session • Extended Events display – Tabbed windows that display Extended Events trace data
  • 79.
    Demo Capture queries andgroup by query hash • Grouping • Aggregation • Save XE to a table
  • 80.
    Extended Events Management API • Management API provides the ability to create and modify event sessions • Provides a complete object model for XE usage by managed applications • Provides a XEReader API for reading event files and event streams coming from a running event session on a server
  • 81.
    Agenda • About us • Introduction to Extended Events • Extended Events 2008 • Extended Events Practical Terminology • Extended Events 2012 Enhancements • Summary
  • 82.
    Extended Event UseCases • Proactive monitoring – Application errors – Errors log – Event grouping • Troubleshooting – Page Split – blocking • Audit – Monitor the access of privileged and non privileged users
  • 83.
  • 84.
    Summary • SQL Server2012 offers simplified diagnostic tracing with Extended Events – Management Studio integration provides SQL Server Profiler functionality for Extended Events allowing Event Sessions to be created, modified, and scripted – Management API allows managed applications to be developed that leverage Extended Events

Editor's Notes

  • #54 Event: sql_statement_completedActions:plan_handle, query_hash, session_id, sql_textTargets: histogram on query_hash, event fileIn target display – choose columns: cpu_time, duration, logical_reads, query_hashGroup by query_hashFrom XE menu – aggregate by cpu_time and durationSave to table
  • #60 http://www.sqlserver.co.il/?p=1574
  • #61 Demo – extended event 2008 . Create session that record log wait.Start session Read result Stop session -- system catalog?
  • #63 Catching errors with profiler: errors and warnings -> user error message -> column filters -> severity >= 16Can’t see the actual query that caused the errorXE allows us to add additional fields like sql_text, using an uncomfortable UI to create the capture and then script to parse the xml data
  • #65 Module – exe or dllPackage - a container for XE objects
  • #66 package0 - XE system objects (default)sqlserver - SQL Server related objectssqlos - SQL Server Operating System (SQLOS) related objects
  • #67 monitoring points of interest the code
  • #68 Actions are:programmatic response or series of responses to an eventActions are invoked synchronously on the thread that fired the eventActions can:Capture a stack dump and inspect data.Store state information in a local context using variable storage.Aggregate event data.Append data to event data.Examples of actions:Stack dumperExecution plan detection (SQL Server only)Transact-SQL stack collection (SQL Server only)Run time statistics calculationGather user input on exception
  • #69 Create event session Event: error_reportedActions: client_app_name, database_name, session_id, sql_text(no target)
  • #71 Events: lock_acquired, lock_releasedActions: client_app_name, database_name, session_id, sql_textTargets:Ring buffer – store data in the memory, cyclic. Watch live data view target (xml)Parse ring buffer XMLEvent file –data is saved in a file, can be archived and reviewed at different timesView targetEvent counter – Counts the number of eventsHistogram – aggregate data on specific event data field or actionFilter on lock_acquiredBase buckets on field mode (type of lock)Pair Matching – pair two related events and output only events that are not matchedBegin with: lock_acquired, end with: lock_releasedActions: session_id, resource_0, resource_1, resource_2Etw_classic_sync_targetLocks types: 0=NULL - Compatible with all other lock modes (LCK_M_NL)1=Schema Stability lock (LCK_M_SCH_S)2=Schema Modification Lock (LCK_M_SCH_M)3=Shared Lock (LCK_M_S)4=Update Lock (LCK_M_U)5=Exclusive Lock (LCK_M_X)6=Intent Shared Lock (LCK_M_IS)7=Intent Update Lock (LCK_M_IU)8=Intent Exclusive Lock (LCK_M_IX)9=Shared with intent to Update (LCK_M_SIU)10=Shared with Intent Exclusive (LCK_M_SIX)11=Update with Intent Exclusive (LCK_M_UIX)12=Bulk Update Lock (LCK_M_BU)13=Key range Shared/Shared (LCK_M_RS_S)14=Key range Shared/Update (LCK_M_RS_U)15=Key Range Insert NULL (LCK_M_RI_NL)16=Key Range Insert Shared (LCK_M_RI_S)17=Key Range Insert Update (LCK_M_RI_U)18=Key Range Insert Exclusive (LCK_M_RI_X)19=Key Range Exclusive Shared (LCK_M_RX_S)20=Key Range Exclusive Update (LCK_M_RX_U)21=Key Range Exclusive Exclusive (LCK_M_RX_X)
  • #72 This enables the Extended Events user to selectively capture event data based on specific criteria.New operator – modulus, gt mod, lt mod….
  • #73 Fix template…?
  • #74 The mapping between package objects and sessions is many to many, which means that that an object can appear in several sessions, and a session can contain several objects.
  • #75 The materialization of combination of metadata elements of XE architecture
  • #76 Not sure is needed
  • #78 UI for creation and management
  • #80 Event: sql_statement_completedActions:plan_handle, query_hash, session_id, sql_textTargets: histogram on query_hash, event fileIn target display – choose columns: cpu_time, duration, logical_reads, query_hashGroup by query_hashFrom XE menu – aggregate by cpu_time and durationSave to table
  • #84 dbo.trace_xe_event_maphttp://blogs.msdn.com/b/extended_events/archive/2010/12/10/migrating-from-sql-trace-to-extended-events.aspxUSE MASTER; GO USE MASTER; GO SELECT DISTINCT    tb.trace_event_id,    te.name AS 'Event Class',    em.package_name AS 'Package',    em.xe_event_name AS 'XEvent Name',    tb.trace_column_id,    tc.name AS 'SQL Trace Column',    am.xe_action_name as 'Extended Events action' FROM (sys.trace_eventsteLEFT OUTER JOIN sys.trace_xe_event_mapem    ON te.trace_event_id = em.trace_event_id) LEFT OUTER JOIN sys.trace_event_bindingstb    ON em.trace_event_id = tb.trace_event_idLEFT OUTER JOIN sys.trace_columnstc    ON tb.trace_column_id = tc.trace_column_idLEFT OUTER JOIN sys.trace_xe_action_map am    ON tc.trace_column_id = am.trace_column_id ORDER BY te.name, tc.name