Download as PDF, PPTX


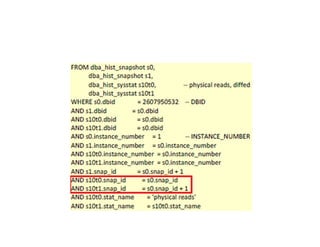


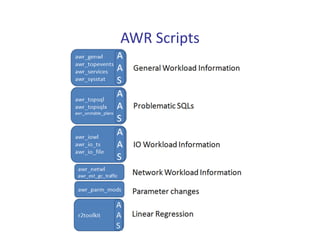


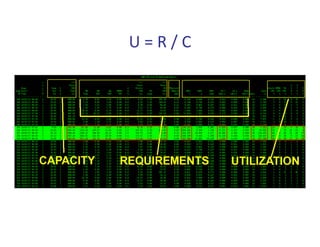


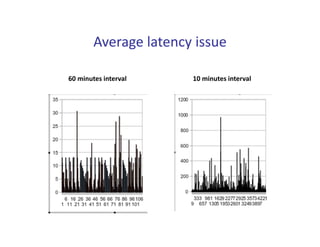
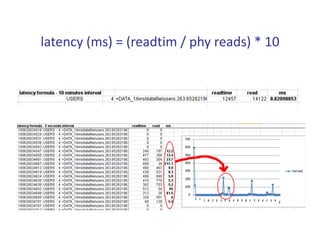


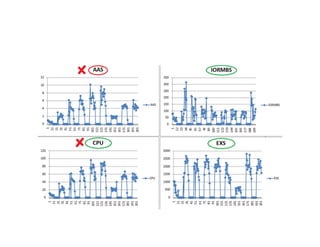

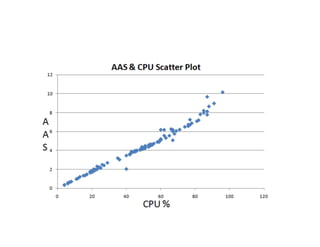

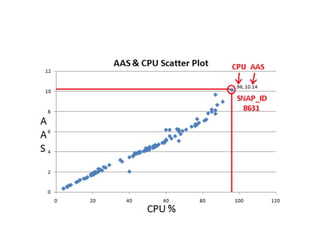


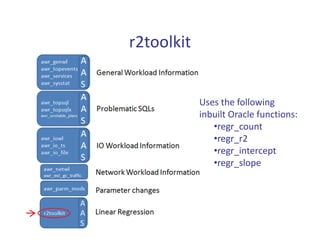


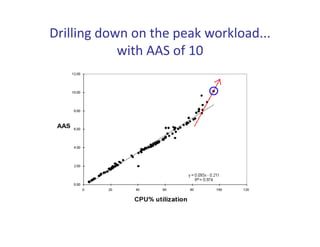

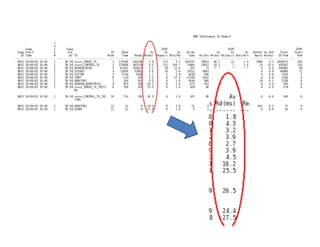

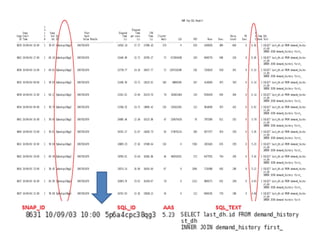
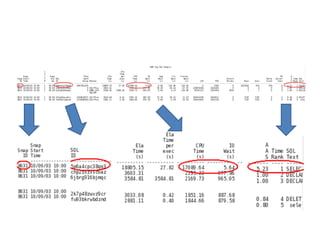
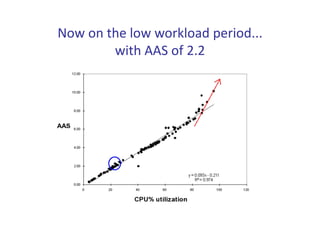


This document discusses mining the Automatic Workload Repository (AWR) for capacity planning and visualization purposes. It summarizes Karl Arao's presentation on using AWR data to understand system performance over time, identify bottlenecks, and perform capacity planning. Tools mentioned include AWR scripts, visualization techniques like double Y-axis graphs, and statistical methods like linear regression to model relationships between metrics like average active sessions and CPU utilization.