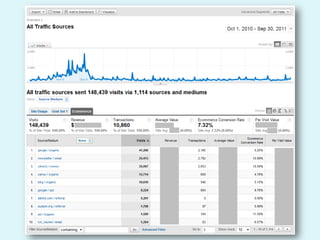
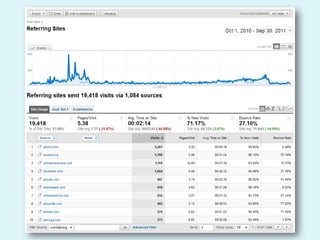
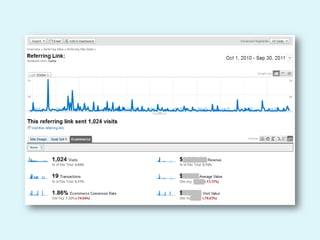
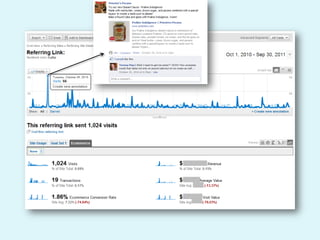
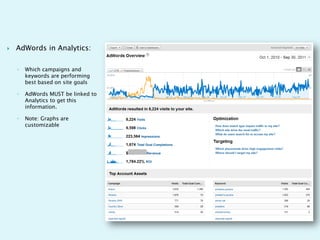
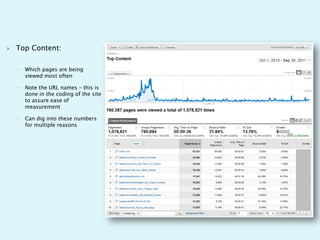
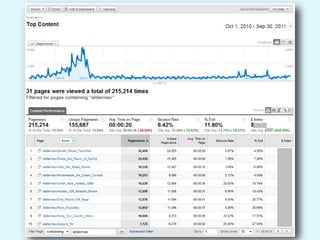
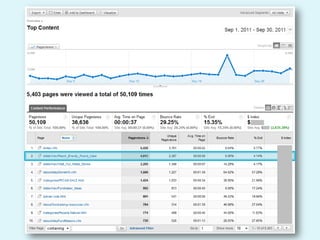
Jenny Rankin, Kinetic Communications
   What are Web Analytics

   Why is this Important

   Getting Started

   Case Study Example

   Google Analytics 101
   Broad Definition: The monitoring and reporting of how users
    interact with a website.

   Specific definition varies based on goals and objectives of
    each website.

   Don’t just measure for the sake of measuring.
   General awareness of the audience visiting your site
   Make improvements to your site
    ◦ Enhance the user experience

    ◦ Help you get more out of your website

    ◦ Help your audience get more out of your website

   Track and increase your return on investment
    ◦ Tie interactive marketing efforts to conversions
   Website traffic patterns
   Visitor behavior and profiling
   Conversions and leads
   Tying conversions back to various marketing efforts,
    including:
    ◦ Search engine marketing

    ◦ Email marketing

    ◦ Display advertising

    ◦ Social media efforts

    ◦ Special promotions
   Set goals and objectives for your website.

   Set goals and objectives for any interactive marketing efforts
    you engage in.

   How will you measure success?

   Make sure your site is optimized for measurement.

   Find the right analytics tools.

   Set aside time to monitor each month.

   Plan a reporting mechanism.
   Ultimate interactive purpose: Drive sales

   Interactive marketing in place:
    ◦ E-commerce website
    ◦ Email marketing
    ◦ Pay-per-click advertising
    ◦ Homepage sliders advertising sales, new products, etc.
    ◦ Social media presence on Facebook & Twitter
   The website accounts for 35% of Priester’s annual direct-to-
    consumer sales.
    ◦ Seasonal product: 45% of site traffic and 74% of revenue comes in
      November & December
    ◦ They have seen a 39% increase in online sales over the past 5 years, even
      with the slow economy.
    ◦ One in 14 visitors to the site makes a purchase (conversion rate of 7.32%)
   E-news: the past 12 months
    ◦ Email marketing accounted for 17% of the website’s traffic and 25% of the
      site’s revenue last year.
    ◦ The conversion rate for e-news traffic is 10.99% compared to 7.32% for
      the entire site.
    ◦ 812 new subscribers through the site, bringing our list to more than
      22,000 subscribers
    ◦ Average open rate of 10.27%
    ◦ Average click-through rate of 19.81%
   Pay-Per Click Advertising: the past 12 months
    ◦ Google AdWords accounted for 6% of site traffic and 8% of its revenue for
      the entire year.
       82% of that traffic and 89% of the revenue came from November and December
        alone.

       Priester’s return on investment from AdWords for the past year was 1,784.2%.

       The conversion rate for Google CPC traffic is 9.78% compared to 7.32% for the
        entire site.

    ◦ Shopzilla.com (A pay-per-click referral engine for shoppers)
       Sends very affordable traffic our way at only $0.25 per click

       8th highest non-search engine referring site

       Conversion rate of 1%
   Homepage Sliders
    ◦ Changed at least once a month to advertise a new product or promotion
    ◦ Once visitors arrive at the home page, over 98% enter the site through one
      of the sliders.
    ◦ New sliders determined by top searched items, top selling items and
      previous performance of slider message bringing in revenue

   Social Media
    ◦ 3,100 Facebook Fans; 2,697 Twitter Followers
    ◦ Facebook is the 4th top non-search engine referring site to Priesters.com
      with nearly a 2% conversion rate
Making an Impact for
Priester’s Pecan’s
   Google Analytics 101

    ◦ Visitor Information

    ◦ Geography Detail

    ◦ Traffic Sources

    ◦ Top Content

    ◦ E-Commerce Overview

    ◦ AdWords Overview

    ◦ Internal Search Engines

    ◦ Funnel Analysis
   Visitors Overview:

    ◦   The most basic information
        available through Google
        Analytics.

    ◦   Track over time if your goal
        is to increase traffic, etc.

    ◦   Use the technical profile to
        know how your users are
        accessing your site
   All Traffic Sources:

    ◦   Which sources send visitors
        who are more likely to be
        qualified leads

    ◦   Site Usage

    ◦   Goals Set

    ◦   Ecommerce

    ◦   Shows whether your paid
        investments are qualified
        leads
   Ecommerce

    ◦   Only visible if you are selling
        through your site.

    ◦   Which products are selling
        best.

    ◦   Which sources are bringing in
        the most sales
   AdWords in Analytics:

    ◦   Which campaigns and
        keywords are performing
        best based on site goals

    ◦   AdWords MUST be linked to
        Analytics to get this
        information.

    ◦   Note: Graphs are
        customizable
   Top Content:

    ◦   Which pages are being
        viewed most often

    ◦   Note the URL names – this is
        done in the coding of the site
        to assure ease of
        measurement

    ◦   Can dig into these numbers
        for multiple reasons
   Site Search Engine:

    ◦   Check to see if you have
        keywords with high search
        numbers.

    ◦   Helps to make desired
        content more readily
        available to your audience.
   Goal Funnels:

    ◦   Set Conversion Goals within
        Analytics

    ◦   Track how many people you
        convert

    ◦   How many people abandoned
        the conversion and where
        along the process

    ◦   Can help make the process
        easier on users
Connect after the conference:
Jenny@kinetic.com

Optimizing Website Performance - Kinetic

  • 1.
    Jenny Rankin, KineticCommunications
  • 2.
    What are Web Analytics  Why is this Important  Getting Started  Case Study Example  Google Analytics 101
  • 3.
    Broad Definition: The monitoring and reporting of how users interact with a website.  Specific definition varies based on goals and objectives of each website.  Don’t just measure for the sake of measuring.
  • 4.
    General awareness of the audience visiting your site  Make improvements to your site ◦ Enhance the user experience ◦ Help you get more out of your website ◦ Help your audience get more out of your website  Track and increase your return on investment ◦ Tie interactive marketing efforts to conversions
  • 5.
    Website traffic patterns  Visitor behavior and profiling  Conversions and leads  Tying conversions back to various marketing efforts, including: ◦ Search engine marketing ◦ Email marketing ◦ Display advertising ◦ Social media efforts ◦ Special promotions
  • 6.
    Set goals and objectives for your website.  Set goals and objectives for any interactive marketing efforts you engage in.  How will you measure success?  Make sure your site is optimized for measurement.  Find the right analytics tools.  Set aside time to monitor each month.  Plan a reporting mechanism.
  • 7.
    Ultimate interactive purpose: Drive sales  Interactive marketing in place: ◦ E-commerce website ◦ Email marketing ◦ Pay-per-click advertising ◦ Homepage sliders advertising sales, new products, etc. ◦ Social media presence on Facebook & Twitter
  • 9.
    The website accounts for 35% of Priester’s annual direct-to- consumer sales. ◦ Seasonal product: 45% of site traffic and 74% of revenue comes in November & December ◦ They have seen a 39% increase in online sales over the past 5 years, even with the slow economy. ◦ One in 14 visitors to the site makes a purchase (conversion rate of 7.32%)
  • 10.
    E-news: the past 12 months ◦ Email marketing accounted for 17% of the website’s traffic and 25% of the site’s revenue last year. ◦ The conversion rate for e-news traffic is 10.99% compared to 7.32% for the entire site. ◦ 812 new subscribers through the site, bringing our list to more than 22,000 subscribers ◦ Average open rate of 10.27% ◦ Average click-through rate of 19.81%
  • 11.
    Pay-Per Click Advertising: the past 12 months ◦ Google AdWords accounted for 6% of site traffic and 8% of its revenue for the entire year.  82% of that traffic and 89% of the revenue came from November and December alone.  Priester’s return on investment from AdWords for the past year was 1,784.2%.  The conversion rate for Google CPC traffic is 9.78% compared to 7.32% for the entire site. ◦ Shopzilla.com (A pay-per-click referral engine for shoppers)  Sends very affordable traffic our way at only $0.25 per click  8th highest non-search engine referring site  Conversion rate of 1%
  • 12.
    Homepage Sliders ◦ Changed at least once a month to advertise a new product or promotion ◦ Once visitors arrive at the home page, over 98% enter the site through one of the sliders. ◦ New sliders determined by top searched items, top selling items and previous performance of slider message bringing in revenue  Social Media ◦ 3,100 Facebook Fans; 2,697 Twitter Followers ◦ Facebook is the 4th top non-search engine referring site to Priesters.com with nearly a 2% conversion rate
  • 13.
    Making an Impactfor Priester’s Pecan’s
  • 14.
    Google Analytics 101 ◦ Visitor Information ◦ Geography Detail ◦ Traffic Sources ◦ Top Content ◦ E-Commerce Overview ◦ AdWords Overview ◦ Internal Search Engines ◦ Funnel Analysis
  • 15.
    Visitors Overview: ◦ The most basic information available through Google Analytics. ◦ Track over time if your goal is to increase traffic, etc. ◦ Use the technical profile to know how your users are accessing your site
  • 19.
    All Traffic Sources: ◦ Which sources send visitors who are more likely to be qualified leads ◦ Site Usage ◦ Goals Set ◦ Ecommerce ◦ Shows whether your paid investments are qualified leads
  • 27.
    Ecommerce ◦ Only visible if you are selling through your site. ◦ Which products are selling best. ◦ Which sources are bringing in the most sales
  • 28.
    AdWords in Analytics: ◦ Which campaigns and keywords are performing best based on site goals ◦ AdWords MUST be linked to Analytics to get this information. ◦ Note: Graphs are customizable
  • 29.
    Top Content: ◦ Which pages are being viewed most often ◦ Note the URL names – this is done in the coding of the site to assure ease of measurement ◦ Can dig into these numbers for multiple reasons
  • 32.
    Site Search Engine: ◦ Check to see if you have keywords with high search numbers. ◦ Helps to make desired content more readily available to your audience.
  • 33.
    Goal Funnels: ◦ Set Conversion Goals within Analytics ◦ Track how many people you convert ◦ How many people abandoned the conversion and where along the process ◦ Can help make the process easier on users
  • 34.
    Connect after theconference: Jenny@kinetic.com