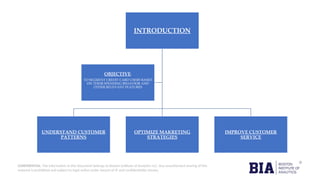
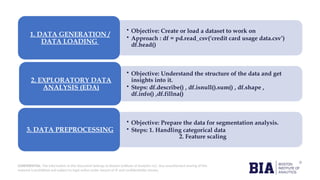
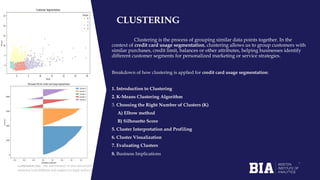
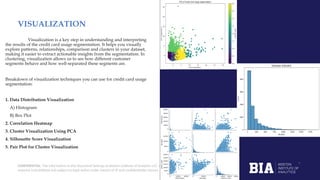
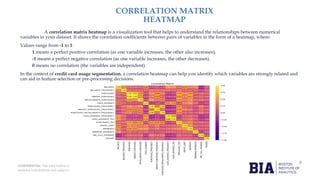
CONFIDENTIAL: The information in this document belongs to Boston Institute of Analytics LLC. Any unauthorized sharing of this
material is prohibited and subject to legal action under breach of IP and confidentiality clauses.
Name of Capstone Project
“CREDIT CARD USAGE SEGMENTATION”
CONFIDENTIAL: The information in this document belongs to Boston Institute of Analytics LLC. Any unauthorized sharing of this
material is prohibited and subject to legal action under breach of IP and confidentiality clauses.
CREDIT CARD USAGE SEGMENTATION:
This project focuses on developing unsupervised
learning Models for customer segmentation based on credit
card usage data. The models aim to provide insights into
distinct customer segments, improve credit risk assessment,
and optimize marketing strategies. Deliverables include
segmentation models, comprehensive data visualizations, and
a comparative analysis of various algorithms.
CONFIDENTIAL: The information in this document belongs to Boston Institute of Analytics LLC. Any unauthorized sharing of this
material is prohibited and subject to legal action under breach of IP and confidentiality clauses.
INTRODUCTION
UNDERSTAND CUSTOMER
PATTERNS
OPTIMIZE MAKRETING
STRATEGIES
IMPROVE CUSTOMER
SERVICE
OBJECTIVE:
TO SEGMENT CREDIT CARD USERS BASED
ON THEIR SPENDING BEHAVIOR AND
OTHER RELEVANT FEATURES
CONFIDENTIAL: The information in this document belongs to Boston Institute of Analytics LLC. Any unauthorized sharing of this
material is prohibited and subject to legal action under breach of IP and confidentiality clauses.
• Objective: Create or load a dataset to work on
• Approach : df = pd.read_csv(‘credit card usage data.csv’)
df.head()
1. DATA GENERATION /
DATA LOADING
• Objective: Understand the structure of the data and get
insights into it.
• Steps: df.describe() , df.isnull().sum() , df.shape ,
df.info() ,df.fillna()
2. EXPLORATORY DATA
ANALYSIS (EDA)
• Objective: Prepare the data for segmentation analysis.
• Steps: 1. Handling categorical data
2. Feature scaling
3. DATA PREPROCESSING
CONFIDENTIAL: The information in this document belongs to Boston Institute of Analytics LLC. Any unauthorized sharing of this
material is prohibited and subject to legal action under breach of IP and confidentiality clauses.
• Objective: Perform segmentation using a clustering algorithm (K-means).
• Steps: 1. Determine optimal number of clusters using Elbow Method
2. Apply K-Means clustering with the
optimal numbers of clusters.
4. CLUSTERING
• Objective: Evaluate the quality of the clustering results.
• Steps: 1. Compute Silhouette Scores
2. Visualize the same.
5. EVALUATION /
VISUALIZATION
• Objective: Summarize the results and draw actionable insights.
• Steps: 1. Analyze clusters.
2. Use insights for marketing strategies and to
improve customer service.
6. INSIGHTS &
CONCLUSION
CONFIDENTIAL: The information in this document belongs to Boston Institute of Analytics LLC. Any unauthorized sharing of this
material is prohibited and subject to legal action under breach of IP and confidentiality clauses.
DATA LOADING / DATA GENERATION
• # Loading the dataset
• # CSV format
• df = pd.read_csv('/content/credit card excel sheet.csv')
•
# Display the rows
• df.head()
The data loading step is the first crucial part
of the workflow, where we either generate or load
the dataset to perform the segmentation analysis.
This step ensures we have the right data to work
with, setting the foundation for further analysis.
CONFIDENTIAL: The information in this document belongs to Boston Institute of Analytics LLC. Any unauthorized sharing of this
material is prohibited and subject to legal action under breach of IP and confidentiality clauses.
Click to edit
Master title
style
EXPLORATORY DATA ANALYSIS (EDA)
Exploratory Data Analysis (EDA) is a critical step in
understanding the dataset and uncovering patterns, relationships, and
insights that will inform the segmentation process. In the case of credit card
usage segmentation, EDA helps to understand how customers' purchases
and demographics relate to each other, identifying trends that can aid in
customer segmentation.
Breakdown of the EDA process for credit card usage segmentation:
1. Understand the Structure of the Data
2. Summary Statistics
3. Handling Missing Data
4. Analysing the Data
5. Filling missing values
CONFIDENTIAL: The information in this document belongs to Boston Institute of Analytics LLC. Any unauthorized sharing of this
material is prohibited and subject to legal action under breach of IP and confidentiality clauses.
DATA PREPROCESSING
Data preprocessing is a crucial step before applying machine learning
algorithms, especially clustering algorithms for segmentation. It involves
cleaning, transforming, and preparing the data to ensure it is ready for analysis.
For credit card usage segmentation, data preprocessing includes handling missing
values, encoding categorical variables, scaling numerical features, and possibly
creating new features.
Description of the data preprocessing steps for credit card usage segmentation:
1. Handling Missing Values
2. Encoding Categorical Variables
3. Feature Scaling
5. Feature Selection
6. Dimensionality Reduction
7. Final Dataset for Segmentation
CONFIDENTIAL: The information in this document belongs to Boston Institute of Analytics LLC. Any unauthorized sharing of this
material is prohibited and subject to legal action under breach of IP and confidentiality clauses.
Click to edit
Master title
style
CLUSTERING
Clustering is the process of grouping similar data points together. In the
context of credit card usage segmentation, clustering allows us to group customers with
similar purchases, credit limit, balances or other attributes, helping businesses identify
different customer segments for personalized marketing or service strategies.
Breakdown of how clustering is applied for credit card usage segmentation:
1. Introduction to Clustering
2. K-Means Clustering Algorithm
3. Choosing the Right Number of Clusters (K)
A) Elbow method
B) Silhouette Score
5. Cluster Interpretation and Profiling
6. Cluster Visualization
7. Evaluating Clusters
8. Business Implications
CONFIDENTIAL: The information in this document belongs to Boston Institute of Analytics LLC. Any unauthorized sharing of this
material is prohibited and subject to legal action under breach of IP and confidentiality clauses.
VISUALIZATION
Visualization is a key step in understanding and interpreting
the results of the credit card usage segmentation. It helps you visually
explore patterns, relationships, comparison and clusters in your dataset,
making it easier to extract actionable insights from the segmentation. In
clustering, visualization allows us to see how different customer
segments behave and how well-separated these segments are.
Breakdown of visualization techniques you can use for credit card usage
segmentation:
1. Data Distribution Visualization
A) Histogram
B) Box Plot
2. Correlation Heatmap
3. Cluster Visualization Using PCA
4. Silhouette Score Visualization
5. Pair Plot for Cluster Visualization
CONFIDENTIAL: The information in this document belongs to Boston Institute of Analytics LLC. Any unauthorized sharing of this
material is prohibited and subject to legal action under breach of IP and confidentiality clauses.
CORRELATION MATRIX
HEATMAP
A correlation matrix heatmap is a visualization tool that helps to understand the relationships between numerical
variables in your dataset. It shows the correlation coefficients between pairs of variables in the form of a heatmap, where:
Values range from -1 to 1:
1 means a perfect positive correlation (as one variable increases, the other also increases).
-1 means a perfect negative correlation (as one variable increases, the other decreases).
0 means no correlation (the variables are independent).
In the context of credit card usage segmentation, a correlation heatmap can help you identify which variables are strongly related and
can aid in feature selection or pre-processing decisions.
CONFIDENTIAL: The information in this document belongs to Boston Institute of Analytics LLC. Any unauthorized sharing of this
material is prohibited and subject to legal action under breach of IP and confidentiality clauses.
Train and Test Split
In any machine learning task, including credit card usage segmentation, splitting your data into training
and test sets is crucial for evaluating model performance. Here’s a detailed guide on how to perform the train-test
split:
1. Understanding Train-Test Split
2. Import Required Libraries
4. Perform Train-Test Split
5. Verify the Split
6. Understand the model effectively
CONFIDENTIAL: The information in this document belongs to Boston Institute of Analytics LLC. Any unauthorized sharing of this
material is prohibited and subject to legal action under breach of IP and confidentiality clauses.
CONCLUSION
In this analysis of credit card usage segmentation, we aimed to understand customer purchases, balances, credit limits,
payments, tenure, risk assessments, offerings and services etc. and identify distinct segments based on their credit card usage
patterns. Here’s a brief conclusion summarizing the key findings and insights:
Segmentation Approach: We utilized clustering techniques to segment customers based on features such as income, total spending,
transaction frequency, and account balance. This approach enabled us to categorize customers into meaningful groups based on
their spending behavior.
Data Exploration and Preprocessing: Through exploratory data analysis, we explored the distribution of key features and their
correlations. Data preprocessing steps, including normalization and handling missing values, ensured that our data was suitable
for clustering.
Clustering Results: We applied clustering algorithms such as K-Means to identify distinct customer segments. The clustering
results revealed several distinct groups of customers with different spending behaviors and financial profiles.
Evaluation of Clusters: Metrics such as silhouette scores were used to assess the quality of the clusters. These metrics helped in
understanding how well-separated and cohesive the clusters were.
Visualization: Visualization techniques, including PCA plots and silhouette plots, were employed to interpret and validate the
clustering results. These visualizations provided insights into the structure of the clusters and the relationships between different
customer segments.
CONFIDENTIAL: The information in this document belongs to Boston Institute of Analytics LLC. Any unauthorized sharing of this
material is prohibited and subject to legal action under breach of IP and confidentiality clauses.
Business Implications: The identified segments can be used to tailor marketing strategies, develop targeted promotions, and
enhance customer services and offerings. By understanding the specific needs and behaviors of each segment, businesses can
create personalized offers and improve customer satisfaction.
Future Work: Further analysis could involve integrating additional features, experimenting with other clustering algorithms, or
applying advanced techniques such as hierarchical clustering or DBSCAN. Continuous monitoring and updating of the
segmentation model can also help in adapting to changing customer behaviors.
In summary, credit card usage segmentation provided valuable insights into customer behavior,
enabling more informed decision-making and strategic planning. By leveraging these insights, businesses can
enhance their marketing efforts, optimize resource allocation, and ultimately improve customer engagement,
Risk Management, loyalty and Marketing Optimization.
CONFIDENTIAL: The information in this document belongs to Boston Institute of Analytics LLC. Any unauthorized sharing of this
material is prohibited and subject to legal action under breach of IP and confidentiality clauses.
Questions ?
CONFIDENTIAL: The information in this document belongs to Boston Institute of Analytics LLC. Any unauthorized sharing of this
material is prohibited and subject to legal action under breach of IP and confidentiality clauses.
Thank You!

Optimizing Credit Card Usage: Advanced Segmentation Techniques for Targeted Strategies

  • 1.
    CONFIDENTIAL: The informationin this document belongs to Boston Institute of Analytics LLC. Any unauthorized sharing of this material is prohibited and subject to legal action under breach of IP and confidentiality clauses. Name of Capstone Project “CREDIT CARD USAGE SEGMENTATION”
  • 2.
    CONFIDENTIAL: The informationin this document belongs to Boston Institute of Analytics LLC. Any unauthorized sharing of this material is prohibited and subject to legal action under breach of IP and confidentiality clauses. CREDIT CARD USAGE SEGMENTATION: This project focuses on developing unsupervised learning Models for customer segmentation based on credit card usage data. The models aim to provide insights into distinct customer segments, improve credit risk assessment, and optimize marketing strategies. Deliverables include segmentation models, comprehensive data visualizations, and a comparative analysis of various algorithms.
  • 3.
    CONFIDENTIAL: The informationin this document belongs to Boston Institute of Analytics LLC. Any unauthorized sharing of this material is prohibited and subject to legal action under breach of IP and confidentiality clauses. INTRODUCTION UNDERSTAND CUSTOMER PATTERNS OPTIMIZE MAKRETING STRATEGIES IMPROVE CUSTOMER SERVICE OBJECTIVE: TO SEGMENT CREDIT CARD USERS BASED ON THEIR SPENDING BEHAVIOR AND OTHER RELEVANT FEATURES
  • 4.
    CONFIDENTIAL: The informationin this document belongs to Boston Institute of Analytics LLC. Any unauthorized sharing of this material is prohibited and subject to legal action under breach of IP and confidentiality clauses. • Objective: Create or load a dataset to work on • Approach : df = pd.read_csv(‘credit card usage data.csv’) df.head() 1. DATA GENERATION / DATA LOADING • Objective: Understand the structure of the data and get insights into it. • Steps: df.describe() , df.isnull().sum() , df.shape , df.info() ,df.fillna() 2. EXPLORATORY DATA ANALYSIS (EDA) • Objective: Prepare the data for segmentation analysis. • Steps: 1. Handling categorical data 2. Feature scaling 3. DATA PREPROCESSING
  • 5.
    CONFIDENTIAL: The informationin this document belongs to Boston Institute of Analytics LLC. Any unauthorized sharing of this material is prohibited and subject to legal action under breach of IP and confidentiality clauses. • Objective: Perform segmentation using a clustering algorithm (K-means). • Steps: 1. Determine optimal number of clusters using Elbow Method 2. Apply K-Means clustering with the optimal numbers of clusters. 4. CLUSTERING • Objective: Evaluate the quality of the clustering results. • Steps: 1. Compute Silhouette Scores 2. Visualize the same. 5. EVALUATION / VISUALIZATION • Objective: Summarize the results and draw actionable insights. • Steps: 1. Analyze clusters. 2. Use insights for marketing strategies and to improve customer service. 6. INSIGHTS & CONCLUSION
  • 6.
    CONFIDENTIAL: The informationin this document belongs to Boston Institute of Analytics LLC. Any unauthorized sharing of this material is prohibited and subject to legal action under breach of IP and confidentiality clauses. DATA LOADING / DATA GENERATION • # Loading the dataset • # CSV format • df = pd.read_csv('/content/credit card excel sheet.csv') • # Display the rows • df.head() The data loading step is the first crucial part of the workflow, where we either generate or load the dataset to perform the segmentation analysis. This step ensures we have the right data to work with, setting the foundation for further analysis.
  • 7.
    CONFIDENTIAL: The informationin this document belongs to Boston Institute of Analytics LLC. Any unauthorized sharing of this material is prohibited and subject to legal action under breach of IP and confidentiality clauses. Click to edit Master title style EXPLORATORY DATA ANALYSIS (EDA) Exploratory Data Analysis (EDA) is a critical step in understanding the dataset and uncovering patterns, relationships, and insights that will inform the segmentation process. In the case of credit card usage segmentation, EDA helps to understand how customers' purchases and demographics relate to each other, identifying trends that can aid in customer segmentation. Breakdown of the EDA process for credit card usage segmentation: 1. Understand the Structure of the Data 2. Summary Statistics 3. Handling Missing Data 4. Analysing the Data 5. Filling missing values
  • 8.
    CONFIDENTIAL: The informationin this document belongs to Boston Institute of Analytics LLC. Any unauthorized sharing of this material is prohibited and subject to legal action under breach of IP and confidentiality clauses. DATA PREPROCESSING Data preprocessing is a crucial step before applying machine learning algorithms, especially clustering algorithms for segmentation. It involves cleaning, transforming, and preparing the data to ensure it is ready for analysis. For credit card usage segmentation, data preprocessing includes handling missing values, encoding categorical variables, scaling numerical features, and possibly creating new features. Description of the data preprocessing steps for credit card usage segmentation: 1. Handling Missing Values 2. Encoding Categorical Variables 3. Feature Scaling 5. Feature Selection 6. Dimensionality Reduction 7. Final Dataset for Segmentation
  • 9.
    CONFIDENTIAL: The informationin this document belongs to Boston Institute of Analytics LLC. Any unauthorized sharing of this material is prohibited and subject to legal action under breach of IP and confidentiality clauses. Click to edit Master title style CLUSTERING Clustering is the process of grouping similar data points together. In the context of credit card usage segmentation, clustering allows us to group customers with similar purchases, credit limit, balances or other attributes, helping businesses identify different customer segments for personalized marketing or service strategies. Breakdown of how clustering is applied for credit card usage segmentation: 1. Introduction to Clustering 2. K-Means Clustering Algorithm 3. Choosing the Right Number of Clusters (K) A) Elbow method B) Silhouette Score 5. Cluster Interpretation and Profiling 6. Cluster Visualization 7. Evaluating Clusters 8. Business Implications
  • 10.
    CONFIDENTIAL: The informationin this document belongs to Boston Institute of Analytics LLC. Any unauthorized sharing of this material is prohibited and subject to legal action under breach of IP and confidentiality clauses. VISUALIZATION Visualization is a key step in understanding and interpreting the results of the credit card usage segmentation. It helps you visually explore patterns, relationships, comparison and clusters in your dataset, making it easier to extract actionable insights from the segmentation. In clustering, visualization allows us to see how different customer segments behave and how well-separated these segments are. Breakdown of visualization techniques you can use for credit card usage segmentation: 1. Data Distribution Visualization A) Histogram B) Box Plot 2. Correlation Heatmap 3. Cluster Visualization Using PCA 4. Silhouette Score Visualization 5. Pair Plot for Cluster Visualization
  • 11.
    CONFIDENTIAL: The informationin this document belongs to Boston Institute of Analytics LLC. Any unauthorized sharing of this material is prohibited and subject to legal action under breach of IP and confidentiality clauses. CORRELATION MATRIX HEATMAP A correlation matrix heatmap is a visualization tool that helps to understand the relationships between numerical variables in your dataset. It shows the correlation coefficients between pairs of variables in the form of a heatmap, where: Values range from -1 to 1: 1 means a perfect positive correlation (as one variable increases, the other also increases). -1 means a perfect negative correlation (as one variable increases, the other decreases). 0 means no correlation (the variables are independent). In the context of credit card usage segmentation, a correlation heatmap can help you identify which variables are strongly related and can aid in feature selection or pre-processing decisions.
  • 12.
    CONFIDENTIAL: The informationin this document belongs to Boston Institute of Analytics LLC. Any unauthorized sharing of this material is prohibited and subject to legal action under breach of IP and confidentiality clauses. Train and Test Split In any machine learning task, including credit card usage segmentation, splitting your data into training and test sets is crucial for evaluating model performance. Here’s a detailed guide on how to perform the train-test split: 1. Understanding Train-Test Split 2. Import Required Libraries 4. Perform Train-Test Split 5. Verify the Split 6. Understand the model effectively
  • 13.
    CONFIDENTIAL: The informationin this document belongs to Boston Institute of Analytics LLC. Any unauthorized sharing of this material is prohibited and subject to legal action under breach of IP and confidentiality clauses. CONCLUSION In this analysis of credit card usage segmentation, we aimed to understand customer purchases, balances, credit limits, payments, tenure, risk assessments, offerings and services etc. and identify distinct segments based on their credit card usage patterns. Here’s a brief conclusion summarizing the key findings and insights: Segmentation Approach: We utilized clustering techniques to segment customers based on features such as income, total spending, transaction frequency, and account balance. This approach enabled us to categorize customers into meaningful groups based on their spending behavior. Data Exploration and Preprocessing: Through exploratory data analysis, we explored the distribution of key features and their correlations. Data preprocessing steps, including normalization and handling missing values, ensured that our data was suitable for clustering. Clustering Results: We applied clustering algorithms such as K-Means to identify distinct customer segments. The clustering results revealed several distinct groups of customers with different spending behaviors and financial profiles. Evaluation of Clusters: Metrics such as silhouette scores were used to assess the quality of the clusters. These metrics helped in understanding how well-separated and cohesive the clusters were. Visualization: Visualization techniques, including PCA plots and silhouette plots, were employed to interpret and validate the clustering results. These visualizations provided insights into the structure of the clusters and the relationships between different customer segments.
  • 14.
    CONFIDENTIAL: The informationin this document belongs to Boston Institute of Analytics LLC. Any unauthorized sharing of this material is prohibited and subject to legal action under breach of IP and confidentiality clauses. Business Implications: The identified segments can be used to tailor marketing strategies, develop targeted promotions, and enhance customer services and offerings. By understanding the specific needs and behaviors of each segment, businesses can create personalized offers and improve customer satisfaction. Future Work: Further analysis could involve integrating additional features, experimenting with other clustering algorithms, or applying advanced techniques such as hierarchical clustering or DBSCAN. Continuous monitoring and updating of the segmentation model can also help in adapting to changing customer behaviors. In summary, credit card usage segmentation provided valuable insights into customer behavior, enabling more informed decision-making and strategic planning. By leveraging these insights, businesses can enhance their marketing efforts, optimize resource allocation, and ultimately improve customer engagement, Risk Management, loyalty and Marketing Optimization.
  • 15.
    CONFIDENTIAL: The informationin this document belongs to Boston Institute of Analytics LLC. Any unauthorized sharing of this material is prohibited and subject to legal action under breach of IP and confidentiality clauses. Questions ?
  • 16.
    CONFIDENTIAL: The informationin this document belongs to Boston Institute of Analytics LLC. Any unauthorized sharing of this material is prohibited and subject to legal action under breach of IP and confidentiality clauses. Thank You!