1. OPTIMAL METHODS TO COMPUTE AIRBORNE FLUX FOR BUFFER ZONE
ASSESSMENT
David A. Sullivan*, Sullivan Environmental
Dennis J. Hlinka, Sullivan Environmental
Mark T. Holdsworth, Sullivan Environmental
As part of registration for many pesticides, it is necessary to document airborne flux
(emissions) during and after pesticide applications. Ultimately, these data are used to
model airborne concentrations around the field as an input to buffer zone assessment.
Based on our experience in conducting field trials, the IHF method is often preferred
in terms of compact field size and efficiency of data collection.
The standard IHF method is a simplification that uses a multi-level profile of airborne
concentration and wind speed at a mid-field (central) location to approximate the
average flux across the treated field. It assumes that by integrating the fitted
functions of wind speed times airborne concentration at the central location as a
function of height, and then dividing by the upwind fetch, that the average flux can be
estimated. This of course is far easier than placing multiple masts across the full
crosswind extent of the plume in order to conduct a complete assessment of the full
cross-wind plane of the plume. While it is not feasible to measure concentration or
wind in this fashion, this more direct approach can be simulated through dispersion
modeling. The key question is: how well does the standard IHF treatment compare to
the modeling analysis of the full cross-wind plane treatment of the plume as a function
of field size and stability? The AERMOD1
dispersion model was run to compute
concentrations across the full crosswind plume at the mid-point of each field size to
simulate neutral, stable, and unstable conditions. The plane was extended horizontally
1
AERMOD computes concentration using a constant wind speed set to a near-surface height to model
ground-level area sources. Since the IHF method accounts for the variability of wind speed as a
function of height, the AERMOD concentrations used to simulate the profiles were multiplied times
the ratio of the reference height wind speed (1 m/sec in this case) divided by the wind speed at each
level of the profile, which acts to conserve mass.
2. and vertically to ensure that the entire plume was contained within the mid-field cross-
wind plane. A normalized flux of 1 µg/m2
/sec was used to model the full extent of the
mid-field crosswind plane and also with discrete receptors to simulate five-level IHF
profiles at the mid-field location. Flux was estimated from the full-plane AERMOD
treatment using comparable calculations as the IHF method except the crosswind
extent of the area source was placed into the divisor in addition to the upwind fetch.
Trapezoidal integration was used for the IHF and full plane integration. The
AERMOD results were used to define the top of the profile height for each area
establishing the top of the profile at 0.01 µg/m3
during neutral conditions. Equal
spacing in natural logarithm space was used to define the remaining bottom four
levels.
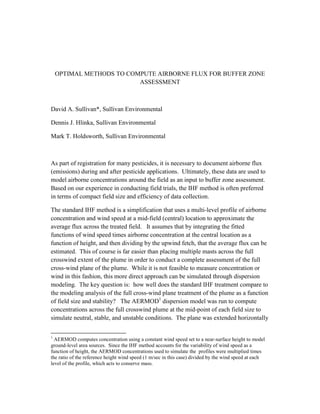
Figure 1 presents the results of the comparative testing of the flux comparisons
between the IHF method and the AERMOD simulation based on the full extent of the
plume along the crosswind, mid-field plane. The perfect flux fit would match the
AERMOD emission rate of 1.00 μg/m3
. Table 2 compares flux based on the IHF
method with standard profile heights of 0.3, 0.6, 0.9, 1.8, and 3.0 m used in many field
trials. The results show for neutral and stable conditions the IHF methodology has
minimal bias for field sizes of 20 x 20 m to 40 x 40 m sources based on the AERMOD
simulated concentration fields. For unstable conditions, these field sizes were 15-20
percent biased low. Unstable conditions, however, generally have favorable
dispersion and in many cases do not result in worst case concentrations. Larger field
sizes in the 100 x 100 m to 200 x 200 m range showed overstatement for stable and
unstable conditions. Using lower profile heights for the largest source areas tested
was found to reduce the positive bias of the IHF method for neutral and stable
conditions.2
Mass balance artifacts in AERMOD were observed for the smallest field
sizes of 5 x 5 m and 10 x 10 m as shown in Table 1.3
Based on these results, a
minimum field size of 20 x 20 m with a mast height in the range of 1 to 1.6 m would
allow for sufficient equilibration with the applied surface, which would be most
applicable to an application method with clearly delineated edges to the treated zone
(e.g. drip irrigation). A one-half acre (40 x 40 m) area is preferred based on this
analysis. Further refinement is recommended to expand on this initial review.
2
Most applied fields show neutral conditions during nocturnal periods due to the higher heat capacity
of the fields due to irrigation or tarping practices (Sullivan, D; and R. Sullivan, On-Field Dilution of
Airborne Flux: Importance For Modeling Exposures, MBAO, Orlando, CA 2014).
3
Future review may identify methods to resolve this deficiency, however, in most cases edge effects
associated with the application would generally preclude fields <= 10 x 10m.
3. Table 1: Comparative Flux Results (IHF vs. Full Plane AERMOD run at 1 g/m2
/Sec
Field Size
(m)
Atmospheric Stability
Source Matched Profile
Heights (m)
IHF Treatment
(µg/m2
/sec)
AERMOD Full
Plane Treatment
(µg/m
2
/sec)
Percent Mass
from Full-
Plane
AERMOD
Treatment
5 X 5 Unstable 0.15, 0.19, 0.24, 0.31, 0.40 0.58 0.60 59.64
10 X 10 Unstable 0.15, 0.23, 0.36, 0.54, 0.82 0.70 0.81 80.74
20 X 20 Unstable 0.15, 0.28, 0.50, 0.90, 1.62 0.80 0.92 91.62
40 X 40 Unstable 0.30, 0.55, 0.99, 1.80, 3.26 0.85 1.00 99.62
100 X 100 Unstable 0.30, 0.68, 1.53, 3.43, 7.71 0.81 1.04 104.17
200 X 200 Unstable 0.30, 0.80, 2.08, 5.43, 14.17 0.71 1.04 103.61
5 X 5 Neutral 0.15, 0.19, 0.24, 0.31, 0.40 0.30 0.54 54.42
10 X 10 Neutral 0.15, 0.23, 0.36, 0.54, 0.82 0.65 0.76 76.37
20 X 20 Neutral 0.15, 0.28, 0.50, 0.90, 1.62 1.00 0.89 88.73
40 X 40 Neutral 0.30, 0.55, 0.99, 1.80, 3.26 1.00 0.96 95.75
100 X 100 Neutral 0.30, 0.68, 1.53, 3.43, 7.71 1.29 1.00 100.41
200 X 200 Neutral 0.30, 0.80, 2.08, 5.43, 14.17 1.37 1.01 100.75
5 X 5 Stable 0.15, 0.19, 0.24, 0.31, 0.40 0.22 0.53 53.46
10 X 10 Stable 0.15, 0.23, 0.36, 0.54, 0.82 0.59 0.76 75.71
20 X 20 Stable 0.15, 0.28, 0.50, 0.90, 1.62 0.99 0.88 88.32
40 X 40 Stable 0.30, 0.55, 0.99, 1.80, 3.26 0.98 0.96 95.56
100 X 100 Stable 0.30, 0.68, 1.53, 3.43, 7.71 1.44 1.01 100.52
200 X 200 Stable 0.30, 0.80, 2.08, 5.43, 14.17 1.76 1.02 102.17
Table 2: Comparison of Standard Profile with Profiles Matched to Plume Heights
4. Figure 1: Computed Flux Based on IHF Method with Matched Profile (Top) and Full
Plane AERMOD results (Bottom)
0.60
0.81
0.92
1.00
1.04 1.04
0.54
0.76
0.89
0.96
1.00 1.01
0.53
0.76
0.88
0.96
1.01
1.02
0.4
0.5
0.6
0.7
0.8
0.9
1.0
1.1
5 10 20 40 100 200
ComputedFluxRate(µg/m2/sec)
Length of Side (meters) for Square Application Area
AERMOD Full Plane Computed Flux Rates as a Function of Source Size
UNSTABLE NEUTRAL STABLE
0.58
0.70
0.80
0.85
0.81
0.71
0.30
0.65
1.00 1.00
1.29
1.37
0.22
0.59
0.99 0.98
1.44
1.76
0.1
0.3
0.5
0.7
0.9
1.1
1.3
1.5
1.7
1.9
5 10 20 40 100 200
ComputedFluxRate(µg/m2/sec)
Length of Side (meters) for Square Application Area
IHF Computed Flux Rates as a Function of Source Size
UNSTABLE NEUTRAL STABLE