
Recommended
Recommended
More Related Content
Similar to EVALUATING REFLECTIVE SPECTROSCOPY FOR PREDICTING SOIL PROPERTIES IN GAJAPATI DISTRICT, ODISHA
Similar to EVALUATING REFLECTIVE SPECTROSCOPY FOR PREDICTING SOIL PROPERTIES IN GAJAPATI DISTRICT, ODISHA (20)
More from indexPub
More from indexPub (20)
Recently uploaded
Recently uploaded (20)
EVALUATING REFLECTIVE SPECTROSCOPY FOR PREDICTING SOIL PROPERTIES IN GAJAPATI DISTRICT, ODISHA
- 1. Jilin Daxue Xuebao (Gongxueban)/Journal of Jilin University (Engineering and Technology Edition) ISSN: 1671-5497 E-Publication: Online Open Access Vol: 42 Issue: 10-2023 DOI: 10.5281/zenodo.8429553 Oct 2023 | 33 EVALUATING REFLECTIVE SPECTROSCOPY FOR PREDICTING SOIL PROPERTIES IN GAJAPATI DISTRICT, ODISHA RAHUL ADHIKARY* Assistant Professor, Department of Soil Science, Centurion University of Technology and Management, Odisha, 761211, India. *Corresponding Author Email: rahul.adhikary@cutm.ac.in, ORCID ID: 0000-0003-0020-4161 SATYA NARAYAN SATAPATHY Assistant Professor, Department of Entomology, Faculty of Agricultural Sciences, Siksha ‘O’ Anusandhan Deemed to be University, Bhubaneswar, Odisha, India. BISWAJIT LENKA Assistant Professor, Department of Genetics and Plant Breeding, Faculty of Agricultural Sciences, Siksha ‘O’ Anusandhan Deemed to be University, Bhubaneswar, Odisha, India. ASIT PRASAD DASH Associate Professor, Department of Genetics and Plant Breeding, Faculty of Agricultural Sciences, Siksha ‘O’ Anusandhan Deemed to be University, Bhubaneswar, Odisha, India. RAJESH KUMAR KAR Assistant Professor, Department of Genetics and Plant Breeding, Faculty of Agricultural Sciences, Siksha ‘O’ Anusandhan Deemed to be University, Bhubaneswar, Odisha, India. SUBHAM ACHARYA Assistant Professor, Department of Agronomy, Faculty of Agricultural Sciences, Siksha ‘O’ Anusandhan Deemed to be University, Bhubaneswar, Odisha, India. Abstract Visible near-infrared spectroscopy, renowned for its non-destructive nature, rapidity, cost-efficiency, and minimal sample preparation requirements, holds promise as a substitute for in vitro techniques. This ongoing study aims to evaluate the viability of reflective spectroscopy for predicting soil properties in ion farming plains across Gajapati district Odisha. A meticulous collection of 110 soil samples from these regions formed the basis, with their core attributes established using conventional in vitro methods. Employing a land spectroscopic device, the soil samples underwent spectral analysis within the wavelength band of 240 to 400 nm. Following spectrum recording, diverse pre-processing approaches were assessed, paving the way for the application of PCA (Principal Component Analysis) and PLSR (Partial Least Squares Regression) models to decipher pivotal soil properties. The superior model choice was subsequently employed to formulate regressive functions, facilitating the prediction of targeted parameters through linear regression. Findings spotlight the precision of both PCA and PLSR models in elucidating soil properties, with the latter displaying heightened accuracy. Evaluated using the RPD (Ratio of Performance to Deviation) metric, the most accurate estimations were achieved for minerals (RPD=9.34), pH (RPD=4.45), and nitrogen (RPD>2), all classified within category A. In contrast, accuracy proved lower for variables like clay, silt, gravel, phosphorus, potassium, calcium, magnesium, and gypsum, where RPD values ranged between 0.01 and 0.28. These values collectively affirm the satisfactory precision of spectral regressive functions in forecasting the targeted foundational properties. In summary, outcomes of this study underscore the commendable precision of both PCA and PLSR models in determining crucial soil parameters. Moreover, soil spectral data emerges as an effective indirect means to estimate the physical and chemical attributes of soil. Compared to conventional laboratory methods, this technique emerges as
- 2. Jilin Daxue Xuebao (Gongxueban)/Journal of Jilin University (Engineering and Technology Edition) ISSN: 1671-5497 E-Publication: Online Open Access Vol: 42 Issue: 10-2023 DOI: 10.5281/zenodo.8429553 Oct 2023 | 34 a more cost-effective alternative, enhancing efficiency in terms of both time and cost while maintaining heightened precision. Keywords: Soil spectral pre-processing, soil properties, PCA and PLSR linear regressions INTRODUCTION In the current era, there is an undeniable global demand for spatial information about soil, essential for environmental assessment, modeling, and effective soil management. The complexity of soil, a dynamic and heterogeneous system governed by intricate processes, underscores the need for advanced analytical techniques. While numerous analytical methods have been proposed to establish relationships between physical and chemical soil components, the mutual interactions among these components have often been overlooked (Arnedo et al., 2017). Consequently, novel techniques are required to efficiently collect soil spatial data across wide areas, capturing multiple properties in a rapid and cost-effective manner (Stenberg et al., 2020). The urgency to streamline soil analysis for time and cost efficiency has surged, driven by the demands of environmental monitoring, soil quality assessment, and precision agriculture and afforestation (Viscarra Rossel et al., 2006). Reflective spectroscopy emerges as a viable solution, offering a potential alternative to conventional analytical methods (Cohen et al., 2005). The utilization of visible-near infrared reflective spectroscopy has gained traction over the past two decades. This growth can be attributed to a multitude of reasons that align with spectral data's capabilities. The advancement of multivariate statistics and data-mining techniques has further expanded the application of this technology in pedological and agricultural sciences. An inherent advantage of visible-near infrared reflective spectroscopy lies in its non-destructive nature, ensuring minimal environmental impact (Guerrero et al., 2010). As direct calibration of soil properties proves time-consuming, expensive, and subject to temporal and spatial variability, the quest for indirect, cost-effective, and swift techniques has become a pivotal research focus in pedology (Canbazoglu et al., 2013). In recent years, telemetric methods, such as soil spectroscopic technology, have been harnessed to enhance analytical efficiency, replacing cumbersome and costly laboratory procedures. Spectroscopy involves the preparation of reflective curves within specific wavelength ranges to quantify phenomena (Schneider et al., 2011). The efficacy of near-infrared reflective spectroscopy rests on the sensitivity of soil organic and mineral compounds to visible and infrared wave reflectance. This property has been harnessed for agricultural and environmental soil studies. Over the past two decades, the application of reflective spectroscopy in pedological sciences has grown, primarily focusing on essential soil components, including organic matter, texture, mineralogy, nutritional elements, structure, and microbial functions (Hassani et al., 2014). Spectroscopy takes two forms: field and imaging. In both modes, electromagnetic energy emitted from a light source interacts with a phenomenon, resulting in reflection, absorption, and transmission. Spectroscopy enables quantitative analysis of these processes. The visible (Vis) and near-infrared (NIR) spectral reflectance of soil spans wavelengths ranging from 350 to 2500 nm (Iurian & Cosma, 2014). Furthermore, infrared
- 3. Jilin Daxue Xuebao (Gongxueban)/Journal of Jilin University (Engineering and Technology Edition) ISSN: 1671-5497 E-Publication: Online Open Access Vol: 42 Issue: 10-2023 DOI: 10.5281/zenodo.8429553 Oct 2023 | 35 spectroscopy, particularly in the near-infrared range, holds potential for identifying various soil components. It facilitates the simultaneous estimation of more than 20 soil properties through a single calibration, both in the field and in vitro. The spectral reflectance of soil is influenced by attributes like humidity, texture, structure, organic matter content, and the presence of various minerals (Soriano-Disla et al., 2014). Critical soil properties, including organic carbon, mineral types, particle size distribution, and carbonate minerals, significantly impact spectral reflectance. For instance, the presence of organic carbon results in distinctive absorbent characteristics at specific wavelengths due to complex chemical composition (Turhan et al., 2012). The shift in spectral curve caused by increased organic carbon content in soil reduces reflectance, especially in the visible and near-infrared ranges. Carbonate minerals, such as calcite and dolomite, influence reflectance by affecting soil pH and CO2 levels (Hunt et al., 1997). Soil particle size distribution also plays a role in spectral behaviour, with larger particles absorbing lighter and exhibiting reduced reflectance. The influence of soil constituents, such as iron oxides, clay, and organic carbon, on spectral curves and absorbent characteristics underscores the significance of spectral behaviour in assessing soil properties. Given the overlapping nature of soil absorbent waves and their intricate adjustments, statistical techniques and robust modeling approaches are essential for extracting valuable spectral information. Approaches like Artificial Neural Network (ANN), Partial Least Square Regression (PLSR), Principal Components Regression (PCR), and Multiplicative Linear (and nonlinear) Regressions (MLR) have been employed to establish connections between soil properties and spectral characteristics (Viscarra Rossel & Behrens, 2010). Spectral curves have been effectively utilized to estimate various soil physical and chemical properties, albeit with varying success (Lagacheri et al., 2008). While most studies focus on the estimation of soil chemical properties through spectral reflectance, a comprehensive understanding suggests that these properties are intricately linked to the soil's solid structure and corresponding levels (e.g., clay, silt, organic matter, electrical conductance, and pH), allowing for precise estimation using soil spectral data (Warren, 2013a). Despite limited research on the application of spectral data for estimating soil properties in Odisha, India, this study seeks to evaluate the potential of visible-near infrared spectroscopy in predicting select physical and chemical properties of soils in Gajapati district, Odisha. MATERIALS AND METHODS Collection soil samples from study area The study area encompassed the agricultural plains situated within Gajapati district in south Odisha (18052’41.57” N, E 840 08’26.59” E ) from January 2021 to March 2023. This region was situated at an average elevation of 250-1030 meters above sea level. The annual temperature ranged from a maximum of 45°C to a minimum of 10°C, while
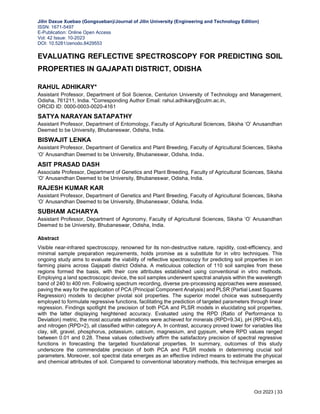
- 4. Jilin Daxue Xuebao (Gongxueban)/Journal of Jilin University (Engineering and Technology Edition) ISSN: 1671-5497 E-Publication: Online Open Access Vol: 42 Issue: 10-2023 DOI: 10.5281/zenodo.8429553 Oct 2023 | 36 the mean annual precipitation ranged between 1000-1200mm. The predominant soil textures within this zone were sandy loam with acidic pH. A total of 110 soil samples from figure 1 were collected randomly from the study zone, spanning depths of 0-30 cm. These soil samples were air-dried and then sieved through a 2mm screen. Following sample preparation, various physical and chemical attributes of the soil were measured, including percentages of Available Nitrogen, Phosphorus, Potassium organic matter, nitrogen, gypsum, sodium, calcium, magnesium. These measurements were conducted using standard water and soil analysis techniques. Fig 1: Soil samples collection area Soil's spectral response and the preprocessing of spectral data related to soil characteristics The spectral reflectance of the soil samples under study underwent calibration through the utilization of a spectroscopic device. This process involved 110 soil samples which were air dried earlier and sieved through a 2mm sieve, after which their spectroscopic curves calibrated across the visible-near infrared ranges (250-400nm) employing established spectrometric techniques (Viscarra Rossel, 2008). Calibration of the spectral curves was executed utilizing a handheld device with an attached lens (8.4°), creating a visual field of 2cm in diameter. Illumination was provided by a halogen lamp (150Watt) positioned at a 45-degree angle with respect to the vertical axis. To enhance precision during reflectance level calibration, noise reduction, and
- 5. Jilin Daxue Xuebao (Gongxueban)/Journal of Jilin University (Engineering and Technology Edition) ISSN: 1671-5497 E-Publication: Online Open Access Vol: 42 Issue: 10-2023 DOI: 10.5281/zenodo.8429553 Oct 2023 | 37 device calibration during measurements, a single reading was obtained for all three soil samples from a blank standard page (reflectance: 100%) positioned in a configuration similar to that of the soil samples. These curves were captured using RS3 software connected to the device and stored on a portable computer. Each soil sample was represented by the mean value of its spectral curves, calculated using View-Spec software. Subsequently, these spectral curves were saved as spectral libraries in text file format for subsequent analyses. Each recorded spectral curve boasted a spectral resolution of 1nm, contributing to a total of 2050 spectral reflectance points (2050 wavelengths) within the range of 400-2450nm (Dematte et al., 2017). The primary objective of pre-processing the spectral data is to eliminate external influences and optimize the utilization of spectral data in the approximation process. Given the presence of significant spectral distortions (noise) within certain wavelength ranges, specifically (350-399 and 2451-2500nm), these wavelengths were excluded from modelling efforts (Terra et al., 2015). Similarly, to mitigate noise in soil spectra—such as nonlinear behaviour of bands, spectral normalization, filtering, and spectral detection— various pre-processing techniques were applied to the spectral data using software tools such as Parles 3.1 and Unscrambler 10.3. Soil calibrated properties and its modelling: The calibrated soil properties were employed as the foundation for modelling purposes. The initial model was constructed using the Principal Components Analysis (PCA) technique, while the second model was developed through the application of the Partial Least Squares Regression (PLSR) method. All procedural steps for both methods were carried out using the MATLAB and SPSS software platforms, following the guidelines provided by Farifteh et al. (2007) and Zheng (2008). To assess the accuracy of the models, two key criteria, namely R^2 (coefficient of determination) and RMSE (root mean square error), were employed. These metrics served as indicators of the precision and effectiveness of the developed models. Principal Components Analysis (PCA) The utilization of the Principal Components Analysis (PCA) model becomes particularly relevant when dealing with a high quantity of variables within a modeling framework. Due to the substantial number of variables present, this approach becomes essential for parameter reduction (Kodaira & Shibusawa, 2013). The Unscrambler X program was used to perform PCA models, scores plots, and loadings plots of each soil order and of all soil orders together. The data was created in a tables in excel and then uploaded into the program to begin the statistical modeling. Data was then transposed into row sets and column sets to create the scores and loadings plots. All zeroes, negatives (if any), or no detections (ND), are to be left as blank cells as the Unscrambler X program does not recognize negatives. Graphs and plots were designed with colour coordination, leverages, and groupings. Principle Component Analysis (PCA) is a multivariate statistical technique used to analyze relation-ships between a large number of variables and smaller number of
- 6. Jilin Daxue Xuebao (Gongxueban)/Journal of Jilin University (Engineering and Technology Edition) ISSN: 1671-5497 E-Publication: Online Open Access Vol: 42 Issue: 10-2023 DOI: 10.5281/zenodo.8429553 Oct 2023 | 38 objects. In this study, the objects are the soil samples and the variables are the soil characterization components (i.e. pH, EC, Fe, OC%). The interrelationship among the two is explained through variables called principle components (PC) (Esbensen, 2010). The soil variable data is obtained from the characterizations was transformed, auto scaled, and evaluated using the PCA to geochemically distinguish soils. Relationships among samples was demonstrated by data points in the score plots, and important variables loaded on the samples were demonstrated by complementary PC subspace distributions in the loading plot. Highly clustered samples in the score plot allows for the down-selection of statistically distinguished samples to avoid redundancies in the future experiments. Covariance measures the strength of joint variability between two or more variables, indicating how much they change in relation to each other. To find the covariance we can use the formula: 𝑐𝑜𝑣 (𝑥1, 𝑥2) = ∑ (𝑥1𝑖 − 𝑥1) + (𝑥2𝑖 − 𝑥2) 𝑛 − 1 𝑛 𝑖=1 The value of covariance can be positive, negative, or zeros. Positive: As the x1 increases x2 also increases. Negative: As the x1 increases x2 also decreases. Zeros: No direct relation Partial Least Square Root (PLSR) Model In this study, we employed Partial Least Squares Regression (PLSR) to estimate soil characteristics (anticipated variables) based on spectral indications (predictive variables). This choice was made due to the interconnection between diffuse reflectance spectra and soil attributes, as previously detailed. Since soil spectra exhibit an overlap of feeble overtones and amalgamations of fundamental vibrational bands, it necessitated the application of multivariate calibration techniques to accurately ascertain soil characteristics. PLSR serves as a broader form of linear multiple regression, effectively reducing an extensive array of collinear variables, such as reflectance values, into a handful of uncorrelated latent variables or factors Wold et al. (2001) for comprehensive PLSR descriptions. To pinpoint the most appropriate procedure, we fitted numerous models. The three datasets under consideration encompassed unprocessed data, as well as data processed through Support Vector Machines (SVM) and Decision Trees (DT). Furthermore, in pursuit of simpler and more efficient models, we established separate models for each dataset, employing the ensuing subsets as independent variables in PLSR: Visible (VIS - 350–700 nm), Near-Infrared (NIR - 701–1000 nm), Short-Wave Infrared (SWIR - 1001– 2500 nm), and the entire range (350–2500 nm). We evaluated the resulting models based on criteria essential for constructing a robust PLSR model: a minimal number of factors, minimal errors in leave-one-out cross- validation (CV), and a high R2. Given the limited quantity of soil samples, we implemented
- 7. Jilin Daxue Xuebao (Gongxueban)/Journal of Jilin University (Engineering and Technology Edition) ISSN: 1671-5497 E-Publication: Online Open Access Vol: 42 Issue: 10-2023 DOI: 10.5281/zenodo.8429553 Oct 2023 | 39 the leave-one-out CV procedure to validate the regression models. For each model, we calculated R2 and the root mean square error (RMSE) values during CV to assess prediction accuracy. We also computed standard error (SE) values during CV. The performance-to-deviation ratio (RPD), represented by the standard deviation (SD) to SE ratio, was employed to gauge the usability of the calibrated models Williams et al. (2017). The findings underscore that a significant proportion of the total variance of bands can be accounted for by considering 20 factors. Moreover, the calibration phase resulted in an R2-value of 0.89. The outcomes derived from the PLSR regression affirm the expectation that this model has demonstrated commendable performance within the realm of soil organic minerals estimation. This superiority can be attributed to the involvement of PCA- dependent variables vis-à-vis PLSR in the band categories. These discoveries align with the research conducted by various scholars who have delved into the estimation of soil properties, either through manual spectrometers or super-spectral aerial images, yielding promising predictions for soil property variables (e.g., Chen et al., 2008; He et al., 2007; Zheng et al., 2008; Wang et al., 2010).Many statistical techniques hinge on the assumption of a normal distribution for data. Hence, the normality status of each soil property was evaluated using the Kolmogorov-Smirnov test, conducted at a significance level of 5%, following the calculation of descriptive statistics. For variables exhibiting non- normal distributions, suitable transformations were applied to achieve normalization. Subsequently, the degree of correlation between spectral reflectance values at various wavelengths and the physical and chemical properties of the soil was examined using Pearson's correlation coefficient. RESULTS AND DISCUSSION Spectral data processing Figure 2 presents the average raw spectral reflectance curves for the soils. This graphical representation highlights a distinct peak in reflectance within the wavelength range of 500-700nm. Additionally, four notable absorption features are evident at wavelengths 990nm, 1414nm, 1915nm, and 2212nm. These absorbent characteristics are associated with factors such as free water presence, hygroscopic properties (1414nm), (O-H factor) or hydroxyl groups in clay mineral lattice (1915nm), and their interaction with iron, aluminum, and magnesium (2212nm) within the clay mineral structure (Clark et al., 1990). Several prevailing soil attributes influence the spectral reflectance levels, including soil color, moisture content, organic carbon concentration, particle size distribution, and the presence of iron and aluminum oxides. Generally, calcium carbonate tends to elevate reflectance, while organic carbon and soil moisture have a dampening effect (Stenberg et al., 2000).
- 8. Jilin Daxue Xuebao (Gongxueban)/Journal of Jilin University (Engineering and Technology Edition) ISSN: 1671-5497 E-Publication: Online Open Access Vol: 42 Issue: 10-2023 DOI: 10.5281/zenodo.8429553 Oct 2023 | 40 Fig 2: The mean of spectral reflectance of studied soils, position of absorption characteristics at wavelengths 990, 1450, 1946, and 2200 nm have been specified on this figure including the dimensions, configuration, and distribution of particles and gaps within it. These factors play a pivotal role in determining the distance light travels through a soil sample, consequently exerting an impact on the observed spectral signatures. Table1: Statistical description of soil properties Soil chemical properties Max Min Mean Std deviation AvlN kg/ha 280 110 195 18.9 Avl P (kg/ha) 22.5 18.6 9.19 15.9 EC(dS/m) 0.89 0.18 0.21 8.5 pH 6.11 7.3 7.11 0.3 O/C 0.76 0.30 0.25 0.2 Avl K (kg/ha) 273 184 240 237 Ca(mg/l) 1072 30 221 207 Mg(mg/l) 214 2.7 48 31.4 Gypsum(%) 33.6 0.02 4.6 8.7 As shown in Table 1, the soil properties in the studied samples exhibit a wide range of variability. The levels of organic matter and total salinity were measured at 0.21 deci- Siemens/m and 0.76%, respectively. Soil samples contained varying amounts of nitrogen (195 kg/ha phosphorus (19.9 kg/ha), and potassium (240kg/ha). The concentrations of calcium, magnesium, sodium, and gypsum were determined to be 221 ppm, 48 ppm, and 4.66%, respectively. Owing to the presence of carbonates, the pH of the studied soils ranged from slightly acidic to neutral (6.1-7.3). The soils in Zone-2 exhibited a diverse range of textural classes.
- 9. Jilin Daxue Xuebao (Gongxueban)/Journal of Jilin University (Engineering and Technology Edition) ISSN: 1671-5497 E-Publication: Online Open Access Vol: 42 Issue: 10-2023 DOI: 10.5281/zenodo.8429553 Oct 2023 | 41 Partial Least Squares Regression (PLSR) Model for Soil Chemical Properties In this study, we employed Partial Least Squares Regression (PLSR) modeling to investigate the relationship between various soil chemical properties and the predictor variables, aiming to establish predictive models for the given soil attributes. The dataset includes a range of soil properties, such as Available Nitrogen (Avl N), Available Phosphorus (Avl P), Electrical Conductivity (EC), pH, Organic Carbon (O/C), Available Potassium (Avl K), Calcium (Ca), Magnesium (Mg), and Gypsum content. Model Performance The PLSR model was assessed in terms of its predictive performance using several key metrics, including R-squared (R²), Root Mean Square Error (RMSE), and Mean Absolute Error (MAE). These metrics provide insight into how well the model captures the variation in the observed data. Variable Importance: The PLSR analysis allowed us to assess the importance of each predictor variable in explaining the variation in soil chemical properties. For instance, the model may have identified that pH and organic carbon are the most influential factors in predicting certain soil properties, while others may be less important. Among the parameters denoted as (r) in the Pearson correlation coefficient table, the physical and chemical attributes of soil are associated with the values of spectral reflectance within a range of wavelengths spanning from 400nm to 2450nm. In relation to this observation, a substantial correlation is observed between calibrated physical and chemical characteristics and the values of spectral reflectance within the visible to near- infrared range. The findings demonstrate that the distribution of soil particle sizes shows both positive and negative correlations across various wavelengths. The outcomes, depicted in Table 2, present the root mean square error (RMSE) values and coefficient of determination (R2) for soil attributes such as clay, silt, sand, and nutrient elements like nitrogen, phosphorus, potassium, calcium, and magnesium, corresponding to wavelengths 990nm, 1414nm, 1915nm, and 2212nm, respectively. The R2 values for estimating the physical and chemical properties of the studied soil range from 0.76 to 0.95%, with the highest R2 value attributed to gypsum and the lowest to phosphorus content. Importantly, the presence of such strong correlations between fundamental soil attributes and rates of spectral reflectance has also been noted by other researchers (Somers et al., 2010; Bilgli et al., 200). Based on the RPD statistic, the most accurate approximations for the suggested regression functions are evident for organic matter (RPD=9.34), pH (RPD=4.45), and nitrogen (RPD>2) across all three series-A categories. The provided approximations, including clay, silt, gravel, phosphorus, potassium, calcium, magnesium, and gypsum (RPD range of 0.01-0.28), indicate a reasonable precision of spectral regression functions in predicting the fundamental properties under study. The validation results for the proposed functions are presented in Figure (3) as dispersion diagrams (1:1), which demonstrate the estimation of various soil physical and chemical properties against their calibrated values. The R2 values shown in both the figure and table indicate the statistical performance of the tested data. Among the foundational
- 10. Jilin Daxue Xuebao (Gongxueban)/Journal of Jilin University (Engineering and Technology Edition) ISSN: 1671-5497 E-Publication: Online Open Access Vol: 42 Issue: 10-2023 DOI: 10.5281/zenodo.8429553 Oct 2023 | 42 properties, attributes such as cation exchange capacity, sand, organic carbon, and silt have an average R2 value of approximately 75. Notably, clay demonstrates a particularly favourable approximation within the suggested regression functions for estimating these properties (McGann et al., 2023) Fig 3: Diagram of precision for results of validation to calibrated and estimated values The figure 3 highlights the soil organic carbon (0.89), available nitrogen (0.92), available phosphorus (0.92), potassium (0.78), calcium (0.91), magnesium (0.93), and gypsum percentage (0.95) R2-statistic values that stand out for the group of fundamental features. These figures represent how well the suggested regression functions approximate these specific traits. A recent study by Dematte et al. (2014) found significant agreement between estimates made using spectral data and calibrated values of important soil properties. For characteristics such as clay (0.83, 4.03), silt (0.32, 5.06), sand (0.7, 5.67),
- 11. Jilin Daxue Xuebao (Gongxueban)/Journal of Jilin University (Engineering and Technology Edition) ISSN: 1671-5497 E-Publication: Online Open Access Vol: 42 Issue: 10-2023 DOI: 10.5281/zenodo.8429553 Oct 2023 | 43 cation exchange capacity (0.64, 1.94 centi-mol.kg), organic matter (0.73, 0.31%), and calcium carbonate (0.64, 0.70%), the researchers reported interpretation coefficients (R2) and RMSEA. It's described same by Bilgli et al. (2010) also voiced support for leveraging spectral data in estimating specific soil physical and chemical attributes. Another study conducted by Babaeian et al. (2015) ventured into predicting basic soil properties, along with soil hydraulic attributes, utilizing spectral data. Collectively, these researchers underscored the potential of soil spectral properties as an effective indirect means to estimate the examined physical and chemical attributes with relative accuracy. Principal Components Analysis (PCA) models for result analysis The Principal Components Analysis (PCA) model is particularly useful when dealing with a high number of variables in a modeling context. Given the abundance of variables, this technique becomes indispensable for the purpose of reducing the number of parameters, as demonstrated by Kodaira and Shibusawa in 2013. Upon conducting a PCA analysis on the independent variables or bands, it was observed that out of the initial set of variables, 20 principal components were retained. Remarkably, these five components managed to encapsulate a significant percentage of the variance within the independent variables. In other words, a substantial number of bands were effectively condensed into 20 components, and these 20 components accounted for a considerable portion of the variance across the bands. The results obtained through the application of the PCA technique align with those obtained using previous methods. However, it is important to note that the predicted values did not yield satisfactory regression coefficients across in south Odisha region. CONCLUSION The outcomes of this study underscore the general efficacy of both PCA and PLSR models in accurately determining key soil parameters within the provinces of Gajapati, Odisha region. Notably, the PLSR model demonstrates heightened precision compared to the PCA model. This study evaluated the potential of using soil spectral data within the visible-near infrared range (400-2400nm) to estimate specific soil physical and chemical properties. The preprocessing curve was delineated for spectral data after its recording and calculation of means. The findings underscored the superiority of the method for spectral data preprocessing. Considering the strong correlation and significance between calibrated soil properties and their spectral reflectance values, regression functions were formulated to estimate these properties. Various statistical measures were employed to assess the accuracy of these functions, including Root Mean Square Error (RMSE), interpretation coefficient (R2), Evaluation of these statistics revealed RMSE values of 27 and 56.7 for the total range of basic properties studied. Conversely, lower approximations were found (RPD=0.01-0.028) for phosphorus, potassium, calcium, magnesium, and gypsum, indicating a satisfactory precision of spectral regression functions in predicting the studied basic properties. In summation, the findings of this study highlight the potential of using soil spectral data as an indirect method for estimating soil's physical and chemical properties. However, given the empirical nature of spectral regression functions and the spatial-temporal variability of soil properties in diverse zones (like: problematic soils at
- 12. Jilin Daxue Xuebao (Gongxueban)/Journal of Jilin University (Engineering and Technology Edition) ISSN: 1671-5497 E-Publication: Online Open Access Vol: 42 Issue: 10-2023 DOI: 10.5281/zenodo.8429553 Oct 2023 | 44 separate zone shows different spectral behaviour), it is advisable to develop and assess these functions for a wider array of zones and soil types. Acknowledgement I thank the following individuals for their expertise and assistance throughout all aspects of our study and for their help in writing the manuscript. References 1) Arnedo, M.A., Rubiano, J.G., Alonso, H., Tejera, A., Gonz alez, A., Gonz alez, J., Gil, J.M., Rodríguez, R., Martel, P., Bolivar, J.P., (2017). Mapping natural radioactivity of soils in the eastern Canary Islands. J. Environ. Radio act, 166, 242– 258. 2) Babaeian, E., M. Homaee, C. Montzka, H. Vereecken, and A. A. Norouzi. (2015). Towards retrieving soil hydraulic properties by hyperspectral remote sensing. Vadoze Zone J, 14(3), doi: 10.2136/ vzj2014.07.0080. 3) Bilgili, A. V., Van Es, H. M., Akbas, F., Durak, A., & Hively, W. D. (2010). Visible-near infrared reflectance spectroscopy for assessment of soil properties in a semi-arid area of Turkey. Journal of Arid Environments, 74(2), 229-238. 4) Canbazoglu, C., Turhan, S., Bakkal, S., Ugur, F.A., Goren, E., (2013). Analysis of gamma emitting radionuclides (terrestrial and anthropogenic) in soil samples from Kilis province in south Anatolia, Turkey. Ann. Nucl. Energy, 62, 153–157. 5) Chappell, Mark A., Jennifer M. Seiter, and Brandon J. Lafferty. "A Pedo-Informatic Approach for Universal Predictions of Complex Soil Environmental Processes." Soil Science Society of America. N.P., 17 Nov. 2015. Web. 6 June 2017. 6) Chen, F., D.E. Kissel, L.T. West, W. Adkins, D. Rickman and J.C. Luvall. (2008). Mapping soil organic carbon concentration for multiple fields with image similarity analysis. Soil Science Society of America Journal, 72(1), 186-193. 7) Cohen MJ, Prenger JP, DeBusk WF. (2005). Visible-Near infrared reflectance spectroscopy for rapid, nondestructive assessment of wetland soil quality. Journal of Environmental Quality. 34, 1422–1434. [PubMed: 15998865]. 8) Demattê, J. A. M., Bellinaso, H., Romero, D. J., & Fongaro, C. T. (2014). Morphological Interpretation of Reflectance Spectrum (MIRS) using libraries looking Scientia Agricola towards soil classification, 71(6), 509-520. 9) Dematte, J. A. M., Horak-Terra, I., Beirigo, R. M., Terra, F. D. S., Marques, K. P. P., Fongaro, C. T., Vidal-Torrado, P. (2017). Genesis and properties of wetland soils by VIS-NIR-SWIR as a technique for environmental monitoring. J Environ Manage, 197, 50-62. doi: 10.1016/j.jenvman.2017.03.014 10) Esbensen, K. H. (2010). "Multivariate Data Analysis - In Practice," CAMO Software 11) Farifteh, J., F.D. Van der Meer, C. Atzberger and J.M. Carranza. (2007). Quantitative analysis of salt affected soil reflectance spectra: a comparison of two adaptive methods (PLSR and ANN). Remote Sensing of Environment, 110, 59-78. 12) Guerrero, C., R. A. Viscarra Rossel and A. M. Mouazen.( 2010). Diffuse reflectance spectroscopy in soil science and land resource assessment. Geoderma. 158, 1-2.
- 13. Jilin Daxue Xuebao (Gongxueban)/Journal of Jilin University (Engineering and Technology Edition) ISSN: 1671-5497 E-Publication: Online Open Access Vol: 42 Issue: 10-2023 DOI: 10.5281/zenodo.8429553 Oct 2023 | 45 13) Hassani, A., Bahrami, H., Noroozi, A., & Oustan, S. (2014). Visible-near infrared reflectance spectroscopy for assessment of soil properties in gypseous and calcareous soils. Journal of Watershed Engineering and Management. 6(2), 125- 138. 14) He, Y., M. Huang, A. Garcia, A. Hernandez and H. Song. (2007). Prediction of soil macronutrients content using near-infrared spectroscopy. Computers and Electronics in Agriculture, 58, 144-153. 15) Iurian, Andra-Rada, Cosma, Constantin, (2014). A practical experimental approach for the determination of gamma-emitting radionuclides in environmental samples. Nucl. is unknown and the path forwards. Plant and Soil, 763, 132- 136. 16) Kodaira, M., Shibusawa, S. (2013). Using a mobile real-time soil visible-near infrared sensor for high resolution soil property mapping. Geoderma. 199, 64-79. 17) Lagacherie, P., Baret, F., Feret, J.B., Netto, J.M and Robbez-Masson, J.M. (2008). Estimation of soil clay and calcium carbonate using laboratory, field and airborne hyperspectral measurements. Remote Sensing of Environment, 112, 825-835. 18) McGann, D., William,D., Barshop, Jesse D., Canterbury, Chuwei Lin., Wassim, Gabri-el., Jingjing, Huang., Bergen, David., Zabrouskov, Vlad., Rafael D. Melani, Wilhelm, Mathias., Graeme C. McAlister, and Devin K. Schweppe J. (2023). Real-Time Spectral Library Matching for Sample Multiplexed Quantitative Proteomics. Proteome Res. 22, 9, 2836–2846. 19) Özdemir, T., 2012. Distribution of terrestrial and anthropogenic radionuclides in Turkish surface soil samples. Geoderma, 187–188, 117–124. 20) Schneider, W. E. and R. Young. (1998). Spectroraidometery Methods: a guide to photometry and visible spectroradiometery. Application note (A14), Optronic Labratories, INC. PP. 47. 21) Soriano-Disla, J.M., Janik, L.J., Viscarra Rossel, R.A., Macdonald, L.M., McLaughlin, M.J.(2014). The Performance of Visible, Near-, and Mid-Infrared Reflectance Spectroscopy for Prediction of Soil Physical, Chemical, and Biological Properties, Applied Spectroscopy Reviews, 49 (2), 139-186. 22) Stenberg, B., Rossel, R. A. V., Mouazen, A. M., & Wetterlind, J. (2010). Chapter five-visible and near infrared spectroscopy in soil science. Advances in Agronomy, 107, 163-215. 23) Summers, D., Lewis, M., Ostendorf, B., and Chittleborough, D. (2011). Visible near-infrared reflectance spectroscopy as a predictive indicator of soil properties. Ecological Indicators, 11(1), 123-131. 24) Viscarra Rossel RA, Walvoort DJJ, McBratney AB, Janik LJ, Skjemstad JO. (2006). Visible, near infrared, mid infrared or combined diffuse reflectance spectroscopy for simultaneous assessment of various soil properties. Geoderma. 131, 59–75. 25) Viscarra Rossel, R., McGlynn, R., McBratney, A. (2006). Determining the composition of mineralorganic mixes using UV–vis–NIR diffuse reflectance spectroscopy. Geoderma, 137, 70-82. 26) Williams, P.; Dardenne, P.; Flinn, P. (2017). Tutorial: Items to Be Included in a Report on a near Infrared Spectroscopy Project. J. Near Infrared Spectrosc. JNIRS, 25, 85–90. [CrossRef] 27) Willmott, C.J. (1981). On the validation of models. Physical Geography, 2, 184–190
- 14. Jilin Daxue Xuebao (Gongxueban)/Journal of Jilin University (Engineering and Technology Edition) ISSN: 1671-5497 E-Publication: Online Open Access Vol: 42 Issue: 10-2023 DOI: 10.5281/zenodo.8429553 Oct 2023 | 46 28) Wold, S.; Sjöström, M.; Eriksson, L. (2001). PLS-Regression: A Basic Tool of Chemometrics. Chemom. Intell. Lab. Syst, 58, 109–130. [CrossRef] 29) Xuemei, Liu, & Jianshe, Liu. (2013). Measurement of soil properties using visible and short wave-near infrared spectroscopy and multivariate calibration. Measurement, 46(10), 3808- 3814. doi: 10.1016/j.measurement.2013.07.007 30) Zheng, B. (2008). Using satellite hyperspectral imagery to map soil organic matter, total nitrogen and total phosphorus. MSc. Thesis, Indiana University, 81 pages. 31) Zornoza, R., Guerrero, C., Mataix-Solera, J., Scow, K. M., Arcenegui, V., & Mataix-Beneyto, J. (2008). Near infrared spectroscopy for determination of various physical, chemical and biochemical properties in Mediterranean soils. Soil Biol Biochem, 40(7), 1923-1930. doi: 10.1016/j.soilbio.2008.04.003