![On the Impact of Data Collection on the Quality of Signal Strength Signatures in
Wi-Fi Indoor Localization
John Nicholson and Vladimir Kulyukin
Computer Science Assistive Technology Laboratory
Department of Computer Science
Utah State University
Logan, UT 83422-4205
ABSTRACT
Wi-Fi signals can be used to localize navigators at topological landmarks in indoor and
outdoor environments. A major issue with Wi-Fi topological localization is calibration.
This paper describes the impact of data collection on the quality of signal strength
signatures.
KEYWORDS
Visual impairment; blindness; assisted navigation; indoor localization; Wi-Fi; 802.11.
BACKGROUND
Using Wi-Fi 802.11 signals for localization is growing in popularity [1,2,3] due to their
wide deployment and affordability. Some projects, such as PlaceLab [1], are using Wi-Fi
to replace or supplement GPS in outdoor environments. The objective is to bring the
calibration time to a minimum by pairing single GPS readings to available Wi-Fi signal
strengths at known locations. However, the reported localization accuracy fluctuates
between 13 and 40 meters, which may be too inaccurate for the indoor wayfinding needs
of the visually impaired.
Another method for Wi-Fi indoor localization is to create a topological map of the
environment and develop signal signatures of selected landmarks through data collection
and pre-processing. The quality of signal signatures is critical, because Wi-Fi signals vary
over time and are susceptible to interference that comes from other wireless devices in
the same frequency range, solid objects, human bodies, and multi-path issues [2].
HYPOTHESIS
It is hypothesized by the investigators that the quality of signal signatures is dependent on
the time of day when data collection occurs.
METHOD
--------------------------------
Insert Figures 1, and 2 here
--------------------------------
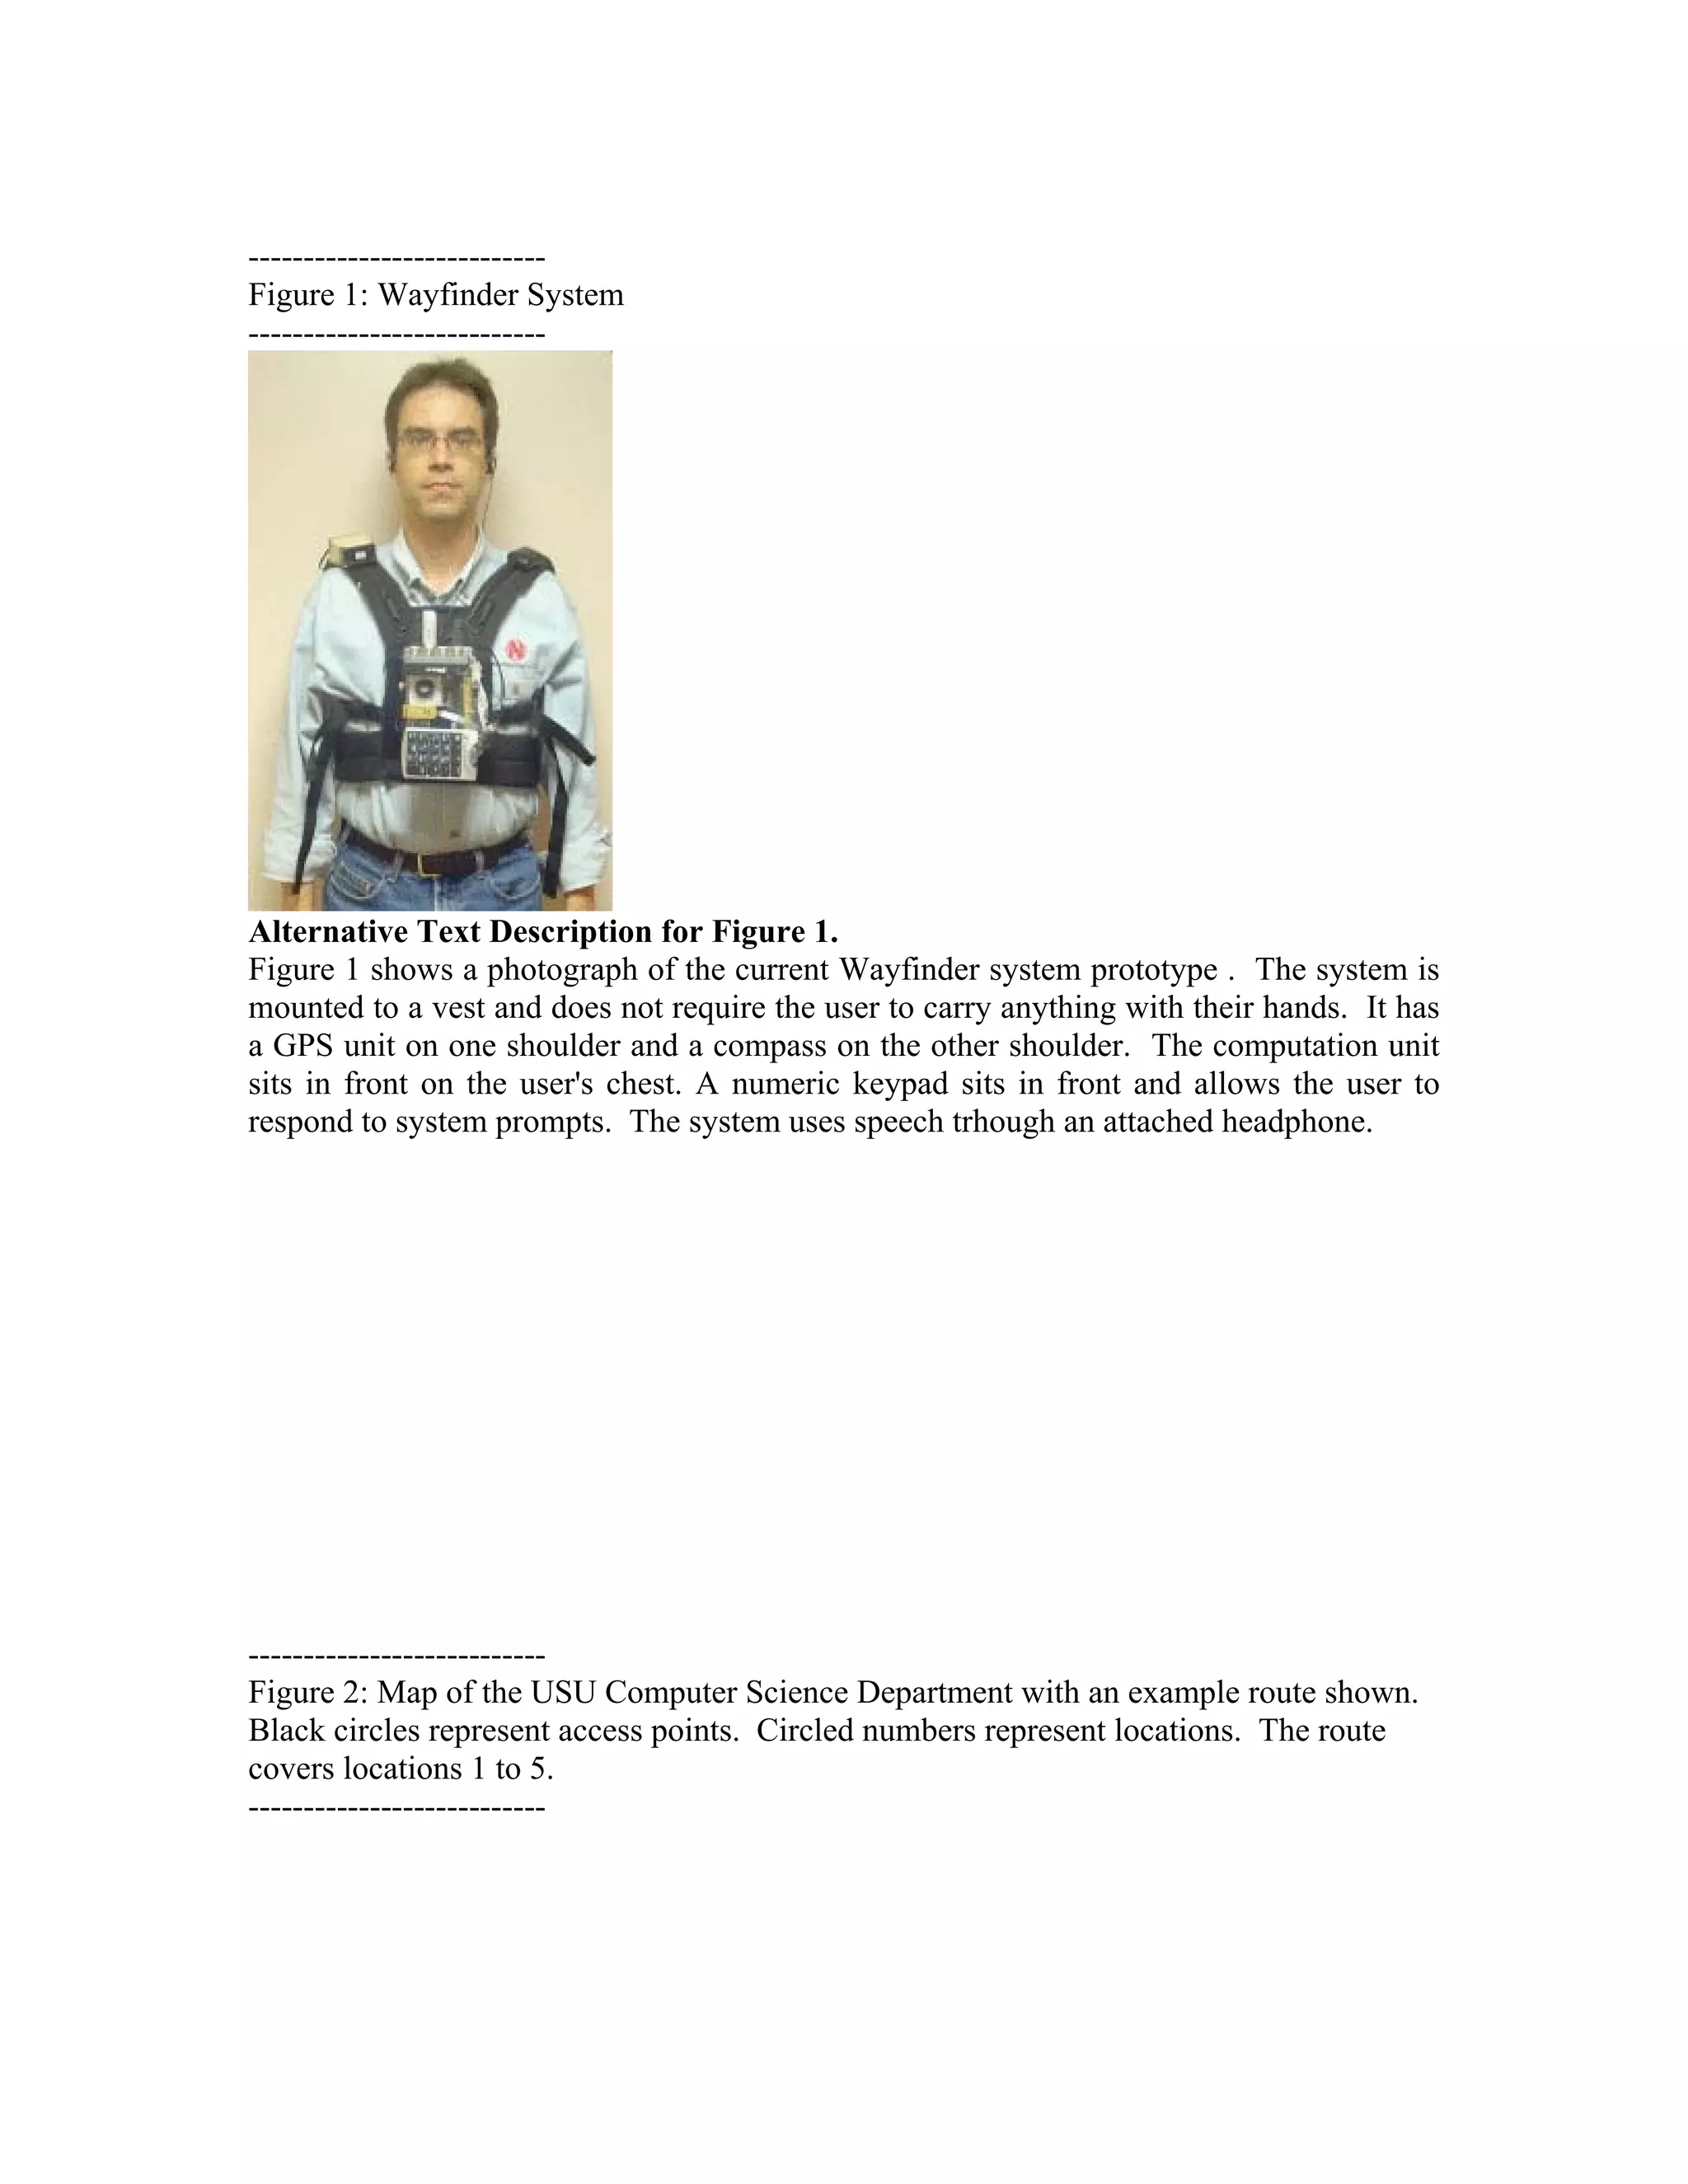
Data collection was done with a wearable multi-sensor wayfinding test bed called the
Wayfinder (see Figure 1). The device uses a wireless card that allows the signal strength](https://image.slidesharecdn.com/resna06wifiloc-111228184747-phpapp01/75/On-the-Impact-of-Data-Collection-on-the-Quality-of-Signal-Strength-in-Wi-Fi-Indoor-Localization-1-2048.jpg)
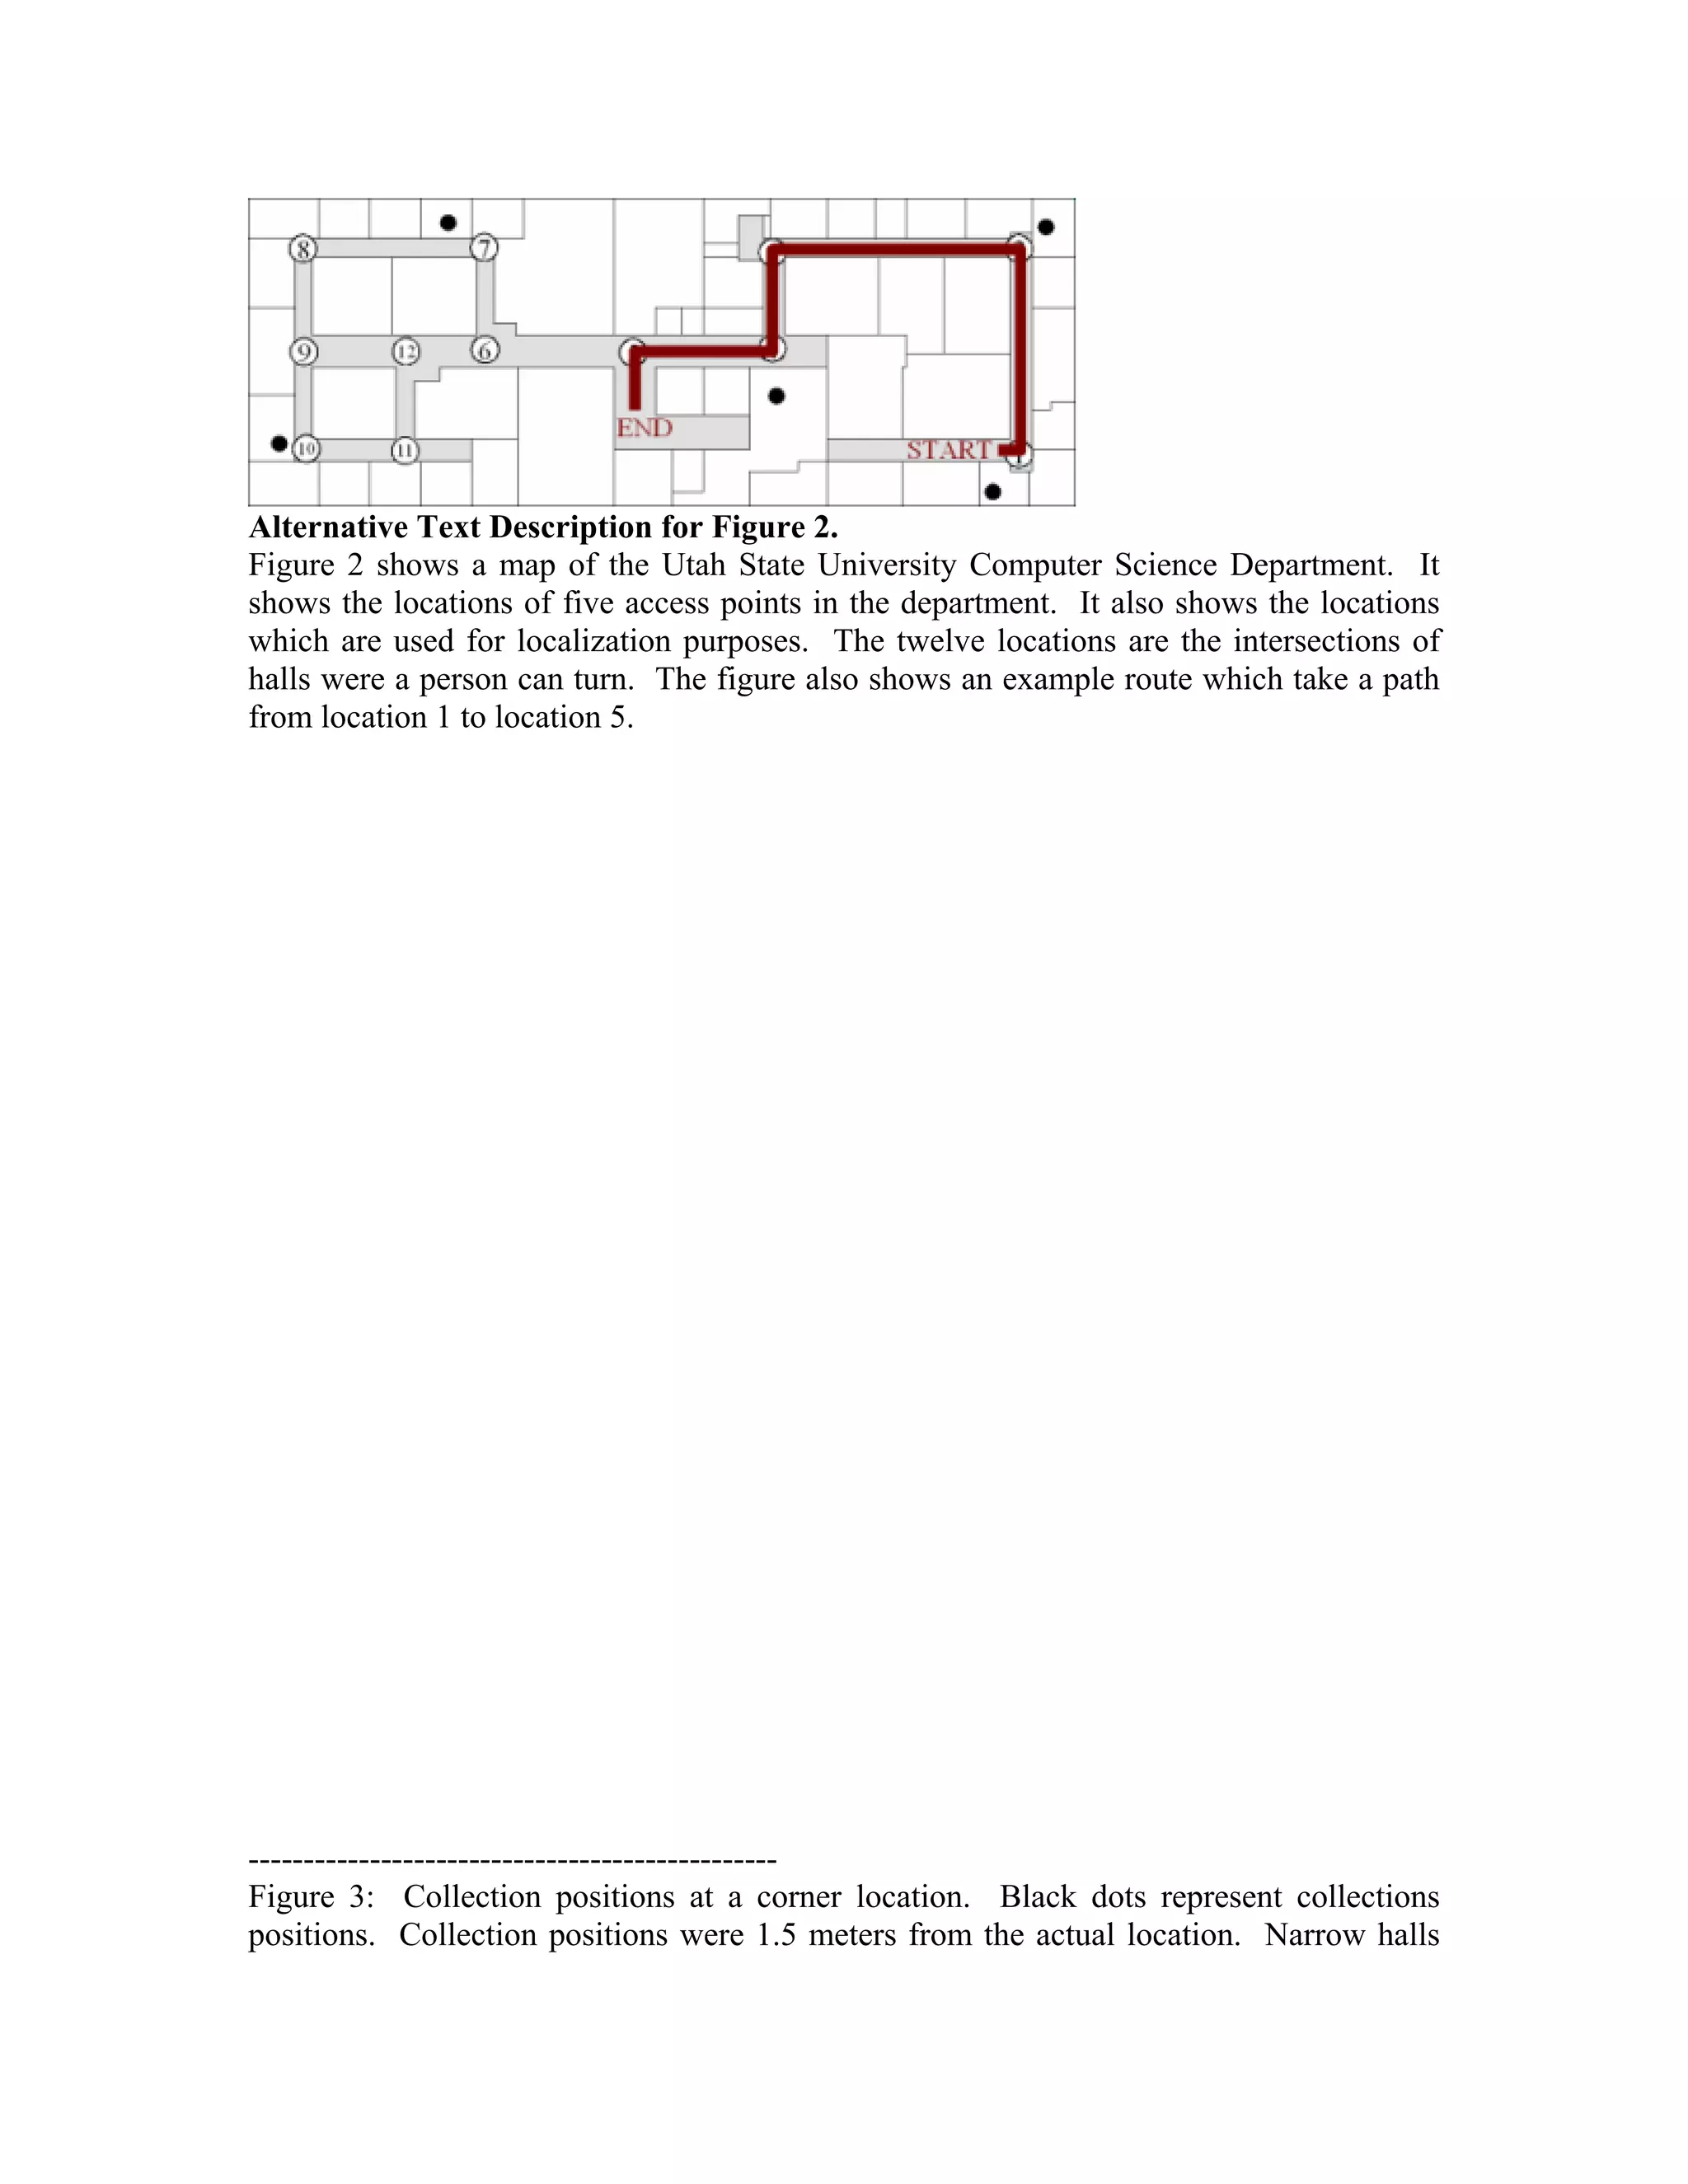
![to be collected from five wireless access routers placed at different locations in the USU
Computer Science Department (see Figure 2). Data were collected two ways: statically
and dynamically.
---------------------------
Insert Figure 3 here
---------------------------
Static data were collected over a period of a month and a half. Data collection for
locations 1 through 5 was completed first and then the remaining locations' data were
collected. Data were collected once per day for each location in a group (1-5 and 6-12).
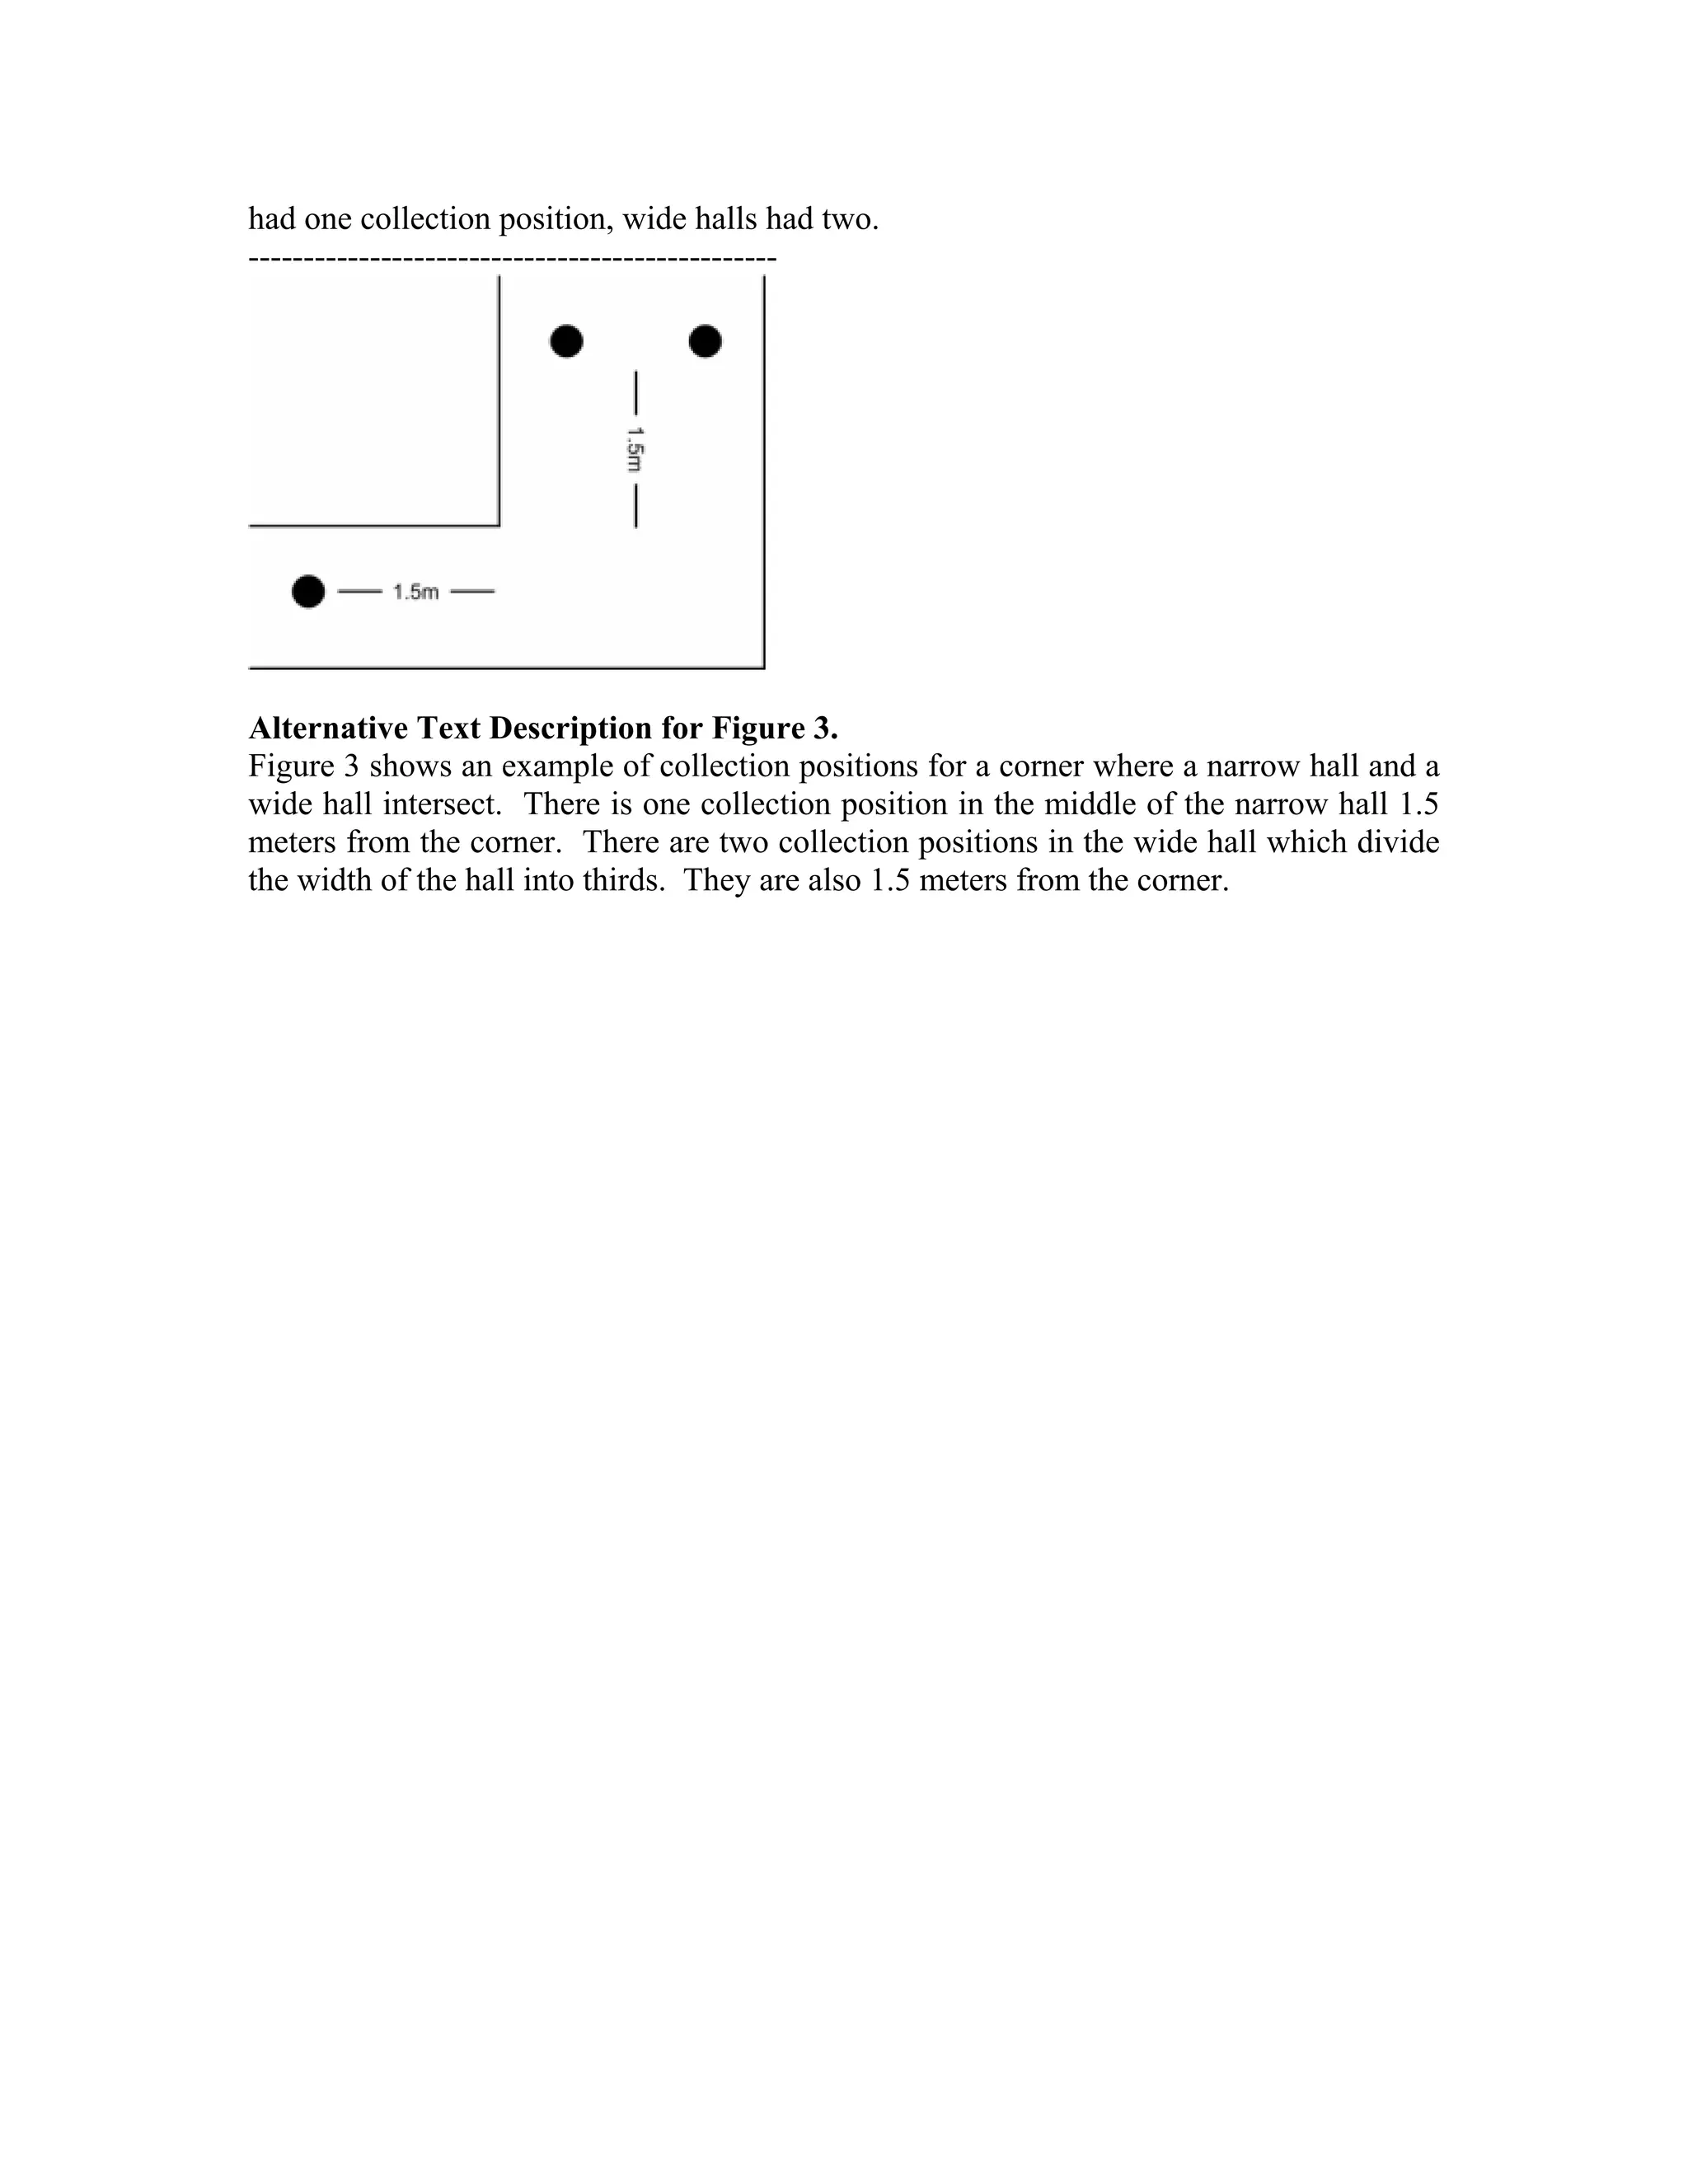
Locations were collected one immediately after another. Locations had at least two
collection positions. A collection position (see Figure 3) is where the data collector stood
while gathering signal strength information. As in other systems [2, 3], the user’s
orientation is taken into consideration, so at each collection position, data were collected
with the collector facing each direction of the hall for 2 minutes at a time. For example,
if a collection position was in a hall which ran north/south, then data were collected for 2
minutes facing north and then 2 minutes facing south. Directionality was taken into
consideration because of the effect of the human body on the signal strength. Data
collection was performed on 10 different days so 20 minutes of data were collected at
each collection position for each direction of the position's hall, in other words a total of
40 minutes data for a collection position.
Dynamic data were collected by walking a series of four routes around the CS
Department. Each route was walked 15 times in both directions for a total of eight
routes. Figure 2 shows the path for one of the routes. In order to record when the user
was at the locations, masking tape was placed on the floor 0.5 meters before and after
each collection position. During a walk, the user pressed a key on the system to record
whenever they passed over a piece of tape. All walks for all routes were completed on
the same day in one data collection session. Note that although the static data was
collected over multiple days, all dynamic data was collected on a single day.
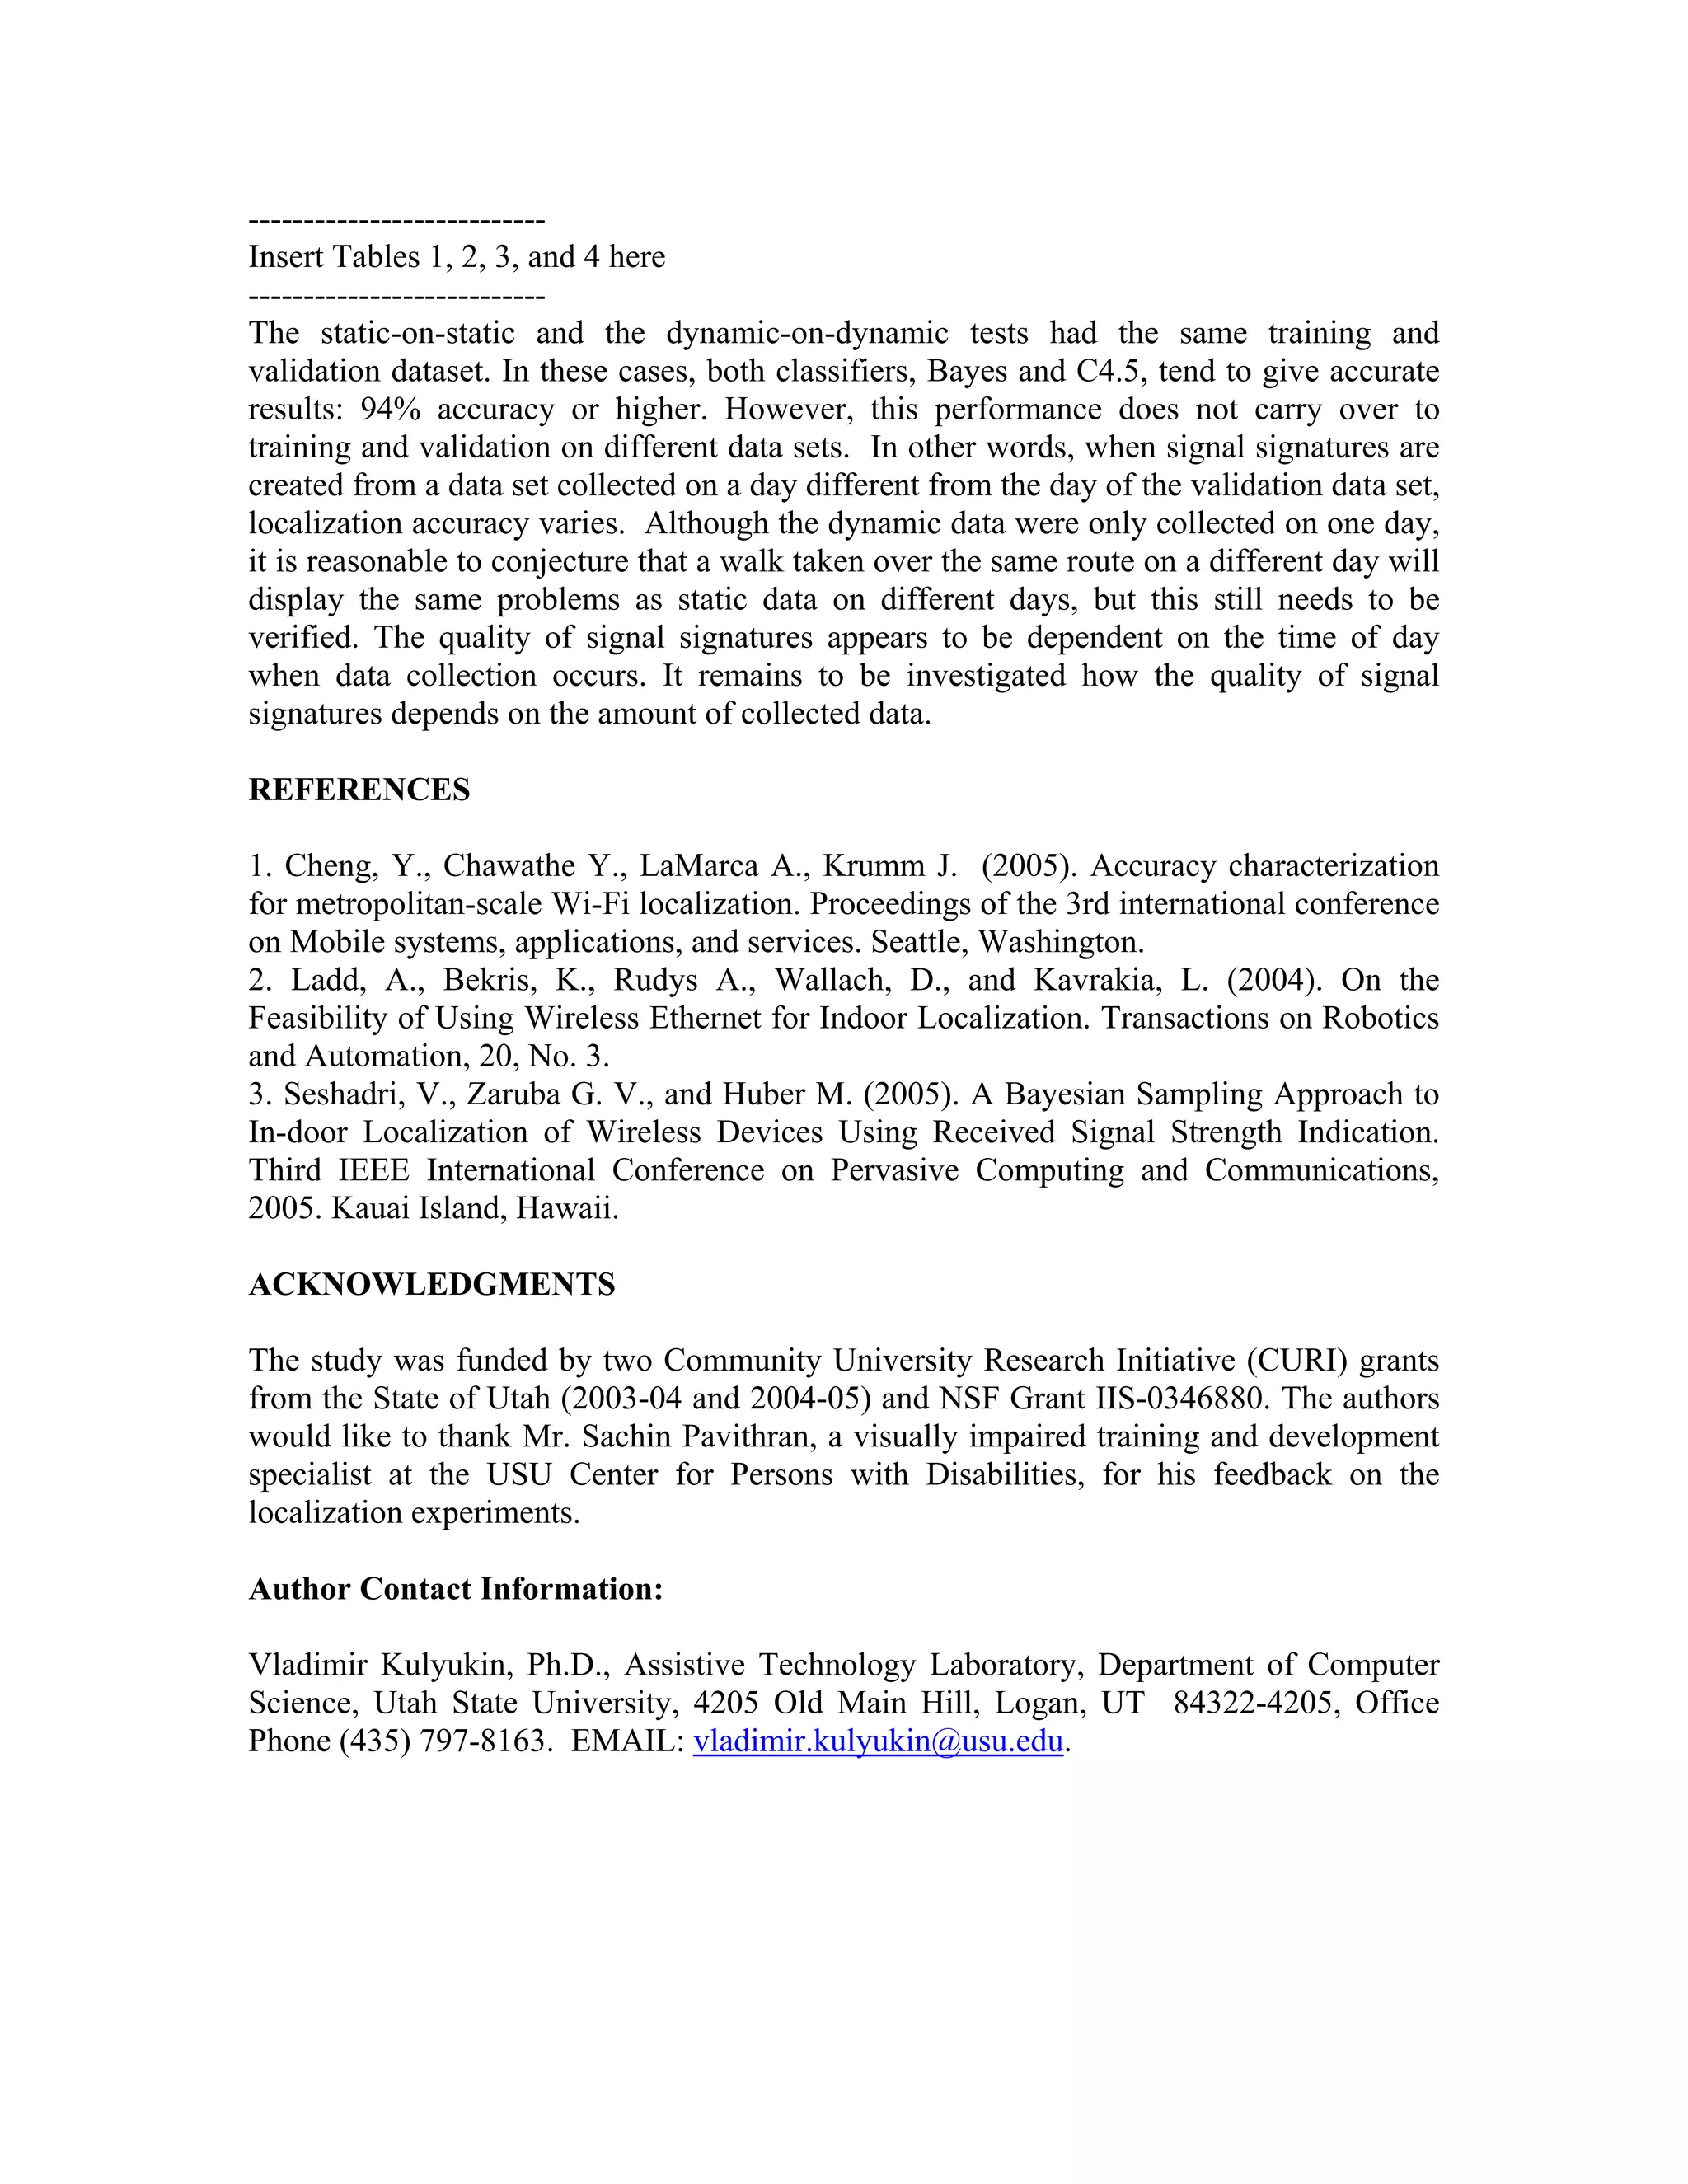
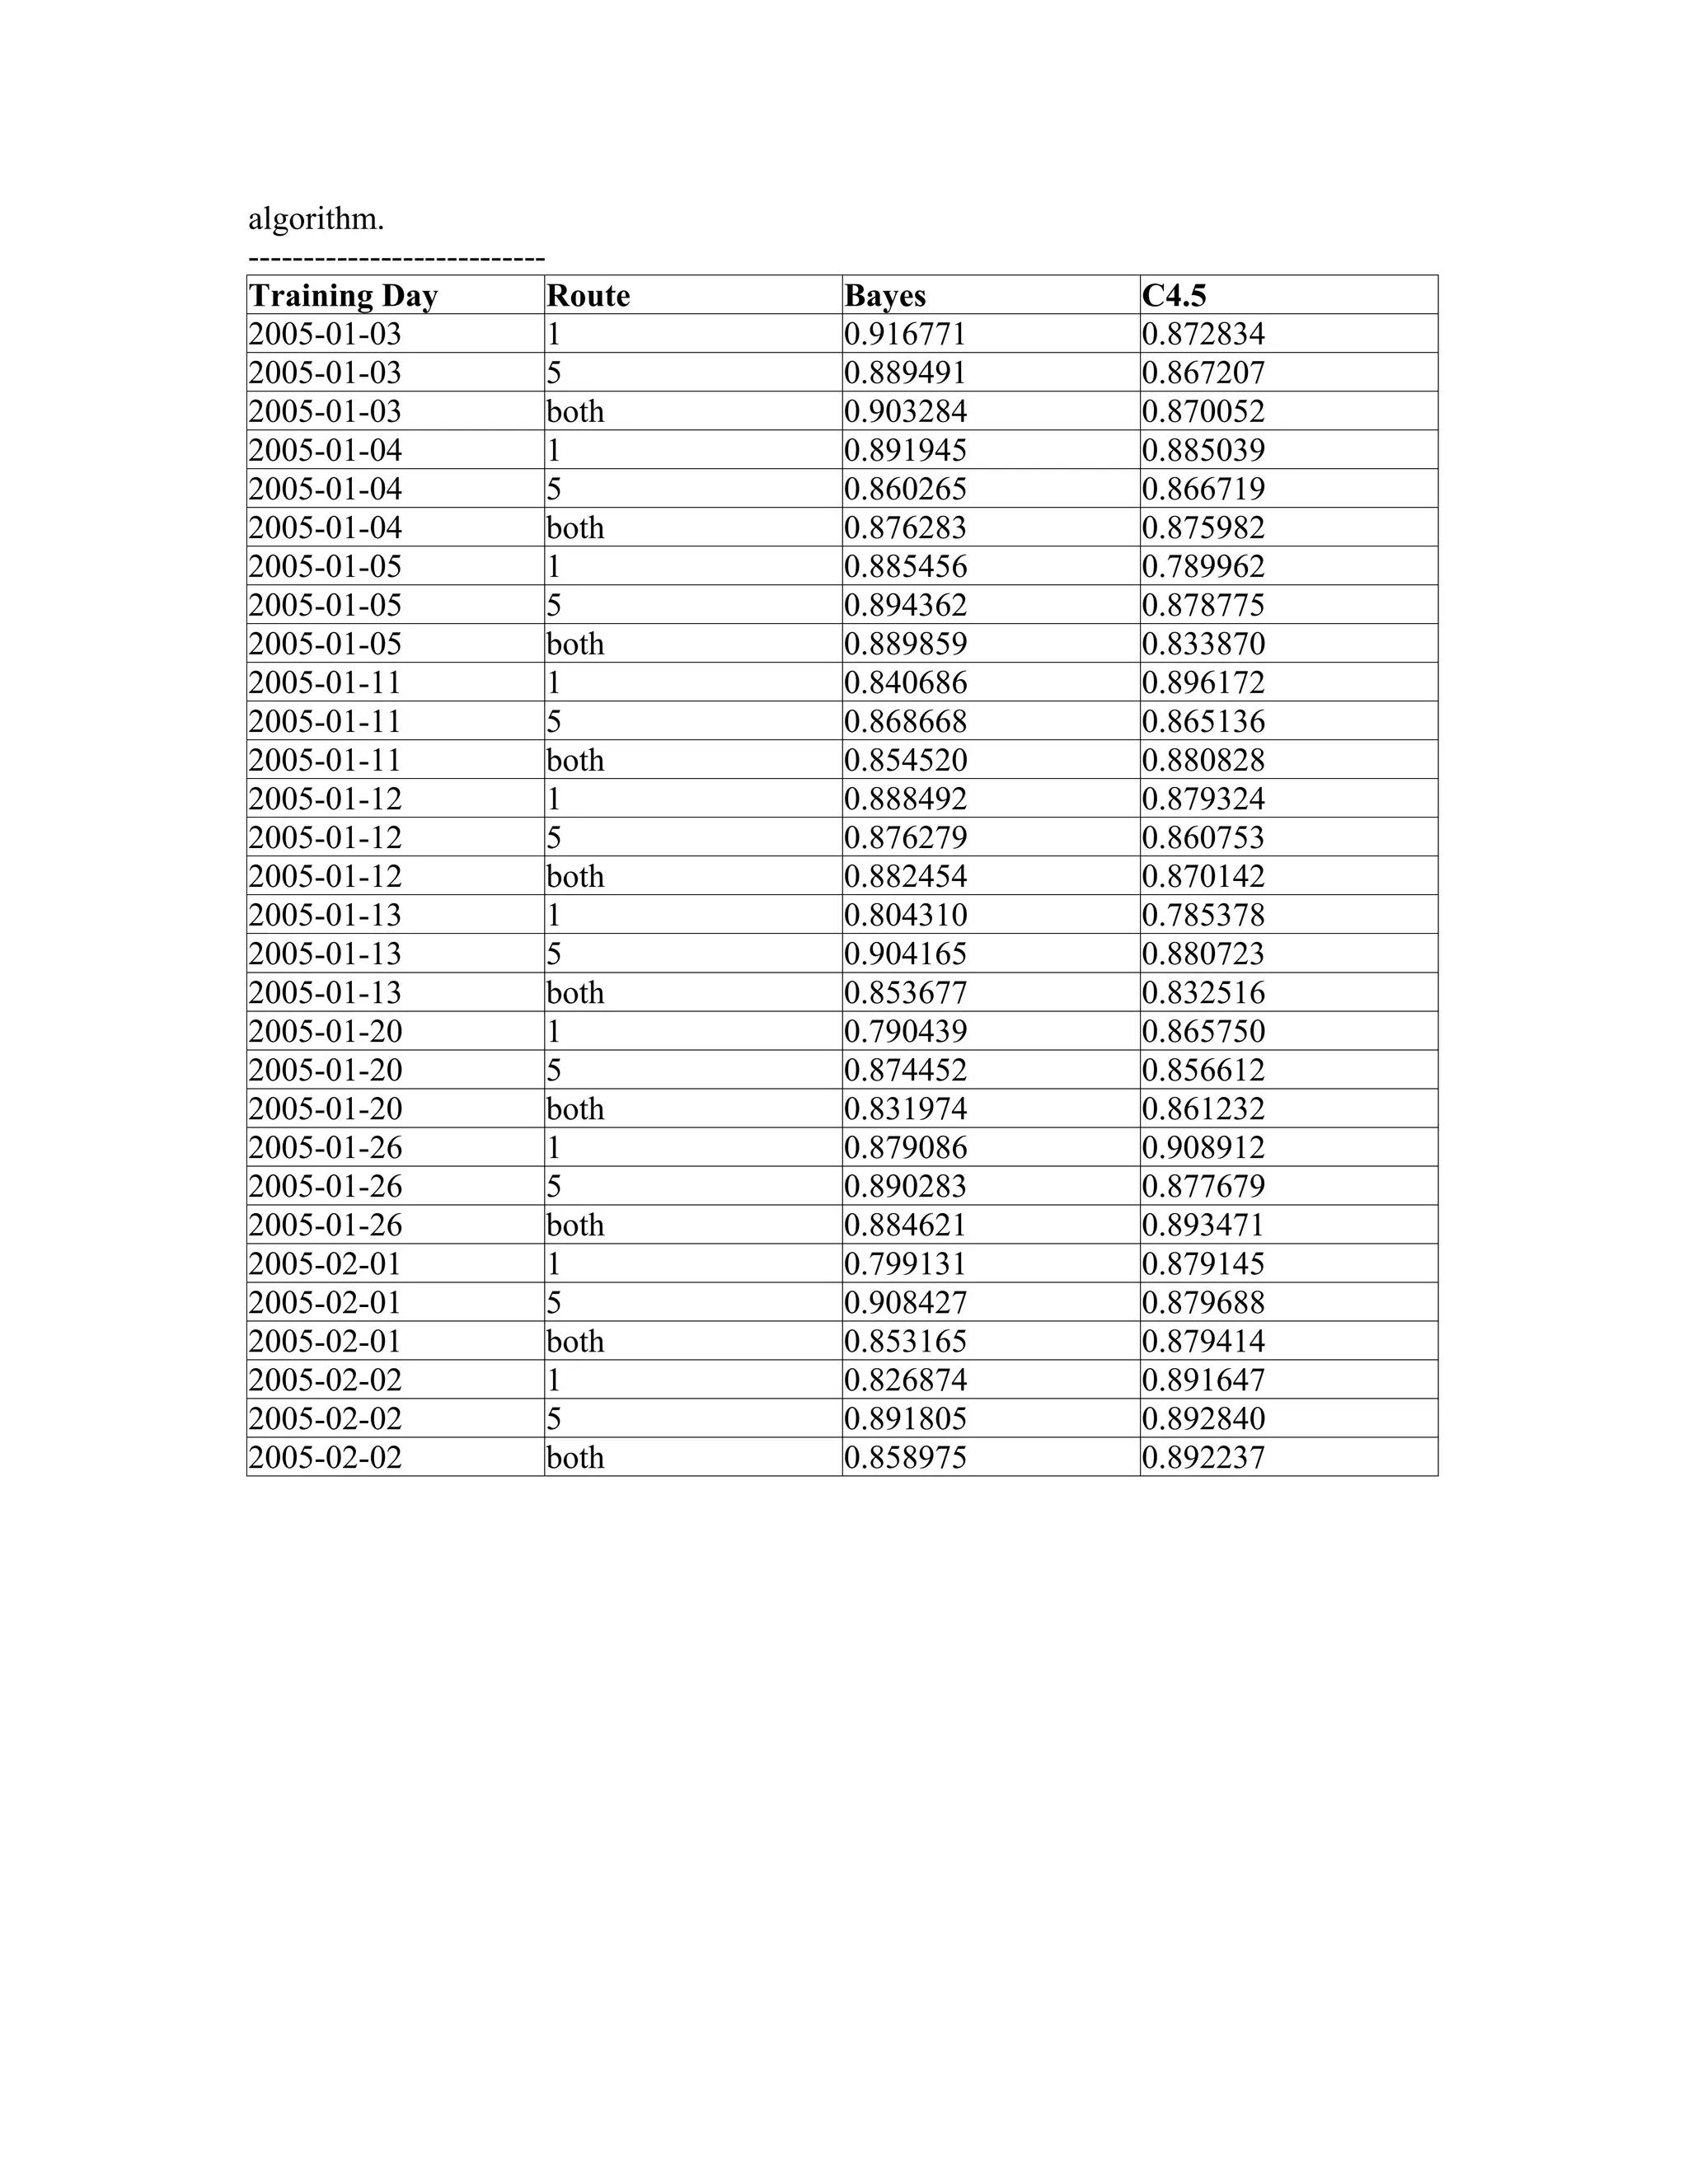
Naive Bayes and C4.5 were used to pre-process the collected data. Thus, signal
signatures were numerical classes created by these two algorithms. To measure the
impact of data collection on the quality of signal signatures, three types of validation
were attempted at run time: 1) static on static, 2) static on dynamic, and 3) dynamic on
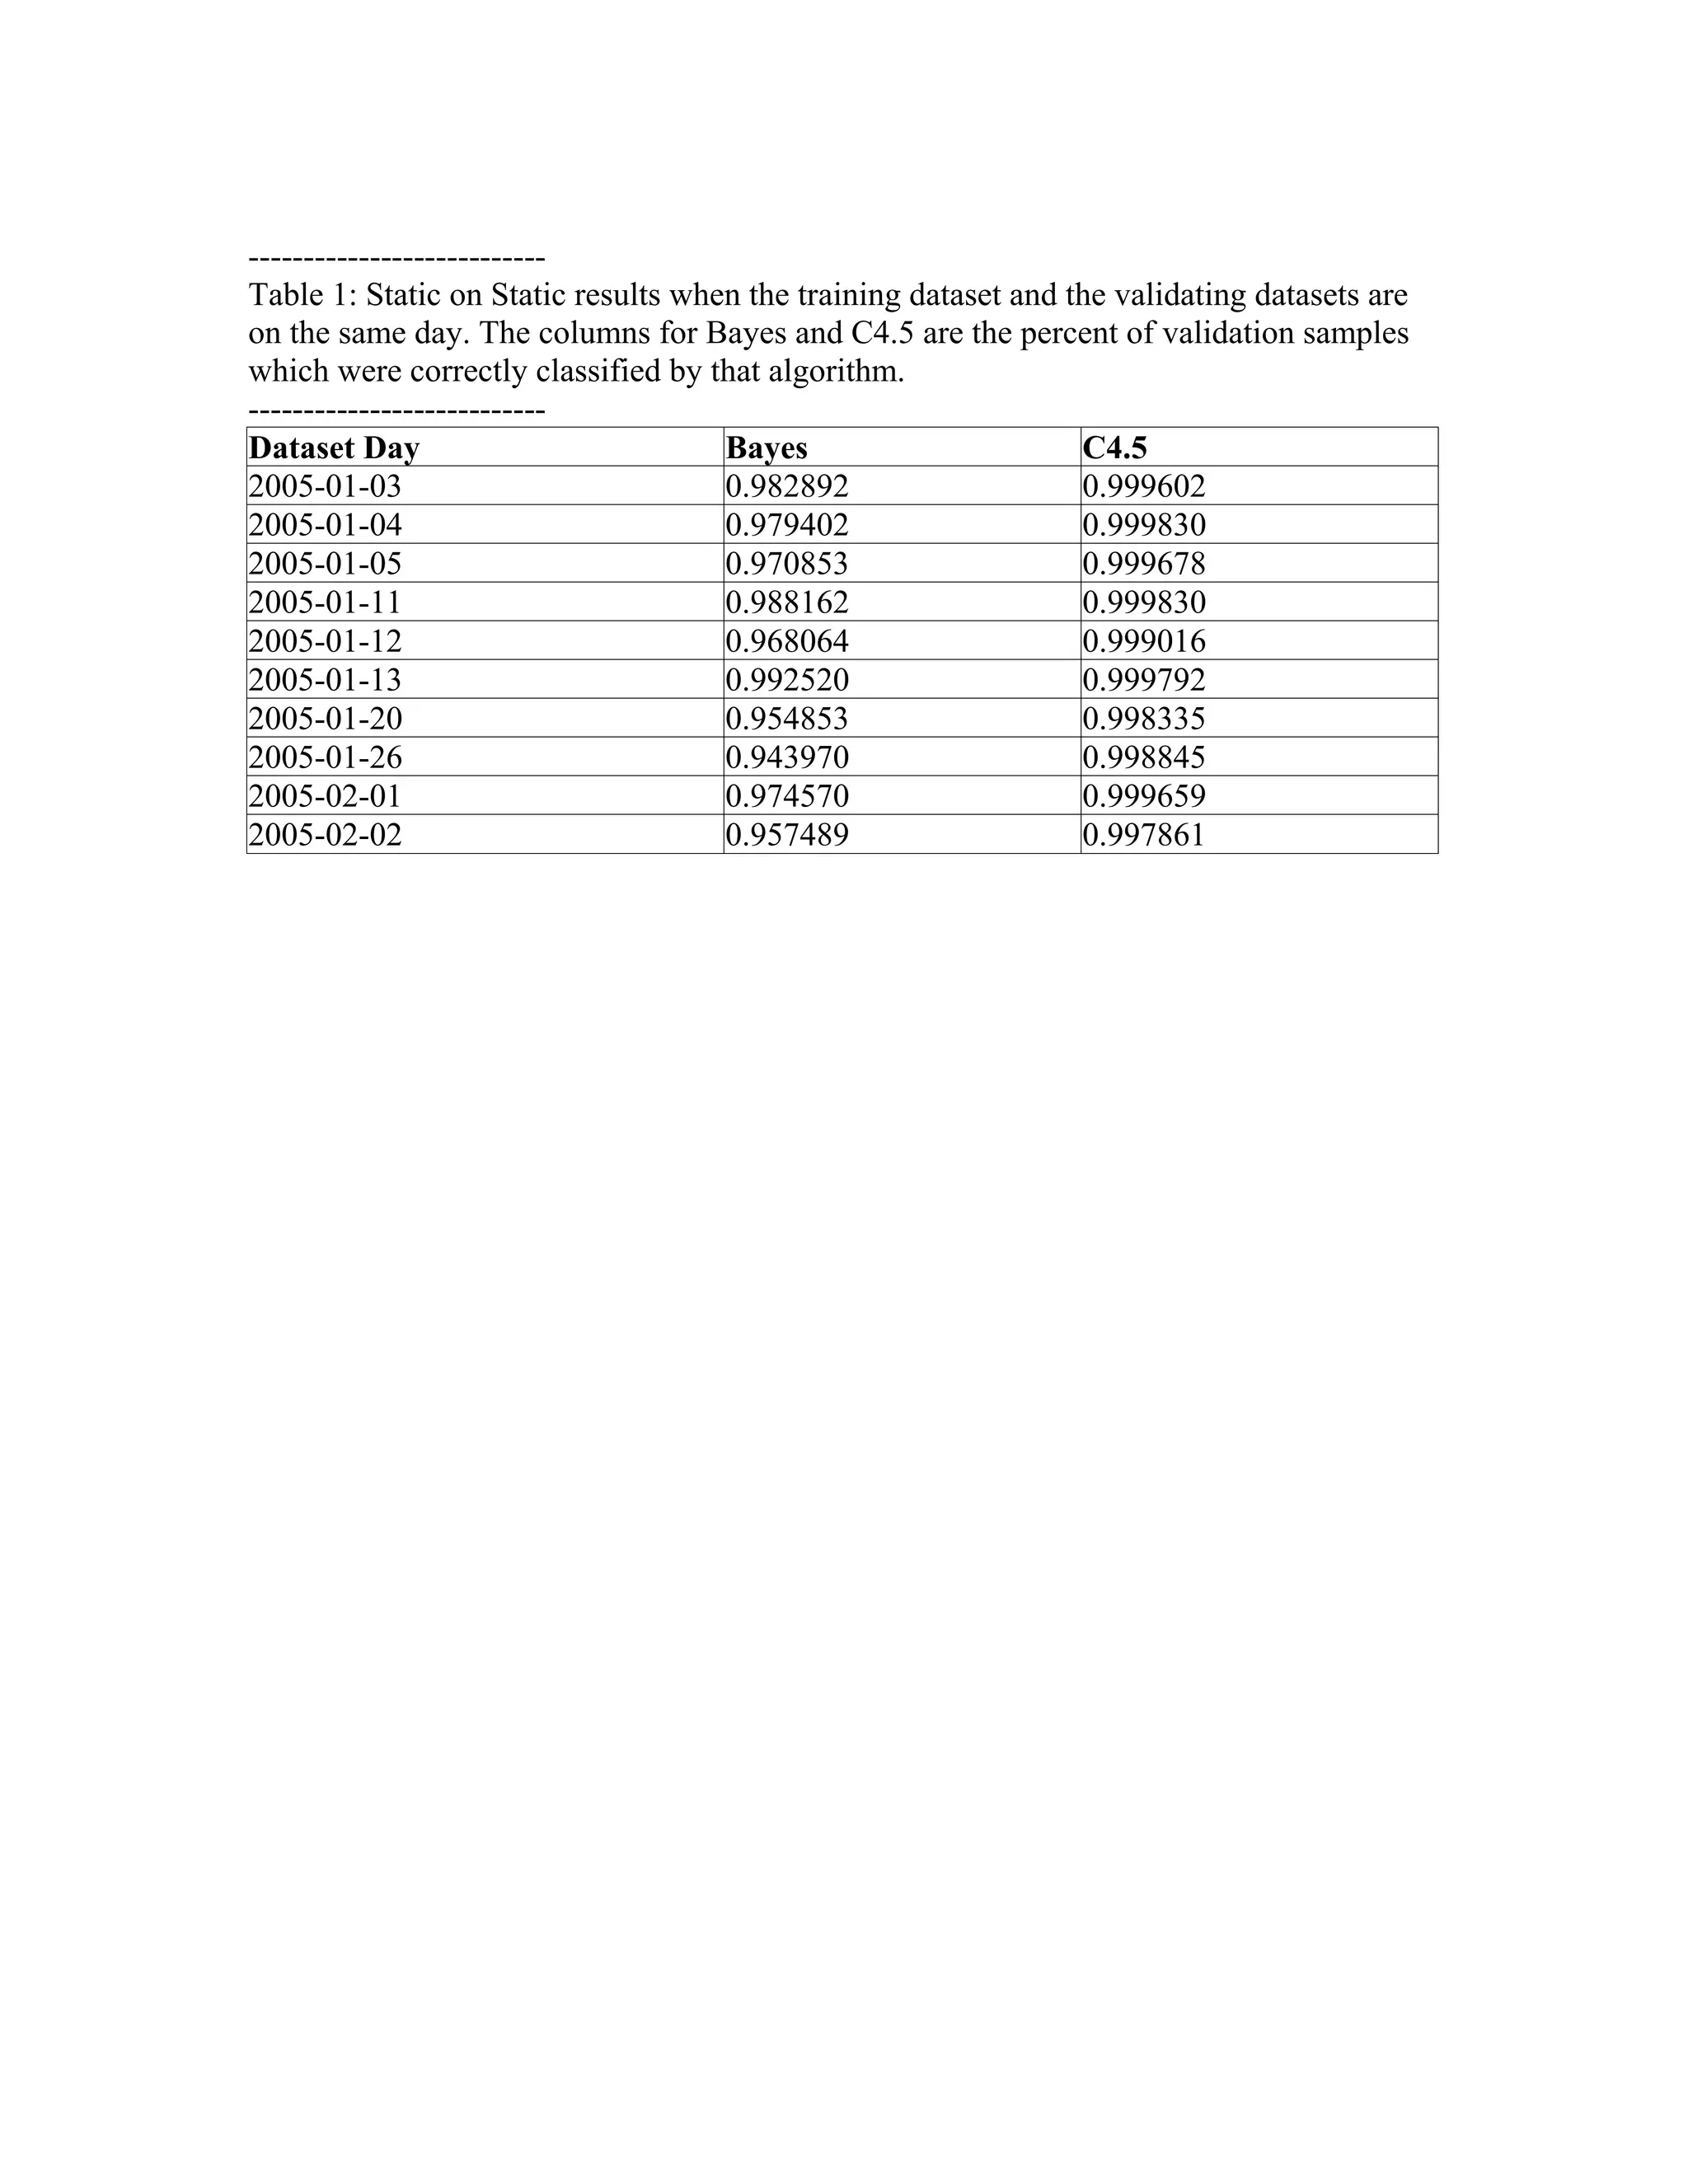
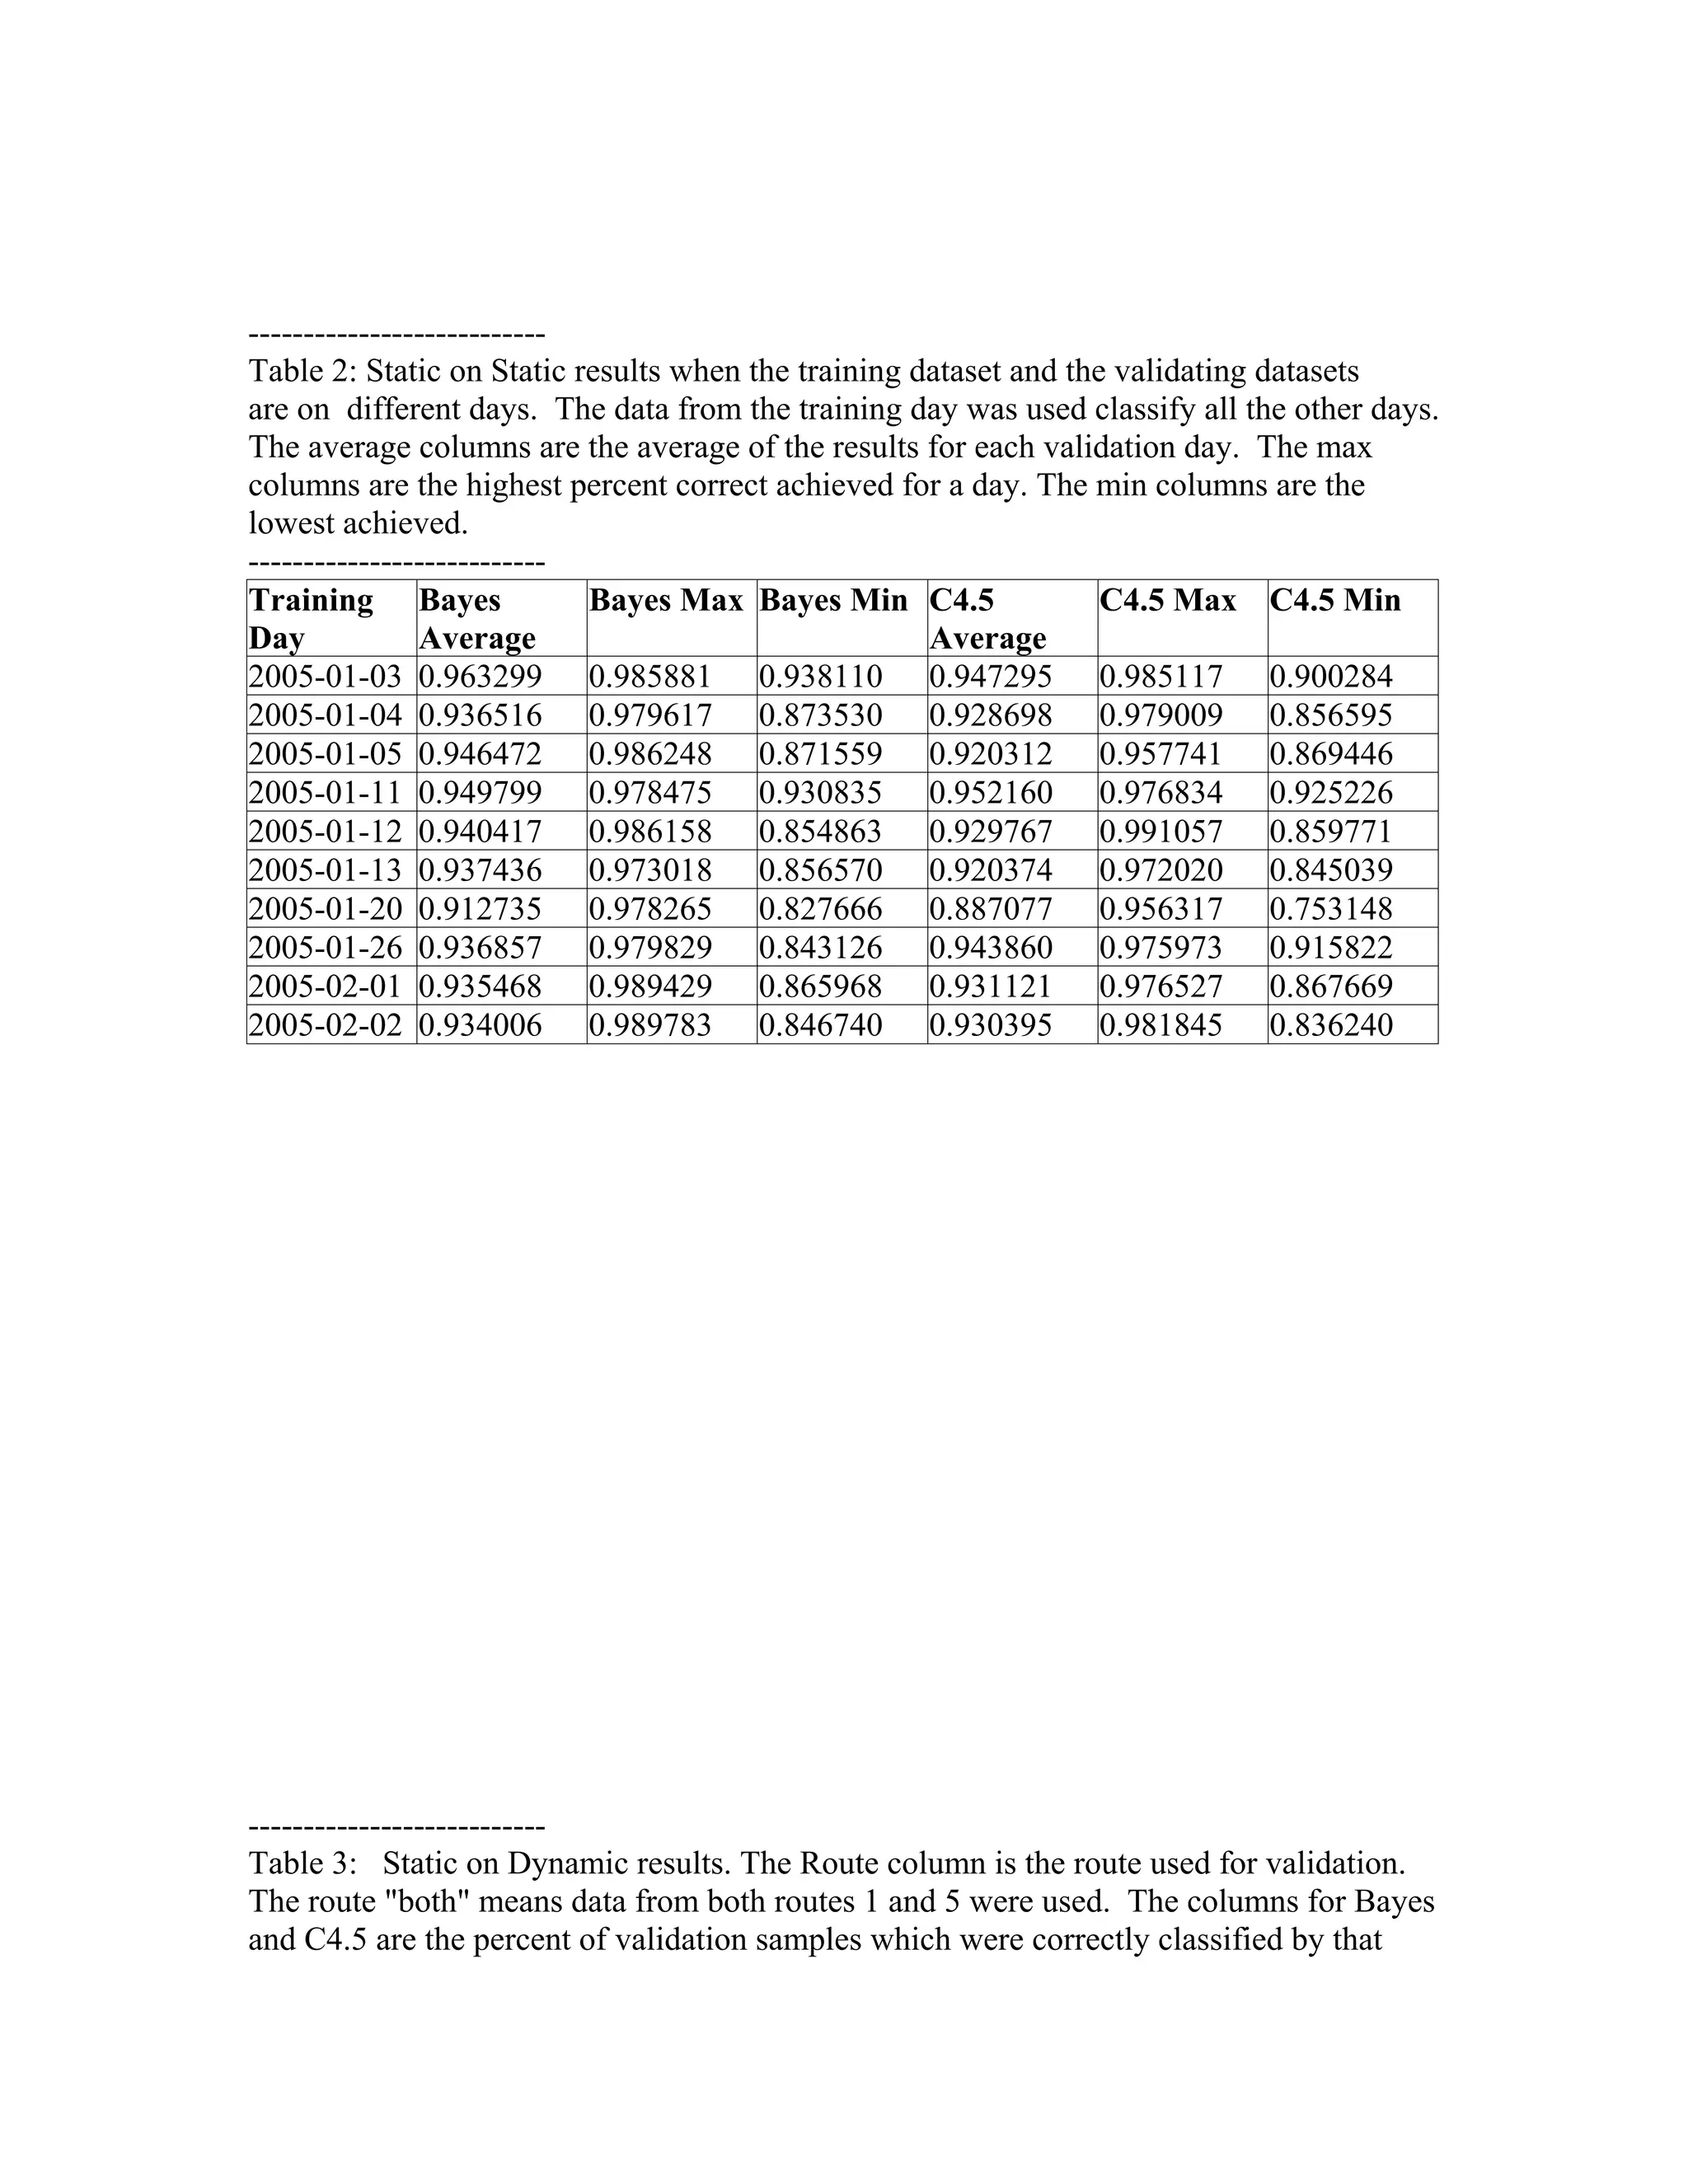
dynamic. For the static on static validation, the signatures were created from each day of
static data and validated with the other static datasets. For the static on dynamic
validation, the signatures were created from each day of static data and validated with the
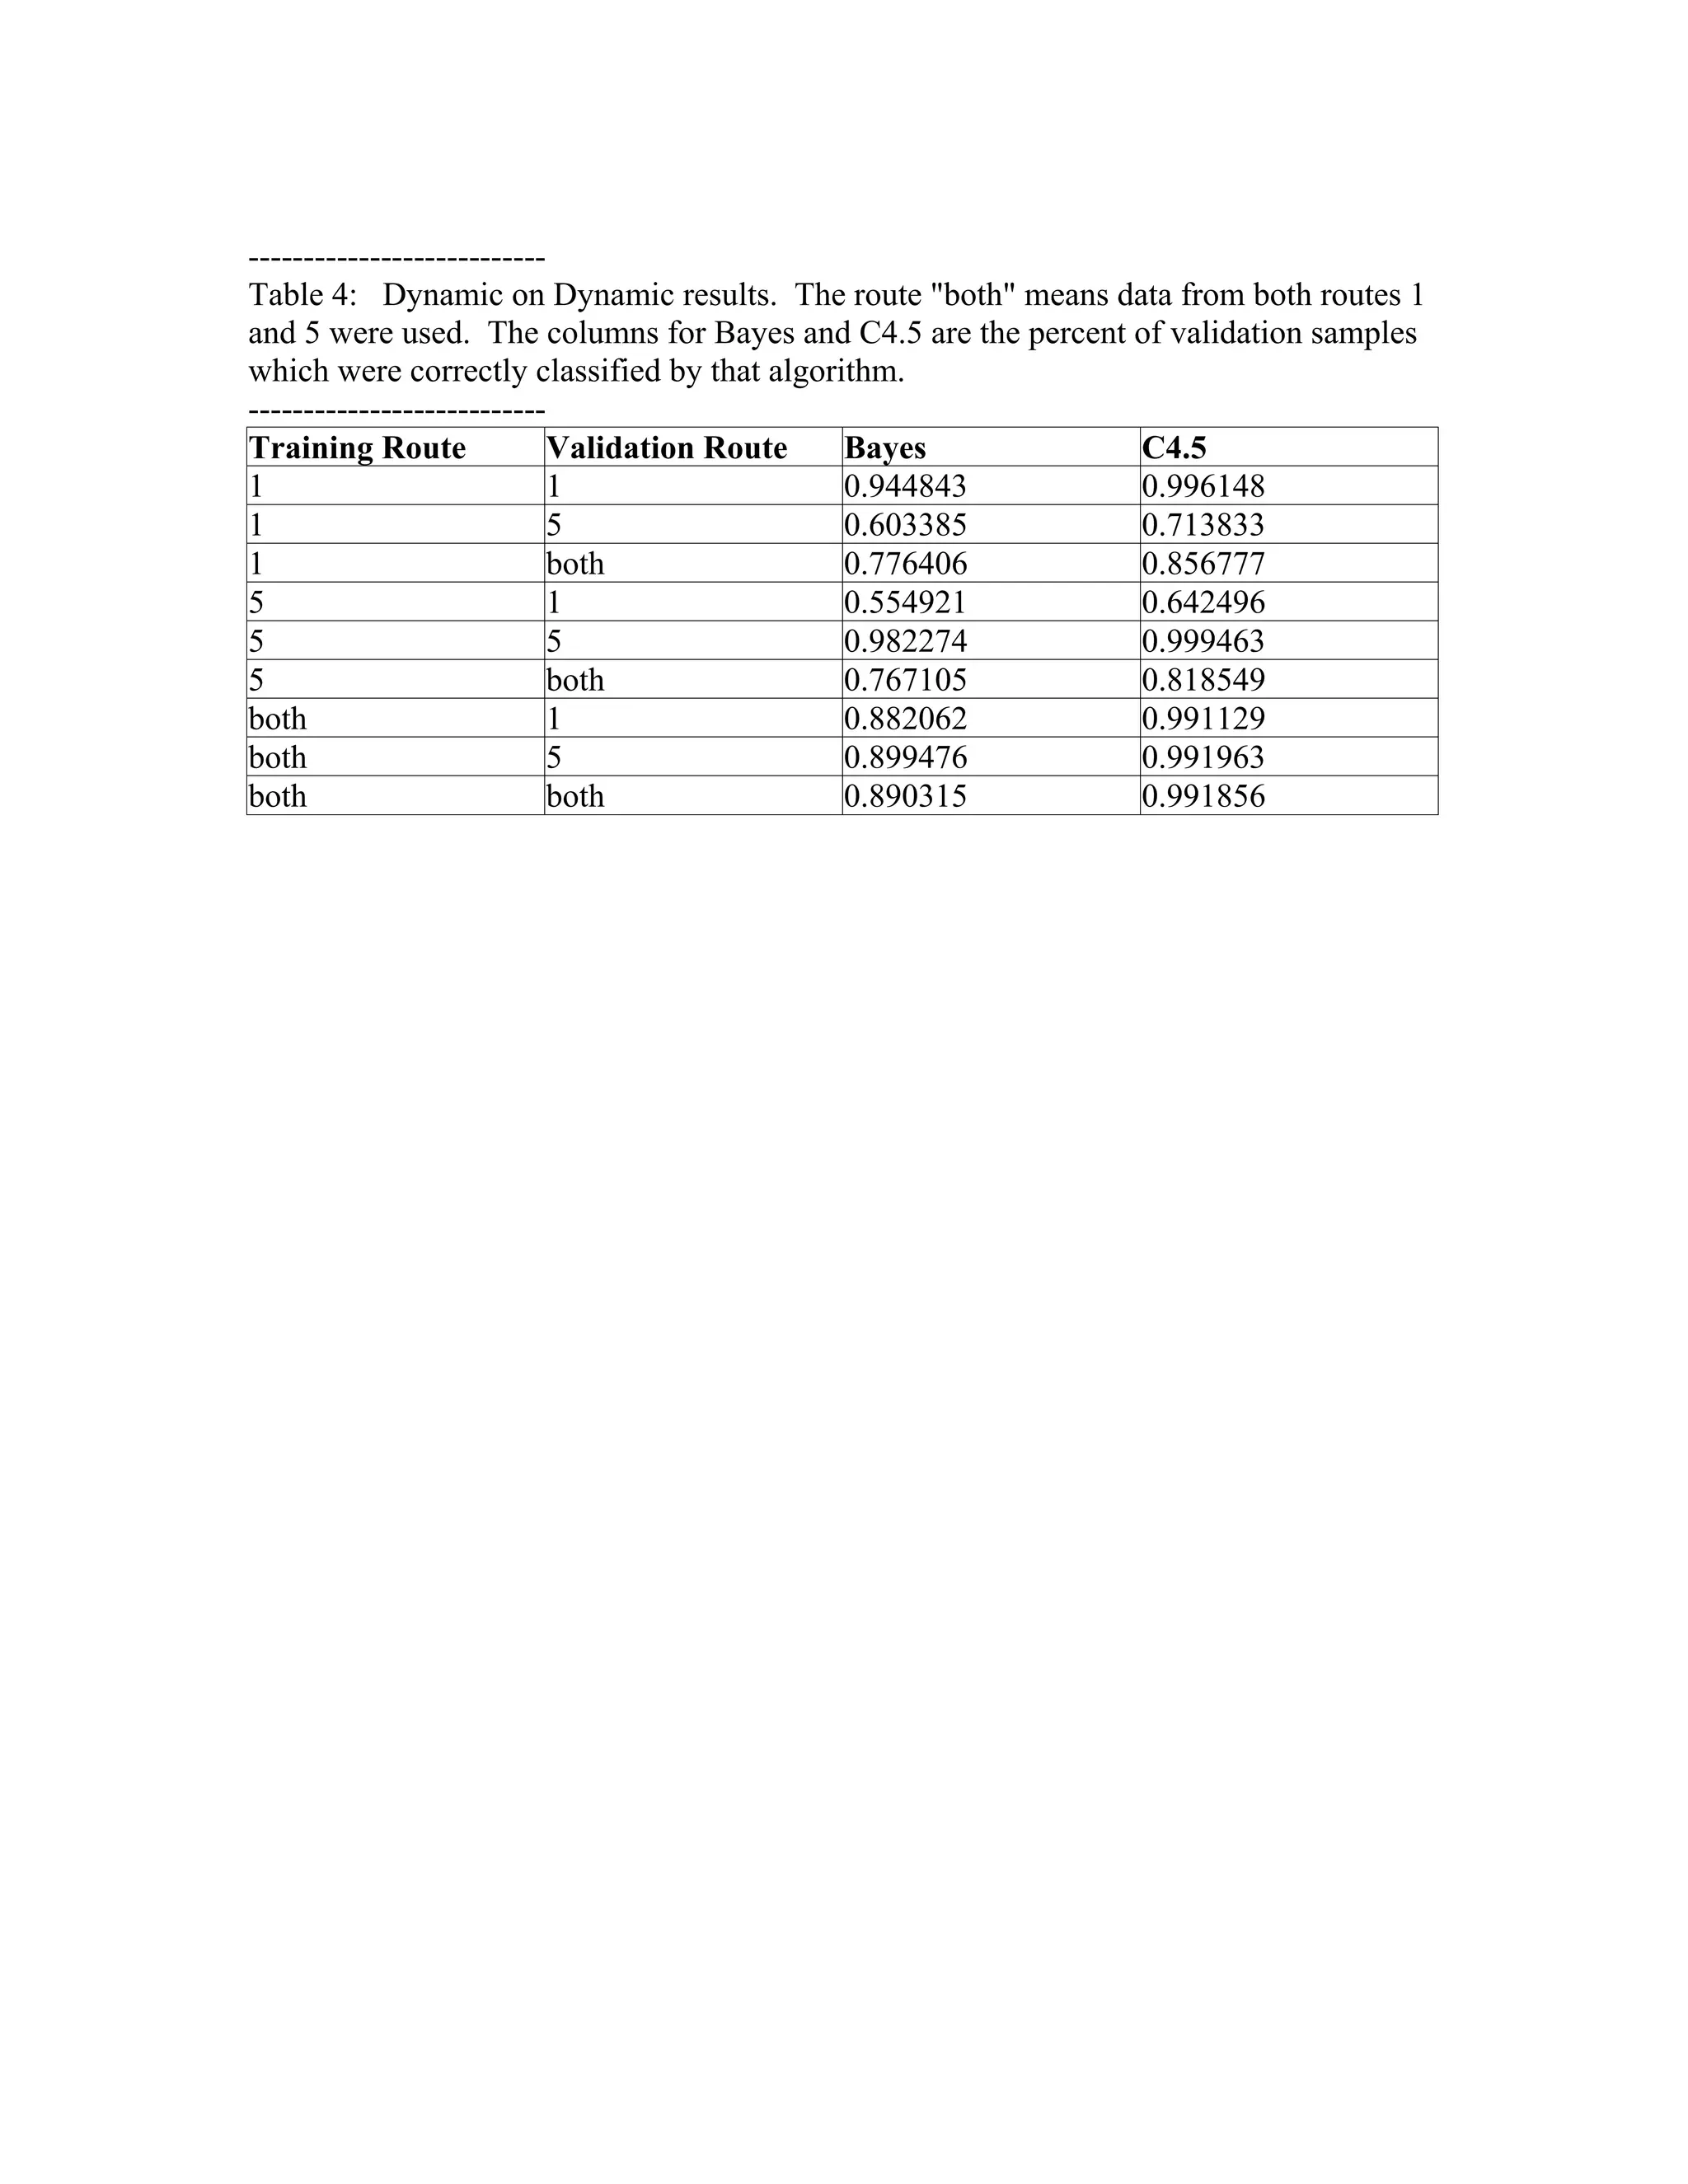
dynamic data. Finally, for the dynamic on dynamic test, the signatures were created from
the dynamic data for each route and were validated with the dynamic data from all the
routes. If the training dataset and the validation datasets were the same, e.g. the same day
of static data, then the dataset was split so that 66% of the data were used for training and
33% of the data for validation. Otherwise, 100% percent of the training dataset and 100%
of the validation dataset were used.
RESULTS](https://image.slidesharecdn.com/resna06wifiloc-111228184747-phpapp01/75/On-the-Impact-of-Data-Collection-on-the-Quality-of-Signal-Strength-in-Wi-Fi-Indoor-Localization-2-2048.jpg)

This document investigates the impact of data collection on the quality of signal strength signatures for Wi-Fi indoor localization, focusing on its implications for assisting visually impaired individuals. The study reveals that localization accuracy varies significantly depending on whether training and validation datasets are collected on the same day, with optimal performance achieved when they are identical. Key findings suggest that the timing of data collection, along with the number of samples, affects the reliability of signal signatures used for localization purposes.