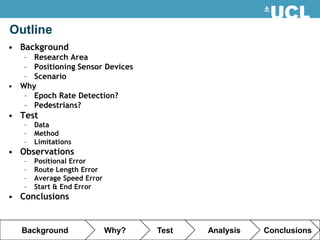
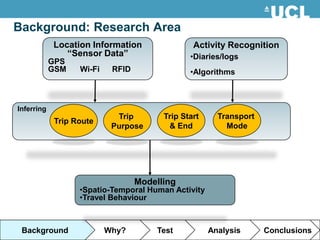
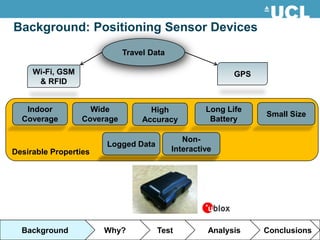
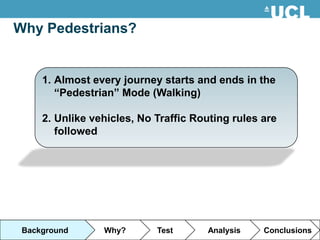
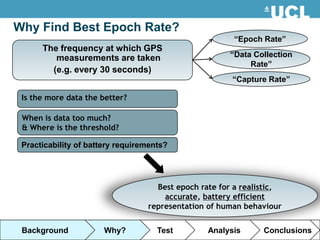
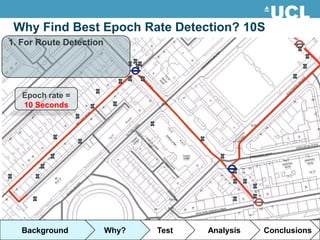
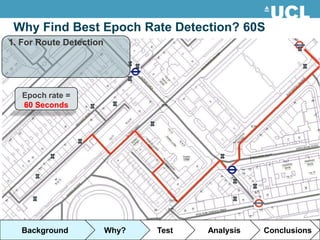
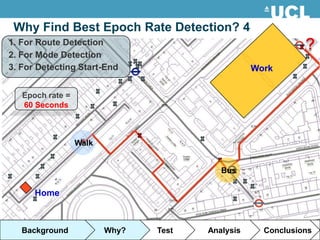
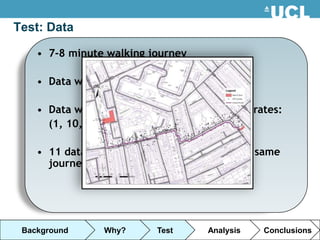
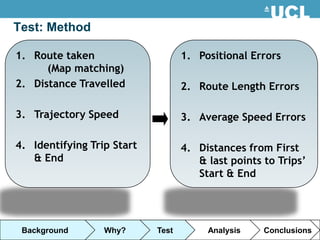
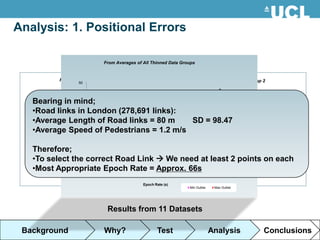
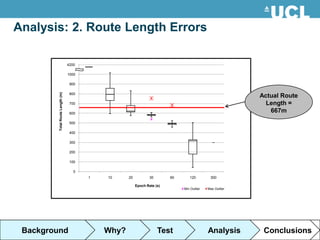
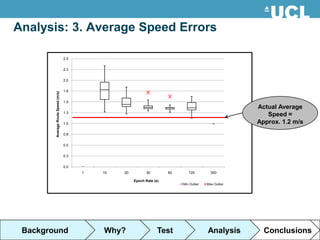
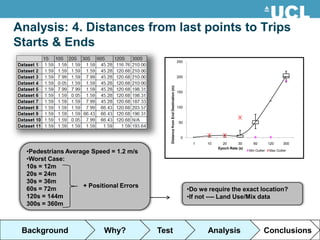
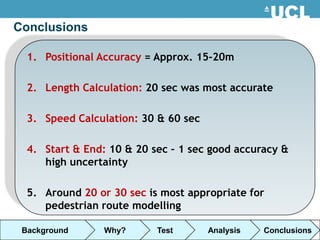
GPS Data Collection Setting
 For Pedestrian Activity Modelling

Adel Bolbol Fernández
Tao Cheng
Department of Civil, Environmental & Geomatic Engineering
UCL
Outline
• Background
   – Research Area
   – Positioning Sensor Devices
   – Scenario
• Why
   – Epoch Rate Detection?
   – Pedestrians?
• Test
   –   Data
   –   Method
   –   Limitations
• Observations
   –   Positional Error
   –   Route Length Error
   –   Average Speed Error
   –   Start & End Error
• Conclusions


   Background                Why?   Test   Analysis   Conclusions
Background: Research Area
            Location Information                Activity Recognition
               “Sensor Data”                   •Diaries/logs
            GPS
            GSM   Wi-Fi    RFID                •Algorithms


Inferring
                            Trip        Trip Start     Transport
            Trip Route
                           Purpose       & End           Mode


                                  Modelling
                  •Spatio-Temporal Human Activity
                  •Travel Behaviour


 Background               Why?        Test           Analysis      Conclusions
Background: Positioning Sensor Devices
                             Travel Data

     Wi-Fi, GSM                                             GPS
      & RFID


   Indoor           Wide            High             Long Life
                                                                  Small Size
  Coverage        Coverage        Accuracy            Battery

                                               Non-
                       Logged Data
                        Real Time          Interactivity
Desirable Properties                        Interactive


  Background           Why?           Test            Analysis    Conclusions
Why Pedestrians?


     1. Almost every journey starts and ends in the
        “Pedestrian” Mode (Walking)

     2. Unlike vehicles, No Traffic Routing rules are
        followed


 Background      Why?       Test      Analysis    Conclusions
Why Find Best Epoch Rate?
                                                       “Epoch Rate”
      The frequency at which GPS
         measurements are taken                       “Data Collection
                                                           Rate”
        (e.g. every 30 seconds)
                                                       “Capture Rate”

 Is the more data the better?

 When is data too much?
 & Where is the threshold?

 Practicability of battery requirements?


                                    Best epoch rate for a realistic,
                                      accurate, battery efficient
                                  representation of human behaviour


 Background            Why?          Test        Analysis      Conclusions
Scenario
1. Route Detection                                                      Walk
                                                                    5
2. Detection of MoT
3. Start & End Locations           2                         Work
                             Bus
4. Trip Purpose
            GPS
           points


                     User                     GPS
                                                    Walk 3
                             Home – Work
     Home
   Walk                         Trip                           4
                                                             Tube
    1

   Background         Why?             Test     Analysis        Conclusions
Why Find Best Epoch Rate Detection? 10S
1. For Route Detection


   Epoch rate =
   10 Seconds


   Background            Why?   Test   Analysis   Conclusions
Why Find Best Epoch Rate Detection? 20S
1. For Route Detection


   Epoch rate =
   20
   10 Seconds


   Background            Why?   Test   Analysis   Conclusions
Why Find Best Epoch Rate Detection? 60S
1. For Route Detection


   Epoch rate =
   60
   20 Seconds


   Background            Why?   Test   Analysis   Conclusions
Why Find Best Epoch Rate Detection? 4
1. For Route Detection
2. For Mode Detection
3. For Detecting Start-End                        Work


   Epoch rate =
   60 Seconds


                  Walk


                                          Bus

      Home


   Background            Why?   Test   Analysis     Conclusions
Test: Data

    • 7-8 minute walking journey

    • Data was collected every 1 second

    • Data was thinned to the following epoch rates:
      (1, 10, 20, 30, 60, 120 and 300 seconds)

    • 11 datasets were collected for the exact same
      journey


 Background      Why?      Test      Analysis   Conclusions
Test: Method

1. Route taken                     1. Positional Errors
      (Map matching)
2. Distance Travelled              2. Route Length Errors

3. Trajectory Speed                3. Average Speed Errors

4. Identifying Trip Start          4. Distances from First
   & End                              & last points to Trips’
                                      Start & End


 Background       Why?      Test        Analysis    Conclusions
Analysis: 1. Positional Errors

                                                                     From Averages of All Thinned Data Groups


                                 From Thinned Data Group 1                                                                                         From Thinned Data Group 2
                                                            50
                                     Positional Error (m)


                                                            40
                         Bearing in mind;
                          100                                   100
  Positional Error (m)


                                                                                                         Positional Error (m)
                         •Road links in London (278,691 links): 80
                           80
                                     30

                         •Average Length of Road links = 80 m 60 SD = 98.47
                           60
                                     20
                         •Average Speed of Pedestrians = 1.2 m/s40
                           40                                              Average
                          20                                                                                                    20
                                                                                                                                                                = 15 m
                                                            10

                         Therefore;
                            0                                            0

                                        0
                         •To select the correct Road Link  We need1 at least 2 points 120 each
                          -20
                              1  10   20  30 60     120  300
                                                                       -20
                                                                             10 20 30  60
                                                                                                on 300
                         •Most AppropriateMin Outlier Max Rate = Approx. 66s
                                      -10    Epoch Outlier                            Min Outlier Max Outlier
                                                                 1        10       20          30                         60             120           300
                                                                                                                                                     Epoch Rate (s)
                                     Epoch Rate (s)
                                                                                        Epoch Rate (s)
                                                                                                                                     Min Outlier      Max Outlier


                                                                      Results from 11 Datasets

 Background                                                          Why?                      Test                                                Analysis                Conclusions
Analysis: 2. Route Length Errors

                                  1100
                                  4200

                                  1000

                                   900
         Total Route Length (m)


                                   800
                                                                                                           Actual Route
                                   700                                                                       Length =
                                   600
                                                                                                              667m
                                   500

                                   400

                                   300

                                   200

                                   100

                                     0
                                         1   10     20           30       60      120         300

                                                         Epoch Rate (s)
                                                                               Min Outlier   Max Outlier


 Background                                  Why?                     Test                   Analysis       Conclusions
Analysis: 3. Average Speed Errors

                                    2.5


                                    2.3


                                    2.0


                                    1.8
        Average Route Speed (m/s)


                                    1.5
                                                                                                          Actual Average
                                    1.3
                                                                                                             Speed =
                                    1.0                                                                   Approx. 1.2 m/s
                                    0.8


                                    0.5


                                    0.3


                                    0.0
                                          1   10   20          30        60      120          300

                                                        Epoch Rate (s)
                                                                              Min Outlier   Max Outlier


 Background                                   Why?                   Test                   Analysis        Conclusions
Analysis: 4. Distances from last points to Trips
Starts & Ends
                                                                                 250


                                                                                 200


                                             Distance from End Destination (m)
                                                                                 150


                                                                                 100


                                                                                  50


                                                                                  0
                                                                                         1   10     20       30       60         120      300
                                                                                                  Epoch Rate (s)
  •Pedestrians Average Speed = 1.2 m/s                                                                             Min Outlier   Max Outlier

  •Worst Case:
  10s = 12m
  20s = 24m
  30s = 36m
                    + Positional Errors
  60s = 72m                                                                            •Do we require the exact location?
  120s = 144m                                                                          •If not ---- Land Use/Mix data
  300s = 360m


 Background                Why?           Test                                                Analysis                       Conclusions
Conclusions

  1. Positional Accuracy = Approx. 15-20m

  2. Length Calculation: 20 sec was most accurate

  3. Speed Calculation: 30 & 60 sec

  4. Start & End: 10 & 20 sec – 1 sec good accuracy &
     high uncertainty

  5. Around 20 or 30 sec is most appropriate for
     pedestrian route modelling

 Background      Why?      Test       Analysis   Conclusions
Thank You
& what are your questions?


a.bolbol@ucl.ac.uk

7A_4_Gps data collection setting for pedestrian activity modelling

  • 1.
    GPS Data CollectionSetting For Pedestrian Activity Modelling Adel Bolbol Fernández Tao Cheng Department of Civil, Environmental & Geomatic Engineering UCL
  • 2.
    Outline • Background – Research Area – Positioning Sensor Devices – Scenario • Why – Epoch Rate Detection? – Pedestrians? • Test – Data – Method – Limitations • Observations – Positional Error – Route Length Error – Average Speed Error – Start & End Error • Conclusions Background Why? Test Analysis Conclusions
  • 3.
    Background: Research Area Location Information Activity Recognition “Sensor Data” •Diaries/logs GPS GSM Wi-Fi RFID •Algorithms Inferring Trip Trip Start Transport Trip Route Purpose & End Mode Modelling •Spatio-Temporal Human Activity •Travel Behaviour Background Why? Test Analysis Conclusions
  • 4.
    Background: Positioning SensorDevices Travel Data Wi-Fi, GSM GPS & RFID Indoor Wide High Long Life Small Size Coverage Coverage Accuracy Battery Non- Logged Data Real Time Interactivity Desirable Properties Interactive Background Why? Test Analysis Conclusions
  • 5.
    Why Pedestrians? 1. Almost every journey starts and ends in the “Pedestrian” Mode (Walking) 2. Unlike vehicles, No Traffic Routing rules are followed Background Why? Test Analysis Conclusions
  • 6.
    Why Find BestEpoch Rate? “Epoch Rate” The frequency at which GPS measurements are taken “Data Collection Rate” (e.g. every 30 seconds) “Capture Rate” Is the more data the better? When is data too much? & Where is the threshold? Practicability of battery requirements? Best epoch rate for a realistic, accurate, battery efficient representation of human behaviour Background Why? Test Analysis Conclusions
  • 7.
    Scenario 1. Route Detection Walk 5 2. Detection of MoT 3. Start & End Locations 2 Work Bus 4. Trip Purpose GPS points User GPS Walk 3 Home – Work Home Walk Trip 4 Tube 1 Background Why? Test Analysis Conclusions
  • 8.
    Why Find BestEpoch Rate Detection? 10S 1. For Route Detection Epoch rate = 10 Seconds Background Why? Test Analysis Conclusions
  • 9.
    Why Find BestEpoch Rate Detection? 20S 1. For Route Detection Epoch rate = 20 10 Seconds Background Why? Test Analysis Conclusions
  • 10.
    Why Find BestEpoch Rate Detection? 60S 1. For Route Detection Epoch rate = 60 20 Seconds Background Why? Test Analysis Conclusions
  • 11.
    Why Find BestEpoch Rate Detection? 4 1. For Route Detection 2. For Mode Detection 3. For Detecting Start-End Work Epoch rate = 60 Seconds Walk Bus Home Background Why? Test Analysis Conclusions
  • 12.
    Test: Data • 7-8 minute walking journey • Data was collected every 1 second • Data was thinned to the following epoch rates: (1, 10, 20, 30, 60, 120 and 300 seconds) • 11 datasets were collected for the exact same journey Background Why? Test Analysis Conclusions
  • 13.
    Test: Method 1. Routetaken 1. Positional Errors (Map matching) 2. Distance Travelled 2. Route Length Errors 3. Trajectory Speed 3. Average Speed Errors 4. Identifying Trip Start 4. Distances from First & End & last points to Trips’ Start & End Background Why? Test Analysis Conclusions
  • 14.
    Analysis: 1. PositionalErrors From Averages of All Thinned Data Groups From Thinned Data Group 1 From Thinned Data Group 2 50 Positional Error (m) 40 Bearing in mind; 100 100 Positional Error (m) Positional Error (m) •Road links in London (278,691 links): 80 80 30 •Average Length of Road links = 80 m 60 SD = 98.47 60 20 •Average Speed of Pedestrians = 1.2 m/s40 40 Average 20 20 = 15 m 10 Therefore; 0 0 0 •To select the correct Road Link  We need1 at least 2 points 120 each -20 1 10 20 30 60 120 300 -20 10 20 30 60 on 300 •Most AppropriateMin Outlier Max Rate = Approx. 66s -10 Epoch Outlier Min Outlier Max Outlier 1 10 20 30 60 120 300 Epoch Rate (s) Epoch Rate (s) Epoch Rate (s) Min Outlier Max Outlier Results from 11 Datasets Background Why? Test Analysis Conclusions
  • 15.
    Analysis: 2. RouteLength Errors 1100 4200 1000 900 Total Route Length (m) 800 Actual Route 700 Length = 600 667m 500 400 300 200 100 0 1 10 20 30 60 120 300 Epoch Rate (s) Min Outlier Max Outlier Background Why? Test Analysis Conclusions
  • 16.
    Analysis: 3. AverageSpeed Errors 2.5 2.3 2.0 1.8 Average Route Speed (m/s) 1.5 Actual Average 1.3 Speed = 1.0 Approx. 1.2 m/s 0.8 0.5 0.3 0.0 1 10 20 30 60 120 300 Epoch Rate (s) Min Outlier Max Outlier Background Why? Test Analysis Conclusions
  • 17.
    Analysis: 4. Distancesfrom last points to Trips Starts & Ends 250 200 Distance from End Destination (m) 150 100 50 0 1 10 20 30 60 120 300 Epoch Rate (s) •Pedestrians Average Speed = 1.2 m/s Min Outlier Max Outlier •Worst Case: 10s = 12m 20s = 24m 30s = 36m + Positional Errors 60s = 72m •Do we require the exact location? 120s = 144m •If not ---- Land Use/Mix data 300s = 360m Background Why? Test Analysis Conclusions
  • 18.
    Conclusions 1.Positional Accuracy = Approx. 15-20m 2. Length Calculation: 20 sec was most accurate 3. Speed Calculation: 30 & 60 sec 4. Start & End: 10 & 20 sec – 1 sec good accuracy & high uncertainty 5. Around 20 or 30 sec is most appropriate for pedestrian route modelling Background Why? Test Analysis Conclusions
  • 19.
    Thank You & whatare your questions? a.bolbol@ucl.ac.uk