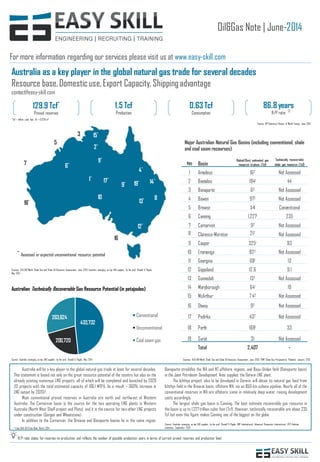
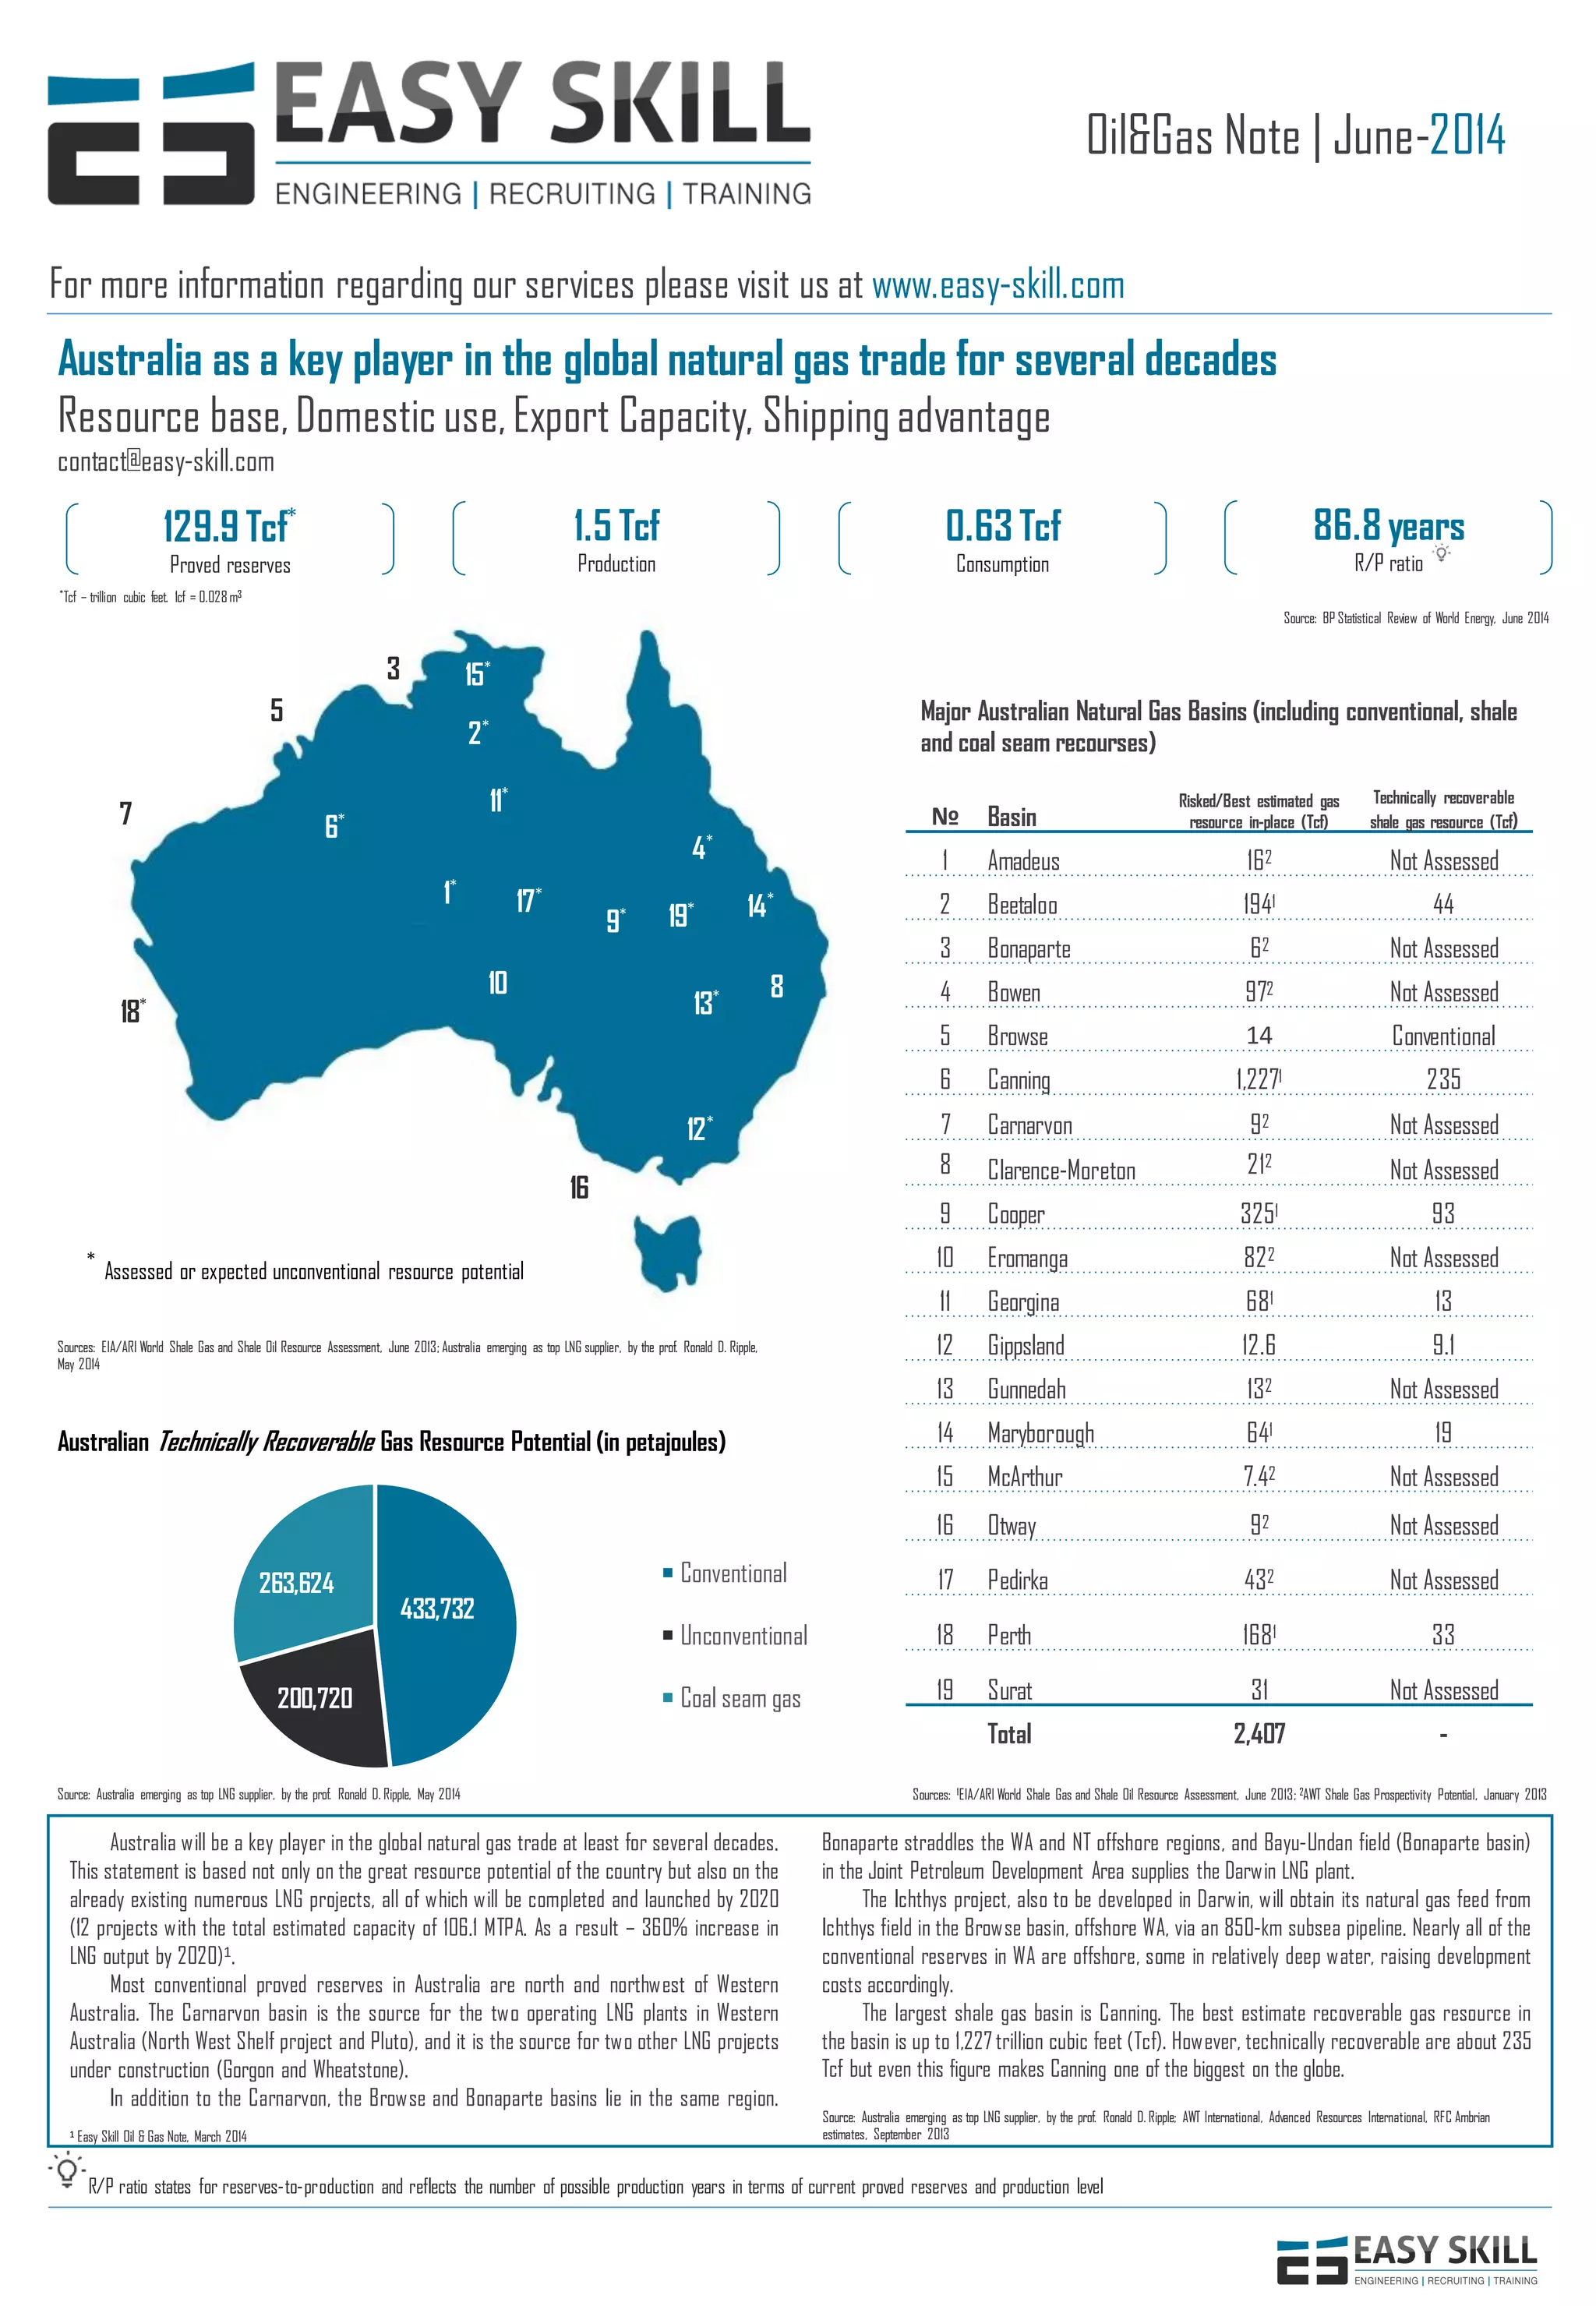
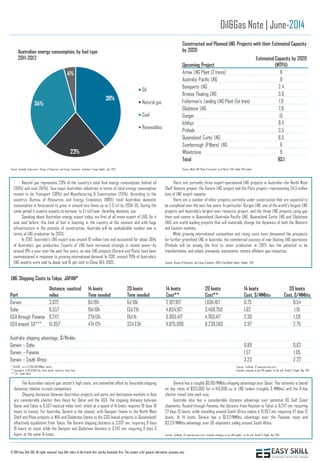
1*
2*
3
6*
4*
5
7
8
9*
10
11*
13*
14*
15*
16
17*
18*
19*
12*
Oil&Gas Note | June-2014
For more information regarding our services please visit us at www.easy-skill.com
Australia as a key player in the global natural gas trade for several decades
Resource base,Domestic use,Export Capacity, Shippingadvantage
contact@easy-skill.com
129.9 Tcf*
Proved reserves
1.5 Tcf
Production
86.8 years
R/P ratio
0.63 Tcf
Consumption
R/P ratio states for reserves-to-production and reflects the number of possible production years in terms of current proved reserves and production level
Source: BP Statistical Review of World Energy, June 2014
№ Basin
Risked/Best estimated gas
resource in-place (Tcf)
Technically recoverable
shale gas resource (Tcf)
1 Amadeus 162 Not Assessed
2 Beetaloo 1941 44
3 Bonaparte 62 Not Assessed
4 Bowen 972 Not Assessed
5 Browse 14 Conventional
6 Canning 1,2271 235
7 Carnarvon 92 Not Assessed
8 Clarence-Moreton 212
Not Assessed
9 Cooper 3251 93
10 Eromanga 822 Not Assessed
11 Georgina 681 13
12 Gippsland 12.6 9.1
13 Gunnedah 132 Not Assessed
14 Maryborough 641 19
15 McArthur 7.42 Not Assessed
16 Otway 92 Not Assessed
17 Pedirka 432 Not Assessed
18 Perth 1681 33
19 Surat 31 Not Assessed
Total 2,407 -
Sources: 1EIA/ARI World Shale Gas and Shale Oil Resource Assessment, June 2013; 2AWT Shale Gas Prospectivity Potential, January 2013
*Tcf – trillion cubic feet. 1cf = 0.028m3
Australia will be a key player in the global natural gas trade at least for several decades.
This statement is based not only on the great resource potential of the country but also on the
already existing numerous LNG projects, all of which will be completed and launched by 2020
(12 projects with the total estimated capacity of 106.1 MTPA. As a result – 360% increase in
LNG output by 2020)1.
Most conventional proved reserves in Australia are north and northwest of Western
Australia. The Carnarvon basin is the source for the two operating LNG plants in Western
Australia (North West Shelf project and Pluto), and it is the source for two other LNG projects
under construction (Gorgon and Wheatstone).
In addition to the Carnarvon, the Browse and Bonaparte basins lie in the same region.
Bonaparte straddles the WA and NT offshore regions, and Bayu-Undan field (Bonaparte basin)
in the Joint Petroleum Development Area supplies the Darwin LNG plant.
The Ichthys project, also to be developed in Darwin, will obtain its natural gas feed from
Ichthys field in the Browse basin, offshore WA, via an 850-km subsea pipeline. Nearly all of the
conventional reserves in WA are offshore, some in relatively deep water, raising development
costs accordingly.
The largest shale gas basin is Canning. The best estimate recoverable gas resource in
the basin is up to 1,227 trillion cubic feet (Tcf). However, technically recoverable are about 235
Tcf but even this figure makes Canning one of the biggest on the globe.
Source: Australia emerging as top LNG supplier, by the prof. Ronald D. Ripple; AWT International, Advanced Resources International, RFC Ambrian
estimates, September 2013
433,732
200,720
263,624 Conventional
Unconventional
Coal seam gas
Australian Technically Recoverable Gas Resource Potential (in petajoules)
Source: Australia emerging as top LNG supplier, by the prof. Ronald D. Ripple, May 2014
Sources: EIA/ARI World Shale Gas and Shale Oil Resource Assessment, June 2013; Australia emerging as top LNG supplier, by the prof. Ronald D. Ripple,
May 2014
Assessed or expected unconventional resource potential
1 Easy Skill Oil & Gas Note, March 2014
*
Major Australian Natural Gas Basins (including conventional, shale
and coal seam recourses)
Oil&Gas Note | June-2014
© 2014 Easy Skill SAS. All rights reserved. Easy Skill refers to the French firm and the Australian firm. This content is for general information purposes only.
39%
23%
34%
4%
Oil
Natural gas
Coal
Renewables
Upcoming Project
Estimated Capacity by 2020
(MTPA)
Arrow LNG Plant (2 trains) 8
Australia Pacific LNG 9
Bonaparte LNG 2.4
Browse Floating LNG 3.6
Fisherman’s Landing LNG Plant (1st train) 1.9
Gladstone LNG 7.8
Gorgon 15
Ichthys 8.4
Prelude 3.5
Queensland Curtis LNG 8.5
Scarborough (Pilbara) LNG 6
Wheatstone 9
Total 83.1
LNG Shipping Costs to Tokyo, JAPAN*
Constructed and Planned LNG Projects with their Estimated Capacity
by 2020
Source: World LNG Plants & Terminals as of March 2014, Global LNG LimitedSource: Australia Government, Bureau of Resources and Energy Economics, Australian Energy Update, July 2013
Natural gas represents 23% of the country's total final energy consumption, behind oil
(39%) and coal (34%). Two major Australian industries in terms of total energy consumption
remain to be Transport (38%) and Manufacturing & Construction (25%). According to the
country's Bureau of Resources and Energy Economics (BREE) total Australian domestic
consumption is forecasted to grow in around two times up to 2.3 tcf by 2034-35. During the
same period it expects exports to increase to 5.1 tcf/year, dwarfing domestic use.
Speaking about Australian energy export today, we first of all mean export of LNG. As it
was said before, this kind of fuel is booming in the country at the moment and with huge
infrastructure in the process of construction, Australia will be undoubtable number one in
terms of LNG production by 2020.
In 2012, Australia’s LNG export was around 19 million tons and accounted for about 36%
of Australia’s gas production. Exports of LNG have increased strongly in recent years—by
around 8% a year over the past five years, as new LNG projects (Darwin and Pluto) have been
commissioned in response to growing international demand. In 2012, around 79% of Australia’s
LNG exports were sold to Japan and 16 per cent to China (IEA 2013).
There are currently three export-operational LNG projects in Australia—the North West
Shelf Venture project, the Darwin LNG project and the Pluto project—representing 24.3 million
tons of LNG export capacity.
There are a number of other projects currently under construction that are expected to
be completed over the next few years. In particular, Gorgon LNG, one of the world’s largest LNG
projects and Australia’s largest ever resource project, and the three LNG projects using gas
from coal seams in Queensland (Australia Pacific LNG, Queensland Curtis LNG and Gladstone
LNG) are world leading projects that will materially change the dynamics of both the Western
and Eastern markets.
While growing international competition and rising costs have dampened the prospects
for further greenfield LNG in Australia, the commercial success of new floating LNG operations
(Prelude will be among the first to enter production in 2017) has the potential to be
transformative and unlock previously uneconomic remote offshore gas resources.
Sources: Bureau of Resources and Energy Economics (BREE),Gas Market Report, October 2013
Port
Distance, nautical
miles
14 knots
Time needed
20 knots
Time needed
14 knots
Cost**
20 knots
Cost**
14 knots
Cost, $/MMbtu
20 knots
Cost, $/MMbtu
Darwin 3,072 8d 19h 6d 10h 2,197,917 1,604,167 0.73 0.54
Doha 6,557 19d10h 13d21h 4,854,167 3,468,750 1.62 1.16
USA through Panama 9,247 27d13h 19d1h 6,885,417 4,760,417 2.30 1.59
USA around SA*** 15,957 47d 12h 32d23h 11,875,000 8,239,583 3.97 2.75
Australia shipping advantage, $/Mmbtu
Darwin – Doha 0.89 0.62
Darwin – Panama 1.57 1.05
Darwin – South Africa 3.23 2.22
Australian energy consumption, by fuel type
2011-2012
* 140,000 – cu m (2,995,000MMbtu) vessel
** Assumption of $125,000/day. Costs include round-trip travel time
*** SA – South Africa
Sources: SeaRates LP (www.searates.com)
Australia emerging as top LNG supplier, by the prof. Ronald D. Ripple, May 2014
The Australian natural gas sector's high costs, are somewhat offset by favorable shipping
distances relative to most competitors
Shipping distances between Australian projects and ports and destination markets in Asia
are considerably shorter than those for Qatar and the USA. The shipping distance between
Qatar and Tokyo is 6,557 nautical miles (nm), which at a speed of 14 knots requires 19 days 10
hours to transit. For Australia, Darwin is the closest, with Dampier (home to the North West
Shelf and Pluto projects in WA) and Gladstone (home to the CSG-based projects in Queensland)
effectively equidistant from Tokyo. The Darwin shipping distance is 3,072 nm, requiring 8 days
19 hours en route, while the Dampier and Gladstone distance is 3,742 nm, requiring 11 days 3
hours at the same 14 knots.
Darwin has a roughly $0.89/MMbtu shipping advantage over Qatar. This estimate is based
on day rates of $125,000 for a 140,000-cu m LNG tanker (roughly 3 MMbtu) and the 11-day
shorter travel time each way.
Australia also has a considerable distance advantage over potential US Gulf Coast
shipments. Routed through Panama, the distance from Houston to Tokyo is 9,247 nm, requiring
27 days 13 hours, while travelling around South Africa makes it 15,957 nm, requiring 47 days 12
hours. At 14 knots, Darwin has a $1.57/MMbtu advantage over the Panama route and
$3.23/MMbtu advantage over US shipments sailing around South Africa.
Sources: SeaRates LP (www.searates.com); Australia emerging as top LNG supplier, by the prof. Ronald D. Ripple, May 2014

Autralia: Oil & Gas Note

  • 1.
    1* 2* 3 6* 4* 5 7 8 9* 10 11* 13* 14* 15* 16 17* 18* 19* 12* Oil&Gas Note |June-2014 For more information regarding our services please visit us at www.easy-skill.com Australia as a key player in the global natural gas trade for several decades Resource base,Domestic use,Export Capacity, Shippingadvantage contact@easy-skill.com 129.9 Tcf* Proved reserves 1.5 Tcf Production 86.8 years R/P ratio 0.63 Tcf Consumption R/P ratio states for reserves-to-production and reflects the number of possible production years in terms of current proved reserves and production level Source: BP Statistical Review of World Energy, June 2014 № Basin Risked/Best estimated gas resource in-place (Tcf) Technically recoverable shale gas resource (Tcf) 1 Amadeus 162 Not Assessed 2 Beetaloo 1941 44 3 Bonaparte 62 Not Assessed 4 Bowen 972 Not Assessed 5 Browse 14 Conventional 6 Canning 1,2271 235 7 Carnarvon 92 Not Assessed 8 Clarence-Moreton 212 Not Assessed 9 Cooper 3251 93 10 Eromanga 822 Not Assessed 11 Georgina 681 13 12 Gippsland 12.6 9.1 13 Gunnedah 132 Not Assessed 14 Maryborough 641 19 15 McArthur 7.42 Not Assessed 16 Otway 92 Not Assessed 17 Pedirka 432 Not Assessed 18 Perth 1681 33 19 Surat 31 Not Assessed Total 2,407 - Sources: 1EIA/ARI World Shale Gas and Shale Oil Resource Assessment, June 2013; 2AWT Shale Gas Prospectivity Potential, January 2013 *Tcf – trillion cubic feet. 1cf = 0.028m3 Australia will be a key player in the global natural gas trade at least for several decades. This statement is based not only on the great resource potential of the country but also on the already existing numerous LNG projects, all of which will be completed and launched by 2020 (12 projects with the total estimated capacity of 106.1 MTPA. As a result – 360% increase in LNG output by 2020)1. Most conventional proved reserves in Australia are north and northwest of Western Australia. The Carnarvon basin is the source for the two operating LNG plants in Western Australia (North West Shelf project and Pluto), and it is the source for two other LNG projects under construction (Gorgon and Wheatstone). In addition to the Carnarvon, the Browse and Bonaparte basins lie in the same region. Bonaparte straddles the WA and NT offshore regions, and Bayu-Undan field (Bonaparte basin) in the Joint Petroleum Development Area supplies the Darwin LNG plant. The Ichthys project, also to be developed in Darwin, will obtain its natural gas feed from Ichthys field in the Browse basin, offshore WA, via an 850-km subsea pipeline. Nearly all of the conventional reserves in WA are offshore, some in relatively deep water, raising development costs accordingly. The largest shale gas basin is Canning. The best estimate recoverable gas resource in the basin is up to 1,227 trillion cubic feet (Tcf). However, technically recoverable are about 235 Tcf but even this figure makes Canning one of the biggest on the globe. Source: Australia emerging as top LNG supplier, by the prof. Ronald D. Ripple; AWT International, Advanced Resources International, RFC Ambrian estimates, September 2013 433,732 200,720 263,624 Conventional Unconventional Coal seam gas Australian Technically Recoverable Gas Resource Potential (in petajoules) Source: Australia emerging as top LNG supplier, by the prof. Ronald D. Ripple, May 2014 Sources: EIA/ARI World Shale Gas and Shale Oil Resource Assessment, June 2013; Australia emerging as top LNG supplier, by the prof. Ronald D. Ripple, May 2014 Assessed or expected unconventional resource potential 1 Easy Skill Oil & Gas Note, March 2014 * Major Australian Natural Gas Basins (including conventional, shale and coal seam recourses)
  • 2.
    Oil&Gas Note |June-2014 © 2014 Easy Skill SAS. All rights reserved. Easy Skill refers to the French firm and the Australian firm. This content is for general information purposes only. 39% 23% 34% 4% Oil Natural gas Coal Renewables Upcoming Project Estimated Capacity by 2020 (MTPA) Arrow LNG Plant (2 trains) 8 Australia Pacific LNG 9 Bonaparte LNG 2.4 Browse Floating LNG 3.6 Fisherman’s Landing LNG Plant (1st train) 1.9 Gladstone LNG 7.8 Gorgon 15 Ichthys 8.4 Prelude 3.5 Queensland Curtis LNG 8.5 Scarborough (Pilbara) LNG 6 Wheatstone 9 Total 83.1 LNG Shipping Costs to Tokyo, JAPAN* Constructed and Planned LNG Projects with their Estimated Capacity by 2020 Source: World LNG Plants & Terminals as of March 2014, Global LNG LimitedSource: Australia Government, Bureau of Resources and Energy Economics, Australian Energy Update, July 2013 Natural gas represents 23% of the country's total final energy consumption, behind oil (39%) and coal (34%). Two major Australian industries in terms of total energy consumption remain to be Transport (38%) and Manufacturing & Construction (25%). According to the country's Bureau of Resources and Energy Economics (BREE) total Australian domestic consumption is forecasted to grow in around two times up to 2.3 tcf by 2034-35. During the same period it expects exports to increase to 5.1 tcf/year, dwarfing domestic use. Speaking about Australian energy export today, we first of all mean export of LNG. As it was said before, this kind of fuel is booming in the country at the moment and with huge infrastructure in the process of construction, Australia will be undoubtable number one in terms of LNG production by 2020. In 2012, Australia’s LNG export was around 19 million tons and accounted for about 36% of Australia’s gas production. Exports of LNG have increased strongly in recent years—by around 8% a year over the past five years, as new LNG projects (Darwin and Pluto) have been commissioned in response to growing international demand. In 2012, around 79% of Australia’s LNG exports were sold to Japan and 16 per cent to China (IEA 2013). There are currently three export-operational LNG projects in Australia—the North West Shelf Venture project, the Darwin LNG project and the Pluto project—representing 24.3 million tons of LNG export capacity. There are a number of other projects currently under construction that are expected to be completed over the next few years. In particular, Gorgon LNG, one of the world’s largest LNG projects and Australia’s largest ever resource project, and the three LNG projects using gas from coal seams in Queensland (Australia Pacific LNG, Queensland Curtis LNG and Gladstone LNG) are world leading projects that will materially change the dynamics of both the Western and Eastern markets. While growing international competition and rising costs have dampened the prospects for further greenfield LNG in Australia, the commercial success of new floating LNG operations (Prelude will be among the first to enter production in 2017) has the potential to be transformative and unlock previously uneconomic remote offshore gas resources. Sources: Bureau of Resources and Energy Economics (BREE),Gas Market Report, October 2013 Port Distance, nautical miles 14 knots Time needed 20 knots Time needed 14 knots Cost** 20 knots Cost** 14 knots Cost, $/MMbtu 20 knots Cost, $/MMbtu Darwin 3,072 8d 19h 6d 10h 2,197,917 1,604,167 0.73 0.54 Doha 6,557 19d10h 13d21h 4,854,167 3,468,750 1.62 1.16 USA through Panama 9,247 27d13h 19d1h 6,885,417 4,760,417 2.30 1.59 USA around SA*** 15,957 47d 12h 32d23h 11,875,000 8,239,583 3.97 2.75 Australia shipping advantage, $/Mmbtu Darwin – Doha 0.89 0.62 Darwin – Panama 1.57 1.05 Darwin – South Africa 3.23 2.22 Australian energy consumption, by fuel type 2011-2012 * 140,000 – cu m (2,995,000MMbtu) vessel ** Assumption of $125,000/day. Costs include round-trip travel time *** SA – South Africa Sources: SeaRates LP (www.searates.com) Australia emerging as top LNG supplier, by the prof. Ronald D. Ripple, May 2014 The Australian natural gas sector's high costs, are somewhat offset by favorable shipping distances relative to most competitors Shipping distances between Australian projects and ports and destination markets in Asia are considerably shorter than those for Qatar and the USA. The shipping distance between Qatar and Tokyo is 6,557 nautical miles (nm), which at a speed of 14 knots requires 19 days 10 hours to transit. For Australia, Darwin is the closest, with Dampier (home to the North West Shelf and Pluto projects in WA) and Gladstone (home to the CSG-based projects in Queensland) effectively equidistant from Tokyo. The Darwin shipping distance is 3,072 nm, requiring 8 days 19 hours en route, while the Dampier and Gladstone distance is 3,742 nm, requiring 11 days 3 hours at the same 14 knots. Darwin has a roughly $0.89/MMbtu shipping advantage over Qatar. This estimate is based on day rates of $125,000 for a 140,000-cu m LNG tanker (roughly 3 MMbtu) and the 11-day shorter travel time each way. Australia also has a considerable distance advantage over potential US Gulf Coast shipments. Routed through Panama, the distance from Houston to Tokyo is 9,247 nm, requiring 27 days 13 hours, while travelling around South Africa makes it 15,957 nm, requiring 47 days 12 hours. At 14 knots, Darwin has a $1.57/MMbtu advantage over the Panama route and $3.23/MMbtu advantage over US shipments sailing around South Africa. Sources: SeaRates LP (www.searates.com); Australia emerging as top LNG supplier, by the prof. Ronald D. Ripple, May 2014