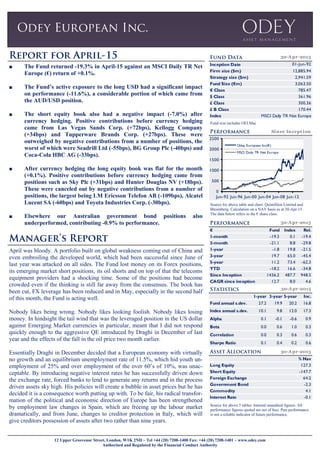
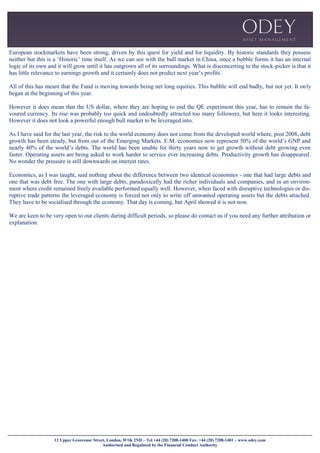
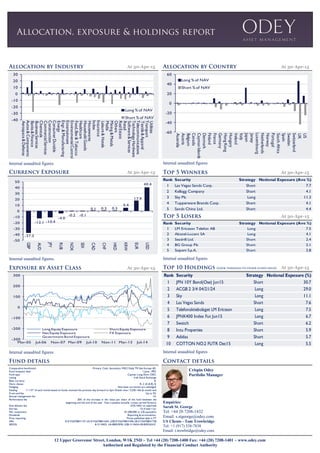
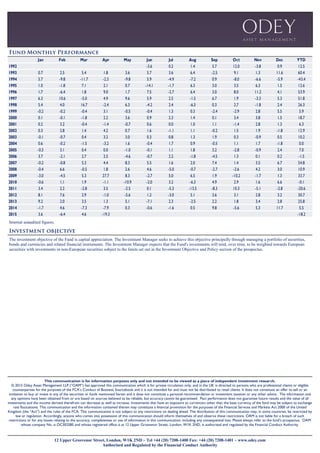
12 Upper Grosvenor Street, London, W1K 2ND ~ Tel +44 (20) 7208-1400 Fax: +44 (20) 7208-1401 ~ www.odey.com
Authorised and Regulated by the Financial Conduct Authority
■ The Fund returned -19.3% in April-15 against an MSCI Daily TR Net
Europe (€) return of +0.1%.
■ The Fund’s active exposure to the long USD had a significant impact
on performance (-11.6%), a considerable portion of which came from
the AUD/USD position.
■ The short equity book also had a negative impact (-7.0%) after
currency hedging. Positive contributions before currency hedging
came from Las Vegas Sands Corp. (+72bps), Kellogg Company
(+34bps) and Tupperware Brands Corp. (+27bps). These were
outweighed by negative contributions from a number of positions, the
worst of which were Seadrill Ltd (-55bps), BG Group Plc (-40bps) and
Coca-Cola HBC AG (-33bps).
■ After currency hedging the long equity book was flat for the month
(+0.1%). Positive contributions before currency hedging came from
positions such as Sky Plc (+31bps) and Hunter Douglas NV (+18bps).
These were canceled out by negative contributions from a number of
positions, the largest being LM Ericsson Telefon AB (-109bps), Alcatel
Lucent SA (-60bps) and Toyota Industries Corp. (-30bps).
■ Elsewhere our Australian government bond positions also
underperformed, contributing -0.9% to performance.
Source for above 3 tables: Internal unaudited figures. All
performance figures quoted are net of fees. Past performance
is not a reliable indicator of future performance.
Source for above table and chart: Quintillion Limited and
Bloomberg. Calculation on a NAV basis as at 30-Apr-15.
The data below refers to the € share class.
April was bloody. A portfolio built on global weakness coming out of China and
even embroiling the developed world, which had been successful since June of
last year was attacked on all sides. The Fund lost money on its Forex positions,
its emerging market short positions, its oil shorts and on top of that the telecoms
equipment providers had a shocking time. Some of the positions had become
crowded even if the thinking is still far away from the consensus. The book has
been cut, FX leverage has been reduced and in May, especially in the second half
of this month, the Fund is acting well.
Nobody likes being wrong. Nobody likes looking foolish. Nobody likes losing
money. In hindsight the tail wind that was the leveraged position in the US dollar
against Emerging Market currencies in particular, meant that I did not respond
quickly enough to the aggressive QE introduced by Draghi in December of last
year and the effects of the fall in the oil price two month earlier.
Essentially Draghi in December decided that a European economy with virtually
no growth and an equilibrium unemployment rate of 11.5%, which hid youth un-
employment of 25% and over employment of the over 60’s of 10%, was unac-
ceptable. By introducing negative interest rates he has successfully driven down
the exchange rate, forced banks to lend to generate any returns and in the process
driven assets sky high. His policies will create a bubble in asset prices but he has
decided it is a consequence worth putting up with. To be fair, his radical transfor-
mation of the political and economic direction of Europe has been strengthened
by employment law changes in Spain, which are freeing up the labour market
dramatically, and from June, changes to creditor protection in Italy, which will
give creditors possession of assets after two rather than nine years.
Fund size includes OEI Mac
Inception Date
Firm size ($m) 12,885.94
Strategy size ($m) 2,941.59
Fund Size (€m) 3,063.50
€ Class 785.47
$ Class 361.96
£ Class 300.36
£ B Class 170.44
Index MSCI Daily TR Net Europe
30-Apr-2015
01-Jun-92
Since Inception
0
500
1000
1500
2000
2500
Jun-92 Jun-96 Jun-00 Jun-04 Jun-08 Jun-12
Odey European Inc(€)
MSCI Daily TR Net Europe
€ Fund Index Rel.
1-month -19.3 0.1 -19.4
3-month -21.1 8.8 -29.8
1-year -1.8 19.8 -21.5
3-year 19.7 65.0 -45.4
5-year 11.2 73.4 -62.3
YTD -18.2 16.6 -34.8
Since Inception 1436.2 487.7 948.5
CAGR since inception 12.7 8.0 4.6
30-Apr-2015
1-year 3-year 5-year Inc.
Fund annual s.dev. 27.2 19.9 20.2 16.8
Index annual s.dev. 10.1 9.8 12.0 17.3
Alpha 0.1 -0.1 -0.6 0.9
Beta 0.0 0.6 1.0 0.3
Correlation 0.0 0.3 0.6 0.3
Sharpe Ratio 0.1 0.4 0.2 0.6
30-Apr-2015
30-Apr-2015
% Nav
Long Equity 127.3
Short Equity -147.7
Foreign Exchange 64.2
Government Bond -2.3
Commodity 4.1
Interest Rate -0.1
12 Upper Grosvenor Street, London, W1K 2ND ~ Tel +44 (20) 7208-1400 Fax: +44 (20) 7208-1401 ~ www.odey.com
Authorised and Regulated by the Financial Conduct Authority
European stockmarkets have been strong, driven by this quest for yield and for liquidity. By historic standards they possess
neither but this is a ‘Historic’ time itself. As we can see with the bull market in China, once a bubble forms it has an internal
logic of its own and it will grow until it has outgrown all of its surroundings. What is disconcerting to the stock-picker is that it
has little relevance to earnings growth and it certainly does not predict next year’s profits.
All of this has meant that the Fund is moving towards being net long equities. This bubble will end badly, but not yet. It only
began at the beginning of this year.
However it does mean that the US dollar, where they are hoping to end the QE experiment this year, has to remain the fa-
voured currency. Its rise was probably too quick and undoubtedly attracted too many followers, but here it looks interesting.
However it does not look a powerful enough bull market to be leveraged into.
As I have said for the last year, the risk to the world economy does not come from the developed world where, post 2008, debt
growth has been steady, but from out of the Emerging Markets. E.M. economies now represent 50% of the world’s GNP and
nearly 40% of the world’s debts. The world has been unable for thirty years now to get growth without debt growing even
faster. Operating assets are being asked to work harder to service ever increasing debts. Productivity growth has disappeared.
No wonder the pressure is still downwards on interest rates.
Economics, as I was taught, said nothing about the difference between two identical economies - one that had large debts and
one that was debt free. The one with large debts, paradoxically had the richer individuals and companies, and in an environ-
ment where credit remained freely available performed equally well. However, when faced with disruptive technologies or dis-
ruptive trade patterns the leveraged economy is forced not only to write off unwanted operating assets but the debts attached.
They have to be socialised through the economy. That day is coming, but April showed it is not now.
We are keen to be very open to our clients during difficult periods, so please do contact us if you need any further attribution or
explanation.
12 Upper Grosvenor Street, London, W1K 2ND ~ Tel +44 (20) 7208-1400 Fax: +44 (20) 7208-1401 ~ www.odey.com
Authorised and Regulated by the Financial Conduct Authority
Internal unaudited figures. Internal unaudited figures
Internal unaudited figuresInternal unaudited figures
At 30-Apr-15
At 30-Apr-15
At 30-Apr-15 At 30-Apr-15
Comparative benchmark Primary: Cash, Secondary: MSCI Daily TR Net Europe (€)
Fund inception date 1 June, 1992
Fund type Cayman Long-Short OEIC
Listing Irish Stock Exchange
Base currency €
Share classes €, £ (A & B), $
Hedging Non-base currencies are unhedged
Dealing 1st
/15th
of each month based on funds received the previous day forward to 5pm Dublin time / COB 14th & month end
Front end fee Up to 5%
Annual management fee 1%
Performance fee 20% of the increase in the value per share of the fund between the
beginning and the end of the year. Fees crystalise annually. Losses carried forward.
Anti-dilution fee 0.5% NAV on subs/reds
Exit fee 1% if held <1yr
Min. investment €1,000,000 or £/$ equivalent
Dividends Reporting & accumulation
Price reporting Prices published daily in FT
ISIN €-KYG6708H1157 £A-KYG6708H1645, US$-KYG6708H1496 £B-KYG6708H1728
SEDOL €-3110423 £A-B00VSM0, US$-3110434 £B-B2RGGH3
At 30-Apr-15
At 30-Apr-15
At 30-Apr-15
Internal unaudited figures
Enquiries:
Sarah St. George
Tel: +44 20 7208-1432
Email: s.stgeorge@odey.com
US Clients - Tom Trowbridge
Tel: +1 (917) 538-7838
Email: t.trowbridge@odey.com
Crispin Odey
Portfolio Manager
Internal unaudited figures
-40
-30
-20
-10
0
10
20
30
Aerospace&Defense
Autos&Components
Banks&Finance
BusinessServices
Chemicals
CommercialServices
Construction
ConsumerDurable
Energy
Engr.&Manufacturing
Entertainment
EnvironmentalControl
Food,Bev&Tobacco
Healthcare
HouseholdGoods
Housewares
Index
Insurance
Leisure&Hotels
Media
Mining&Metals
Others
RealEstate
Retail
Software&Services
TechnologyHardware
Telecommunications
Textile&Apparel
Transport
Utilities
Long % of NAV
Short % of NAV
-60
-40
-20
0
20
40
60
Australia
Austria
Belgium
Canada
CaymanIslands
Denmark
Finland
France
Germany
HongKong
Hungary
Ireland
Italy
Japan
Jersey
Luxembourg
Netherlands
Norway
Portugal
SouthAfrica
Spain
Sweden
Switzerland
UK
US
Long % of NAV
Short % of NAV
-300
-200
-100
0
100
200
300
Mar-05 Jul-06 Nov-07 Mar-09 Jul-10 Nov-11 Mar-13 Jul-14
Long Equity Exposure Short Equity Exposure
Net Equity Exposure FX Exposure
Government Bond Exposure
Rank Security Strategy Notional Exposure (Ave %)
1 LM Ericsson Telefon AB Long 7.5
2 Alcatel-Lucent SA Long 4.1
3 Seadrill Ltd. Short 2.4
4 BG Group Plc Short 2.1
5 Saipem S.p.A. Short 2.8
Rank Security Strategy Notional Exposure (Ave %)
1 Las Vegas Sands Corp. Short 7.7
2 Kellogg Company Short 4.1
3 Sky Plc Long 11.3
4 Tupperware Brands Corp. Short 4.1
5 Sands China Ltd. Short 4.4
-37.3
-12.1 -10.4
-4.0
-0.2 -0.1
0.1 0.3 0.3
5.4
17.9
40.4
-50
-40
-30
-20
-10
0
10
20
30
40
50
GBP
AUD
JPY
RUB
NOK
SEK
CAD
CHF
HKD
KRW
EUR
USD
Rank Security Strategy Notional Exposure (%)
1 JPN 10Y Bond(Ose) Jun15 Short 30.7
2 ACGB 2 3/4 04/21/24 Long 29.0
3 Sky Long 11.1
4 Las Vegas Sands Short 7.6
5 Telefonaktiebolaget LM Ericsson Long 7.5
6 JPNK400 Index Fut Jun15 Long 6.7
7 Swatch Short 6.2
8 Intu Properties Short 5.9
9 Adidas Short 5.7
10 COTTON NO.2 FUTR Dec15 Long 5.5
12 Upper Grosvenor Street, London, W1K 2ND ~ Tel +44 (20) 7208-1400 Fax: +44 (20) 7208-1401 ~ www.odey.com
Authorised and Regulated by the Financial Conduct Authority
This communication is for information purposes only and not intended to be viewed as a piece of independent investment research.
© 2015 Odey Asset Management LLP (“OAM”) has approved this communication which is for private circulation only, and in the UK is directed to persons who are professional clients or eligible
counterparties for the purposes of the FCA’s Conduct of Business Sourcebook and it is not intended for and must not be distributed to retail clients. It does not constitute an offer to sell or an
invitation to buy or invest in any of the securities or funds mentioned herein and it does not constitute a personal recommendation or investment taxation or any other advice. The information and
any opinions have been obtained from or are based on sources believed to be reliable, but accuracy cannot be guaranteed. Past performance does not guarantee future results and the value of all
investments and the income derived therefrom can decrease as well as increase. Investments that have an exposure to currencies other than the base currency of the fund may be subject to exchange
rate fluctuations. This communication and the information contained therein may constitute a financial promotion for the purposes of the Financial Services and Markets Act 2000 of the United
Kingdom (the “Act”) and the rules of the FCA. This communication is not subject to any restrictions on dealing ahead. The distribution of this communication may, in some countries, be restricted by
law or regulation. Accordingly, anyone who comes into possession of this communication should inform themselves of and observe these restrictions. OAM is not liable for a breach of such
restrictions or for any losses relating to the accuracy, completeness or use of information in this communication, including any consequential loss. Please always refer to the fund’s prospectus. OAM
whose company No. is OC302585 and whose registered office is at 12 Upper Grosvenor Street, London, W1K 2ND, is authorised and regulated by the Financial Conduct Authority.
The investment objective of the Fund is capital appreciation. The Investment Manager seeks to achieve this objective principally through managing a portfolio of securities,
bonds and currencies and related financial instruments. The Investment Manager expects that the Fund's investments will tend, over time, to be weighted towards European
securities with investments in non-European securities subject to the limits set out in the Investment Objective and Policy section of the prospectus.
Internal unaudited figures.
Jan Feb Mar Apr May Jun Jul Aug Sep Oct Nov Dec YTD
1992 -3.6 0.2 1.4 5.7 12.0 -3.8 0.9 12.5
1993 0.7 2.5 5.4 1.8 3.6 5.7 3.6 6.4 -2.5 9.1 1.3 11.6 60.4
1994 5.7 -9.8 -11.7 -2.3 -9.8 5.9 -4.9 -7.2 0.9 -8.0 -6.6 -5.9 -43.4
1995 1.0 -1.8 7.1 2.1 0.7 -14.1 -1.7 6.3 3.0 3.5 6.3 1.5 12.6
1996 1.7 -6.4 1.8 9.0 1.7 7.5 -2.7 6.4 3.0 8.0 11.2 4.1 53.9
1997 6.3 10.6 -5.0 4.9 9.6 5.9 2.5 -1.5 6.7 1.9 -3.3 5.3 51.8
1998 5.4 4.0 16.7 -2.4 6.3 -4.2 2.4 -6.3 0.3 2.7 -1.8 2.4 26.3
1999 -0.2 -0.2 -0.4 3.1 -0.5 -0.4 1.3 0.3 -2.4 -2.9 2.8 5.5 5.9
2000 0.1 -0.1 -1.8 2.2 3.6 0.9 2.3 1.4 0.1 3.4 3.8 1.5 18.7
2001 0.2 3.2 -0.4 -1.4 -0.7 0.6 0.0 1.0 1.1 -1.4 2.8 1.3 6.3
2002 0.3 2.8 1.4 4.2 0.7 1.6 -1.1 1.1 -0.2 1.5 1.9 -1.8 12.9
2003 -0.1 -0.7 0.4 3.2 3.0 0.3 0.8 1.3 1.9 0.3 -0.9 0.5 10.2
2004 0.6 -0.2 -1.5 -3.2 1.6 -0.4 1.7 0.9 -0.5 1.1 1.7 -1.8 0.0
2005 -0.3 3.1 0.4 0.0 -1.0 -0.1 1.1 1.8 3.2 -2.8 -0.9 2.4 7.0
2006 3.7 -2.1 2.7 2.5 -4.6 -0.7 2.2 -1.8 -4.5 1.3 0.1 0.2 -1.5
2007 -0.2 -0.8 5.3 4.4 8.3 5.5 1.6 2.0 7.4 1.4 3.5 6.7 54.8
2008 -0.4 6.6 -0.5 1.8 2.6 4.6 -5.0 -0.7 -2.7 -2.6 4.2 3.0 10.9
2009 -3.0 -4.5 5.3 27.7 8.3 -2.7 5.0 6.5 1.9 -10.2 -1.7 1.3 33.7
2010 -0.6 1.1 1.9 -1.1 -10.9 -2.0 3.2 -6.3 4.9 2.9 1.6 6.6 -0.1
2011 3.4 2.2 -2.8 3.5 -2.5 0.1 -5.3 -13.5 -8.3 10.3 -5.1 -2.8 -20.6
2012 8.1 7.6 2.9 -1.0 -5.6 1.2 -3.0 5.1 3.6 3.1 2.8 3.2 30.7
2013 9.2 2.0 3.5 1.3 5.1 -7.1 2.3 -2.5 2.2 1.8 3.4 2.8 25.8
2014 -1.7 4.6 -7.3 -7.9 0.3 -0.6 -1.6 0.5 9.8 -5.6 5.3 11.7 5.5
2015 3.6 -6.4 4.6 -19.3 -18.2

Oei apr-15

  • 1.
    12 Upper GrosvenorStreet, London, W1K 2ND ~ Tel +44 (20) 7208-1400 Fax: +44 (20) 7208-1401 ~ www.odey.com Authorised and Regulated by the Financial Conduct Authority ■ The Fund returned -19.3% in April-15 against an MSCI Daily TR Net Europe (€) return of +0.1%. ■ The Fund’s active exposure to the long USD had a significant impact on performance (-11.6%), a considerable portion of which came from the AUD/USD position. ■ The short equity book also had a negative impact (-7.0%) after currency hedging. Positive contributions before currency hedging came from Las Vegas Sands Corp. (+72bps), Kellogg Company (+34bps) and Tupperware Brands Corp. (+27bps). These were outweighed by negative contributions from a number of positions, the worst of which were Seadrill Ltd (-55bps), BG Group Plc (-40bps) and Coca-Cola HBC AG (-33bps). ■ After currency hedging the long equity book was flat for the month (+0.1%). Positive contributions before currency hedging came from positions such as Sky Plc (+31bps) and Hunter Douglas NV (+18bps). These were canceled out by negative contributions from a number of positions, the largest being LM Ericsson Telefon AB (-109bps), Alcatel Lucent SA (-60bps) and Toyota Industries Corp. (-30bps). ■ Elsewhere our Australian government bond positions also underperformed, contributing -0.9% to performance. Source for above 3 tables: Internal unaudited figures. All performance figures quoted are net of fees. Past performance is not a reliable indicator of future performance. Source for above table and chart: Quintillion Limited and Bloomberg. Calculation on a NAV basis as at 30-Apr-15. The data below refers to the € share class. April was bloody. A portfolio built on global weakness coming out of China and even embroiling the developed world, which had been successful since June of last year was attacked on all sides. The Fund lost money on its Forex positions, its emerging market short positions, its oil shorts and on top of that the telecoms equipment providers had a shocking time. Some of the positions had become crowded even if the thinking is still far away from the consensus. The book has been cut, FX leverage has been reduced and in May, especially in the second half of this month, the Fund is acting well. Nobody likes being wrong. Nobody likes looking foolish. Nobody likes losing money. In hindsight the tail wind that was the leveraged position in the US dollar against Emerging Market currencies in particular, meant that I did not respond quickly enough to the aggressive QE introduced by Draghi in December of last year and the effects of the fall in the oil price two month earlier. Essentially Draghi in December decided that a European economy with virtually no growth and an equilibrium unemployment rate of 11.5%, which hid youth un- employment of 25% and over employment of the over 60’s of 10%, was unac- ceptable. By introducing negative interest rates he has successfully driven down the exchange rate, forced banks to lend to generate any returns and in the process driven assets sky high. His policies will create a bubble in asset prices but he has decided it is a consequence worth putting up with. To be fair, his radical transfor- mation of the political and economic direction of Europe has been strengthened by employment law changes in Spain, which are freeing up the labour market dramatically, and from June, changes to creditor protection in Italy, which will give creditors possession of assets after two rather than nine years. Fund size includes OEI Mac Inception Date Firm size ($m) 12,885.94 Strategy size ($m) 2,941.59 Fund Size (€m) 3,063.50 € Class 785.47 $ Class 361.96 £ Class 300.36 £ B Class 170.44 Index MSCI Daily TR Net Europe 30-Apr-2015 01-Jun-92 Since Inception 0 500 1000 1500 2000 2500 Jun-92 Jun-96 Jun-00 Jun-04 Jun-08 Jun-12 Odey European Inc(€) MSCI Daily TR Net Europe € Fund Index Rel. 1-month -19.3 0.1 -19.4 3-month -21.1 8.8 -29.8 1-year -1.8 19.8 -21.5 3-year 19.7 65.0 -45.4 5-year 11.2 73.4 -62.3 YTD -18.2 16.6 -34.8 Since Inception 1436.2 487.7 948.5 CAGR since inception 12.7 8.0 4.6 30-Apr-2015 1-year 3-year 5-year Inc. Fund annual s.dev. 27.2 19.9 20.2 16.8 Index annual s.dev. 10.1 9.8 12.0 17.3 Alpha 0.1 -0.1 -0.6 0.9 Beta 0.0 0.6 1.0 0.3 Correlation 0.0 0.3 0.6 0.3 Sharpe Ratio 0.1 0.4 0.2 0.6 30-Apr-2015 30-Apr-2015 % Nav Long Equity 127.3 Short Equity -147.7 Foreign Exchange 64.2 Government Bond -2.3 Commodity 4.1 Interest Rate -0.1
  • 2.
    12 Upper GrosvenorStreet, London, W1K 2ND ~ Tel +44 (20) 7208-1400 Fax: +44 (20) 7208-1401 ~ www.odey.com Authorised and Regulated by the Financial Conduct Authority European stockmarkets have been strong, driven by this quest for yield and for liquidity. By historic standards they possess neither but this is a ‘Historic’ time itself. As we can see with the bull market in China, once a bubble forms it has an internal logic of its own and it will grow until it has outgrown all of its surroundings. What is disconcerting to the stock-picker is that it has little relevance to earnings growth and it certainly does not predict next year’s profits. All of this has meant that the Fund is moving towards being net long equities. This bubble will end badly, but not yet. It only began at the beginning of this year. However it does mean that the US dollar, where they are hoping to end the QE experiment this year, has to remain the fa- voured currency. Its rise was probably too quick and undoubtedly attracted too many followers, but here it looks interesting. However it does not look a powerful enough bull market to be leveraged into. As I have said for the last year, the risk to the world economy does not come from the developed world where, post 2008, debt growth has been steady, but from out of the Emerging Markets. E.M. economies now represent 50% of the world’s GNP and nearly 40% of the world’s debts. The world has been unable for thirty years now to get growth without debt growing even faster. Operating assets are being asked to work harder to service ever increasing debts. Productivity growth has disappeared. No wonder the pressure is still downwards on interest rates. Economics, as I was taught, said nothing about the difference between two identical economies - one that had large debts and one that was debt free. The one with large debts, paradoxically had the richer individuals and companies, and in an environ- ment where credit remained freely available performed equally well. However, when faced with disruptive technologies or dis- ruptive trade patterns the leveraged economy is forced not only to write off unwanted operating assets but the debts attached. They have to be socialised through the economy. That day is coming, but April showed it is not now. We are keen to be very open to our clients during difficult periods, so please do contact us if you need any further attribution or explanation.
  • 3.
    12 Upper GrosvenorStreet, London, W1K 2ND ~ Tel +44 (20) 7208-1400 Fax: +44 (20) 7208-1401 ~ www.odey.com Authorised and Regulated by the Financial Conduct Authority Internal unaudited figures. Internal unaudited figures Internal unaudited figuresInternal unaudited figures At 30-Apr-15 At 30-Apr-15 At 30-Apr-15 At 30-Apr-15 Comparative benchmark Primary: Cash, Secondary: MSCI Daily TR Net Europe (€) Fund inception date 1 June, 1992 Fund type Cayman Long-Short OEIC Listing Irish Stock Exchange Base currency € Share classes €, £ (A & B), $ Hedging Non-base currencies are unhedged Dealing 1st /15th of each month based on funds received the previous day forward to 5pm Dublin time / COB 14th & month end Front end fee Up to 5% Annual management fee 1% Performance fee 20% of the increase in the value per share of the fund between the beginning and the end of the year. Fees crystalise annually. Losses carried forward. Anti-dilution fee 0.5% NAV on subs/reds Exit fee 1% if held <1yr Min. investment €1,000,000 or £/$ equivalent Dividends Reporting & accumulation Price reporting Prices published daily in FT ISIN €-KYG6708H1157 £A-KYG6708H1645, US$-KYG6708H1496 £B-KYG6708H1728 SEDOL €-3110423 £A-B00VSM0, US$-3110434 £B-B2RGGH3 At 30-Apr-15 At 30-Apr-15 At 30-Apr-15 Internal unaudited figures Enquiries: Sarah St. George Tel: +44 20 7208-1432 Email: s.stgeorge@odey.com US Clients - Tom Trowbridge Tel: +1 (917) 538-7838 Email: t.trowbridge@odey.com Crispin Odey Portfolio Manager Internal unaudited figures -40 -30 -20 -10 0 10 20 30 Aerospace&Defense Autos&Components Banks&Finance BusinessServices Chemicals CommercialServices Construction ConsumerDurable Energy Engr.&Manufacturing Entertainment EnvironmentalControl Food,Bev&Tobacco Healthcare HouseholdGoods Housewares Index Insurance Leisure&Hotels Media Mining&Metals Others RealEstate Retail Software&Services TechnologyHardware Telecommunications Textile&Apparel Transport Utilities Long % of NAV Short % of NAV -60 -40 -20 0 20 40 60 Australia Austria Belgium Canada CaymanIslands Denmark Finland France Germany HongKong Hungary Ireland Italy Japan Jersey Luxembourg Netherlands Norway Portugal SouthAfrica Spain Sweden Switzerland UK US Long % of NAV Short % of NAV -300 -200 -100 0 100 200 300 Mar-05 Jul-06 Nov-07 Mar-09 Jul-10 Nov-11 Mar-13 Jul-14 Long Equity Exposure Short Equity Exposure Net Equity Exposure FX Exposure Government Bond Exposure Rank Security Strategy Notional Exposure (Ave %) 1 LM Ericsson Telefon AB Long 7.5 2 Alcatel-Lucent SA Long 4.1 3 Seadrill Ltd. Short 2.4 4 BG Group Plc Short 2.1 5 Saipem S.p.A. Short 2.8 Rank Security Strategy Notional Exposure (Ave %) 1 Las Vegas Sands Corp. Short 7.7 2 Kellogg Company Short 4.1 3 Sky Plc Long 11.3 4 Tupperware Brands Corp. Short 4.1 5 Sands China Ltd. Short 4.4 -37.3 -12.1 -10.4 -4.0 -0.2 -0.1 0.1 0.3 0.3 5.4 17.9 40.4 -50 -40 -30 -20 -10 0 10 20 30 40 50 GBP AUD JPY RUB NOK SEK CAD CHF HKD KRW EUR USD Rank Security Strategy Notional Exposure (%) 1 JPN 10Y Bond(Ose) Jun15 Short 30.7 2 ACGB 2 3/4 04/21/24 Long 29.0 3 Sky Long 11.1 4 Las Vegas Sands Short 7.6 5 Telefonaktiebolaget LM Ericsson Long 7.5 6 JPNK400 Index Fut Jun15 Long 6.7 7 Swatch Short 6.2 8 Intu Properties Short 5.9 9 Adidas Short 5.7 10 COTTON NO.2 FUTR Dec15 Long 5.5
  • 4.
    12 Upper GrosvenorStreet, London, W1K 2ND ~ Tel +44 (20) 7208-1400 Fax: +44 (20) 7208-1401 ~ www.odey.com Authorised and Regulated by the Financial Conduct Authority This communication is for information purposes only and not intended to be viewed as a piece of independent investment research. © 2015 Odey Asset Management LLP (“OAM”) has approved this communication which is for private circulation only, and in the UK is directed to persons who are professional clients or eligible counterparties for the purposes of the FCA’s Conduct of Business Sourcebook and it is not intended for and must not be distributed to retail clients. It does not constitute an offer to sell or an invitation to buy or invest in any of the securities or funds mentioned herein and it does not constitute a personal recommendation or investment taxation or any other advice. The information and any opinions have been obtained from or are based on sources believed to be reliable, but accuracy cannot be guaranteed. Past performance does not guarantee future results and the value of all investments and the income derived therefrom can decrease as well as increase. Investments that have an exposure to currencies other than the base currency of the fund may be subject to exchange rate fluctuations. This communication and the information contained therein may constitute a financial promotion for the purposes of the Financial Services and Markets Act 2000 of the United Kingdom (the “Act”) and the rules of the FCA. This communication is not subject to any restrictions on dealing ahead. The distribution of this communication may, in some countries, be restricted by law or regulation. Accordingly, anyone who comes into possession of this communication should inform themselves of and observe these restrictions. OAM is not liable for a breach of such restrictions or for any losses relating to the accuracy, completeness or use of information in this communication, including any consequential loss. Please always refer to the fund’s prospectus. OAM whose company No. is OC302585 and whose registered office is at 12 Upper Grosvenor Street, London, W1K 2ND, is authorised and regulated by the Financial Conduct Authority. The investment objective of the Fund is capital appreciation. The Investment Manager seeks to achieve this objective principally through managing a portfolio of securities, bonds and currencies and related financial instruments. The Investment Manager expects that the Fund's investments will tend, over time, to be weighted towards European securities with investments in non-European securities subject to the limits set out in the Investment Objective and Policy section of the prospectus. Internal unaudited figures. Jan Feb Mar Apr May Jun Jul Aug Sep Oct Nov Dec YTD 1992 -3.6 0.2 1.4 5.7 12.0 -3.8 0.9 12.5 1993 0.7 2.5 5.4 1.8 3.6 5.7 3.6 6.4 -2.5 9.1 1.3 11.6 60.4 1994 5.7 -9.8 -11.7 -2.3 -9.8 5.9 -4.9 -7.2 0.9 -8.0 -6.6 -5.9 -43.4 1995 1.0 -1.8 7.1 2.1 0.7 -14.1 -1.7 6.3 3.0 3.5 6.3 1.5 12.6 1996 1.7 -6.4 1.8 9.0 1.7 7.5 -2.7 6.4 3.0 8.0 11.2 4.1 53.9 1997 6.3 10.6 -5.0 4.9 9.6 5.9 2.5 -1.5 6.7 1.9 -3.3 5.3 51.8 1998 5.4 4.0 16.7 -2.4 6.3 -4.2 2.4 -6.3 0.3 2.7 -1.8 2.4 26.3 1999 -0.2 -0.2 -0.4 3.1 -0.5 -0.4 1.3 0.3 -2.4 -2.9 2.8 5.5 5.9 2000 0.1 -0.1 -1.8 2.2 3.6 0.9 2.3 1.4 0.1 3.4 3.8 1.5 18.7 2001 0.2 3.2 -0.4 -1.4 -0.7 0.6 0.0 1.0 1.1 -1.4 2.8 1.3 6.3 2002 0.3 2.8 1.4 4.2 0.7 1.6 -1.1 1.1 -0.2 1.5 1.9 -1.8 12.9 2003 -0.1 -0.7 0.4 3.2 3.0 0.3 0.8 1.3 1.9 0.3 -0.9 0.5 10.2 2004 0.6 -0.2 -1.5 -3.2 1.6 -0.4 1.7 0.9 -0.5 1.1 1.7 -1.8 0.0 2005 -0.3 3.1 0.4 0.0 -1.0 -0.1 1.1 1.8 3.2 -2.8 -0.9 2.4 7.0 2006 3.7 -2.1 2.7 2.5 -4.6 -0.7 2.2 -1.8 -4.5 1.3 0.1 0.2 -1.5 2007 -0.2 -0.8 5.3 4.4 8.3 5.5 1.6 2.0 7.4 1.4 3.5 6.7 54.8 2008 -0.4 6.6 -0.5 1.8 2.6 4.6 -5.0 -0.7 -2.7 -2.6 4.2 3.0 10.9 2009 -3.0 -4.5 5.3 27.7 8.3 -2.7 5.0 6.5 1.9 -10.2 -1.7 1.3 33.7 2010 -0.6 1.1 1.9 -1.1 -10.9 -2.0 3.2 -6.3 4.9 2.9 1.6 6.6 -0.1 2011 3.4 2.2 -2.8 3.5 -2.5 0.1 -5.3 -13.5 -8.3 10.3 -5.1 -2.8 -20.6 2012 8.1 7.6 2.9 -1.0 -5.6 1.2 -3.0 5.1 3.6 3.1 2.8 3.2 30.7 2013 9.2 2.0 3.5 1.3 5.1 -7.1 2.3 -2.5 2.2 1.8 3.4 2.8 25.8 2014 -1.7 4.6 -7.3 -7.9 0.3 -0.6 -1.6 0.5 9.8 -5.6 5.3 11.7 5.5 2015 3.6 -6.4 4.6 -19.3 -18.2