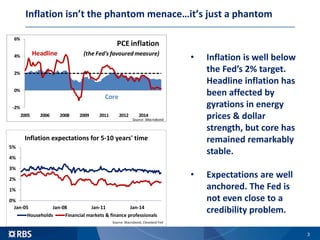
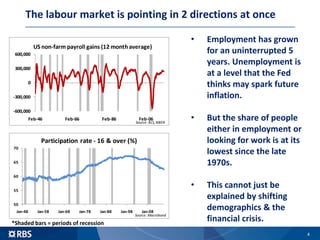
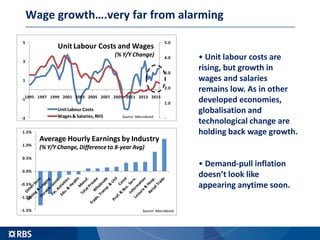
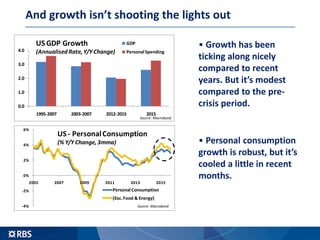
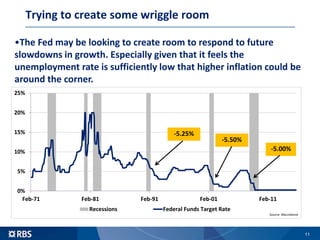
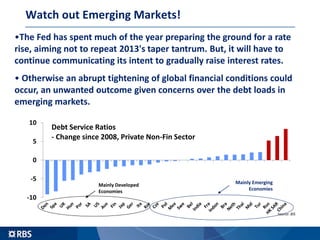
Rupert Seggins, Marcus Wright
RBS Economics
December 2015
Inflation isn’t the phantom menace…it’s just a phantom
3
0%
1%
2%
3%
4%
5%
Jan-05 Jan-08 Jan-11 Jan-14
Inflation expectations for 5-10 years' time
Households Financial markets & finance professionals
Source: Macrobond, Cleveland Fed
• Inflation is well below
the Fed’s 2% target.
Headline inflation has
been affected by
gyrations in energy
prices & dollar
strength, but core has
remained remarkably
stable.
• Expectations are well
anchored. The Fed is
not even close to a
credibility problem.
-2%
0%
2%
4%
6%
2005 2006 2008 2009 2011 2012 2014
PCE inflation
(the Fed's favoured measure)
Source: Macrobond
Headline
Core
The labour market is pointing in 2 directions at once
4
• Employment has grown
for an uninterrupted 5
years. Unemployment is
at a level that the Fed
thinks may spark future
inflation.
• But the share of people
either in employment or
looking for work is at its
lowest since the late
1970s.
• This cannot just be
explained by shifting
demographics & the
financial crisis.
50
55
60
65
70
Jan-48 Jan-58 Jan-68 Jan-78 Jan-88 Jan-98 Jan-08
Participation rate - 16 & over (%)
Source: Macrobond
-600,000
-300,000
0
300,000
600,000
Feb-46 Feb-66 Feb-86 Feb-06
US non-farm payroll gains (12 monthaverage)
Source: BLS, NBER
*Shaded bars = periods of recession
Wage growth….very far from alarming
• Unit labour costs are
rising, but growth in
wages and salaries
remains low. As in other
developed economies,
globalisation and
technological change are
holding back wage growth.
• Demand-pull inflation
doesn’t look like
appearing anytime soon.
-1.5%
-1.0%
-0.5%
0.0%
0.5%
1.0%
1.5%
Average Hourly Earnings by Industry
(% Y/Y Change, Differenceto 8-year Avg)
Source: Macrobond
-
1.0
2.0
3.0
4.0
5.0
-3
-1
1
3
5
1995 1997 1999 2001 2003 2005 2007 2009 2011 2013 2015
Unit Labour Costs and Wages
(% Y/Y Change)
UnitLabour Costs
Wages& Salaries,RHS Source: Macrobond
And growth isn’t shooting the lights out
• Growth has been
ticking along nicely
compared to recent
years. But it’s modest
compared to the pre-
crisis period.
• Personal consumption
growth is robust, but it’s
cooled a little in recent
months.
0.0
1.0
2.0
3.0
4.0
1995-2007 2003-2007 2012-2015 2015
USGDP Growth
(Annualised Rate, Y/Y Change)
GDP
Personal Spending
Source: Macrobond
-4%
-2%
0%
2%
4%
6%
2005 2007 2009 2011 2013 2015
US - PersonalConsumption
(% Y/Y Change, 3mma)
Personal Consumption
(Exc.Food & Energy)
Source: Macrobond
Investment is….meh!
• Fixed investment is a
similar story to spending –
solid but not spectacular.
• Investment in
intellectual property
(around 25% of private
fixed investment) has
remained robust while
commodity related
investment has fallen.
• Durable goods orders – a
leading indicator of
investment – are falling.
• And so has manufacturing
capacity utilisation.
-40%
-30%
-20%
-10%
0%
10%
20%
30%
40%
1995-2007 2003-2007 2012-2014 2015
US Private Fixed Investment
(% Y/Y Growth)
Mining& OilfieldMachinery
Intellectual Property
Total Private FixedInv
Source: Macrobond
65
70
75
80
85
-40
-30
-20
-10
0
10
20
30
2005 2007 2009 2011 2013 2015
Durable Goods Orders and Capacity
Utilisation
Durable Goods Orders,
Y/Y Change, LHS
Capacity Utilisation (%),
RHSSource: Macrobond
The global backdrop is hardly great
• The last time the Fed
raised rates, China and the
Eurozone were growing
twice as fast as they are
now. And exports were
consequently booming.
• But now, global growth
is stuck in the slow lane
and exports are falling in
volume terms.
-2%
0%
2%
4%
6%
8%
10%
Past 20 years 2004-2007 2012-2015 Past Six Months
US Exports and World Trade
(Volume, % Y/Y Change)
US Export Volume
World Trade
Source: CPB
-5
0
5
10
15
US Export
Growth
(Volume)
China Growth EZ Growth Global Growth
%Y/YChange
US Rate Rise - The Global Backdrop
Q2 2006 (Last FedRate Rise)
2015
Source: IMF, Macrobond, Bloomberg
China slowing and other EM concerns
• China is slowing more
than the headline figures
suggest.
• Its problems are
structural not cyclical so
the slowdown likely has a
lot further left to run.
• Emerging market firms
have been increasing their
leverage. A significant
proportion of that is dollar-
denominated. Higher US
interest rates potentially
spells further trouble.
0
5
10
15
20
1998 2000 2002 2004 2006 2008 2010 2012 2014
EstimatingChina's 'True' Growth
ReportedGDP
GDP'Estimate'
Source: Bloomberg,Macrobond, RBSEconomics
1.0
1.5
2.0
2.5
3.0
2004 2005 2006 2007 2008 2009 2010 2011 2012 2013 2014
Leverage Ratio of Corporations
(Annualised Ratio)
Emerging Economies
Advanced Economies
Source: BIS
Easy does it
10
•At the very least the Fed's tightening cycle is going to be
extremely gentle when compared to the past. And it won't take
much at all for tightening to become easing once again.
0%
1%
2%
3%
4%
5%
0 10 20 30 40
Cumulativepercentagepointincrease
Months following 1st rate rise decision
Mar-83
Jan-87
Mar-88
Feb-94
Jun-99
Jun-04
OIS forward curve implied
Source: Macrobond
Trying to create some wriggle room
11
•The Fed may be looking to create room to respond to future
slowdowns in growth. Especially given that it feels the
unemployment rate is sufficiently low that higher inflation could be
around the corner.
0%
5%
10%
15%
20%
25%
Feb-71 Feb-81 Feb-91 Feb-01 Feb-11
Recessions Federal Funds Target Rate
-5.00%
-5.50%
-5.25%
Source: Macrobond
-10
-5
0
5
10
Debt Service Ratios
- Change since 2008, Private Non-Fin Sector
Source: BIS
Watch out Emerging Markets!
•The Fed has spent much of the year preparing the ground for a rate
rise, aiming not to repeat 2013's taper tantrum. But, it will have to
continue communicating its intent to gradually raise interest rates.
• Otherwise an abrupt tightening of global financial conditions could
occur, an unwanted outcome given concerns over the debt loads in
emerging markets.
Mainly Developed
Economies
Mainly Emerging
Economies
Final thoughts
• The US is better placed than other major developed
economies for a rate hike. But it’s not clear that one is needed.
•The risk is that the Fed treads the well-worn path of other
central banks in places such as the Euro Area, Sweden &
Switzerland. Rates rise, disinflationary forces intensify and
rates have to be brought down further than before.
•There is an argument in favour of higher rates to cool asset
price growth and risk-taking. But interest rates are a blunt tool
for this purpose.
Follow us on Twitter
14
@RBS_Economics
https://twitter.com/rbs_economics
15
Disclaimer
This material is published by The Royal Bank of Scotland plc (“RBS”), for information purposes only and
should not be regarded as providing any specific advice. Recipients should make their own independent
evaluation of this information and no action should be taken, solely relying on it. This material should not be
reproduced or disclosed without our consent. It is not intended for distribution in any jurisdiction in which this
would be prohibited. Whilst this information is believed to be reliable, it has not been independently verified by
RBS and RBS makes no representation or warranty (express or implied) of any kind, as regards the accuracy
or completeness of this information, nor does it accept any responsibility or liability for any loss or damage
arising in any way from any use made of or reliance placed on, this information. Unless otherwise stated, any
views, forecasts, or estimates are solely those of RBS’s RBS Economics Department, as of this date and are
subject to change without notice. The classification of this document is PUBLIC. The Royal Bank of Scotland
plc. Registered in Scotland No. 90312. Registered Office: 36 St Andrew Square, Edinburgh EH2 2YB. The
Royal Bank of Scotland plc is authorised by the Prudential Regulation Authority and regulated by the Financial
Conduct Authority and the Prudential Regulation Authority. © Copyright 2015 The Royal Bank of Scotland
Group plc. All rights reserved

Rate rise: the Fed awakens

  • 1.
    Rupert Seggins, MarcusWright RBS Economics December 2015
  • 3.
    Inflation isn’t thephantom menace…it’s just a phantom 3 0% 1% 2% 3% 4% 5% Jan-05 Jan-08 Jan-11 Jan-14 Inflation expectations for 5-10 years' time Households Financial markets & finance professionals Source: Macrobond, Cleveland Fed • Inflation is well below the Fed’s 2% target. Headline inflation has been affected by gyrations in energy prices & dollar strength, but core has remained remarkably stable. • Expectations are well anchored. The Fed is not even close to a credibility problem. -2% 0% 2% 4% 6% 2005 2006 2008 2009 2011 2012 2014 PCE inflation (the Fed's favoured measure) Source: Macrobond Headline Core
  • 4.
    The labour marketis pointing in 2 directions at once 4 • Employment has grown for an uninterrupted 5 years. Unemployment is at a level that the Fed thinks may spark future inflation. • But the share of people either in employment or looking for work is at its lowest since the late 1970s. • This cannot just be explained by shifting demographics & the financial crisis. 50 55 60 65 70 Jan-48 Jan-58 Jan-68 Jan-78 Jan-88 Jan-98 Jan-08 Participation rate - 16 & over (%) Source: Macrobond -600,000 -300,000 0 300,000 600,000 Feb-46 Feb-66 Feb-86 Feb-06 US non-farm payroll gains (12 monthaverage) Source: BLS, NBER *Shaded bars = periods of recession
  • 5.
    Wage growth….very farfrom alarming • Unit labour costs are rising, but growth in wages and salaries remains low. As in other developed economies, globalisation and technological change are holding back wage growth. • Demand-pull inflation doesn’t look like appearing anytime soon. -1.5% -1.0% -0.5% 0.0% 0.5% 1.0% 1.5% Average Hourly Earnings by Industry (% Y/Y Change, Differenceto 8-year Avg) Source: Macrobond - 1.0 2.0 3.0 4.0 5.0 -3 -1 1 3 5 1995 1997 1999 2001 2003 2005 2007 2009 2011 2013 2015 Unit Labour Costs and Wages (% Y/Y Change) UnitLabour Costs Wages& Salaries,RHS Source: Macrobond
  • 6.
    And growth isn’tshooting the lights out • Growth has been ticking along nicely compared to recent years. But it’s modest compared to the pre- crisis period. • Personal consumption growth is robust, but it’s cooled a little in recent months. 0.0 1.0 2.0 3.0 4.0 1995-2007 2003-2007 2012-2015 2015 USGDP Growth (Annualised Rate, Y/Y Change) GDP Personal Spending Source: Macrobond -4% -2% 0% 2% 4% 6% 2005 2007 2009 2011 2013 2015 US - PersonalConsumption (% Y/Y Change, 3mma) Personal Consumption (Exc.Food & Energy) Source: Macrobond
  • 7.
    Investment is….meh! • Fixedinvestment is a similar story to spending – solid but not spectacular. • Investment in intellectual property (around 25% of private fixed investment) has remained robust while commodity related investment has fallen. • Durable goods orders – a leading indicator of investment – are falling. • And so has manufacturing capacity utilisation. -40% -30% -20% -10% 0% 10% 20% 30% 40% 1995-2007 2003-2007 2012-2014 2015 US Private Fixed Investment (% Y/Y Growth) Mining& OilfieldMachinery Intellectual Property Total Private FixedInv Source: Macrobond 65 70 75 80 85 -40 -30 -20 -10 0 10 20 30 2005 2007 2009 2011 2013 2015 Durable Goods Orders and Capacity Utilisation Durable Goods Orders, Y/Y Change, LHS Capacity Utilisation (%), RHSSource: Macrobond
  • 8.
    The global backdropis hardly great • The last time the Fed raised rates, China and the Eurozone were growing twice as fast as they are now. And exports were consequently booming. • But now, global growth is stuck in the slow lane and exports are falling in volume terms. -2% 0% 2% 4% 6% 8% 10% Past 20 years 2004-2007 2012-2015 Past Six Months US Exports and World Trade (Volume, % Y/Y Change) US Export Volume World Trade Source: CPB -5 0 5 10 15 US Export Growth (Volume) China Growth EZ Growth Global Growth %Y/YChange US Rate Rise - The Global Backdrop Q2 2006 (Last FedRate Rise) 2015 Source: IMF, Macrobond, Bloomberg
  • 9.
    China slowing andother EM concerns • China is slowing more than the headline figures suggest. • Its problems are structural not cyclical so the slowdown likely has a lot further left to run. • Emerging market firms have been increasing their leverage. A significant proportion of that is dollar- denominated. Higher US interest rates potentially spells further trouble. 0 5 10 15 20 1998 2000 2002 2004 2006 2008 2010 2012 2014 EstimatingChina's 'True' Growth ReportedGDP GDP'Estimate' Source: Bloomberg,Macrobond, RBSEconomics 1.0 1.5 2.0 2.5 3.0 2004 2005 2006 2007 2008 2009 2010 2011 2012 2013 2014 Leverage Ratio of Corporations (Annualised Ratio) Emerging Economies Advanced Economies Source: BIS
  • 10.
    Easy does it 10 •Atthe very least the Fed's tightening cycle is going to be extremely gentle when compared to the past. And it won't take much at all for tightening to become easing once again. 0% 1% 2% 3% 4% 5% 0 10 20 30 40 Cumulativepercentagepointincrease Months following 1st rate rise decision Mar-83 Jan-87 Mar-88 Feb-94 Jun-99 Jun-04 OIS forward curve implied Source: Macrobond
  • 11.
    Trying to createsome wriggle room 11 •The Fed may be looking to create room to respond to future slowdowns in growth. Especially given that it feels the unemployment rate is sufficiently low that higher inflation could be around the corner. 0% 5% 10% 15% 20% 25% Feb-71 Feb-81 Feb-91 Feb-01 Feb-11 Recessions Federal Funds Target Rate -5.00% -5.50% -5.25% Source: Macrobond
  • 12.
    -10 -5 0 5 10 Debt Service Ratios -Change since 2008, Private Non-Fin Sector Source: BIS Watch out Emerging Markets! •The Fed has spent much of the year preparing the ground for a rate rise, aiming not to repeat 2013's taper tantrum. But, it will have to continue communicating its intent to gradually raise interest rates. • Otherwise an abrupt tightening of global financial conditions could occur, an unwanted outcome given concerns over the debt loads in emerging markets. Mainly Developed Economies Mainly Emerging Economies
  • 13.
    Final thoughts • TheUS is better placed than other major developed economies for a rate hike. But it’s not clear that one is needed. •The risk is that the Fed treads the well-worn path of other central banks in places such as the Euro Area, Sweden & Switzerland. Rates rise, disinflationary forces intensify and rates have to be brought down further than before. •There is an argument in favour of higher rates to cool asset price growth and risk-taking. But interest rates are a blunt tool for this purpose.
  • 14.
    Follow us onTwitter 14 @RBS_Economics https://twitter.com/rbs_economics
  • 15.
    15 Disclaimer This material ispublished by The Royal Bank of Scotland plc (“RBS”), for information purposes only and should not be regarded as providing any specific advice. Recipients should make their own independent evaluation of this information and no action should be taken, solely relying on it. This material should not be reproduced or disclosed without our consent. It is not intended for distribution in any jurisdiction in which this would be prohibited. Whilst this information is believed to be reliable, it has not been independently verified by RBS and RBS makes no representation or warranty (express or implied) of any kind, as regards the accuracy or completeness of this information, nor does it accept any responsibility or liability for any loss or damage arising in any way from any use made of or reliance placed on, this information. Unless otherwise stated, any views, forecasts, or estimates are solely those of RBS’s RBS Economics Department, as of this date and are subject to change without notice. The classification of this document is PUBLIC. The Royal Bank of Scotland plc. Registered in Scotland No. 90312. Registered Office: 36 St Andrew Square, Edinburgh EH2 2YB. The Royal Bank of Scotland plc is authorised by the Prudential Regulation Authority and regulated by the Financial Conduct Authority and the Prudential Regulation Authority. © Copyright 2015 The Royal Bank of Scotland Group plc. All rights reserved