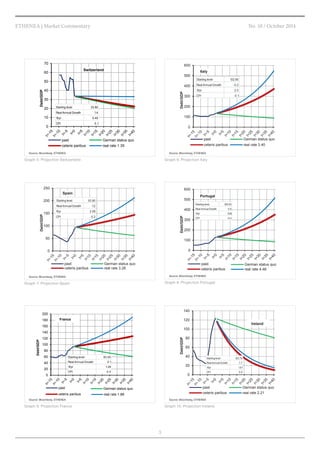
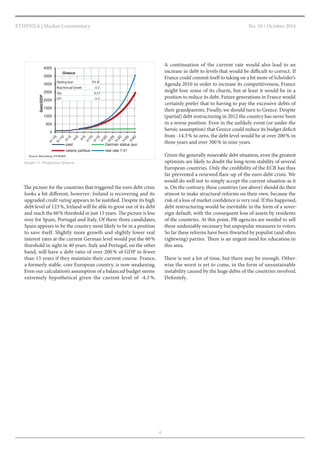
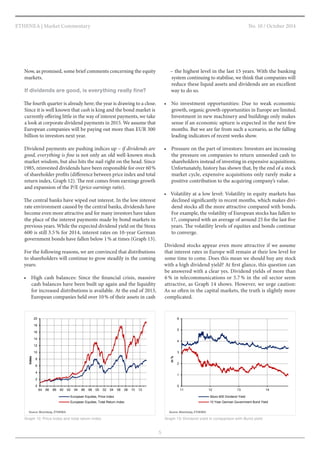
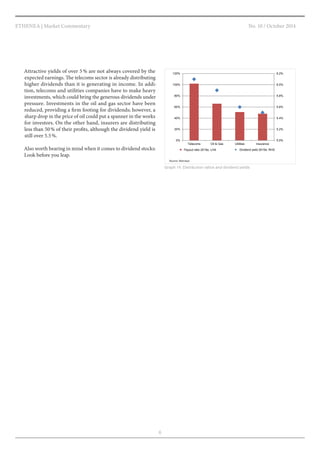
SlideShare a Scribd company logo
info@ethenea.com www.ethenea.com 
MARKET COMMENTARY 
No. 10 / October 2014 
This Market Commentary focuses on a slightly different topic 
than usual, because this time we look at the long-term situ-ation 
in the markets rather than the current one. We usually 
take a look at the economic data and compare them with our 
expectations and those of the market. This task is performed 
by the surprise indicators (Graph 1), at least for the market. 
While the markets are increasingly disappointed by the figures 
from the Eurozone, data from the US is better than expected 
(although to a steadily lesser degree). This largely coincides 
with our own assessment of the situation on both sides of the 
pond. Europe is struggling, probably in vain, against a renewed 
recession. However, since even supposedly strong economies 
like Germany are beginning to weaken, the likelihood of a 
turnaround in European growth has to be considered fairly 
remote. 
The picture in the US, though, is very different (for now). 
The economic data continue to surprise positively, especially 
labour market data, which play an important role in the 
interest rate policy of the US central bank. Interpreting the US 
labour market data is a science in itself, as we have frequently 
reported in the past. This seems to be the only reason why the 
Fed (Federal Reserve) is continuing its loose monetary policy. 
After all, it’s not as simple as a first look at the data would 
suggest. 
All in all, the markets are performing as we predicted in past 
commentaries: Eurozone yields continue to fall, US yields are 
largely stable and are not rising significantly. The equity mar-kets 
seem to be disappointing, but only at first sight – when 
you consider that the global economic data actually point 
towards a weakening, which is not exactly a point in favour 
of corporate earnings growth. In this environment equities 
remain quite stable, which is undoubtedly due to the presumed 
lack of alternatives to equity investments. 
We therefore concern ourselves less with the current market, 
and instead take a long view of the markets before exploring 
the subject of dividends in greater detail in the equities part of 
this Market Commentary. 
The worst is yet to come. Definitely. 
Many European countries are well 
above the 60 percent debt limit. 
Another negative development could 
lead to market instability. Will 
countries manage to reduce their debt 
in the future?
No. 10 / October 2014 
2 
ETHENEA | Market Commentary 
Graphs 3 to 11 show a very simple projection of future public 
debt in relation to gross domestic product (GDP). Although 
we may be oversimplifying here, we think this provides signifi-cant 
insights. 
In making these projections, we first of all assume that 
government budgets are balanced. A closer look at the prima-ry 
balances (Graph 2) nevertheless reveals that budgets are 
anything but balanced even before debt servicing, with the 
almost glorious exceptions of Germany and Italy. However, 
the picture changes significantly when interest payments are 
added. For Italy, this results in a budget deficit of 3 % of the 
country’s GDP. 
As stated, we nevertheless try to be optimistic about the future 
and take the satisfying gift of balanced budgets as a given. 
Moreover, we look at three scenarios: The main scenario in-volves 
the continuation of the status quo, designated as ceteris 
-100 
-80 
-60 
-40 
-20 
0 
20 
40 
60 
80 
100 
10 11 12 13 14 
Economic Surprise Index 
Eurozone USA 
Graph 1: Surprise indicators USA and Eurozone 
Source: Bloomberg, ETHENEA, Citibank 
-12 
-10 
-8 
-6 
-4 
-2 
0 
2 
4 
6 
98 99 00 01 02 03 04 05 06 07 08 09 10 11 12 13 
Government Primary Balance as % of GDP 
Germany France Greece Spain 
Portugal Italy USA 
Graph 2: Primary balances of selected countries 
Source: OECD, ETHENEA 
paribus in the graphs. In the charts, we keep the currently 
observed GDP growth rate and the real interest rate on debt 
(10-year nominal interest rate minus the annual consumer 
price inflation rate) constant. This scenario is seen in the 
charts as a red line. Another variant of the projection involves 
an increase in the real interest rate by 1 % (blue line). In the 
last scenario, we used the data of the supposed model pupil 
Germany for the projection, i.e. German real interest rates and 
GDP growth rates (green line). 
The projections for Germany, the USA and Switzerland allow 
the viewer to look calmly to the future. Even ceteris paribus 
Germany will reach the 60 % Maastricht limit again in 23 years. 
If the European Central Bank (ECB) succeeds with its policy 
of increasing inflation while simultaneously maintaining low 
nominal interest rates, this 60 % level could even be reached 
earlier. The USA and Switzerland, where the situation is com-parable, 
also seem likely to avoid debt problems. 
0 
10 
20 
30 
40 
50 
60 
70 
80 
90 
Debt/GDP 
past ceteris paribus 
real yield -0.86 real yield 1.14 
Germany 
Starting level 78.40 
Real Annual Growth 1.2 
10yr 0.944 
CPI 0.8 
Graph 3: Projection Germany 
Source: Bloomberg, ETHENEA 
0 
10 
20 
30 
40 
50 
60 
70 
80 
Debt/GDP 
past ceteris paribus 
German status quo real rate 1.80 
USA 
Starting level 71.80 
Real Annual Growth 2.6 
10yr 2.5 
CPI 1.7 
Graph 4: Projection USA 
Source: Bloomberg, ETHENEA
No. 10 / October 2014 
3 
ETHENEA | Market Commentary 
0 
100 
200 
300 
400 
500 
600 
Debt/GDP 
past 
ceteris paribus 
German status quo 
real rate 3.40 
Italy 
Starting level 132.60 
Real Annual Growth - 0.2 
10yr 2.3 
CPI - 0.1 
Graph 6: Projection Italy 
Source: Bloomberg, ETHENEA 
0 
10 
20 
30 
40 
50 
60 
70 
Debt/GDP 
past 
ceteris paribus 
German status quo 
real rate 1.35 
Switzerland 
Starting level 33.80 
Real Annual Growth 1.4 
10yr 0.45 
CPI 0.1 
Graph 5: Projection Switzerland 
Source: Bloomberg, ETHENEA 
0 
50 
100 
150 
200 
250 
Debt/GDP 
past 
ceteris paribus 
German status quo 
Starting level 93.90 
Re al Annual Growth 1.2 
10yr 2.08 
CPI - 0.2 
Spain 
real rate 3.28 
Graph 7: Projection Spain 
Source: Bloomberg, ETHENEA 
0 
20 
40 
60 
80 
100 
120 
140 
160 
180 
200 
Debt/GDP 
past 
ceteris paribus 
German status quo 
real rate 1.88 
France 
Starting level 93.50 
Real Annual Growth 0.1 
10yr 1.28 
CPI 0.4 
Graph 9: Projection France 
Source: Bloomberg, ETHENEA 
0 
100 
200 
300 
400 
500 
600 
Debt/GDP 
past 
ceteris paribus 
German status quo 
real rate 4.46 
Portugal 
Starting level 129.00 
Real Annual Growth 0.9 
10yr 3.06 
CPI -0.4 
Graph 8: Projection Portugal 
Source: Bloomberg, ETHENEA 
0 
20 
40 
60 
80 
100 
120 
140 
Debt/GDP 
past 
ceteris paribus 
German status quo 
real rate 2.21 
Ireland 
Starting level 123.70 
Real Annual Growth 7.7 
10yr 1.61 
CPI 0.4 
Graph 10: Projection Ireland 
Source: Bloomberg, ETHENEA
No. 10 / October 2014 
4 
ETHENEA | Market Commentary 
The picture for the countries that triggered the euro debt crisis 
looks a bit different, however: Ireland is recovering and its 
upgraded credit rating appears to be justified. Despite its high 
debt level of 123 %, Ireland will be able to grow out of its debt 
and reach the 60 % threshold in just 13 years. The picture is less 
rosy for Spain, Portugal and Italy. Of these three candidates, 
Spain appears to be the country most likely to be in a position 
to save itself. Slightly more growth and slightly lower real 
interest rates at the current German level would put the 60 % 
threshold in sight in 40 years. Italy and Portugal, on the other 
hand, will have a debt ratio of over 200 % of GDP in fewer 
than 15 years if they maintain their current course. France, 
a formerly stable, core European country, is now weakening. 
Even our calculation’s assumption of a balanced budget seems 
extremely hypothetical given the current level of -4.3 %. 
A continuation of the current rate would also lead to an 
increase in debt to levels that would be difficult to correct. If 
France could commit itself to taking on a bit more of Schröder’s 
Agenda 2010 in order to increase its competitiveness, France 
might lose some of its charm, but at least it would be in a 
position to reduce its debt. Future generations in France would 
certainly prefer that to having to pay the excessive debts of 
their grandparents. Finally, we should turn to Greece. Despite 
(partial) debt restructuring in 2012 the country has never been 
in a worse position. Even in the unlikely event (or under the 
heroic assumption) that Greece could reduce its budget deficit 
from -14.3 % to zero, the debt level would be at over 200 % in 
three years and over 300 % in nine years. 
Given the generally miserable debt situation, even the greatest 
optimists are likely to doubt the long-term stability of several 
European countries. Only the credibility of the ECB has thus 
far prevented a renewed flare-up of the euro debt crisis. We 
would do well not to simply accept the current situation as it 
is. On the contrary, these countries (see above) should do their 
utmost to make structural reforms on their own, because the 
risk of a loss of market confidence is very real. If this happened, 
debt restructuring would be inevitable in the form of a sover-eign 
default, with the consequent loss of assets by residents 
of the countries. At this point, PR agencies are needed to sell 
these undeniably necessary but unpopular measures to voters. 
So far these reforms have been thwarted by populist (and often 
rightwing) parties. There is an urgent need for education in 
this area. 
There is not a lot of time, but there may be enough. Other-wise 
the worst is yet to come, in the form of unsustainable 
instability caused by the huge debts of the countries involved. 
Definitely. 
0 
500 
1000 
1500 
2000 
2500 
3000 
3500 
4000 
Debt/GDP 
past 
ceteris paribus 
German status quo 
real rate 7.51 
Greece 
Starting level 175.10 
Real Annual Growth - 0.3 
10yr 6.21 
CPI - 0.3 
Graph 11: Projection Greece 
Source: Bloomberg, ETHENEA
No. 10 / October 2014 
5 
ETHENEA | Market Commentary 
0 
2 
4 
6 
8 
10 
12 
14 
16 
18 
20 
84 86 88 90 92 94 96 98 00 02 04 06 08 10 12 
Index 
European Equities, Price Index 
European Equities, Total Return Index 
Graph 12: Price index and total return index 
Source: Bloomberg, ETHENEA 
0 
1 
2 
3 
4 
5 
6 
11 12 13 14 
in % 
Stoxx 600 Dividend Yield 
10 Year German Government Bond Yield 
Graph 13: Dividend yield in comparison with Bund yield 
Source: Bloomberg, ETHENEA 
– the highest level in the last 15 years. With the banking 
system continuing to stabilise, we think that companies will 
reduce these liquid assets and dividends are an excellent 
way to do so. 
• No investment opportunities: Due to weak economic 
growth, organic growth opportunities in Europe are limited. 
Investment in new machinery and buildings only makes 
sense if an economic upturn is expected in the next few 
months. But we are far from such a scenario, as the falling 
leading indicators of recent weeks show. 
• Pressure on the part of investors: Investors are increasing 
the pressure on companies to return unneeded cash to 
shareholders instead of investing in expensive acquisitions. 
Unfortunately, history has shown that, by the end of a stock 
market cycle, expensive acquisitions only rarely make a 
positive contribution to the acquiring company’s value. 
• Volatility at a low level: Volatility in equity markets has 
declined significantly in recent months, which makes divi-dend 
stocks all the more attractive compared with bonds. 
For example, the volatility of European stocks has fallen to 
17, compared with an average of around 25 for the last five 
years. The volatility levels of equities and bonds continue 
to converge. 
Dividend stocks appear even more attractive if we assume 
that interest rates in Europe will remain at their low level for 
some time to come. Does this mean we should buy any stock 
with a high dividend yield? At first glance, this question can 
be answered with a clear yes. Dividend yields of more than 
6 % in telecommunications or 5.7 % in the oil sector seem 
attractive, as Graph 14 shows. However, we urge caution: 
As so often in the capital markets, the truth is slightly more 
complicated. 
Now, as promised, some brief comments concerning the equity 
markets. 
If dividends are good, is everything really fine? 
The fourth quarter is already here; the year is drawing to a close. 
Since it is well known that cash is king and the bond market is 
currently offering little in the way of interest payments, we take 
a look at corporate dividend payments in 2015. We assume that 
European companies will be paying out more than EUR 300 
billion to investors next year. 
Dividend payments are pushing indices up – if dividends are 
good, everything is fine is not only an old well-known stock 
market wisdom, but also hits the nail right on the head. Since 
1985, reinvested dividends have been responsible for over 60 % 
of shareholder profits (difference between price index and total 
return index, Graph 12). The rest comes from earnings growth 
and expansion of the P/E (price-earnings ratio). 
The central banks have wiped out interest. In the low interest 
rate environment caused by the central banks, dividends have 
become even more attractive and for many investors have taken 
the place of the interest payments made by bond markets in 
previous years. While the expected dividend yield on the Stoxx 
600 is still 3.5 % for 2014, interest rates on 10-year German 
government bonds have fallen below 1 % at times (Graph 13). 
For the following reasons, we are convinced that distributions 
to shareholders will continue to grow steadily in the coming 
years: 
• High cash balances: Since the financial crisis, massive 
cash balances have been built up again and the liquidity 
for increased distributions is available. At the end of 2013, 
European companies held over 10 % of their assets in cash
No. 10 / October 2014 
6 
ETHENEA | Market Commentary 
Attractive yields of over 5 % are not always covered by the 
expected earnings. The telecoms sector is already distributing 
higher dividends than it is generating in income. In addi-tion, 
telecoms and utilities companies have to make heavy 
investments, which could bring the generous dividends under 
pressure. Investments in the oil and gas sector have been 
reduced, providing a firm footing for dividends; however, a 
sharp drop in the price of oil could put a spanner in the works 
for investors. On the other hand, insurers are distributing 
less than 50 % of their profits, although the dividend yield is 
still over 5.5 %. 
Also worth bearing in mind when it comes to dividend stocks: 
Look before you leap. 
5.0% 
5.2% 
5.4% 
5.6% 
5.8% 
6.0% 
6.2% 
0% 
20% 
40% 
60% 
80% 
100% 
120% 
Telecoms Oil & Gas Utilities Insurance 
Payout ratio 2015e, LHS Dividend yield 2015e, RHS 
Graph 14: Distribution ratios and dividend yields 
Source: Barclays
No. 10 / October 2014 
7 
ETHENEA | Market Commentary 
Positioning of the Ethna-AKTIV E 
With no further deterioration in the geopolitical situation, we 
used the higher market volatility to expand our equity exposure 
by just under 9 % to 28.4 % at month-end. The markets should 
receive particular support from further easing steps by the ECB 
based on current macroeconomic data. At sector level we 
therefore focused on the banking sector, as it should be the 
biggest beneficiary of additional measures. We also increased 
positions in the telecommunications sector. Further consolida-tion 
and takeover rumours will have a supportive effect on 
prices, particularly in the USA. Weak global demand and fur-ther 
growth in US production put the oil price under pressure 
last month. Consequently, we further reduced exposure in the 
oil sector. The stable pharmaceutical sector remains a core 
investment and was further expanded. We like the sector’s 
combination of solid business models, relatively attractive 
valuations and potential for further acquisitions. 
The continued increase in policy divergence between the Fed 
and the ECB confirms our opinion regarding a further appre-ciation 
of the USD against the EUR. Therefore, we have not 
changed our exposure, although the corresponding gains in-creased 
the weighting to 25.1 % at month-end. In order not to 
increase the impact of currency volatility on the overall port-folio, 
we further reduced the AUD portfolio and realised gains 
on the foreign exchange and bond side. 
The average rating of the fund remained unchanged between 
A and A+, while the bond weighting was reduced by 2.5 % 
month-on-month. In particular, non-investment-grade secu-rities 
were closed at a profit in order to keep the overall vola-tility 
low at a higher equity exposure. We used Treasury futures 
to reduce the modified duration slightly to 4.12 at month-end. 
However, this was only for tactical reasons – we are maintaining 
our macro picture and expect interest rates to remain low for 
an extended period both in Europe and in the USA. 
30.5 
0.6 
4.1 
10.3 
12.4 
2.3 
29.6 
0.0 
9.6 0.7 
AAA 
AA 
A 
BBB 
NON IG 
Not rated 
Equities 
Tactical reserve* 
Cash 
Others 
% of Total NAV 
Ethna-AKTIV E 
Source: ETHENEA 
Graph 15: Breakdown of the Ethna-AKTIV E portfolio by issuer rating 
Ethna-AKTIV E 
% of Total NAV 
30.5 
0.6 
4.1 
10.3 
AAA 
AA 
A 
BBB 
NON IG 
Not rated 
Equities 
Tactical reserve* 
Cash 
Others 
% of Total NAV 
Ethna-AKTIV E 
* for potential direct investments 
and derivatives in equities 
69.7 
0.1 
1.0 
25.1 
0.0 
3.6 
0.4 
42.1 
5.3 
1.0 
44.5 
3.1 
3.6 
0.4 
EUR 
CHF 
AUD 
USD 
GBP 
NOK 
SEK Net Gross 
Source: ETHENEA 
Ethna-AKTIV E 
% of Total NAV 
Graph 16: Breakdown of the Ethna-AKTIV E portfolio by currency
No. 10 / October 2014 
8 
ETHENEA | Market Commentary 
Graph 17: Development of the various market trends, compared with the previous month and the current year 
Currency 
TW € € $ € CHF € £ € JPY € AUD € NOK € CAD € TRY € CNH 
Last 92.81 1.2676 1.20807 0.78503 137.2 1.44081 8.1671 1.4131 2.8801 7.807 
-1m -1.3 % -3.6 % 0.2 % -1.0 % 0.3 % 2.4 % 0.3 % -1.0 % 1.5 % -3.4 % 
ytd -5.0 % -8.1 % -1.4 % -5.7 % -5.5 % -6.7 % -2.3 % -3.6 % -2.9 % -6.5 % 
German Gvmt ITRAXX 5y 
2y 5y 10y 10/2y Europe Xover SenFin SubFin 
Last -0.072 0.145 0.902 97 65 263 64 93 
-1m -4 -3 1 5 5 22 3 10 
ytd -29 -78 -103 -74 -5 -23 -23 -35 
Equities 
DAX Dow EuroStx CAC40 FTSE Nikkei Shanghai 
Last 9,195.68 16,801.05 3,106.42 4,242.67 6,446.39 15,661.99 2,363.87 
-1m -2.9 % -1.7 % -2.1 % -3.2 % -5.5 % 1.5 % 6.6 % 
ytd -3.7 % 1.4 % -0.1 % -1.2 % -4.5 % -3.9 % 11.7 % 
DAX P/E Dow P/E EuroStx P/E CAC40 P/E FTSE P/E Nikkei P/E Shanghai P/E 
Last 12.8 14.7 14.1 14.6 13.3 17.5 9.4 
-1m -4.5 % -2.7 % -2.1 % -3.5 % -5.9 % 1.0 % 6.7 % 
ytd -9.2 % -5.5 % -3.3 % -6.6 % -5.3 % -17.0 % 1.4 % 
Graph 18: Figures of the Ethna-AKTIV E at the end of the month 
Date Fund Yield p. a. Rating is 
between 
Mod. 
Duration 
Current yield 
p. a. 
Mod. Duration 
- bonds only- 
30/09/2014 Ethna-AKTIV E 3.09 % A A+ 4.12 3.36 % 4.84 
Yield pick-up to German 10y Gvmt 
USA UK Japan France Austria Holland Italy Spain Portugal Greece Ireland 
Last 152 142 -38 35 21 14 142 121 217 557 73 
-1m 145 148 -39 36 24 17 155 134 233 493 89 
ytd 110 109 -119 63 34 31 220 222 420 649 158
No. 10 / October 2014 
9 
ETHENEA | Market Commentary 
34.3 
20.7 
6.0 5.5 4.8 
3.6 2.9 2.1 2.1 1.8 
0.8 0.7 0.6 
3.9 
0 
5 
10 
15 
20 
25 
30 
35 
Graph 19: Breakdown of the Ethna-AKTIV E portfolio by origin 
Source: ETHENEA 
Ethna-AKTIV E 
% of Total NAV * Including 12 other countries 
Bonds Equities 
26.7 
6.8 6.4 6.0 
4.9 4.8 4.2 3.5 3.2 3.0 2.6 2.3 1.7 1.5 1.1 1.1 1.0 1.0 0.9 0.9 0.8 0.8 0.6 0.6 0.5 
2.8 
0 
5 
10 
15 
20 
25 
Graph 20: Breakdown of the Ethna-AKTIV E portfolio by issuer sector 
Source: ETHENEA 
Ethna-AKTIV E 
% of Total NAV * Including 12 other sectors 
Bonds Equities
info@ethenea.com www.ethenea.com 
NB: 
An investment in investment funds, as with all securities and comparable financial assets, carries the risk of capital or currency losses. Consequently, 
the unit price and the yield are variable and cannot be guaranteed. The costs of a fund investment have an effect on the actual profit. No guarantee can 
be given that the investment objectives will be achieved. The statutory sales documents form the sole legal basis for a purchase of units. All information 
published here constitutes a product description only. It does not constitute investment advice, an offer to enter into an agreement for the provision of 
advice or information or a solicitation of an offer to buy or sell securities. Contents have been carefully researched, compiled and checked. No guarantee 
can be given for correctness, completeness or accuracy. Munsbach, 30/09/2014. 
Portfolio Management: 
Guido Barthels (author) 
Luca Pesarini 
Arnoldo Valsangiacomo 
Please do not hesitate to contact us if you have any questions or suggestions. 
ETHENEA Independent Investors S.A. 
9a, Rue Gabriel Lippmann · 5365 Munsbach · Luxembourg 
Phone +352 276 921 10 · Fax +352 276 921 99 
info@ethenea.com · www.ethenea.com

More Related Content

What's hot

Tier one data key with dollar strength setting up again
Tier one data key with dollar strength setting up again  Tier one data key with dollar strength setting up again
Tier one data key with dollar strength setting up again
Hantec Markets
 
Fasanara Capital | Appendix | Portfolio Buckets
Fasanara Capital | Appendix | Portfolio BucketsFasanara Capital | Appendix | Portfolio Buckets
Fasanara Capital | Appendix | Portfolio BucketsFasanara Capital ltd
 
The magnificienty 7 and equity markets review 8
The magnificienty 7 and equity markets   review 8The magnificienty 7 and equity markets   review 8
The magnificienty 7 and equity markets review 8
Markets Beyond
 
UK and Eurozone inflation focus in a quiet week for US data
UK and Eurozone inflation focus in a quiet week for US dataUK and Eurozone inflation focus in a quiet week for US data
UK and Eurozone inflation focus in a quiet week for US data
Richard Perry
 
Can the dollar continue to rebound as payrolls loom?
Can the dollar continue to rebound as payrolls loom?Can the dollar continue to rebound as payrolls loom?
Can the dollar continue to rebound as payrolls loom?
Hantec Markets
 
Active central banks and rising political risk key for market moves
Active central banks and rising political risk key for market movesActive central banks and rising political risk key for market moves
Active central banks and rising political risk key for market moves
Richard Perry
 
Is the medium term dollar rally about to break down?
Is the medium term dollar rally about to break down?Is the medium term dollar rally about to break down?
Is the medium term dollar rally about to break down?
Hantec Markets
 
Monthly Viewpoint: April 2017
Monthly Viewpoint: April 2017Monthly Viewpoint: April 2017
Monthly Viewpoint: April 2017
Felipe Massu
 
Trump/Kim, the FOMC and ECB all crucial this week
Trump/Kim, the FOMC and ECB all crucial this weekTrump/Kim, the FOMC and ECB all crucial this week
Trump/Kim, the FOMC and ECB all crucial this week
Hantec Markets
 
Are markets setting up for a dollar rally this week?
Are markets setting up for a dollar rally this week?Are markets setting up for a dollar rally this week?
Are markets setting up for a dollar rally this week?
Richard Perry
 
ECB, US growth and the Fed chair will be key
ECB, US growth and the Fed chair will be keyECB, US growth and the Fed chair will be key
ECB, US growth and the Fed chair will be key
Richard Perry
 
Gi French Connection
Gi French ConnectionGi French Connection
Gi French Connection
David Apted
 
Fasanara Capital | Investment Outlook | December 1st 2014
Fasanara Capital | Investment Outlook | December 1st 2014Fasanara Capital | Investment Outlook | December 1st 2014
Fasanara Capital | Investment Outlook | December 1st 2014Fasanara Capital ltd
 
The magnificient 7 and equity markets review 7
The magnificient 7 and equity markets   review 7The magnificient 7 and equity markets   review 7
The magnificient 7 and equity markets review 7Markets Beyond
 
Saxo Bank Q3.pdf
Saxo Bank Q3.pdfSaxo Bank Q3.pdf
Fasanara Capital | Investment Outlook | January 11th 2013
Fasanara Capital | Investment Outlook | January 11th 2013Fasanara Capital | Investment Outlook | January 11th 2013
Fasanara Capital | Investment Outlook | January 11th 2013Fasanara Capital ltd
 
With a dearth of US data the ECB will be key this week
With a dearth of US data the ECB will be key this weekWith a dearth of US data the ECB will be key this week
With a dearth of US data the ECB will be key this week
Richard Perry
 
Fasanara Capital | Investment Outlook | February 1st 2013
Fasanara Capital | Investment Outlook | February 1st 2013Fasanara Capital | Investment Outlook | February 1st 2013
Fasanara Capital | Investment Outlook | February 1st 2013Fasanara Capital ltd
 
Fasanara Capital | Investment Outlook June 2012 (published May 25th)
Fasanara Capital | Investment Outlook June 2012 (published May 25th)Fasanara Capital | Investment Outlook June 2012 (published May 25th)
Fasanara Capital | Investment Outlook June 2012 (published May 25th)Fasanara Capital ltd
 

What's hot (20)

Tier one data key with dollar strength setting up again
Tier one data key with dollar strength setting up again  Tier one data key with dollar strength setting up again
Tier one data key with dollar strength setting up again
 
Fasanara Capital | Appendix | Portfolio Buckets
Fasanara Capital | Appendix | Portfolio BucketsFasanara Capital | Appendix | Portfolio Buckets
Fasanara Capital | Appendix | Portfolio Buckets
 
The magnificienty 7 and equity markets review 8
The magnificienty 7 and equity markets   review 8The magnificienty 7 and equity markets   review 8
The magnificienty 7 and equity markets review 8
 
UK and Eurozone inflation focus in a quiet week for US data
UK and Eurozone inflation focus in a quiet week for US dataUK and Eurozone inflation focus in a quiet week for US data
UK and Eurozone inflation focus in a quiet week for US data
 
Can the dollar continue to rebound as payrolls loom?
Can the dollar continue to rebound as payrolls loom?Can the dollar continue to rebound as payrolls loom?
Can the dollar continue to rebound as payrolls loom?
 
Active central banks and rising political risk key for market moves
Active central banks and rising political risk key for market movesActive central banks and rising political risk key for market moves
Active central banks and rising political risk key for market moves
 
Is the medium term dollar rally about to break down?
Is the medium term dollar rally about to break down?Is the medium term dollar rally about to break down?
Is the medium term dollar rally about to break down?
 
Monthly Viewpoint: April 2017
Monthly Viewpoint: April 2017Monthly Viewpoint: April 2017
Monthly Viewpoint: April 2017
 
Trump/Kim, the FOMC and ECB all crucial this week
Trump/Kim, the FOMC and ECB all crucial this weekTrump/Kim, the FOMC and ECB all crucial this week
Trump/Kim, the FOMC and ECB all crucial this week
 
Are markets setting up for a dollar rally this week?
Are markets setting up for a dollar rally this week?Are markets setting up for a dollar rally this week?
Are markets setting up for a dollar rally this week?
 
ECB, US growth and the Fed chair will be key
ECB, US growth and the Fed chair will be keyECB, US growth and the Fed chair will be key
ECB, US growth and the Fed chair will be key
 
Gi French Connection
Gi French ConnectionGi French Connection
Gi French Connection
 
Fasanara Capital | Investment Outlook | December 1st 2014
Fasanara Capital | Investment Outlook | December 1st 2014Fasanara Capital | Investment Outlook | December 1st 2014
Fasanara Capital | Investment Outlook | December 1st 2014
 
The magnificient 7 and equity markets review 7
The magnificient 7 and equity markets   review 7The magnificient 7 and equity markets   review 7
The magnificient 7 and equity markets review 7
 
Saxo Bank Q3.pdf
Saxo Bank Q3.pdfSaxo Bank Q3.pdf
Saxo Bank Q3.pdf
 
HFJ Article sep10
HFJ Article sep10HFJ Article sep10
HFJ Article sep10
 
Fasanara Capital | Investment Outlook | January 11th 2013
Fasanara Capital | Investment Outlook | January 11th 2013Fasanara Capital | Investment Outlook | January 11th 2013
Fasanara Capital | Investment Outlook | January 11th 2013
 
With a dearth of US data the ECB will be key this week
With a dearth of US data the ECB will be key this weekWith a dearth of US data the ECB will be key this week
With a dearth of US data the ECB will be key this week
 
Fasanara Capital | Investment Outlook | February 1st 2013
Fasanara Capital | Investment Outlook | February 1st 2013Fasanara Capital | Investment Outlook | February 1st 2013
Fasanara Capital | Investment Outlook | February 1st 2013
 
Fasanara Capital | Investment Outlook June 2012 (published May 25th)
Fasanara Capital | Investment Outlook June 2012 (published May 25th)Fasanara Capital | Investment Outlook June 2012 (published May 25th)
Fasanara Capital | Investment Outlook June 2012 (published May 25th)
 

Similar to 2014.10 ethenea-market-commentary-ethna-aktiv-e

Ecb update tltro and qe
Ecb update tltro and qeEcb update tltro and qe
Ecb update tltro and qe
Cristiana Corno
 
Fasanara Capital | Investment Outlook | November 16th 2012
Fasanara Capital | Investment Outlook | November 16th 2012Fasanara Capital | Investment Outlook | November 16th 2012
Fasanara Capital | Investment Outlook | November 16th 2012Fasanara Capital ltd
 
Swedbank's Global Economic Outlook, 2010 March 18
Swedbank's Global Economic Outlook, 2010 March 18Swedbank's Global Economic Outlook, 2010 March 18
Swedbank's Global Economic Outlook, 2010 March 18
Swedbank
 
Eurozone May 2011: Focus on slowing growth ahead not lagging inflation
Eurozone May 2011: Focus on slowing growth ahead not lagging inflationEurozone May 2011: Focus on slowing growth ahead not lagging inflation
Eurozone May 2011: Focus on slowing growth ahead not lagging inflation
Laeeth Isharc
 
Future of Europe (IBR 2015)
Future of Europe (IBR 2015)Future of Europe (IBR 2015)
Future of Europe (IBR 2015)
Grant Thornton
 
Where Next For The World Economy
Where Next For The World EconomyWhere Next For The World Economy
Where Next For The World Economy
Justin Patrie
 
The Global Economy No. 4 - May 16, 2012
The Global Economy No. 4 -  May 16, 2012The Global Economy No. 4 -  May 16, 2012
The Global Economy No. 4 - May 16, 2012
Swedbank
 
2009. Jürgen Pfister. The global and European environment for CEE economies. ...
2009. Jürgen Pfister. The global and European environment for CEE economies. ...2009. Jürgen Pfister. The global and European environment for CEE economies. ...
2009. Jürgen Pfister. The global and European environment for CEE economies. ...Forum Velden
 
German rebalancing: Waiting for GODOT? *Another Must Read
German rebalancing: Waiting for GODOT? *Another Must ReadGerman rebalancing: Waiting for GODOT? *Another Must Read
German rebalancing: Waiting for GODOT? *Another Must Read
Ira Kristina Lumban Tobing
 
PwC Global Economy Watch (oct. 2013)
PwC Global Economy Watch (oct. 2013)PwC Global Economy Watch (oct. 2013)
PwC Global Economy Watch (oct. 2013)
PwC France
 
To the Point, October 27 2009
To the Point, October 27 2009To the Point, October 27 2009
To the Point, October 27 2009
Swedbank
 
Euro Area & Global Economy - Getting its Mojo Back
Euro Area & Global Economy - Getting its Mojo BackEuro Area & Global Economy - Getting its Mojo Back
Euro Area & Global Economy - Getting its Mojo Back
Amir Khan
 
Coface PANORAMA Francia Septiembre 2016
Coface PANORAMA Francia Septiembre 2016Coface PANORAMA Francia Septiembre 2016
Coface PANORAMA Francia Septiembre 2016
Jaime Cubillo Fleming
 
Fasanara capital | Investment Outlook: October 26th 2012
Fasanara capital | Investment Outlook: October 26th 2012Fasanara capital | Investment Outlook: October 26th 2012
Fasanara capital | Investment Outlook: October 26th 2012Fasanara Capital ltd
 
To the Point, 2010 January
To the Point, 2010 JanuaryTo the Point, 2010 January
To the Point, 2010 January
Swedbank
 
Fasanara Capital Bi-Weekly Notes - July 13th 2012
Fasanara Capital Bi-Weekly Notes - July 13th 2012Fasanara Capital Bi-Weekly Notes - July 13th 2012
Fasanara Capital Bi-Weekly Notes - July 13th 2012Fasanara Capital ltd
 
Global Powers of Retailing 2013
Global Powers of Retailing 2013Global Powers of Retailing 2013
Global Powers of Retailing 2013
Melih ÖZCANLI
 
Global economy-watch-april-2015
Global economy-watch-april-2015Global economy-watch-april-2015
Global economy-watch-april-2015
PwC España
 

Similar to 2014.10 ethenea-market-commentary-ethna-aktiv-e (20)

Ecb update tltro and qe
Ecb update tltro and qeEcb update tltro and qe
Ecb update tltro and qe
 
Fasanara Capital | Investment Outlook | November 16th 2012
Fasanara Capital | Investment Outlook | November 16th 2012Fasanara Capital | Investment Outlook | November 16th 2012
Fasanara Capital | Investment Outlook | November 16th 2012
 
Swedbank's Global Economic Outlook, 2010 March 18
Swedbank's Global Economic Outlook, 2010 March 18Swedbank's Global Economic Outlook, 2010 March 18
Swedbank's Global Economic Outlook, 2010 March 18
 
Eurozone May 2011: Focus on slowing growth ahead not lagging inflation
Eurozone May 2011: Focus on slowing growth ahead not lagging inflationEurozone May 2011: Focus on slowing growth ahead not lagging inflation
Eurozone May 2011: Focus on slowing growth ahead not lagging inflation
 
Future of Europe (IBR 2015)
Future of Europe (IBR 2015)Future of Europe (IBR 2015)
Future of Europe (IBR 2015)
 
The future of Europe (IBR 2015)
The future of Europe (IBR 2015)The future of Europe (IBR 2015)
The future of Europe (IBR 2015)
 
Where Next For The World Economy
Where Next For The World EconomyWhere Next For The World Economy
Where Next For The World Economy
 
The Global Economy No. 4 - May 16, 2012
The Global Economy No. 4 -  May 16, 2012The Global Economy No. 4 -  May 16, 2012
The Global Economy No. 4 - May 16, 2012
 
2009. Jürgen Pfister. The global and European environment for CEE economies. ...
2009. Jürgen Pfister. The global and European environment for CEE economies. ...2009. Jürgen Pfister. The global and European environment for CEE economies. ...
2009. Jürgen Pfister. The global and European environment for CEE economies. ...
 
German rebalancing: Waiting for GODOT? *Another Must Read
German rebalancing: Waiting for GODOT? *Another Must ReadGerman rebalancing: Waiting for GODOT? *Another Must Read
German rebalancing: Waiting for GODOT? *Another Must Read
 
PwC Global Economy Watch (oct. 2013)
PwC Global Economy Watch (oct. 2013)PwC Global Economy Watch (oct. 2013)
PwC Global Economy Watch (oct. 2013)
 
To the Point, October 27 2009
To the Point, October 27 2009To the Point, October 27 2009
To the Point, October 27 2009
 
Euro Area & Global Economy - Getting its Mojo Back
Euro Area & Global Economy - Getting its Mojo BackEuro Area & Global Economy - Getting its Mojo Back
Euro Area & Global Economy - Getting its Mojo Back
 
The future of Europe (IBR 2014)
The future of Europe (IBR 2014)The future of Europe (IBR 2014)
The future of Europe (IBR 2014)
 
Coface PANORAMA Francia Septiembre 2016
Coface PANORAMA Francia Septiembre 2016Coface PANORAMA Francia Septiembre 2016
Coface PANORAMA Francia Septiembre 2016
 
Fasanara capital | Investment Outlook: October 26th 2012
Fasanara capital | Investment Outlook: October 26th 2012Fasanara capital | Investment Outlook: October 26th 2012
Fasanara capital | Investment Outlook: October 26th 2012
 
To the Point, 2010 January
To the Point, 2010 JanuaryTo the Point, 2010 January
To the Point, 2010 January
 
Fasanara Capital Bi-Weekly Notes - July 13th 2012
Fasanara Capital Bi-Weekly Notes - July 13th 2012Fasanara Capital Bi-Weekly Notes - July 13th 2012
Fasanara Capital Bi-Weekly Notes - July 13th 2012
 
Global Powers of Retailing 2013
Global Powers of Retailing 2013Global Powers of Retailing 2013
Global Powers of Retailing 2013
 
Global economy-watch-april-2015
Global economy-watch-april-2015Global economy-watch-april-2015
Global economy-watch-april-2015
 

More from Frank Ragol

Tulip a eur_en
Tulip a eur_enTulip a eur_en
Tulip a eur_en
Frank Ragol
 
Oei feb-16
Oei feb-16Oei feb-16
Oei feb-16
Frank Ragol
 
Q1 2016-credit third avenue
Q1 2016-credit third avenueQ1 2016-credit third avenue
Q1 2016-credit third avenue
Frank Ragol
 
Oei dec-15
Oei dec-15Oei dec-15
Oei dec-15
Frank Ragol
 
Oei dec-15
Oei dec-15Oei dec-15
Oei dec-15
Frank Ragol
 
Swan aug-15
Swan aug-15Swan aug-15
Swan aug-15
Frank Ragol
 
Gdc FI-mayo-2015
Gdc FI-mayo-2015Gdc FI-mayo-2015
Gdc FI-mayo-2015
Frank Ragol
 
Oei apr-15
Oei apr-15Oei apr-15
Oei apr-15
Frank Ragol
 
30638 tl bill gross investment outlook may 2015-exp 5.30.16_3
30638 tl bill gross investment outlook may 2015-exp 5.30.16_330638 tl bill gross investment outlook may 2015-exp 5.30.16_3
30638 tl bill gross investment outlook may 2015-exp 5.30.16_3
Frank Ragol
 
Resultados consolidados banca en españa a 30 septiembre
Resultados consolidados banca en españa a 30 septiembreResultados consolidados banca en españa a 30 septiembre
Resultados consolidados banca en españa a 30 septiembre
Frank Ragol
 
Bass cognitive dissonance
Bass cognitive dissonanceBass cognitive dissonance
Bass cognitive dissonance
Frank Ragol
 
Greif inc (spruce point capital)
Greif inc (spruce point capital)Greif inc (spruce point capital)
Greif inc (spruce point capital)
Frank Ragol
 
Third point-q4-2014-investor-letter-tpoi
Third point-q4-2014-investor-letter-tpoiThird point-q4-2014-investor-letter-tpoi
Third point-q4-2014-investor-letter-tpoi
Frank Ragol
 
Oei 2014-12
Oei 2014-12Oei 2014-12
Oei 2014-12
Frank Ragol
 
Skagen global noviembre 14
Skagen global noviembre 14Skagen global noviembre 14
Skagen global noviembre 14
Frank Ragol
 
Lessons of oil by howard marks
Lessons of oil by howard marksLessons of oil by howard marks
Lessons of oil by howard marks
Frank Ragol
 
Odey absolute return octubre 2014
Odey absolute return octubre 2014Odey absolute return octubre 2014
Odey absolute return octubre 2014
Frank Ragol
 
Odey absolute return octubre 2014
Odey absolute return octubre 2014Odey absolute return octubre 2014
Odey absolute return octubre 2014
Frank Ragol
 
Gmo qtly letter_3q14_full
Gmo qtly letter_3q14_fullGmo qtly letter_3q14_full
Gmo qtly letter_3q14_full
Frank Ragol
 
Estadistica anual definitiva 2013
Estadistica anual definitiva 2013Estadistica anual definitiva 2013
Estadistica anual definitiva 2013
Frank Ragol
 

More from Frank Ragol (20)

Tulip a eur_en
Tulip a eur_enTulip a eur_en
Tulip a eur_en
 
Oei feb-16
Oei feb-16Oei feb-16
Oei feb-16
 
Q1 2016-credit third avenue
Q1 2016-credit third avenueQ1 2016-credit third avenue
Q1 2016-credit third avenue
 
Oei dec-15
Oei dec-15Oei dec-15
Oei dec-15
 
Oei dec-15
Oei dec-15Oei dec-15
Oei dec-15
 
Swan aug-15
Swan aug-15Swan aug-15
Swan aug-15
 
Gdc FI-mayo-2015
Gdc FI-mayo-2015Gdc FI-mayo-2015
Gdc FI-mayo-2015
 
Oei apr-15
Oei apr-15Oei apr-15
Oei apr-15
 
30638 tl bill gross investment outlook may 2015-exp 5.30.16_3
30638 tl bill gross investment outlook may 2015-exp 5.30.16_330638 tl bill gross investment outlook may 2015-exp 5.30.16_3
30638 tl bill gross investment outlook may 2015-exp 5.30.16_3
 
Resultados consolidados banca en españa a 30 septiembre
Resultados consolidados banca en españa a 30 septiembreResultados consolidados banca en españa a 30 septiembre
Resultados consolidados banca en españa a 30 septiembre
 
Bass cognitive dissonance
Bass cognitive dissonanceBass cognitive dissonance
Bass cognitive dissonance
 
Greif inc (spruce point capital)
Greif inc (spruce point capital)Greif inc (spruce point capital)
Greif inc (spruce point capital)
 
Third point-q4-2014-investor-letter-tpoi
Third point-q4-2014-investor-letter-tpoiThird point-q4-2014-investor-letter-tpoi
Third point-q4-2014-investor-letter-tpoi
 
Oei 2014-12
Oei 2014-12Oei 2014-12
Oei 2014-12
 
Skagen global noviembre 14
Skagen global noviembre 14Skagen global noviembre 14
Skagen global noviembre 14
 
Lessons of oil by howard marks
Lessons of oil by howard marksLessons of oil by howard marks
Lessons of oil by howard marks
 
Odey absolute return octubre 2014
Odey absolute return octubre 2014Odey absolute return octubre 2014
Odey absolute return octubre 2014
 
Odey absolute return octubre 2014
Odey absolute return octubre 2014Odey absolute return octubre 2014
Odey absolute return octubre 2014
 
Gmo qtly letter_3q14_full
Gmo qtly letter_3q14_fullGmo qtly letter_3q14_full
Gmo qtly letter_3q14_full
 
Estadistica anual definitiva 2013
Estadistica anual definitiva 2013Estadistica anual definitiva 2013
Estadistica anual definitiva 2013
 

Recently uploaded

how can I sell/buy bulk pi coins securely
how can I sell/buy bulk pi coins securelyhow can I sell/buy bulk pi coins securely
how can I sell/buy bulk pi coins securely
DOT TECH
 
Which Crypto to Buy Today for Short-Term in May-June 2024.pdf
Which Crypto to Buy Today for Short-Term in May-June 2024.pdfWhich Crypto to Buy Today for Short-Term in May-June 2024.pdf
Which Crypto to Buy Today for Short-Term in May-June 2024.pdf
Kezex (KZX)
 
The Evolution of Non-Banking Financial Companies (NBFCs) in India: Challenges...
The Evolution of Non-Banking Financial Companies (NBFCs) in India: Challenges...The Evolution of Non-Banking Financial Companies (NBFCs) in India: Challenges...
The Evolution of Non-Banking Financial Companies (NBFCs) in India: Challenges...
beulahfernandes8
 
how can I sell pi coins after successfully completing KYC
how can I sell pi coins after successfully completing KYChow can I sell pi coins after successfully completing KYC
how can I sell pi coins after successfully completing KYC
DOT TECH
 
Exploring Abhay Bhutada’s Views After Poonawalla Fincorp’s Collaboration With...
Exploring Abhay Bhutada’s Views After Poonawalla Fincorp’s Collaboration With...Exploring Abhay Bhutada’s Views After Poonawalla Fincorp’s Collaboration With...
Exploring Abhay Bhutada’s Views After Poonawalla Fincorp’s Collaboration With...
beulahfernandes8
 
The new type of smart, sustainable entrepreneurship and the next day | Europe...
The new type of smart, sustainable entrepreneurship and the next day | Europe...The new type of smart, sustainable entrepreneurship and the next day | Europe...
The new type of smart, sustainable entrepreneurship and the next day | Europe...
Antonis Zairis
 
Intro_Economics_ GPresentation Week 4.pptx
Intro_Economics_ GPresentation Week 4.pptxIntro_Economics_ GPresentation Week 4.pptx
Intro_Economics_ GPresentation Week 4.pptx
shetivia
 
PF-Wagner's Theory of Public Expenditure.pptx
PF-Wagner's Theory of Public Expenditure.pptxPF-Wagner's Theory of Public Expenditure.pptx
PF-Wagner's Theory of Public Expenditure.pptx
GunjanSharma28848
 
what is the best method to sell pi coins in 2024
what is the best method to sell pi coins in 2024what is the best method to sell pi coins in 2024
what is the best method to sell pi coins in 2024
DOT TECH
 
USDA Loans in California: A Comprehensive Overview.pptx
USDA Loans in California: A Comprehensive Overview.pptxUSDA Loans in California: A Comprehensive Overview.pptx
USDA Loans in California: A Comprehensive Overview.pptx
marketing367770
 
Introduction to Indian Financial System ()
Introduction to Indian Financial System ()Introduction to Indian Financial System ()
Introduction to Indian Financial System ()
Avanish Goel
 
what is the future of Pi Network currency.
what is the future of Pi Network currency.what is the future of Pi Network currency.
what is the future of Pi Network currency.
DOT TECH
 
一比一原版BCU毕业证伯明翰城市大学毕业证成绩单如何办理
一比一原版BCU毕业证伯明翰城市大学毕业证成绩单如何办理一比一原版BCU毕业证伯明翰城市大学毕业证成绩单如何办理
一比一原版BCU毕业证伯明翰城市大学毕业证成绩单如何办理
ydubwyt
 
how to sell pi coins at high rate quickly.
how to sell pi coins at high rate quickly.how to sell pi coins at high rate quickly.
how to sell pi coins at high rate quickly.
DOT TECH
 
What website can I sell pi coins securely.
What website can I sell pi coins securely.What website can I sell pi coins securely.
What website can I sell pi coins securely.
DOT TECH
 
655264371-checkpoint-science-past-papers-april-2023.pdf
655264371-checkpoint-science-past-papers-april-2023.pdf655264371-checkpoint-science-past-papers-april-2023.pdf
655264371-checkpoint-science-past-papers-april-2023.pdf
morearsh02
 
US Economic Outlook - Being Decided - M Capital Group August 2021.pdf
US Economic Outlook - Being Decided - M Capital Group August 2021.pdfUS Economic Outlook - Being Decided - M Capital Group August 2021.pdf
US Economic Outlook - Being Decided - M Capital Group August 2021.pdf
pchutichetpong
 
how to sell pi coins on Bitmart crypto exchange
how to sell pi coins on Bitmart crypto exchangehow to sell pi coins on Bitmart crypto exchange
how to sell pi coins on Bitmart crypto exchange
DOT TECH
 
Introduction to Value Added Tax System.ppt
Introduction to Value Added Tax System.pptIntroduction to Value Added Tax System.ppt
Introduction to Value Added Tax System.ppt
VishnuVenugopal84
 
234Presentation on Indian Debt Market.ppt
234Presentation on Indian Debt Market.ppt234Presentation on Indian Debt Market.ppt
234Presentation on Indian Debt Market.ppt
PravinPatil144525
 

Recently uploaded (20)

how can I sell/buy bulk pi coins securely
how can I sell/buy bulk pi coins securelyhow can I sell/buy bulk pi coins securely
how can I sell/buy bulk pi coins securely
 
Which Crypto to Buy Today for Short-Term in May-June 2024.pdf
Which Crypto to Buy Today for Short-Term in May-June 2024.pdfWhich Crypto to Buy Today for Short-Term in May-June 2024.pdf
Which Crypto to Buy Today for Short-Term in May-June 2024.pdf
 
The Evolution of Non-Banking Financial Companies (NBFCs) in India: Challenges...
The Evolution of Non-Banking Financial Companies (NBFCs) in India: Challenges...The Evolution of Non-Banking Financial Companies (NBFCs) in India: Challenges...
The Evolution of Non-Banking Financial Companies (NBFCs) in India: Challenges...
 
how can I sell pi coins after successfully completing KYC
how can I sell pi coins after successfully completing KYChow can I sell pi coins after successfully completing KYC
how can I sell pi coins after successfully completing KYC
 
Exploring Abhay Bhutada’s Views After Poonawalla Fincorp’s Collaboration With...
Exploring Abhay Bhutada’s Views After Poonawalla Fincorp’s Collaboration With...Exploring Abhay Bhutada’s Views After Poonawalla Fincorp’s Collaboration With...
Exploring Abhay Bhutada’s Views After Poonawalla Fincorp’s Collaboration With...
 
The new type of smart, sustainable entrepreneurship and the next day | Europe...
The new type of smart, sustainable entrepreneurship and the next day | Europe...The new type of smart, sustainable entrepreneurship and the next day | Europe...
The new type of smart, sustainable entrepreneurship and the next day | Europe...
 
Intro_Economics_ GPresentation Week 4.pptx
Intro_Economics_ GPresentation Week 4.pptxIntro_Economics_ GPresentation Week 4.pptx
Intro_Economics_ GPresentation Week 4.pptx
 
PF-Wagner's Theory of Public Expenditure.pptx
PF-Wagner's Theory of Public Expenditure.pptxPF-Wagner's Theory of Public Expenditure.pptx
PF-Wagner's Theory of Public Expenditure.pptx
 
what is the best method to sell pi coins in 2024
what is the best method to sell pi coins in 2024what is the best method to sell pi coins in 2024
what is the best method to sell pi coins in 2024
 
USDA Loans in California: A Comprehensive Overview.pptx
USDA Loans in California: A Comprehensive Overview.pptxUSDA Loans in California: A Comprehensive Overview.pptx
USDA Loans in California: A Comprehensive Overview.pptx
 
Introduction to Indian Financial System ()
Introduction to Indian Financial System ()Introduction to Indian Financial System ()
Introduction to Indian Financial System ()
 
what is the future of Pi Network currency.
what is the future of Pi Network currency.what is the future of Pi Network currency.
what is the future of Pi Network currency.
 
一比一原版BCU毕业证伯明翰城市大学毕业证成绩单如何办理
一比一原版BCU毕业证伯明翰城市大学毕业证成绩单如何办理一比一原版BCU毕业证伯明翰城市大学毕业证成绩单如何办理
一比一原版BCU毕业证伯明翰城市大学毕业证成绩单如何办理
 
how to sell pi coins at high rate quickly.
how to sell pi coins at high rate quickly.how to sell pi coins at high rate quickly.
how to sell pi coins at high rate quickly.
 
What website can I sell pi coins securely.
What website can I sell pi coins securely.What website can I sell pi coins securely.
What website can I sell pi coins securely.
 
655264371-checkpoint-science-past-papers-april-2023.pdf
655264371-checkpoint-science-past-papers-april-2023.pdf655264371-checkpoint-science-past-papers-april-2023.pdf
655264371-checkpoint-science-past-papers-april-2023.pdf
 
US Economic Outlook - Being Decided - M Capital Group August 2021.pdf
US Economic Outlook - Being Decided - M Capital Group August 2021.pdfUS Economic Outlook - Being Decided - M Capital Group August 2021.pdf
US Economic Outlook - Being Decided - M Capital Group August 2021.pdf
 
how to sell pi coins on Bitmart crypto exchange
how to sell pi coins on Bitmart crypto exchangehow to sell pi coins on Bitmart crypto exchange
how to sell pi coins on Bitmart crypto exchange
 
Introduction to Value Added Tax System.ppt
Introduction to Value Added Tax System.pptIntroduction to Value Added Tax System.ppt
Introduction to Value Added Tax System.ppt
 
234Presentation on Indian Debt Market.ppt
234Presentation on Indian Debt Market.ppt234Presentation on Indian Debt Market.ppt
234Presentation on Indian Debt Market.ppt
 

2014.10 ethenea-market-commentary-ethna-aktiv-e

  • 1. info@ethenea.com www.ethenea.com MARKET COMMENTARY No. 10 / October 2014 This Market Commentary focuses on a slightly different topic than usual, because this time we look at the long-term situ-ation in the markets rather than the current one. We usually take a look at the economic data and compare them with our expectations and those of the market. This task is performed by the surprise indicators (Graph 1), at least for the market. While the markets are increasingly disappointed by the figures from the Eurozone, data from the US is better than expected (although to a steadily lesser degree). This largely coincides with our own assessment of the situation on both sides of the pond. Europe is struggling, probably in vain, against a renewed recession. However, since even supposedly strong economies like Germany are beginning to weaken, the likelihood of a turnaround in European growth has to be considered fairly remote. The picture in the US, though, is very different (for now). The economic data continue to surprise positively, especially labour market data, which play an important role in the interest rate policy of the US central bank. Interpreting the US labour market data is a science in itself, as we have frequently reported in the past. This seems to be the only reason why the Fed (Federal Reserve) is continuing its loose monetary policy. After all, it’s not as simple as a first look at the data would suggest. All in all, the markets are performing as we predicted in past commentaries: Eurozone yields continue to fall, US yields are largely stable and are not rising significantly. The equity mar-kets seem to be disappointing, but only at first sight – when you consider that the global economic data actually point towards a weakening, which is not exactly a point in favour of corporate earnings growth. In this environment equities remain quite stable, which is undoubtedly due to the presumed lack of alternatives to equity investments. We therefore concern ourselves less with the current market, and instead take a long view of the markets before exploring the subject of dividends in greater detail in the equities part of this Market Commentary. The worst is yet to come. Definitely. Many European countries are well above the 60 percent debt limit. Another negative development could lead to market instability. Will countries manage to reduce their debt in the future?
  • 2. No. 10 / October 2014 2 ETHENEA | Market Commentary Graphs 3 to 11 show a very simple projection of future public debt in relation to gross domestic product (GDP). Although we may be oversimplifying here, we think this provides signifi-cant insights. In making these projections, we first of all assume that government budgets are balanced. A closer look at the prima-ry balances (Graph 2) nevertheless reveals that budgets are anything but balanced even before debt servicing, with the almost glorious exceptions of Germany and Italy. However, the picture changes significantly when interest payments are added. For Italy, this results in a budget deficit of 3 % of the country’s GDP. As stated, we nevertheless try to be optimistic about the future and take the satisfying gift of balanced budgets as a given. Moreover, we look at three scenarios: The main scenario in-volves the continuation of the status quo, designated as ceteris -100 -80 -60 -40 -20 0 20 40 60 80 100 10 11 12 13 14 Economic Surprise Index Eurozone USA Graph 1: Surprise indicators USA and Eurozone Source: Bloomberg, ETHENEA, Citibank -12 -10 -8 -6 -4 -2 0 2 4 6 98 99 00 01 02 03 04 05 06 07 08 09 10 11 12 13 Government Primary Balance as % of GDP Germany France Greece Spain Portugal Italy USA Graph 2: Primary balances of selected countries Source: OECD, ETHENEA paribus in the graphs. In the charts, we keep the currently observed GDP growth rate and the real interest rate on debt (10-year nominal interest rate minus the annual consumer price inflation rate) constant. This scenario is seen in the charts as a red line. Another variant of the projection involves an increase in the real interest rate by 1 % (blue line). In the last scenario, we used the data of the supposed model pupil Germany for the projection, i.e. German real interest rates and GDP growth rates (green line). The projections for Germany, the USA and Switzerland allow the viewer to look calmly to the future. Even ceteris paribus Germany will reach the 60 % Maastricht limit again in 23 years. If the European Central Bank (ECB) succeeds with its policy of increasing inflation while simultaneously maintaining low nominal interest rates, this 60 % level could even be reached earlier. The USA and Switzerland, where the situation is com-parable, also seem likely to avoid debt problems. 0 10 20 30 40 50 60 70 80 90 Debt/GDP past ceteris paribus real yield -0.86 real yield 1.14 Germany Starting level 78.40 Real Annual Growth 1.2 10yr 0.944 CPI 0.8 Graph 3: Projection Germany Source: Bloomberg, ETHENEA 0 10 20 30 40 50 60 70 80 Debt/GDP past ceteris paribus German status quo real rate 1.80 USA Starting level 71.80 Real Annual Growth 2.6 10yr 2.5 CPI 1.7 Graph 4: Projection USA Source: Bloomberg, ETHENEA
  • 3. No. 10 / October 2014 3 ETHENEA | Market Commentary 0 100 200 300 400 500 600 Debt/GDP past ceteris paribus German status quo real rate 3.40 Italy Starting level 132.60 Real Annual Growth - 0.2 10yr 2.3 CPI - 0.1 Graph 6: Projection Italy Source: Bloomberg, ETHENEA 0 10 20 30 40 50 60 70 Debt/GDP past ceteris paribus German status quo real rate 1.35 Switzerland Starting level 33.80 Real Annual Growth 1.4 10yr 0.45 CPI 0.1 Graph 5: Projection Switzerland Source: Bloomberg, ETHENEA 0 50 100 150 200 250 Debt/GDP past ceteris paribus German status quo Starting level 93.90 Re al Annual Growth 1.2 10yr 2.08 CPI - 0.2 Spain real rate 3.28 Graph 7: Projection Spain Source: Bloomberg, ETHENEA 0 20 40 60 80 100 120 140 160 180 200 Debt/GDP past ceteris paribus German status quo real rate 1.88 France Starting level 93.50 Real Annual Growth 0.1 10yr 1.28 CPI 0.4 Graph 9: Projection France Source: Bloomberg, ETHENEA 0 100 200 300 400 500 600 Debt/GDP past ceteris paribus German status quo real rate 4.46 Portugal Starting level 129.00 Real Annual Growth 0.9 10yr 3.06 CPI -0.4 Graph 8: Projection Portugal Source: Bloomberg, ETHENEA 0 20 40 60 80 100 120 140 Debt/GDP past ceteris paribus German status quo real rate 2.21 Ireland Starting level 123.70 Real Annual Growth 7.7 10yr 1.61 CPI 0.4 Graph 10: Projection Ireland Source: Bloomberg, ETHENEA
  • 4. No. 10 / October 2014 4 ETHENEA | Market Commentary The picture for the countries that triggered the euro debt crisis looks a bit different, however: Ireland is recovering and its upgraded credit rating appears to be justified. Despite its high debt level of 123 %, Ireland will be able to grow out of its debt and reach the 60 % threshold in just 13 years. The picture is less rosy for Spain, Portugal and Italy. Of these three candidates, Spain appears to be the country most likely to be in a position to save itself. Slightly more growth and slightly lower real interest rates at the current German level would put the 60 % threshold in sight in 40 years. Italy and Portugal, on the other hand, will have a debt ratio of over 200 % of GDP in fewer than 15 years if they maintain their current course. France, a formerly stable, core European country, is now weakening. Even our calculation’s assumption of a balanced budget seems extremely hypothetical given the current level of -4.3 %. A continuation of the current rate would also lead to an increase in debt to levels that would be difficult to correct. If France could commit itself to taking on a bit more of Schröder’s Agenda 2010 in order to increase its competitiveness, France might lose some of its charm, but at least it would be in a position to reduce its debt. Future generations in France would certainly prefer that to having to pay the excessive debts of their grandparents. Finally, we should turn to Greece. Despite (partial) debt restructuring in 2012 the country has never been in a worse position. Even in the unlikely event (or under the heroic assumption) that Greece could reduce its budget deficit from -14.3 % to zero, the debt level would be at over 200 % in three years and over 300 % in nine years. Given the generally miserable debt situation, even the greatest optimists are likely to doubt the long-term stability of several European countries. Only the credibility of the ECB has thus far prevented a renewed flare-up of the euro debt crisis. We would do well not to simply accept the current situation as it is. On the contrary, these countries (see above) should do their utmost to make structural reforms on their own, because the risk of a loss of market confidence is very real. If this happened, debt restructuring would be inevitable in the form of a sover-eign default, with the consequent loss of assets by residents of the countries. At this point, PR agencies are needed to sell these undeniably necessary but unpopular measures to voters. So far these reforms have been thwarted by populist (and often rightwing) parties. There is an urgent need for education in this area. There is not a lot of time, but there may be enough. Other-wise the worst is yet to come, in the form of unsustainable instability caused by the huge debts of the countries involved. Definitely. 0 500 1000 1500 2000 2500 3000 3500 4000 Debt/GDP past ceteris paribus German status quo real rate 7.51 Greece Starting level 175.10 Real Annual Growth - 0.3 10yr 6.21 CPI - 0.3 Graph 11: Projection Greece Source: Bloomberg, ETHENEA
  • 5. No. 10 / October 2014 5 ETHENEA | Market Commentary 0 2 4 6 8 10 12 14 16 18 20 84 86 88 90 92 94 96 98 00 02 04 06 08 10 12 Index European Equities, Price Index European Equities, Total Return Index Graph 12: Price index and total return index Source: Bloomberg, ETHENEA 0 1 2 3 4 5 6 11 12 13 14 in % Stoxx 600 Dividend Yield 10 Year German Government Bond Yield Graph 13: Dividend yield in comparison with Bund yield Source: Bloomberg, ETHENEA – the highest level in the last 15 years. With the banking system continuing to stabilise, we think that companies will reduce these liquid assets and dividends are an excellent way to do so. • No investment opportunities: Due to weak economic growth, organic growth opportunities in Europe are limited. Investment in new machinery and buildings only makes sense if an economic upturn is expected in the next few months. But we are far from such a scenario, as the falling leading indicators of recent weeks show. • Pressure on the part of investors: Investors are increasing the pressure on companies to return unneeded cash to shareholders instead of investing in expensive acquisitions. Unfortunately, history has shown that, by the end of a stock market cycle, expensive acquisitions only rarely make a positive contribution to the acquiring company’s value. • Volatility at a low level: Volatility in equity markets has declined significantly in recent months, which makes divi-dend stocks all the more attractive compared with bonds. For example, the volatility of European stocks has fallen to 17, compared with an average of around 25 for the last five years. The volatility levels of equities and bonds continue to converge. Dividend stocks appear even more attractive if we assume that interest rates in Europe will remain at their low level for some time to come. Does this mean we should buy any stock with a high dividend yield? At first glance, this question can be answered with a clear yes. Dividend yields of more than 6 % in telecommunications or 5.7 % in the oil sector seem attractive, as Graph 14 shows. However, we urge caution: As so often in the capital markets, the truth is slightly more complicated. Now, as promised, some brief comments concerning the equity markets. If dividends are good, is everything really fine? The fourth quarter is already here; the year is drawing to a close. Since it is well known that cash is king and the bond market is currently offering little in the way of interest payments, we take a look at corporate dividend payments in 2015. We assume that European companies will be paying out more than EUR 300 billion to investors next year. Dividend payments are pushing indices up – if dividends are good, everything is fine is not only an old well-known stock market wisdom, but also hits the nail right on the head. Since 1985, reinvested dividends have been responsible for over 60 % of shareholder profits (difference between price index and total return index, Graph 12). The rest comes from earnings growth and expansion of the P/E (price-earnings ratio). The central banks have wiped out interest. In the low interest rate environment caused by the central banks, dividends have become even more attractive and for many investors have taken the place of the interest payments made by bond markets in previous years. While the expected dividend yield on the Stoxx 600 is still 3.5 % for 2014, interest rates on 10-year German government bonds have fallen below 1 % at times (Graph 13). For the following reasons, we are convinced that distributions to shareholders will continue to grow steadily in the coming years: • High cash balances: Since the financial crisis, massive cash balances have been built up again and the liquidity for increased distributions is available. At the end of 2013, European companies held over 10 % of their assets in cash
  • 6. No. 10 / October 2014 6 ETHENEA | Market Commentary Attractive yields of over 5 % are not always covered by the expected earnings. The telecoms sector is already distributing higher dividends than it is generating in income. In addi-tion, telecoms and utilities companies have to make heavy investments, which could bring the generous dividends under pressure. Investments in the oil and gas sector have been reduced, providing a firm footing for dividends; however, a sharp drop in the price of oil could put a spanner in the works for investors. On the other hand, insurers are distributing less than 50 % of their profits, although the dividend yield is still over 5.5 %. Also worth bearing in mind when it comes to dividend stocks: Look before you leap. 5.0% 5.2% 5.4% 5.6% 5.8% 6.0% 6.2% 0% 20% 40% 60% 80% 100% 120% Telecoms Oil & Gas Utilities Insurance Payout ratio 2015e, LHS Dividend yield 2015e, RHS Graph 14: Distribution ratios and dividend yields Source: Barclays
  • 7. No. 10 / October 2014 7 ETHENEA | Market Commentary Positioning of the Ethna-AKTIV E With no further deterioration in the geopolitical situation, we used the higher market volatility to expand our equity exposure by just under 9 % to 28.4 % at month-end. The markets should receive particular support from further easing steps by the ECB based on current macroeconomic data. At sector level we therefore focused on the banking sector, as it should be the biggest beneficiary of additional measures. We also increased positions in the telecommunications sector. Further consolida-tion and takeover rumours will have a supportive effect on prices, particularly in the USA. Weak global demand and fur-ther growth in US production put the oil price under pressure last month. Consequently, we further reduced exposure in the oil sector. The stable pharmaceutical sector remains a core investment and was further expanded. We like the sector’s combination of solid business models, relatively attractive valuations and potential for further acquisitions. The continued increase in policy divergence between the Fed and the ECB confirms our opinion regarding a further appre-ciation of the USD against the EUR. Therefore, we have not changed our exposure, although the corresponding gains in-creased the weighting to 25.1 % at month-end. In order not to increase the impact of currency volatility on the overall port-folio, we further reduced the AUD portfolio and realised gains on the foreign exchange and bond side. The average rating of the fund remained unchanged between A and A+, while the bond weighting was reduced by 2.5 % month-on-month. In particular, non-investment-grade secu-rities were closed at a profit in order to keep the overall vola-tility low at a higher equity exposure. We used Treasury futures to reduce the modified duration slightly to 4.12 at month-end. However, this was only for tactical reasons – we are maintaining our macro picture and expect interest rates to remain low for an extended period both in Europe and in the USA. 30.5 0.6 4.1 10.3 12.4 2.3 29.6 0.0 9.6 0.7 AAA AA A BBB NON IG Not rated Equities Tactical reserve* Cash Others % of Total NAV Ethna-AKTIV E Source: ETHENEA Graph 15: Breakdown of the Ethna-AKTIV E portfolio by issuer rating Ethna-AKTIV E % of Total NAV 30.5 0.6 4.1 10.3 AAA AA A BBB NON IG Not rated Equities Tactical reserve* Cash Others % of Total NAV Ethna-AKTIV E * for potential direct investments and derivatives in equities 69.7 0.1 1.0 25.1 0.0 3.6 0.4 42.1 5.3 1.0 44.5 3.1 3.6 0.4 EUR CHF AUD USD GBP NOK SEK Net Gross Source: ETHENEA Ethna-AKTIV E % of Total NAV Graph 16: Breakdown of the Ethna-AKTIV E portfolio by currency
  • 8. No. 10 / October 2014 8 ETHENEA | Market Commentary Graph 17: Development of the various market trends, compared with the previous month and the current year Currency TW € € $ € CHF € £ € JPY € AUD € NOK € CAD € TRY € CNH Last 92.81 1.2676 1.20807 0.78503 137.2 1.44081 8.1671 1.4131 2.8801 7.807 -1m -1.3 % -3.6 % 0.2 % -1.0 % 0.3 % 2.4 % 0.3 % -1.0 % 1.5 % -3.4 % ytd -5.0 % -8.1 % -1.4 % -5.7 % -5.5 % -6.7 % -2.3 % -3.6 % -2.9 % -6.5 % German Gvmt ITRAXX 5y 2y 5y 10y 10/2y Europe Xover SenFin SubFin Last -0.072 0.145 0.902 97 65 263 64 93 -1m -4 -3 1 5 5 22 3 10 ytd -29 -78 -103 -74 -5 -23 -23 -35 Equities DAX Dow EuroStx CAC40 FTSE Nikkei Shanghai Last 9,195.68 16,801.05 3,106.42 4,242.67 6,446.39 15,661.99 2,363.87 -1m -2.9 % -1.7 % -2.1 % -3.2 % -5.5 % 1.5 % 6.6 % ytd -3.7 % 1.4 % -0.1 % -1.2 % -4.5 % -3.9 % 11.7 % DAX P/E Dow P/E EuroStx P/E CAC40 P/E FTSE P/E Nikkei P/E Shanghai P/E Last 12.8 14.7 14.1 14.6 13.3 17.5 9.4 -1m -4.5 % -2.7 % -2.1 % -3.5 % -5.9 % 1.0 % 6.7 % ytd -9.2 % -5.5 % -3.3 % -6.6 % -5.3 % -17.0 % 1.4 % Graph 18: Figures of the Ethna-AKTIV E at the end of the month Date Fund Yield p. a. Rating is between Mod. Duration Current yield p. a. Mod. Duration - bonds only- 30/09/2014 Ethna-AKTIV E 3.09 % A A+ 4.12 3.36 % 4.84 Yield pick-up to German 10y Gvmt USA UK Japan France Austria Holland Italy Spain Portugal Greece Ireland Last 152 142 -38 35 21 14 142 121 217 557 73 -1m 145 148 -39 36 24 17 155 134 233 493 89 ytd 110 109 -119 63 34 31 220 222 420 649 158
  • 9. No. 10 / October 2014 9 ETHENEA | Market Commentary 34.3 20.7 6.0 5.5 4.8 3.6 2.9 2.1 2.1 1.8 0.8 0.7 0.6 3.9 0 5 10 15 20 25 30 35 Graph 19: Breakdown of the Ethna-AKTIV E portfolio by origin Source: ETHENEA Ethna-AKTIV E % of Total NAV * Including 12 other countries Bonds Equities 26.7 6.8 6.4 6.0 4.9 4.8 4.2 3.5 3.2 3.0 2.6 2.3 1.7 1.5 1.1 1.1 1.0 1.0 0.9 0.9 0.8 0.8 0.6 0.6 0.5 2.8 0 5 10 15 20 25 Graph 20: Breakdown of the Ethna-AKTIV E portfolio by issuer sector Source: ETHENEA Ethna-AKTIV E % of Total NAV * Including 12 other sectors Bonds Equities
  • 10. info@ethenea.com www.ethenea.com NB: An investment in investment funds, as with all securities and comparable financial assets, carries the risk of capital or currency losses. Consequently, the unit price and the yield are variable and cannot be guaranteed. The costs of a fund investment have an effect on the actual profit. No guarantee can be given that the investment objectives will be achieved. The statutory sales documents form the sole legal basis for a purchase of units. All information published here constitutes a product description only. It does not constitute investment advice, an offer to enter into an agreement for the provision of advice or information or a solicitation of an offer to buy or sell securities. Contents have been carefully researched, compiled and checked. No guarantee can be given for correctness, completeness or accuracy. Munsbach, 30/09/2014. Portfolio Management: Guido Barthels (author) Luca Pesarini Arnoldo Valsangiacomo Please do not hesitate to contact us if you have any questions or suggestions. ETHENEA Independent Investors S.A. 9a, Rue Gabriel Lippmann · 5365 Munsbach · Luxembourg Phone +352 276 921 10 · Fax +352 276 921 99 info@ethenea.com · www.ethenea.com