
Download as PDF, PPTX
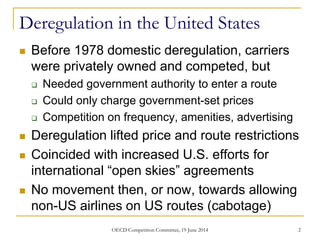
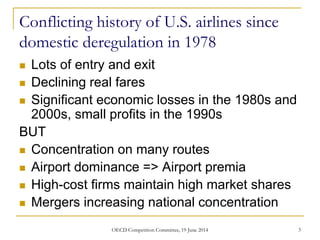
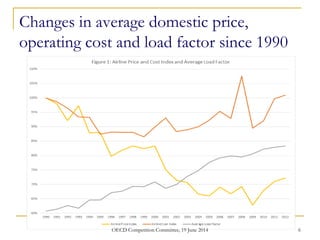
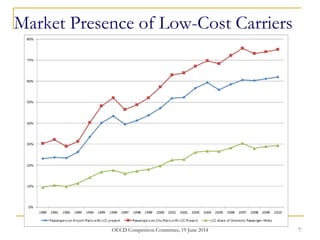
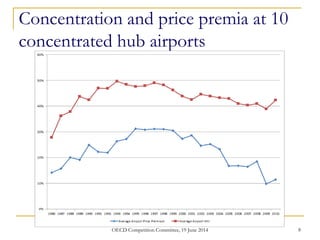
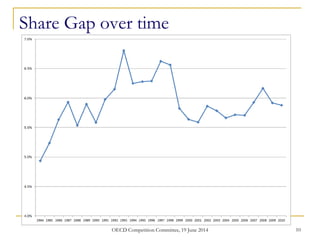
This document summarizes the history of airline deregulation and market power in the United States. It discusses how deregulation in 1978 lifted price and route restrictions, leading to entry and exit of carriers but also concentration on some routes. While real fares declined, network carriers maintained high market shares and mergers have increased concentration. Recent trends include expansion of low-cost carriers, steadily increasing aircraft load factors, and use of hub-and-spoke networks. Airport dominance and airline loyalty programs, as measured by the "share gap", remain strongly associated with higher prices, business travel, and dominated airports.


