1. Journal of Transport Geography 24 (2012) 223–233
Contents lists available at SciVerse ScienceDirect
Journal of Transport Geography
journal homepage: www.elsevier.com/locate/jtrangeo
Competition in the European aviation market: the entry of low-cost airlines
Marco Alderighi a,b, Alessandro Cento c, Peter Nijkamp d,⇑, Piet Rietveld d
a
Department of Economics and Political Science, Università della Valle d’Aosta, Strada Cappuccini, 2A, 11100 Aosta, Italy
CERTeT, Bocconi University, via Roentgen 1, 20136 Milan, Italy
c
Air France KLM, Modigliani 45, 20090 Segrate, Italy
d
Faculty of Economics, Vrije Universiteit, De Boelelaan 1105, 1081 HV Amsterdam, The Netherlands
b
a r t i c l e
i n f o
Keywords:
Pricing strategies
Yield management
Low-cost carriers
European airline market
a b s t r a c t
This paper investigates the price-setting behavior of full-service airlines in the European passenger aviation market. We develop a model of airline competition, which accommodates various market structures, some of which include low-cost players. Using data on published airfares of Lufthansa, British
Airways, Alitalia and KLM for the main city-pairs from Italy to the rest of Europe, our empirical findings
substantially confirm the propositions of the theoretical model. We find that competition among full-service carriers appears to affect the price levels of the business and the leisure segments asymmetrically:
there are small reductions in the leisure segments and significant reductions in the business segment of
the aviation market. In contrast, competition with low-cost carriers reduces both the business and leisure
fares of full-service carriers quite uniformly, with an emphasis on the mid-segment fares.
Ó 2012 Elsevier Ltd. All rights reserved.
1. Introduction
In recent years, the European aviation sector has gone through
drastic change on both the supply and the demand side. In contrast
to many other industries, the driving forces governing these
changes do not depend mainly on technological factors, but on
developments in the legal, institutional, and cultural domains of
the aviation market. Legal and institutional aspects have clearly affected the structure of the market, while cultural forces have influenced leisure mobility over space and its characteristics.
On the supply side, only a few industries have faced changes as
deep as those that have occurred in the airline industry in the past
two decades. Over this time period, the industry has evolved from a
system of long-established state-owned carriers operating in a regulated market to a dynamic, unregulated industry. In fact, in the
mid-1980s, only one or two flag carriers operated on each European
route, with airfares being fixed by state bilateral agreements.
The European deregulation took place in different steps (Francis
et al., 2006; Goetz and Vowles, 2009). Three airline policy ‘packages’
were agreed in 1988, 1990 and 1993, and full deregulation came
into force in 1997. The Third Package (see, e.g. Starkie, 2002; Chang
and Williams, 2002) was the most important one, as, by then, pricing capacity and access were fully deregulated. Within the EU,
airlines can now operate between any two other member countries
via their home country (the ‘‘sixth freedom’’ of the Chicago Conven⇑ Corresponding author.
E-mail addresses: m.alderighi@univda.it (M. Alderighi), alessandro.cento@klm.
com (A. Cento), pnijkamp@feweb.vu.nl (P. Nijkamp), prietveld@feweb.vu.nl
(P. Rietveld).
0966-6923/$ - see front matter Ó 2012 Elsevier Ltd. All rights reserved.
http://dx.doi.org/10.1016/j.jtrangeo.2012.02.008
tion) and even operate domestic flights within other European
member countries (the ‘‘seventh freedom’’ or cabotage right).
The process of deregulation and the subsequent process of privatization have induced important changes in the structure and
geography of the airline market. On the one hand, many flag carriers (hereafter called full-service carriers, FSCs) have signed alliances to exploit economies of scale and scope, and to optimize
their network operations (Cento, 2006). On the other hand, the airlines’ network has, in many cases, moved from a point-to-point
system to a hub-and-spoke system, and, finally, with the rise of
international alliances, to a multi-hub-and-spokes system. This
fact has given the inhabitants of the largest cities an advantage
but has penalized those living in the smaller ones (Dobruszkes
et al., 2010).
Sophisticated yield management techniques have also been
developed, in order to control aircraft availability and to provide
an even more differentiated product by offering in-flight entertainment, fast check-in, VIP waiting lounges, ground services, etc.
(Tretheway, 2011).
In this evolving environment a new type of carrier has gained
ground (Francis et al., 2006). They are usually called low-cost carrier (hereafter abbreviated as LCCs). An LCC is an airline designed
to have a competitive advantage in terms of costs over the FSCs.
An LCC relies on very simple firm organization and logistic principles. In contrast to the hub-and-spoke configuration developed by
traditional carriers, the LCC offers often point-to-point connections
from secondary airports that are less expensive in terms of landing
tax and handling fee than larger airports. Their fleet generally includes one type of aircraft that operates more hours a day than
the traditional carriers (Doganis, 2001; Morris et al., 2005;
2. 224
M. Alderighi et al. / Journal of Transport Geography 24 (2012) 223–233
Dobruszkes, 2006).1 The LCCs experienced fast growth after 1999,
and did not suffer as much from the crisis in the air transport industry after September 11, 2001, because the low fare levels were still
attracting many passengers, and because the LCCs were not yet operating in politically sensitive regions (Franke, 2004). In Europe, LCC
penetration has followed the enlargement process, gaining market
shares, first in the EU-15 countries, and afterwards in the new members (Dobruszkes, 2009).
We also observe important changes on the demand side. In general, the process of internationalization and globalization has increased the mobility not only of goods but also of people. Trade
agreements and the expansion of cargo transport have contributed
to an increase in – or are related to – the high mobility of business
travellers (Hamermesh, 2006; Poole, 2009). Also, the behavior of
tourists has drastically changed. Travellers nowadays tend to prefer multiple and short holidays as opposed to traditional long stays,
while also the loss of the glamor associated with flying – and hence
the supply of lower service levels – is accepted by many travellers
(Martínez-Garcia and Raya, 2008; Martin et al., 2008).
In this paper we investigate the price-setting behavior of the
FSCsin the European passenger aviation market. We develop a formal model of airline competition, that accommodates various market structures, some of which include low-cost players.
More precisely, we assume that FSCs can offer two verticallydifferentiated qualities (e.g. business cabin vs economy cabin;
refundable vs non-refundable ticket; VIP lounge access vs no
lounge access), whereas LCCs can only offer the lowest quality
product (e.g. economy cabin, non-refundable ticket and no lounge
access). There are two traveller types (business and leisure travellers), who have different evaluations for product qualities, and,
within each group, passengers have different appraisals of carriers
(e.g. owing to frequent flyer programmes, different time schedules
or the different location of the departure/arrival airports in multiairport cities).
Each carrier charges different fares (unrestricted and restricted
fares) for different quality products, and travellers are free to
choose the carrier and the quality they prefer. This means that a
leisure traveller might, in principle, buy an unrestricted fare, and
a business traveller a restricted one; and the demands for the
two products are interdependent.2
In the seminal work on fare dispersion and market structure,
Borenstein (1989) provides a simple explanation of carrier pricing
behavior under conditions of demand independency. This hypothesis has been maintained in most of the following empirical
works.3 In our paper, we have preferred to rely on the assumption
of interdependency, and therefore we have based our set-up on
the growing literature on mechanism design in oligopolistic markets
(see, for example, Rochet and Stole, 2002; Armstrong and Vickers,
1
The above characteristics concern the original low-cost model introduced by
Southwest Airlines (Vowles, 2001). Francis et al. (2006), Alamdari and Fagan (2005),
Mason and Morrison (2008) and Graham (2009) have noted that there are many
variants of the model and a great diversity between LCCs.
2
Previous contributions on this topic, such as those by Oren et al. (1983), Calem
and Spulber (1984), and Holmes (1989), assumed no interdependencies among
markets, i.e. business travellers were not supposed to demand leisure products and
vice versa. In the literature, the pricing strategy based on the assumption of
independency is referred to as ‘third-degree price discrimination’ whereas the term
‘second-degree price discrimination’ is used for the assumption of interdependency.
3
That less attention is devoted to demand interdependency is probably because
(most of) the analysis of airline pricing (and, in particular, of fare dispersion) has
moved towards empirical issues. The text-book model presented by Borenstein
(1989) may generate both positive and negative correlation between market
concentration and price dispersion. Other authors have presented complementary
explanations of pricing behavior which involve scarcity issues, e.g. peak and off-peak
pricing (Carlton, 1977; Dana, 1999a,b), or they have analyzed the relation between
the time of ticket purchase and its price, e.g. intertemporal price discrimination
(Dana, 1998).
2001; for a review, see: Yang and Ye, 2008). This approach has some
complications because the firms’ optimal pricing choice, which
simultaneously accounts for the pressure of opponents and the need
to segment passengers with different evaluations, must also include
the quality choice, implying that the closed-form solution is often
difficult to find, and there are often existence issues (Alderighi,
2008). We have therefore decided to follow the intermediate approach proposed by Wilson (1993) for the monopoly case, which
has the advantage of maintaining the interdependency, but, by
assuming exogenous quality levels, is simpler to compute.
Liu (2003) and Dai et al. (2010) use a similar modelling choice to
show that there is a U-shaped relationship between market concentration and price dispersion in airline fares. Contrary to our approach, where we explicitly account for four different market
structures in accordance with those prevailing in the our database,
i.e. monopoly (only one FSC), symmetric duopoly (i.e. two FSCs),
asymmetric duopoly (one FSC and one LCC), and an asymmetric
oligopoly (i.e. two FSCs and a LCC), they consider a symmetric
duopolistic set-up with three quality levels, and, by varying the degree of differentiation between carriers (i.e. the intensity of competition), they obtain different market concentration levels. Our
theoretical work is also related to Rochet and Stole (2002) and
Alderighi (2008), which assume endogenous quality levels but analyze a more limited number of market structures. Moreover, by
assuming exogenous quality levels, we obtain more comparable
results.
In our empirical model estimation, we will use monthly data on
the airfares of Lufthansa, British Airways, Alitalia, and KLM for the
top 41-city-pairs from Italy to Europe (April 2001–July 2003), and
we perform an analysis on the basis of eight different types of airfares. This allow us to study the change in the FSCs’ pricing profile
due to a modification of the market structure, and to provide some
insights into the effects of the entry of LCCs on the FSCs’ fare structure. In doing this, we depart from the usual estimation strategy of
a single price equation based on the average or minimum fare, as
in, for example, Evans and Kessides (1993), Peteraf and Reed
(1994), Windle and Dresner (1995), Stavins (2001), Piga and Bachis
(2007), and Chi and Koo (2009).
The empirical literature on the effects of the entry of LCCs is
quite abundant. There is general agreement among scholars that
the entry of LCCs has a negative impact on price (Goetz and Vowles, 2009), and a positive impact on passenger volumes (Vowles,
2001; Oum et al., 2010), and on the size of the catchment area
(Pantazis and Liefner, 2006). The effects of LCC entry on prices
can also be observed in the months before the entry (Goolsbee
and Syverson, 2008), has different short- and long-run characteristics (Windle and Dresner, 1999), and may also affect high-speed
train traffic (Friebel and Niffka, 2009). More debated is the effect
of LCCs on price dispersion (Borenstein and Rose, 1994; Gerardi
and Shapiro, 2009).
The paper is organized as follows. In Section 2, we present some
basic concepts concerning yield management in the airline industry. In Section 3, the theoretical model is presented, while Section 4
presents the empirical analysis. Finally, Section 5 concludes the
paper.
2. Yield management in the airline sector
Market factors, such as demand fluctuations, consumer heterogeneity, and uncertainty about the travellers’ departure date or
even destination, combined with a limited aircraft capacity and
the very perishable nature of the product (the unsold seats cannot
be used as soon as a flight departs), make the setting of airfares and
the allocation of aircraft seats a complex decision process. In recent
years, carriers have adopted a set of techniques to allocate limited
3. M. Alderighi et al. / Journal of Transport Geography 24 (2012) 223–233
and highly perishable resources among differentiated consumers.
These techniques are known as ‘yield management’ (or ‘revenue
management’).4
The goal of yield management is to maximize the revenue of a
carrier operating in a complex market environment. We identify
two aspects of yield management. First, customers are heterogeneous in travel behavior and willingness-to-pay, which is the reason why firms can profitably customize their products for different
segments. Second, once the output is produced (availability of
seats), costs are sunk, and therefore the yield maximization problem coincides with profit maximization (This explains why it is
called revenue or yield management, and not profit management).
We call traditional yield management the set of techniques that
are usually adopted by the FSCs. Traditional yield management
can be characterized by six simple principles: market segmentation; product differentiation; price setting; fences; availability control, and distribution. Differences in travellers’ behavior allow FSCs
to segment the demand and through product differentiation to offer a wide variety of in-flight and ground services. Then prices are
set in relation to the different willingness-to-pay features of customers, while different levels of quality are provided to different
market segments. In order to ensure that every segment purchases
the ticket designed for it, an FSC differentiates the product by
applying fences. Product fences are rules that regulate the ticketing
purchase and the conditions imposed on each traveller category.
Examples of fences are ticket cancellation or travel date change
penalties, purchase time limits, or minimum stay at the travel destination. In addition to the fences, adding extra services to the basic
transport can differentiate the airline product (in-flight entertainment, fast check-in, VIP waiting lounges, etc.).
The different products are offered to the market through distinct aircraft reservation classes.5 The reservation classes are created to reflect the market segmentation. One or more airfares are
applicable to each class of reservation. By having discrete fare classes, the yield management system has to face the problem of forecasting the demand, and then allocating the right number of seats
of each class in order to optimize the revenue. This activity is called
inventory control, and it is usually implemented for all flights operating between any combination of city-pairs of the network up to
1 year into the future. Nowadays, however, the hub-and-spoke networks are capable of generating thousands of origin and destination
combinations, and therefore inventory control requires the support
of sophisticated computer systems. Moreover, the inventory control
approach also requires the distribution system to be able to display
the seat availability of each reservation class. The modern GDSs (global distribution systems) are indeed able to support such complex
inventory control systems.
On the other hand, we call the set of techniques used by the
LCCs simplified yield management, which differs radically from traditional yield management with respect to two elements. Segmentation is only applied through time of booking and choice of flight.
The passenger who wishes to pay lower prices must book early, or
choose the flights for which there is less demand.6 The product is
not differentiated: there are no additional services included in the
price, no drinks or food, no frequent flyers programme or convenient
airports, no VIP lounges or in-flight services. The rules applied to the
4
For a review of different yield management techniques, we refer to Weatherford
and Bodily (1992) and Talluri and van Ryzin (2005). For a review of yield management
of FSCs vs LCCs, see Fletcher (2003).
5
Carriers label classes with capital letters. For example, the promotional classes of
Alitalia are O and N, while those of Lufthansa are V or W. In the next section, we
propose a class mapping in order to be able to compare them with each other.
6
LCCs modify the selling price of each flight as a function of the departure date. If a
price is too low, the flight will fill up early and higher-yielding late-booking business
will be turned away. Conversely, if the price is too high, the flight is at risk of
departing with empty seats.
225
fares are eliminated, as no segmentation is applied: no Sunday rule,
date limit, or change fee, and so on. Those factors make the inventory
control of LCCs simpler to manage than that of FSCs. The distribution
system can be implemented via the Internet so that the passenger is
able to compare prices as a function of date or time of departure. The
simplified yield management techniques do not apply any explicit
market segmentation, except for a dynamic pricing schedule based
on the departure date.
3. Theoretical framework
3.1. The model
Following Rochet and Stole (2002), we assume that consumers
are both vertically and horizontally heterogeneous. Vertical heterogeneity depends on the travel motivation. In fact, there are business travellers with a high willingness-to-pay, t2, and leisure
travellers with, usually, a low willingness-to-pay, t1 < t2. Using
Robinson (1933)’s terminology, we denote the first segment as
the strong market and the last segment as the weak market. We normalize the consumer mass to 1; the size of the weak market is
l1 = l, and the size of the strong market is l2 = 1 À l. Both types
of consumers appreciate quality, although the consumers belonging to the strong market are more interested in quality than the
others. Let uil = tiql be the utility evaluation of a product of quality
ql by consumer i. Hence, we assume that: ui2 > ui1 for i = 1, 2 and
u22 À u21 > u12 À u11. We suppose that there are two types of firms:
traditional firms (namely, L or R), and low-cost firms (namely, S or
M). They differ with regard to two aspects. A traditional firm can
offer products of two different qualities: q1 and q2, q1 < q2, with
corresponding unit costs c1 < c2. A low-cost firm can only provide
products of quality q1 with costs c0 6 c1. In other words, traditional
firms can offer a full range of products but at higher cost, while
low-cost firms can offer a restricted range of products but at lower
cost.7
Traditional firms design products of quality q1 for the weak
market, and products of quality q2 for the strong market. In any
case, since markets are interdependent, there can be diversion,
i.e. a t2-type consumer can be interested in a product designed
for t1. Let us call p1j the price charged by firm j for q1, and p2j the
price for q2. To avoid diversion, firm j must choose p1j and p2j, such
that the net utility of a customer with t2, when he/she buys q2, is at
least equal to his/her net utility when he/she buys q1. This means
in formal terms: u22 À p2j > u21 À p1j Note that this inequality
may also be written as:
P2j À p1j < r;
ð1Þ
where r = u22 À u21. This condition is known as the incentive compatibility constraint or IC (Mussa and Rosen, 1978).8
Consumers are assumed to be horizontally heterogeneous so
that, ceteris paribus, some of them prefer to buy from firm L, and
others from firm R, S, or M. In other words, consumers’ preferences
7
We use the simplifying assumption that the ‘leisure class’ of the FSCs is
equivalent to the LCCs’ offer. As a referee noted, in practice, the economy class that an
FSC offers is almost an intermediate price/service combination between the LCCs and
business class. Modifying the quality of the LCC offer does not substantially change
the results of the analysis, as in our set-up passengers respond to quality-adjusted
prices. The main effect of choosing a third quality level q0 < q1 for LCCs is that LCCs
equilibrium prices are lower.
8
The incentive compatibility constraint is said to be binding when a firm chooses
the prices of high-quality and low-quality products in such a way that high
willingness-to-pay consumers are indifferent between buying a high-quality product
at a high price and buying a low-quality product at a low price. Conversely, the
incentive compatibility constraint is said to be slack when prices are set in such a way
that consumers of the strong market will strictly prefer a high quality product to a
low-quality product.
4. 226
M. Alderighi et al. / Journal of Transport Geography 24 (2012) 223–233
are heterogeneous with respect to the brand. Interpreting this in
terms of spatial distribution of consumers, we can imagine that
consumers are uniformly distributed on a unitary Hotelling
(1929) segment, and that firms are located at different points on
the line.
The unitary (transportation) cost of consuming a product, which
differs horizontally from the consumer’s ideal one, is assumed to
be equal to r. Taking all these things into account, the utility of a
consumer of type i located at x, who consumes a product of quality
l from firm j located at yj, is then equal to: uij À plj À r|x À yj|. We
will now analyze four different situations (in Sections 3.2–3.5):
1. Monopoly: one traditional firm L on the market located at
yL = 0.
2. Symmetric duopoly: two traditional firms on the market;
namely, L and R, located at yL = 0 and yR = 1.
3. Asymmetric duopoly: one traditional firm L and one low-cost
firm S, located, respectively, at yL = 0 and yS = 0.
4. Asymmetric oligopoly: two traditional firms L and R, and one
low-cost firm M, located, respectively, at yL = 0, yR = 1 and
yM = 1/2.
This set-up enables us to compute the consumer demand of
firm j = L, R, S, M in the market i, i.e. the number of consumers of
type ti who will buy from j. Let dj and plj be, respectively, the distance of a selected consumer from firm j and the prices charged
by firm j for a product of quality l. A consumer will buy a product
of quality l from j – k if uil À plj À rdj < uil À plk À rdk, where
k = 0, L, R, S and M, plk and dj are, respectively, the price charged
by and the distance from the competitor. When k = 0, the inequality captures the decision of not buying, i.e. pl0 = uil, d0 = 0. Assume
that there is no diversion, i.e. firms charge prices so that the incentive compatibility constraint of Eq. (1) is satisfied.9 So, the demand
for a product of quality ql faced by the monopolist L in the market ti
with l = i is:
DiL ðpiL Þ ¼ li U
u À p
ii
iL
r
;
ð2Þ
where U is the cumulative uniform distribution on the segment [0,
1].
Now, in a duopoly, the demand for L and j = R, S in the market ti
are, respectively:
1 pik À piL
;
þ
DiL ðpiL ; pik Þ ¼ li U
2
2r
1 piL À pij
Dij ðpij ; piL Þ ¼ li U
;
þ
2
2r
ð3Þ
where k = R, S, M and j = R, S.
As already noted, a low-cost firm is not able to offer a product of
quality q2, and hence it also has to offer its product of quality q1
also to consumers belonging to the strong market. Since the evaluation of a t2-type consumer for a product of quality q1 differs from
the one of quality q2 by an amount equal to r = u22 À u21, the perceived price of a product of quality q2 is p2s = p1s + r. In other words,
p2s indicates the price adjusted for the quality.
max
P
DiL ðpiL ÞðpiL À ci Þ;
s:t: p2j À p1j 6 r:
ð4Þ
i¼1;2
This monopoly framework produces a wide range of cases
depending on whether it is optimal for the firm to partially or completely cover the markets, and whether or not the IC constraint is
binding.
In order to simplify the analysis, and by considering the more
interesting case, we solve the model by assuming a partial coverage (at least half) of the weak market and a full coverage of the
strong market when the IC constraint is binding. Under these
assumptions, the optimization problem of the monopolist becomes
as follows:
max
lðu11 À p1L Þðp1L À c1 Þ=r þ ð1 À lÞðp1L þ r À c2 Þ:
ð5Þ
The first-order conditions imply that:
p1L ¼
1
1Àl
r and p2L ¼ p1L þ r:
c1 þ u21 þ
2
l
ð6Þ
Clearly, prices are related to the variables of the model in the
following way: (a) prices are increasing with costs; (b) (all) prices
decline when the size of the weak market is large with respect to
the size of the strong market; and (c) prices are increasing with
the parameters that measure the horizontal heterogeneity.
3.3. Symmetric duopoly
In the symmetric duopoly case, the assumption that the firm
covers completely the strong market and at least half of the weak
market implies again that both markets are covered. The optimization problem of firm L is as follows:
max
P
li
i¼1;2
1 pik À piL
ðpiL À ci Þ:
þ
2
2r
ð7Þ
To solve the model we assume that the IC constraint is slack,
and then we check whether the constraint is satisfied. From the
first-order maximization conditions we have: piL ¼ 1 ðci þ pik þ rÞ,
2
where k = R. By symmetry piL = piR, and hence: piL = ci + r. Consequently, the IC constraint is satisfied when:
c2 À c1 r ¼ u22 À u21 :
ð8Þ
Condition (8) is thus met when the costs are not too much different, and when weak and strong markets are sufficiently differentiated. It is worth noting that, if c2 À c1 u22 À u21, then it is
better for a firm to produce only quality q1, as the costs to produce
q2 are higher than the advantages coming from the opportunity to
charge different prices.10 Consequently, we assume that condition
(8) is always satisfied, and hence IC is never binding in the duopoly
case. This means that competition reduces prices in the strong market more than in the weak market. In the next section, we show that
this result also holds for the asymmetric case, where the competition
introduced by a low-quality product is enough to limit the prices in
the strong market.
3.4. Asymmetric duopoly
3.2. Monopoly
Using Eqs. (1) and (2), we can formulate the optimization problem of the monopolist L:
9
We add a technical assumption in order to restrict the number of possible cases,
thus focusing on the more interesting ones. We assume that a monopolist wants to
serve all the customers of type t2 and at least one half of type t1. This corresponds to
the assumption that consumers are not too differentiated horizontally and vertically.
As a consequence, in the duopoly case both markets are completely covered.
In the asymmetric duopoly case, we assume that there is a traditional firm L, located at 0, and a low-cost firm, S, located at 1. The
low-cost firm has a competitive advantage in costs, but it cannot
provide the full range of products (quality q2).
As in the previous case, we start by stating that IC is not binding,
and then we verify whether this is indeed the case. As one will see,
when firm S sells in the strong market, IC is always slack. Depend10
This result is not specific for the duopoly case, and it also holds for the monopoly
case.
5. M. Alderighi et al. / Journal of Transport Geography 24 (2012) 223–233
ing on the level of vertical heterogeneity, S may, or may not, be able
to sell on the strong market. We will focus on the first case. We
know that firm S, as it cannot provide a high-quality product for
type t2, offers the same quality product for both markets, which
corresponds to q1. Hence, firm S has only to choose a unique price
for the same product offered to consumers of both the weak and
strong market. The optimization problem of firm S is as follows:
1 p À p1S
1 p À P1S À r
ðp1S À c0 Þ þ ð1 À lÞ þ 2L
ðp1S À c0 Þ:
max l þ 1L
2
2
2r
2r
ð9Þ
Note that the price charged by firm S in the strong market is p1S,
but it is perceived as p1S + r, because it is adjusted for the expected
quality q2. The solution to the maximization problem is:
p1S ¼
1
6
1
ðc0 þ r þ lp1L Þðp2L À rÞ:
2
ð10Þ
Using (3) we obtain: p1S ¼ 2 c0 þ 1 x þ r, p1L ¼ 1 c0 þ 1 c1 þ
3
3
3
2
x þ r, p2L ¼ 1 c0 þ 1 ðc2 þ rÞ þ 1 x þ r where x ¼ lc1 þ ð1 À lÞ
3
2
6
ðc2 À rÞ. Previous computations also imply that p2L À p1L ¼ 1
2
ðc2 À c1 þ rÞ. This is the same result as for the symmetric duopoly
case. Under condition (8), the IC constraint is not binding. Moreover, it is worth mentioning that this result does not require that
c0 6 c1, and hence it refers to each situation where there is asymmetric competition, and not only to those situations where the traditional player competes with an opponent characterized by a
competitive advantage in costs.
Finally, note that, although firm S does not sell products in the
strong market, firm L is not free to charge a monopoly price because of potential competition from the products of firm S. Practically, firm L charges a price p2L to exclude firm S, and hence
p2L 6 p1S + r + r.
3.5. Extension to oligopoly and general outcomes
The previous set-up can be extended to the oligopoly market
structure. One oligopoly situation is the case of three firms:
namely, two traditional firms located at the extremes of the unitary segment L and R, and one low-cost firm, M, in the center.
When low-cost firms have a positive market share (i.e. the vertical
differentiation is not too high), the results appear to be similar
~
to the previous ones: p1M ¼ 2 c0 þ 1 x þ r; p1L ¼ p1R ¼ 1 c0 þ 1 c1 þ
3
3
3
2
1
~
~
x þ r; p2L ¼ p2R ¼ 1 c0 þ 1 ðc2 þ rÞ þ 1 x þ r. The solutions for the
6
3
2
6
asymmetric duopoly and the asymmetric oligopoly differ only for
~
the term r ¼ r=2 Therefore, prices are lower here than in the pre-
227
vious case, as the firms can exercise less monopoly power (lower
horizontal differentiation).
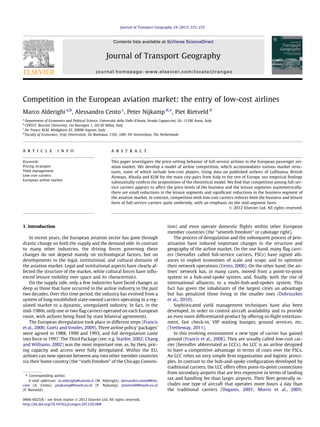
Fig. 1 offers a qualitative representation of the result of the
theoretical model. The following inequalities are indeed a link
between the theoretical model and the empirical analysis:
1: Weak market : poli pasy psym pmon ;
1L
1L
1L
1L
ð11Þ
2: Strong market : poli psym pasy pmon :
2L
2L
2L
2L
ð12Þ
These results can be proven as follows. Using Eq. (8), and noting
that x = lc1 + (1 À l)(c2 À r), we find that:
c2 À r 6 x 6 c1 :
ð13Þ
Combining (13) with the assumption that c0 is not too small, we
can prove the first two inequalities of Eqs. (11) and (12). In order to
prove the last inequalities in (11) and (12), we require the assumption of full coverage of the strong market in the monopoly case
(Section 3.2). This means that u22 À pmon P r, or, after substituting
2L
for pmon :
2L
u21 À c1 P
1þl
l
r:
ð14Þ
Using condition (13) and (14), the results can easily be proven.
Note that the IC constraint is binding only for the monopoly
case. In the other market structures, the relaxed optimization problem proved that the IC constraint is never binding. Moreover, we
showed that the IC constraint is never binding if condition (8)
holds, i.e. when the costs of producing two qualities are not too different, and when weak and strong markets are sufficiently differentiated. This means that the price levels are the result of the
competitive interaction (relaxed solution). As a result of the interdependence between the leisure and the business market, any LCC
entry will influence the price levels of the business segment, even
though it does not offer a full business product.
4. Evidence on price setting in Europe
In this section, we empirically investigate the pricing strategy of
FSCs in relation to the LCC entry. We test the inequalities (11) and
(12) in order to compare the effects of FSC and LCC competition on
the airfares. The literature on airfare pricing has identified a number of different factors that affect the pricing behavior of airlines.
The variables used in these studies are recurrent, but there are
some differences, depending on data availability and the scope of
the analysis.
Mono
Fig. 1. FSC and LCC fares.
6. 228
M. Alderighi et al. / Journal of Transport Geography 24 (2012) 223–233
Evans et al. (1993) regressed the average one-way fare on a
route by the one-way distance between the two end points of
the route, a measure of concentration on the route and at airport
level (the Herfindahl–Hirshman index, henceforth HHI), and the
percentage of direct flights for the airline on the route. Windle
and Dresner (1999) employed similar regressors such as route distance, passengers on the route, the presence of a resort destination,
and the presence of a slot-controlled route. Peteraf and Reed
Fig. 2. Number of routes by carrier (April 2001). Source: OAG (2004): (a) routes without low-cost carriers and (b) routes with low-cost carriers.
7. 229
M. Alderighi et al. / Journal of Transport Geography 24 (2012) 223–233
(1994) consider distance, number of passengers served by a carrier,
income, slot-controlled airports, and some variables to account for
actual and potential competition. Vowles (2000) estimates a pricing equation including, among other things, the no-stop distance
between the two end points of the route, a dummy variable for
the presence of an LCC, a specific variable for the presence of
Southwest, a dummy variable to take account for resort destinations, and a dummy variable for hub dominance. In Lijesen et al.
(2004), distance, hub dominance premium, and concentration on
the route (measured by HHI) are considered, and, recently, Chi
and Koo (2009) used a large set of dummy variables in conjunction
with the usual regressors (distance, concentration, average seat
capacity, load factor, frequency of flights). Finally, Fageda et al.
(2010) regressed the mean price on a route by distance, route concentration (measured by HHI), and traffic density.
4.1. The data
Data were collected for selected intra-European routes over the
period April 2001–July 2003. Analogously to Nero (1998), we only
considered non-stop direct flights. We further restricted the analysis to city-pairs between Italy and the main destinations in the UK,
Germany, and the Netherlands. The FSCs under investigation are:
Lufthansa, British Airways (BA), Alitalia, and KLM. In total, 41 origins and destinations were selected, where one, two, or more carriers offer direct services. Fig. 2 provides a map of the routes
considered in our analysis, at the starting date of the sample (April
2001). More precisely, Panel (a) refers to those routes only operated by FSCs, while Panel (b) presents those routes operated by
both FSCs and LCCs.
At first glance, the geographical distribution of the routes in the
two maps appears quite similar. In April 2001, the number of
routes without LCCs (23) is larger than those with LCCs (18). Over
the period (April 2001–July 2003), we observe entry in three routes
(e.g. Milan–Munich, Milan–Strasburg and Rome–Munich), so that
the route numbers of the two groups substantially equalize in June
2003. Also in terms of average route distance, the two groups appear similar. In particular, we also observe the presence of LCCs
on those routes where the flight distance is longer (e.g. London–
Naples), i.e. where the competitive advantage of LCCs is supposed
to be lower (Wensveen and Leick, 2009).
There is indeed a larger share of routes operated by only one
FSC in those markets without LCCs. These routes are characterized
by a smaller city size and/or lower average income of the population located at least at one of the end points of the route. Denser
routes are more likely to be operated by two FSCs (e.g. Milan–London, Milan–Amsterdam, Milan–Frankfurt, Rome–London, Rome–
Amsterdam).
At the end period of our data set (April 2003), we observe a market dominance of the FSCs for most of the city-pairs. In particular,
at least 80% of the market share (computed in terms of seats offer)
is covered by one FSC for 11 city-pairs, by one FSC and one LCC for
9 city-pairs, by two FSCs for 15 city-pairs, and by two FSCs and one
LCC for 5 city-pairs. Only for one city-pair (Milan–London) is 60% of
the market equally covered by two FSCs, and the remaining 40% of
market share is spread over other smaller carriers (including LCCs).
Following the relevant literature, the database includes information on airfares, market concentration (HHI), the presence/absence of a LCC (LC), the one-way distance between the two end
points of the route (DIST) and per-capita gross domestic product
(GDP).
4.1.1. Airfares
All historical and current published airfares in Italy were downloaded from the computer reservation system Galileo. The sample
contains monthly observations over the period April 2001–July
2003 for any available reservation class of the four FSCs considered,
with a total of 14,152 airfares.
As discussed, yield management enables carriers to segment the
market by offering fares with different price levels, rules, and conditions. Every fare is linked to a specific reservation class (indicated
by a capital letter) that carriers virtually create to allocate the optimal number of passengers on the aircraft. The database contains
different numbers of subclasses per carrier that vary from 12 for
British Airways to 9 for KLM, belonging to two different aircraft
cabins: economy and business. Subclasses are designed for different market segments. We have next clustered similar subclasses
in one uniform class mapping. Table 1 presents the eight identified
fare clusters, of which six are in economy cabin and 2 are in business cabin.
The first cluster has been named Promotional, and it includes the
lowest published fares of all four carriers. Then, we have identified
two discounted classes of tariffs and two economy classes. The
three highest fare clusters have been named Unrestricted1, Unrestricted2, and Unrestricted3, and they are addressed mainly to business passengers who require maximum flexibility of travel
conditions. In particular, Unrestricted1 is addressed to the business
passengers accommodated in the economy cabin, and the other
two to the business passengers accommodated in the business cabin. Table 2 provides some descriptive statistics about the fare
clusters.
Table 3 lists the variables included in our database, which will
be used to estimate a pricing equation.
4.1.2. Market structure
As clearly emerged from the previous literature review, the HHI
is a widely accepted indicator for concentration on a market; it is
normally calculated on the basis of the output sold in the market.
In the airline industry, the output can be the number of passengers
or the revenues that are generated on a route. Those data are not
available at the route level, and therefore the weekly flight frequency has been adopted as the output indicator. We limit the
HHI calculation to no-stop frequencies. This choice has no severe
Table 1
Booking class mapping between booking subclasses of FSCs.
Cabin service
Type of fare
Alitalia
KLM
British
airways
Lufthansa
Economy cabin
Promotional
Discounted1
Discounted2
Economy1
Economy2
Unrestricted1
O–N
W–T
Q
B
M
Y
V–T
L
K
B
S
Z
Q–N
V–L
M
K–H
B–I
Y
W–V
Q–H
M
B
B
Y
Business cabin
Unrestricted2
Unrestricted3
I
C
C
J
D
J
D
C
Table 2
Descriptive statistics of the dependent variable in the econometric model called FARE
(in Euros).
Service cabin
Type of fare
Mean
Std. dev.
Min.
Max.
Economy cabin
Promotional
Discounted1
Discounted2
Economy1
Economy2
Unrestricted1
167
276
361
454
580
815
33.9
60.1
58.7
102.3
100.3
161.0
99
165
240
300
320
440
295
411
494
732
838
1092
Business cabin
Unrestricted2
Unrestricted3
887
898
151.7
207.5
558
574
1171
1459
498
255.7
99
1459
Total
8. 230
M. Alderighi et al. / Journal of Transport Geography 24 (2012) 223–233
Table 3
Description of variables.
Variable
name
Description
FARE
The price (in Euros) of a return ticket as published in the CRS in Italy by each carrier for each type of fare, i.e. promotional, apex, super-apex, unrestricted
fare, etc. in economy and business class of service, as classified in the class mapping presented in Table 2
Air distance from the origin to the destination. It represents an approximation of the carrier’s operating costs. We expect that there is a positive impact
of the distance (measured in kilometers) on airfares, as any additional kilometer that an aircraft flies is reflected in additional costs for the carrier. Data
on the distances are collected from the Official Airline Guide
Gross domestic product per inhabitant of the departure airport catchment’s area (in thousands of Euros). It is an indication of the passenger income and
can therefore provide information of the passenger’s willingness-to-pay. The source is Eurostat (2004), the (regional) statistics database of the EU
P À2
P
where xj is the weekly flight frequency operated by carrier j, and the sum extends over all the
Herfindahl–Hirshman index (HHI): HHI ¼ j x2
j xj
j
DIST
GDP
H
LC
I
FSCs operating in the market (LCCs not included)
A dummy variable which equals 1, when there is at least one LCC in the market, and 0 otherwise
A dummy variable which equals 1, when there is at least one LCC in the market and one other FSC, and 0 otherwise
consequences for the results, as the market shares of indirect carriers are limited to a maximum of 5% for all the selected markets.
The HHI index can range from 0 to 1. It equals 1 when there is only
one monopolistic firm in the market, and it tends to 0 when the
number of firms becomes large. The HHI index is calculated for
FSCs only, as we have decided to capture the impact of LCCs by a
different variable. Because the larger the HHI, the smaller the competitive pressure, we expect a positive impact of HHI on fares.
4.1.3. LCC presence
The LCC dummy variable is introduced to directly test the
hypothesis of interdependency among markets. In fact, on this
assumption, the low-cost entry has an impact on both economy
and business airfares, while, on the assumption of independency,
LCC entry must only affect the leisure segment. Within the sample,
we have 12 city-pairs with the following LCCs: Ryanair, easyJet,
Basiqair, Volare Web, bmibaby, Air Berlin, Virgin Express, Hapag
Lloyd Express. Since the presence of an LCC should increase the
competition, we expect a negative impact on fares.
4.1.4. Other controls
The distance between the two end points of the route is considered a proxy for the operating costs of the carriers. GDP per capita
is a good proxy for available personal travel budget. For both variables we expect a positive impact on fares.
4.2. Estimation procedure and results
We estimate eight regression equations, one for each market
segment with the airfare levels as the dependent variable. The
regression model is specified as follows:
FAREj ¼ a0j þ a1j GDPj þ a2j DIST j þ a3j ð1 À HHIÞj þ a4j LC j þ a5j Ij þ ej ;
ð15Þ
where j = 1, . . . , 8, GDPj and DISTj are included as the difference from
their means. The HHI index takes the form of (1 À HHI)j in order to
make the interpretation of the estimation results easier, i.e. in the
case of a monopolistic situation, its impact on the dependent variable FAREj is null, and the constant represents the monopolistic
average price. In any other situation, the term (1 À HHI)j is a measure of the strength of competition. Eq. (15) also includes the interaction term Ij which is equal to 1 when there is a combination of at
least one LCC and one more FSC, while it is equal to 0 otherwise.
The regression model presented in Eq. (15) is estimated for the
eight identified clusters. The OLS estimations are presented in
Table 4. All coefficients appear to have the expected sign and are significant, with a few exceptions.11 It is worth noting that the explan11
Similar results are obtained when standard errors are clustered by route (see
Table A1 in Appendix A).
atory power of DIST is rather large for the last line. This is because
carriers usually anchor prices of Unrestricted3 to the officially published IATA fares.12
Several works (Borenstein, 1989; Borenstein and Rose, 1994;
Berry, 1994; Hayes and Ross, 1998) have suggested that a firm’s
decision to enter a market may depend on some characteristics
such as market concentration or pricing levels (which ultimately
affect the profitability of the market). Therefore, the variables LC,
HHI and I could raise some problems of endogeneity, and consequently might lead to a bias in the OLS estimates. For every equation, we performed the Hausman test, which rejected the null
hypothesis of no-endogeneity at the 99.99% level of significance.
To solve the endogeneity problem, we therefore decided to re-estimate the model by means of a two-step least squares (2SLS) estimator. In the first step, we estimated two auxiliary regressions
for the endogenous variables LC and HHI.13 We then used then
the estimated values of LC and HHI in the second step. Variable I is
chosen to be equal to 1 if the predicted values of LC and HHI simultaneously report the presence of an LCC and a second FSC. Table 5
provides the results of the 2SLS estimation.14
The first column (CONST) captures the average fare that a customer pays when there are neither LCCs nor other FSCs on the market. The second and third columns (DIST and GDP) register the
impact of the distance and the average gross domestic product
on the fares. In particular, the coefficient values of DIST appear to
increase, moving from line 1 to 8, showing that the higher fares
are, the more they are cost-related. The fourth column presents
the coefficients for (1-HHI). The negative sign for all eight classes,
as expected, indicates that when the market is less concentrated,
the overall fare levels are lower. The fifth column represents the
coefficients of the LC dummy, which are all significantly different
from zero with a negative sign. The simultaneous impact of FSC
and LCC competition can be finally determined by considering, in
addition to the previous effects, the interactive factor (sixth column). The main qualitative conclusions of the OLS model and of
the 2SLS model are similar. The impact of the LCC seems quite uniform among all the classes (although this gives some OLS underestimates), while FSC competition strongly reduces the prices in the
12
The method to set the IATA fares started before the EU market deregulation. The
IATA fares are now updated annually by the world IATA Congress, but the method is
still based on the air distance between any two travel points.
13
We selected the following instrument variables which refer to a year before the
initial date of our data set (if not differently mentioned): (1) weekly flight frequency
per route; (2) total passengers per route; (3) a dummy variable for Alitalia presence in
the route; (4) a dummy variable for British Airways presence in the route; (5) a
dummy variable for the first year of the dataset; (6) average population located at the
end points of the route; (7) a dummy variable for hub origin or destination; (8)
dummy variables for specific city-pair origins (Milan, Venice, Florence); (9)
geographical distance; and (10) average gross domestic product per inhabitant of
the departure airport’s catchment area.
14
Similar results are obtained when standard errors are clustered by route (see
Table A1 in Appendix A).
9. 231
M. Alderighi et al. / Journal of Transport Geography 24 (2012) 223–233
Table 4
Econometric model results with OLS (dependent variable: FARE).
Type of fare
Promotional
Discounted1
Discounted2
Economy1
Economy2
Unrestricted1
Unrestricted2
Unrestricted3
CONST
GDP
***
183.5
(1.869)
305.0*** (2.139)
***
395.0
(2.94)
491.5*** (3.767)
***
(3.147)
607.2
894.0*** (8.427)
980.0*** (10.24)
1046*** (4.818)
DIST
***
2.632
4.798***
5.056***
6.988***
3.834***
5.661***
7.565***
8.629***
(0.224)
(0.382)
(0.519)
(0.568)
(0.613)
(1.28)
(1.333)
(0.696)
(1-H)
***
0.0121
(0.00208)
0.0220*** (0.00341)
***
0.0159
(0.00434)
0.0634*** (0.00526)
***
0.111
(0.00475)
0.333*** (0.00958)
0.361*** (0.0107)
0.741*** (0.00946)
I
***
À29.46
(5.188)
À77.64*** (5.975)
***
À88.84
(7.48)
À104.0*** (10.92)
***
À62.33
(9.855)
À229.3*** (21.39)
À197.9*** (26.84)
À132.9*** (12.08)
À30.41
À41.55***
À59.34***
À69.83***
À65.08***
À50.39***
À84.83***
18.78***
(1-H)
(2.458)
(4.129)
(5.491)
(5.571)
(7.607)
(10.15)
(10.63)
(6.787)
LC
R2
Obs.
4.1 (3.59)
24.38*** (5.282)
44.09*** (6.374)
51.50*** (7.945)
33.21*** (9.43)
40.68*** (13.04)
48.87*** (15.93)
À87.51*** (13.3)
0.174
0.157
0.162
0.114
0.196
0.524
0.557
0.892
1436
2330
1743
2934
2534
1375
682
1118
I
LC
***
R2
Obs.
2.77 (2.289)
6.060* (3.448)
23.99*** (3.618)
23.02*** (5.315)
À1.597 (6.167)
0.685 (9.43)
À4.588 (11.86)
47.51*** (6.893)
0.163
0.210
0.268
0.182
0.237
0.555
0.659
0.912
1436
2330
1743
2934
2534
1375
682
1118
Notes: Robust standard errors are reported in parentheses.
Significance at the 5% level.
Ã
Significance at the 10% level.
***
Significance at the 1% level.
ÃÃ
Table 5
Econometric model results with 2SLS estimates (dependent variable: FARE).
Type of fare
Promotional
Discounted1
Discounted2
Economy1
Economy2
Unrestricted1
Unrestricted2
Unrestricted3
CONST
GDP
***
190.1
(1.909)
313.9*** (1.98)
397.0*** (2.493)
508.9*** (3.494)
623.8*** (3.241)
918.3*** (6.542)
1031*** (7.834)
1126*** (5.506)
DIST
***
3.427
(0.285)
5.636*** (0.382)
3.393*** (0.482)
7.192*** (0.625)
4.932*** (0.556)
9.370*** (1.158)
14.07*** (0.96)
22.76*** (0.903)
***
0.0176
(0.00229)
0.0303*** (0.00343)
0.0417*** (0.00369)
0.0981*** (0.0052)
0.131*** (0.00539)
0.371*** (0.00974)
0.382*** (0.00856)
0.746*** (0.00943)
***
À42.94
(6.673)
À74.71*** (6.542)
À47.26*** (8.674)
À92.91*** (11.15)
À66.63*** (12.18)
À243.9*** (19.12)
À306.5*** (23.81)
À453.1*** (17.62)
***
À40.43
(4.293)
À61.77*** (5.683)
À112.3*** (5.104)
À131.4*** (6.855)
À109.4*** (11.35)
À94.63*** (16.06)
À87.51*** (13.00)
À55.49*** (15.29)
Notes: Robust standard errors are reported in parentheses.
Significance at the 10% level.
Significance at the 5% level.
***
Significance at the 1% level.
*
ÃÃ
Table 6
Average fares (in Euros) per class of service and market structure.
Class of service
Monopoly
Symmetric duopoly
Asymmetric duopoly
Asymmetric oligopoly
FSC entry impact
LCC entry impact
Joint FSC and LCC impact
Promotional
Discounted1
Discounted2
Economy1
Economy2
Unrestricted1
Unrestricted2
Unrestricted3
190
314
397
509
624
918
1031
1126
169
277
373
462
590
796
877
899
150
252
285
378
514
824
943
1070
130
255
273
343
480
702
788
810
À21
À37
À24
À46
À33
À122
À153
À227
À40
À62
À112
À131
À109
À95
À88
À55
À59
À93
À112
À155
À144
À216
À245
À235
business segment and weakly in the leisure segment (also in this
case, the impact registered by OLS is smaller).
The average fares obtained by the 2SLS estimation are presented in Table 6, per class and market structure: monopolistic
market (one FSC): symmetric duopoly (two FSCs): asymmetric
duopoly (one FSC and at least one LCC): and asymmetric oligopoly
(two FSCs and at least one LCC).
Fare levels are next sorted in order to satisfy the inequalities
(13) and (14) for all reservation classes. For leisure classes (the
weak market), prices are higher in the symmetric duopoly compared with the asymmetric one, while for business classes (the
strong market) the reverse holds. More precisely, in the symmetric
duopoly, there is an average FSC fare decrease of about €32 for
economy classes (with respect to a monopoly case), while in the
asymmetric duopoly, the impact is about triple (on average €91).
In the business classes, the competition of another FSC induces
an average fare decrease of about €167, while in the case of LCC
competition, the effect is halved (on average €80). Moreover, we
observe that the fare reduction due to the LCC entry increases
starting from the Promotional class to the Economy1 class, where
it reaches its maximum value, and then it turns into a decrease
up to the Unrestricted3 business segment.
These findings are open to various interpretations. In terms of
the model presented in Section 3, they corroborate the assumption
of market interdependence, and support the theoretical conclusion
that, in an asymmetric duopoly, the IC constraint is not binding. Indeed, the entrance of LCCs has an impact on the price levels of both
the business and the leisure segments, even though the LCCs do not
offer a full business service. Apparently, the indirect competition of
an LCC in the strong market is tough enough to make the IC constraint slack, i.e. it provokes a price drop in the strong market larger than in the leisure market, and therefore the FSC can freely
charge prices without considering the risk of diversion.
The works of Katz (1984) and Schmidt-Mohr and Villas-Boas
(2008), who analyzed the behavior of oligopolistic markets where
there is a positive correlation between horizontal heterogeneity
and product quality, may provide an alternative interpretation to
our empirical findings.15 In particular, their theoretical results state
that when the high-quality variant is strongly differentiated and the
weak market is sufficiently large, tough competition in the weak
15
Note that those authors do not consider an asymmetric duopoly scenario, but
these considerations are drawn from the inspection of their results obtained for the
symmetric duopoly case.
10. 232
M. Alderighi et al. / Journal of Transport Geography 24 (2012) 223–233
Italy to three European countries (Germany, the UK, and the Netherlands) including airfares for four different carriers (Alitalia, Lufthansa, British Airways, and KLM). The main result is that the
competition between FSCs reduces the price levels of the business
and leisure segments with a significantly stronger effect on the
business fares. The entry of LCCs has a more uniform impact on
all fares, with an emphasis on the mid-segment fares. More precisely, in the symmetric duopoly, there is an average FSC fare decrease of about €32 for economy classes (with respect to the
monopoly case), while in the asymmetric duopoly, the impact is
about triple (on average €91). In the business classes, the competition from another FSC induces an average fare decrease of about
€167, while in the case of LCC competition, the effect is halved
(on average €80). In the asymmetric oligopoly case, the average
fare decreases in the business and leisure classes are, respectively,
of €232 and €113 (with respect to the monopoly case).
These results are consistent with our theoretical findings that
LCCs entry also has a negative impact on business and leisure fares.
This suggests that business and leisure markets should be modelled as interdependent.
market may force a firm to reduce prices for the high quality product, although this segment is isolated from competition. The mechanism at work is as follows. Since the weak market is an
important source of revenue, the firm has to set lower prices for leisure travellers to maintain its position on this market; and this strategy obliges it to reduce its prices in the strong market because of the
threat of diversion (the IC constraint is binding). Applying these theoretical results to the airline sector, it means that once an LCC enters
the market, an FSC may observe a low leisure traffic performance,
which triggers it to reduce its economy fares. If the IC constraint
were binding, an FSC would then reduce its business fares in order
to maintain the right ‘‘buy-up’’ to satisfy the IC constraint, even if
the business segment is not affected by the LCC competition.
Both interpretations assume that markets are interdependent.
In the first case, a reduction of business prices is directly due to
LCC competition, while in the second case it is indirectly due to
LCC competition through the buy-up rule. Moreover, in the former
case, LCCs sell a positive quantity to business travellers, while, in
the latter case, business travellers are not interested. We prefer
the first interpretation also because it was noted in previous studies, e.g. Mason (2000), that some of the business travellers have
shifted from FSC to LCC airlines.
Finally, in the asymmetric oligopoly case, we observe an average fare decrease in the business and leisure classes of, respectively, of €258 and €111 with respect to the monopoly case, i.e.
again in line with the thesis that the IC constraint is not binding.
Acknowledgements
The authors would like to thank Anton van Dasler, Aura Reggiani, the Editor and two anonymous referees for their useful suggestions. Finally, the authors thank KLM Royal Dutch Airlines for
providing support in data collection.
5. Conclusions
Appendix A
This paper has investigated the pricing response of FSCs when
LCCs enter the market. We used monthly data on city-pairs from
See Tables A1 and A2.
Table A1
Econometric model results with OLS (dependent variable: FARE).
Type of fare
Promotional
Discounted1
Discounted2
Economy1
Economy2
Unrestricted1
Unrestricted2
Unrestricted3
CONST
***
183.5
(7.045)
305.0*** (10.64)
***
395.0
(14.42)
491.5*** (24.93)
***
607.2
(15.89)
894.0*** (33.28)
980.0*** (33.96)
1046*** (21.21)
GDP
DIST
***
2.632
(0.695)
4.798*** (1.654)
**
5.056 (1.947)
6.988** (3.154)
3.834 (3.436)
5.661 (4.663)
7.565 (5.594)
8.629*** (2.862)
(1-H)
*
0.0121 (0.00626)
0.022 (0.0173)
0.0159 (0.0187)
0.0634* (0.0327)
0.111*** (0.0272)
0.333*** (0.0544)
0.361*** (0.0614)
0.741*** (0.0466)
I
À29.46 (17)
À77.64*** (27.58)
À88.84** (33.32)
À104.00 (63.04)
À62.33 (51.65)
À229.3** (103.3)
À197.9** (90.59)
À132.9** (51.08)
***
À30.41
(8.021)
À41.55*** (11.98)
***
À59.34
(17.7)
À69.83** (34.08)
**
À65.08 (27.59)
À50.39 (34.69)
À84.83** (36.35)
18.78 (22.1)
R2
Obs.
4.10 (9.719)
24.38 (15.53)
44.09** (18.93)
51.50 (37.21)
33.21 (31.98)
40.68 (51.27)
48.87 (48.28)
À87.51* (50.88)
0.174
0.157
0.162
0.114
0.196
0.524
0.557
0.892
1436
2330
1743
2934
2534
1375
682
1118
I
LC
*
R2
Obs.
2.77 (5.814)
6.060 (11.08)
23.99** (10.85)
23.02 (29.96)
À1.597 (25.39)
0.685 (43.28)
À4.588 (43.84)
47.51 (34.39)
0.163
0.210
0.268
0.182
0.237
0.555
0.659
0.912
1436
2330
1743
2934
2534
1375
682
1118
Notes: Robust standard errors are clustered by route and are reported in parentheses.
Significance at the 10% level.
**
Significance at the 5% level.
***
Significance at the 1% level.
*
Table A2
Econometric model results with 2SLS estimates (dependent variable: FARE).
Type of fare
Promotional
Discounted1
Discounted2
Economy1
Economy2
Unrestricted1
Unrestricted2
Unrestricted3
CONST
***
190.1
(6.975)
313.9*** (9.309)
***
397.0
(12.32)
508.9*** (22.01)
623.8*** (18.32)
918.3*** (29.51)
1031*** (31.02)
1126*** (23.58)
GDP
DIST
***
3.427
(1.014)
5.636*** (1.815)
*
3.393 (1.896)
7.192* (3.996)
4.932 (3.248)
9.370* (4.833)
14.07*** (4.47)
22.76*** (3.659)
(1-H)
***
0.0176
(0.00484)
0.0303** (0.0147)
**
0.0417 (0.0172)
0.0981*** (0.0298)
0.131*** (0.0282)
0.371*** (0.0566)
0.382*** (0.0466)
0.746*** (0.0474)
Notes: Robust standard errors are clustered by route and are reported in parentheses.
Significance at the 10% level.
Significance at the 5% level.
***
Significance at the 1% level.
*
**
LC
*
À42.94 (22.82)
À74.71*** (22.01)
À47.26 (34.42)
À92.91 (64.59)
À66.63 (68.06)
À243.9** (103.9)
À306.5*** (95.19)
À453.1*** (72.83)
***
À40.43
(12.78)
À61.77*** (20.92)
***
À112.3
(18.14)
À131.4*** (37.55)
À109.4** (51.5)
À94.63 (59.69)
À87.51* (48.6)
À55.49 (56.17)
11. M. Alderighi et al. / Journal of Transport Geography 24 (2012) 223–233
References
Alamdari, F., Fagan, S., 2005. Impact of the adherence to the original low-cost model
on the profitability of low-cost airlines. Transport Reviews 25, 377–392.
Alderighi, M., 2008. Non-linear pricing in asymmetric duopoly. Australian Economic
Papers 46, 205–222.
Armstrong, M., Vickers, J., 2001. Competitive price discrimination. RAND Journal of
Economics 32, 579–605.
Berry, S., 1994. Estimating discrete-choice models of product differentiation. RAND
Journal of Economics 25, 242–262.
Borenstein, S., 1989. Hubs and high fares: dominance and market power in the US
airline industry. RAND Journal of Economics 20, 344–365.
Borenstein, S., Rose, N., 1994. Competition and price dispersion in the US Airline
Industry. Journal of Political Economy 102, 653–683.
Calem, P.S., Spulber, D.F., 1984. Multiproduct two-part tariffs. International Journal
of Industrial Organization 2, 105–115.
Carlton, D.W., 1977. Peak load pricing with stochastic demand. American Economic
Review 67, 1006–1010.
Cento, A., 2006. Challenge to the Airline Industry: Emergence of Crises and Low-cost
Carriers. PhD Thesis, Free University of Amsterdam, Mimeo.
Chang, Y., Williams, G., 2002. European major airline’ strategic reaction to the Third
Package. Transport Policy 9, 129–142.
Chi, J., Koo, W.W., 2009. Carriers’ pricing behaviors in the United States airline
industry. Transportation Research Part E 45, 710–724.
Dai, M., Liu, Q., Serfes, K., 2010. Is the Effect of Competition on Price Dispersion Nonmonotonic? Evidence from the US Airline Industry, Mimeo.
Dana, D.J., 1998. Advance-purchase discounts and price discrimination in
competitive markets. Journal of Political Economy 106, 395–422.
Dana, D.J., 1999a. Using yield management to shift demand when the peak time is
unknown. RAND Journal of Economics 30, 456–474.
Dana, D.J., 1999b. Equilibrium price dispersion under demand uncertainty: the role
of costly capacity and market structure. RAND Journal of Economics 30, 632–
660.
Dobruszkes, F., 2006. An analysis of European low-cost airlines and their networks.
Journal of Transport Geography 14, 249–264.
Dobruszkes, F., 2009. New Europe, new low-cost air services. Journal of Transport
Geography 17, 423–432.
Dobruszkes, F., Lennert, M., Van Hamme, G., 2010. An analysis of the determinants
of air traffic volume for European metropolitan areas. Journal of Transport
Geography 19, 755–762.
Doganis, R., 2001. The Airline Business in the 21st Century. Routledge, London.
Evans, W.N., Kessides, I.N., 1993. Localized market power in the US airline industry.
Review of economics and Statistics 75, 66–75.
Evans, W.N., Froeb, L.M., Werden, G.T., 1993. Endogeneity in the concentration–
price relationship: causes, consequences, and cures. Journal of Industrial
Economics 41 (4), 431–438.
Fageda, X., Jiménez, J.L., Perdiguero, J., 2010. Price rivalry in airline markets: a study
of a successful strategy of a network carrier against a low-cost carrier. Journal of
Transport Geography 19, 658–669.
Fletcher, S., 2003. Why Revenue Management is Solving the Wrong Problem in a
‘‘Low-cost’’ World. Stephen Fletcher Associates, Rubicon Europe Ltd.
Francis, G., Humphreys, I., Ison, S., Aicken, M., 2006. Where next for low cost
airlines? A spatial and temporal comparative study. Journal of Transport
Geography 14, 83–94.
Franke, M., 2004. Competition between network carriers and low-cost carriers—
retreat battle or breakthrough to a new level of efficiency? Journal of Air
Transport Management 10, 15–21.
Friebel, G., Niffka, M., 2009. The functioning of inter-modal competition in the
transportation market: evidence from the entry of low-cost airlines in Germany.
Review of Network Economics 8, 189–211.
Gerardi, K.S., Shapiro, A.H., 2009. Does competition reduce price dispersion? New
evidence from the airline industry. Journal of Political Economy 117, 1–37.
Goetz, A.R., Vowles, T.M., 2009. The good, the bad and the ugly: 30 years of US
airline deregulation. Journal of Transport Geography 17, 251–263.
Goolsbee, A., Syverson, C., 2008. How do incumbents respond to the threat of entry?
Evidence from the major airlines. Quarterly Journal of Economics 123, 1611–
1633.
Graham, M., 2009. Different models in different spaces or liberalized optimizations?
Competitive strategie3s among low-cost carriers. Journal of Transport
Geography 17, 306–516.
233
Hamermesh, D.S., 2006. The value of peripatetic economists: a sesqui-difference
evaluation of bob gregory. The Economic Record 82, 136–149.
Hayes, K.J., Ross, L.B., 1998. Is airline price dispersion the result of careful planning
or competitive forces? Review of Industrial Organization 13, 523–541.
Holmes, T.J., 1989. The effects of third-degree price discrimination in oligopoly.
American Economic Review 79, 244–250.
Hotelling, H., 1929. Stability in competition. Economic Journal 39, 41–57.
Katz, M.L., 1984. Firm-specific differentiation and competition among multiproduct
firms. Journal of Business 57, S149–S166.
Lijesen, M.G., Rietveld, P., Nijkamp, P., 2004. Do european carriers charge hub
premiums? Networks and Spatial Economics 4 (4), 347–360.
Liu, Q., 2003. The Effect of Market Structure on Price Dispersion: An Analysis of the
US Airline Industry, Mimeo.
Martin, J.C., Roman, C., Espino, R., 2008. Willingness to pay for airline service
quality. Transport Review 29, 199–217.
Martínez-Garcia, E., Raya, J.M., 2008. Length of stay for low-cost tourism. Tourism
Management 29, 1064–1075.
Mason, K.J., 2000. The propensity of business travellers to use low cost airlines.
Journal of Transport Geography 8, 107–119.
Mason, K.J., Morrison, W.G., 2008. Towards a means of consistently comparing
airline business models with an application to the ‘low cost’ airline sector.
Research in Transportation Economics 24, 75–84.
Morris, M., Schindehutte, M., Allen, J., 2005. The entrepreneur’s business model:
toward a unified perspective. Journal of Business Research 58 (6), 726–735.
Mussa, M., Rosen, S., 1978. Monopoly and product quality. Journal of Economic
Theory 18, 301–317.
Nero, G., 1998. Spatial multi-product pricing: empirical evidence on intra-European
duopoly airline market. Applied Economics 30, 465–475.
Oren, S.S., Smith, S.A., Wilson, R.B., 1983. Competitive non-linear tariffs. Journal of
Economic Theory 29, 49–71.
Oum, T.H., Zhang, A., Fu, X., 2010. Air transport liberalization and its impacts on
airline competition and air passenger traffic. Transportation Journal 49, 24–41.
Pantazis, N., Liefner, I., 2006. The impact of low-cost carriers on catchment areas of
established international airports: the case of Hanover Airport, Germany.
Journal of Transport Geography 14, 265–272.
Peteraf, M.A., Reed, R., 1994. Pricing and performance in monopoly airline markets.
Journal of Law and Economics 37, 193–213.
Piga, C.A., Bachis, E., 2007. Hub Premium, Airport Dominance and Market Power in
the European Airline Industry, Discussion Paper Series 2007_11. Department of
Economics, Loughborough University.
Poole, J.P., 2009. Business Travel as an Input to International Trade, Mimeo.
Robinson, J., 1933. The Economics of Imperfect Competition. Macmillan, London.
Rochet, J.C., Stole, L.A., 2002. Non-linear pricing with random participation. Review
of Economic Studies 69, 277–311.
Schmidt-Mohr, U., Villas-Boas, J.M., 2008. Competitive product lines with quality
constraints. Quantitative Marketing Economics 6, 1–16.
Starkie, D., 2002. Airport regulation and competition. Journal of Air Transport
Management 8, 62–72.
Stavins, J., 2001. Price discrimination in the airline market: the effect of market
concentration. Review of Economics and Statistics 83, 200–202.
Talluri, K.T., van Ryzin, G.J., 2005. The Theory and Practice of Revenue Management.
Springer, New York.
Tretheway, M., 2011. Comment on ‘‘legacy carriers fight back’’. Journal of Air
Transport Management 17, 40–43.
Vowles, T.M., 2000. The effect of low fare air carriers on airfares in the US. Journal of
Transport Geography 8, 121–128.
Vowles, T.M., 2001. The ‘‘Southwest Effect’’ in multi-airport regions. Journal of Air
Transport Management 7, 251–258.
Weatherford, L.R., Bodily, S.E., 1992. A taxonomy and research overview of
perishable-asset revenue management: yield management, overbooking, and
pricing. Operations Research 5, 831–844.
Wensveen, J.G., Leick, R., 2009. The long-haul low-cost carrier: a unique business
model. Journal of Air Transport Management 15, 127–133.
Wilson, R., 1993. Nonlinear Pricing. Oxford University Press, Oxford.
Windle, R.J., Dresner, M.E., 1995. The short and long run effects of entry on US
domestic air routes. Transportation Journal 35, 14–25.
Windle, R.J., Dresner, M.E., 1999. Competitive responses to low cost carrier entry.
Transportation Research Part E 35, 59–75.
Yang, H., Ye, L., 2008. Nonlinear pricing, market coverage, and competition.
Theoretical Economics 3, 123–153.