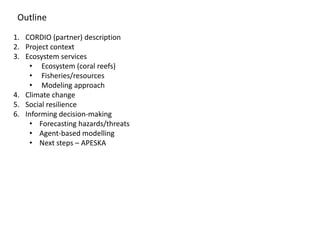
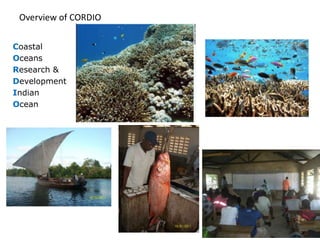
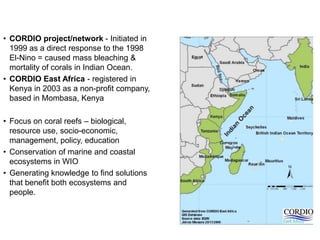
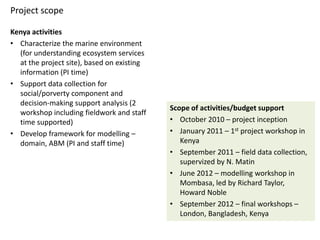
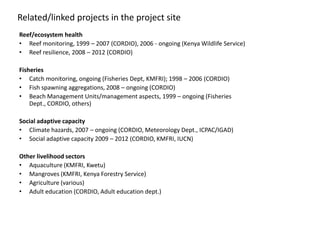
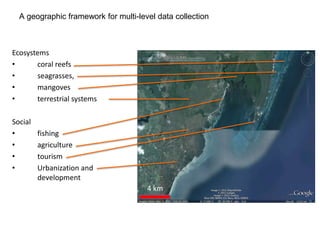
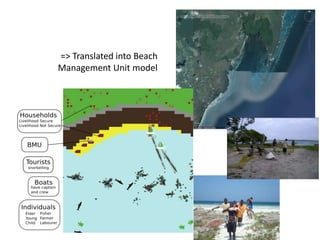
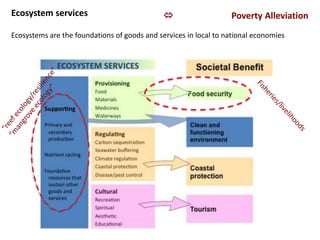
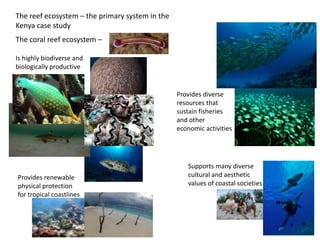
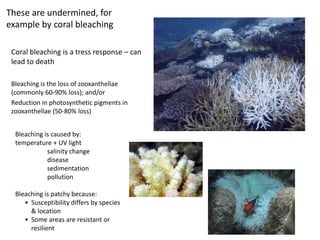
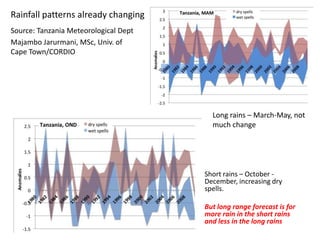
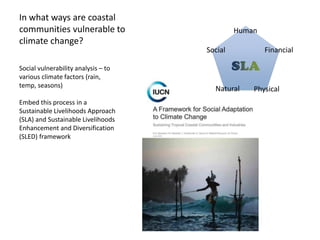
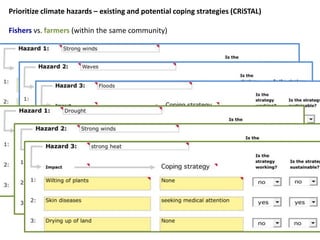
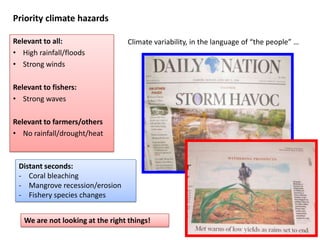
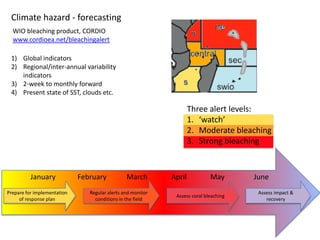
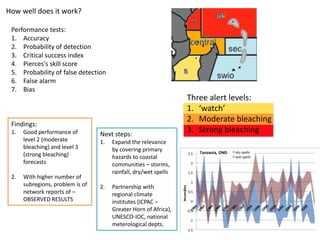
WD-NACE data gathering approach
                                              #2 – ECOSYSTEM HEALTH

                                               The necessity of a multi-level
                                               framework for understanding coastal
                                               management

David Obura
with Stephen Oluoch, Brigid Mibei, Innocent    27th September 2012 London, UK
Wanyonyi, Risper Oteke
CORDIO East Africa;
www.cordioea.net;
dobura@cordioea.net


Principal partner – Kenya Marine and
Fisheries Research Institute
Dr. Renison Ruwa, Khyria Karama,
Emmanual Mbaru, Stephen Mwakiti
Outline
1. CORDIO (partner) description
2. Project context
3. Ecosystem services
    • Ecosystem (coral reefs)
    • Fisheries/resources
    • Modeling approach
4. Climate change
5. Social resilience
6. Informing decision-making
    • Forecasting hazards/threats
    • Agent-based modelling
    • Next steps – APESKA
Overview of CORDIO

Coastal
Oceans
Research &
Development
Indian
Ocean
• CORDIO project/network - Initiated in
  1999 as a direct response to the 1998
  El-Nino = caused mass bleaching &
  mortality of corals in Indian Ocean.
• CORDIO East Africa - registered in
  Kenya in 2003 as a non-profit company,
  based in Mombasa, Kenya

• Focus on coral reefs – biological,
  resource use, socio-economic,
  management, policy, education
• Conservation of marine and coastal
  ecosystems in WIO
• Generating knowledge to find solutions
  that benefit both ecosystems and
  people.
Project scope

Kenya activities
• Characterize the marine environment
  (for understanding ecosystem services
  at the project site), based on existing
  information (PI time)
• Support data collection for
  social/porverty component and
  decision-making support analysis (2
                                            Scope of activities/budget support
  workshop including fieldwork and staff
  time supported)                           • October 2010 – project inception
• Develop framework for modelling –         • January 2011 – 1st project workshop in
  domain, ABM (PI and staff time)              Kenya
                                            • September 2011 – field data collection,
                                               supervized by N. Matin
                                            • June 2012 – modelling workshop in
                                               Mombasa, led by Richard Taylor,
                                               Howard Noble
                                            • September 2012 – final workshops –
                                               London, Bangladesh, Kenya
Related/linked projects in the project site
Reef/ecosystem health
• Reef monitoring, 1999 – 2007 (CORDIO), 2006 - ongoing (Kenya Wildlife Service)
• Reef resilience, 2008 – 2012 (CORDIO)

Fisheries
• Catch monitoring, ongoing (Fisheries Dept, KMFRI); 1998 – 2006 (CORDIO)
• Fish spawning aggregations, 2008 – ongoing (CORDIO)
• Beach Management Units/management aspects, 1999 – ongoing (Fisheries
    Dept., CORDIO, others)

Social adaptive capacity
• Climate hazards, 2007 – ongoing (CORDIO, Meteorology Dept., ICPAC/IGAD)
• Social adaptive capacity 2009 – 2012 (CORDIO, KMFRI, IUCN)

Other livelihood sectors
• Aquaculture (KMFRI, Kwetu)
• Mangroves (KMFRI, Kenya Forestry Service)
• Agriculture (various)
• Adult education (CORDIO, Adult education dept.)
A geographic framework for multi-level data collection


Ecosystems
•      coral reefs
•      seagrasses,
•      mangoves
•      terrestrial systems

Social
•        fishing
•        agriculture
•        tourism
•        Urbanization and
         development
                                      4 km
=> Translated into Beach
Management Unit model
Ecosystem services                                               Poverty Alleviation
Ecosystems are the foundations of goods and services in local to national economies
The reef ecosystem – the primary system in the
Kenya case study
The coral reef ecosystem –

Is highly biodiverse and
biologically productive


                                                 Provides diverse
                                                 resources that
                                                 sustain fisheries
                                                 and other
                                                 economic activities


                                                    Supports many diverse
Provides renewable                                  cultural and aesthetic
physical protection                                 values of coastal societies
for tropical coastlines
These are undermined, for
example by coral bleaching

 Coral bleaching is a tress response – can
 lead to death

 Bleaching is the loss of zooxanthellae
 (commonly 60-90% loss); and/or
 Reduction in photosynthetic pigments in
 zooxanthellae (50-80% loss)


  Bleaching is caused by:
  temperature + UV light
             salinity change
             disease
             sedimentation
             pollution

  Bleaching is patchy because:
     • Susceptibility differs by species
       & location
     • Some areas are resistant or
       resilient
From organism/ecological impacts to ecosystem services
Functions within the          Functions at the community
coral-algal symbiosis; e.g.   level; e.g. habitat creation,
reproduction, growth –        nutrient cycling, microbial
‘local’ or small scale        metabolism                      Wild et al. 2011
impacts
A primary interest is on fish – fisheries
A big unknown – climate impacts on fish translating into impacts
on fisheries/food production
- Direct effects on fish biology
- Population/community level shifts                                Sumaila et al, 2011
- Extinction risk


The main reef fishery
species not so
vulnerable to climate
change


But no studies have
been done on this in
the WIO
Potential modelling framework                                        A) Unexploited resource
                                                             Multi-species, full size range, full biomass
                                                             Also – coral/algae as community indicators
                                          INDICATORS
                                          # species, biomass, size

                                                  r0
                                                             r1


                                                             B) Sustainably exploited resource
                                                            Multi-species, full size range, lower biomass


                                Fishers
                                Gears                             C) Over-exploited resource
                                Effort                       Fewer-species, smaller sizes, low biomass


                                                                      D) Degraded resource
                                                                  Few-species, small, very low biomass
Temperature – wind – rain
                                             The broader IO is warming at approx. 0.1oC
                                             per decade, with some hotspots (Red Sea,
                                             Gulf of Aden, Arabian Sea, SW Madagascar)


Decadal trend in SST (sea surface
temperature) – Rouault, pers. comm.

                                             Increased wind stress may result in higher
                                             rainfall over the ocean, but less inland (East
                                             Africa).


                                             But stronger ENSO/IOD signals dominate the
                                             pattern, with increased rainfall in the short
                                             rains and decreased rainfall in the long rains.
Decadal trend in surface windstress in the
Indian Ocean. Backeberg et al. 2012.
Rainfall patterns already changing
Source: Tanzania Meteorological Dept
Majambo Jarurmani, MSc, Univ. of
Cape Town/CORDIO


                                         Long rains – March-May, not
                                         much change


                                       Short rains – October -
                                       December, increasing dry
                                       spells.

                                       But long range forecast is for
                                       more rain in the short rains
                                       and less in the long rains
In what ways are coastal
communities vulnerable to                     Human
climate change?
                                     Social           Financial

Social vulnerability analysis – to
various climate factors (rain,
temp, seasons)
                                       Natural    Physical
Embed this process in a
Sustainable Livelihoods Approach
(SLA) and Sustainable Livelihoods
Enhancement and Diversification
(SLED) framework
Prioritize climate hazards – existing and potential coping strategies (CRiSTAL)

Fishers vs. farmers (within the same community)
Priority climate hazards

Relevant to all:                   Climate variability, in the language of “the people” …
• High rainfall/floods
• Strong winds

Relevant to fishers:
• Strong waves

Relevant to farmers/others
• No rainfall/drought/heat


 Distant seconds:
 - Coral bleaching
 - Mangrove recession/erosion
 - Fishery species changes


   We are not looking at the right things!
Climate hazard - forecasting
  WIO bleaching product, CORDIO
  www.cordioea.net/bleachingalert

 1) Global indicators
 2) Regional/inter-annual variability
    indicators
 3) 2-week to monthly forward
 4) Present state of SST, clouds etc.

                                                                     Three alert levels:
                                                                     1. ‘watch’
                                                                     2. Moderate bleaching
                                                                     3. Strong bleaching


          January            February           March        April           May       June
Prepare for implementation      Regular alerts and monitor                              Assess impact &
                                                              Assess coral bleaching
     of response plan             conditions in the field                                  recovery
How well does it work?

 Performance tests:
 1. Accuracy
 2. Probability of detection
 3. Critical success index
 4. Pierces's skill score
 5. Probability of false detection
 6. False alarm
 7. Bias
                                                                  Three alert levels:
                                                                  1. ‘watch’
                                                                  2. Moderate bleaching
 Findings:
 1.   Good performance of         Next steps:
                                                                  3. Strong bleaching
      level 2 (moderate           1.   Expand the relevance
      bleaching) and level 3           by covering primary
      (strong bleaching)               hazards to coastal
      forecasts                        communities – storms,
                                       rainfall, dry/wet spells
 2.   With higher number of
      subregions, problem is of   2.   Partnership with
      network reports of –             regional climate
      OBSERVED RESULTS                 institutes (ICPAC –
                                       Greater Horn of Africa),
                                       UNESCO-IOC, national
                                       meterological depts.
Informed decision-making
These provide the ecosystem/resource foundation or
basis for deeper analysis of the primary social work –
• Participatory approaches - decision mapping,
   poverty analyses, etc.
• Information layers for models - BMU Agent Based
   Model


              Pointers to next steps –
              Assessment of Key Ecosystem Services for integrated coastal zone management
              planning for Poverty Alleviation (AKESPA)

              • Produce an integrated coastal zone management (ICZM)
                framework
              • Use it to identify (and collect/derive) ‘missing’ data relating to
                ecosystem functioning, services, and benefit
              • Multiple modelling approaches (modules – GIS (spatial, structure),
                stock-flow (Stella), agents (NetLogo)
              • Simplicity/elegance of indicators, and relationships between
                different modules in the GIS/models

The necessity of a multi-level framework for understanding coastal management. By Dr. David Obura from CORDIO

  • 1.
    WD-NACE data gatheringapproach #2 – ECOSYSTEM HEALTH The necessity of a multi-level framework for understanding coastal management David Obura with Stephen Oluoch, Brigid Mibei, Innocent 27th September 2012 London, UK Wanyonyi, Risper Oteke CORDIO East Africa; www.cordioea.net; dobura@cordioea.net Principal partner – Kenya Marine and Fisheries Research Institute Dr. Renison Ruwa, Khyria Karama, Emmanual Mbaru, Stephen Mwakiti
  • 2.
    Outline 1. CORDIO (partner)description 2. Project context 3. Ecosystem services • Ecosystem (coral reefs) • Fisheries/resources • Modeling approach 4. Climate change 5. Social resilience 6. Informing decision-making • Forecasting hazards/threats • Agent-based modelling • Next steps – APESKA
  • 3.
  • 4.
    • CORDIO project/network- Initiated in 1999 as a direct response to the 1998 El-Nino = caused mass bleaching & mortality of corals in Indian Ocean. • CORDIO East Africa - registered in Kenya in 2003 as a non-profit company, based in Mombasa, Kenya • Focus on coral reefs – biological, resource use, socio-economic, management, policy, education • Conservation of marine and coastal ecosystems in WIO • Generating knowledge to find solutions that benefit both ecosystems and people.
  • 5.
    Project scope Kenya activities •Characterize the marine environment (for understanding ecosystem services at the project site), based on existing information (PI time) • Support data collection for social/porverty component and decision-making support analysis (2 Scope of activities/budget support workshop including fieldwork and staff time supported) • October 2010 – project inception • Develop framework for modelling – • January 2011 – 1st project workshop in domain, ABM (PI and staff time) Kenya • September 2011 – field data collection, supervized by N. Matin • June 2012 – modelling workshop in Mombasa, led by Richard Taylor, Howard Noble • September 2012 – final workshops – London, Bangladesh, Kenya
  • 6.
    Related/linked projects inthe project site Reef/ecosystem health • Reef monitoring, 1999 – 2007 (CORDIO), 2006 - ongoing (Kenya Wildlife Service) • Reef resilience, 2008 – 2012 (CORDIO) Fisheries • Catch monitoring, ongoing (Fisheries Dept, KMFRI); 1998 – 2006 (CORDIO) • Fish spawning aggregations, 2008 – ongoing (CORDIO) • Beach Management Units/management aspects, 1999 – ongoing (Fisheries Dept., CORDIO, others) Social adaptive capacity • Climate hazards, 2007 – ongoing (CORDIO, Meteorology Dept., ICPAC/IGAD) • Social adaptive capacity 2009 – 2012 (CORDIO, KMFRI, IUCN) Other livelihood sectors • Aquaculture (KMFRI, Kwetu) • Mangroves (KMFRI, Kenya Forestry Service) • Agriculture (various) • Adult education (CORDIO, Adult education dept.)
  • 7.
    A geographic frameworkfor multi-level data collection Ecosystems • coral reefs • seagrasses, • mangoves • terrestrial systems Social • fishing • agriculture • tourism • Urbanization and development 4 km
  • 8.
    => Translated intoBeach Management Unit model
  • 9.
    Ecosystem services  Poverty Alleviation Ecosystems are the foundations of goods and services in local to national economies
  • 10.
    The reef ecosystem– the primary system in the Kenya case study The coral reef ecosystem – Is highly biodiverse and biologically productive Provides diverse resources that sustain fisheries and other economic activities Supports many diverse Provides renewable cultural and aesthetic physical protection values of coastal societies for tropical coastlines
  • 11.
    These are undermined,for example by coral bleaching Coral bleaching is a tress response – can lead to death Bleaching is the loss of zooxanthellae (commonly 60-90% loss); and/or Reduction in photosynthetic pigments in zooxanthellae (50-80% loss) Bleaching is caused by: temperature + UV light salinity change disease sedimentation pollution Bleaching is patchy because: • Susceptibility differs by species & location • Some areas are resistant or resilient
  • 12.
    From organism/ecological impactsto ecosystem services Functions within the Functions at the community coral-algal symbiosis; e.g. level; e.g. habitat creation, reproduction, growth – nutrient cycling, microbial ‘local’ or small scale metabolism Wild et al. 2011 impacts
  • 13.
    A primary interestis on fish – fisheries A big unknown – climate impacts on fish translating into impacts on fisheries/food production - Direct effects on fish biology - Population/community level shifts Sumaila et al, 2011 - Extinction risk The main reef fishery species not so vulnerable to climate change But no studies have been done on this in the WIO
  • 14.
    Potential modelling framework A) Unexploited resource Multi-species, full size range, full biomass Also – coral/algae as community indicators INDICATORS # species, biomass, size r0 r1 B) Sustainably exploited resource Multi-species, full size range, lower biomass Fishers Gears C) Over-exploited resource Effort Fewer-species, smaller sizes, low biomass D) Degraded resource Few-species, small, very low biomass
  • 15.
    Temperature – wind– rain The broader IO is warming at approx. 0.1oC per decade, with some hotspots (Red Sea, Gulf of Aden, Arabian Sea, SW Madagascar) Decadal trend in SST (sea surface temperature) – Rouault, pers. comm. Increased wind stress may result in higher rainfall over the ocean, but less inland (East Africa). But stronger ENSO/IOD signals dominate the pattern, with increased rainfall in the short rains and decreased rainfall in the long rains. Decadal trend in surface windstress in the Indian Ocean. Backeberg et al. 2012.
  • 16.
    Rainfall patterns alreadychanging Source: Tanzania Meteorological Dept Majambo Jarurmani, MSc, Univ. of Cape Town/CORDIO Long rains – March-May, not much change Short rains – October - December, increasing dry spells. But long range forecast is for more rain in the short rains and less in the long rains
  • 17.
    In what waysare coastal communities vulnerable to Human climate change? Social Financial Social vulnerability analysis – to various climate factors (rain, temp, seasons) Natural Physical Embed this process in a Sustainable Livelihoods Approach (SLA) and Sustainable Livelihoods Enhancement and Diversification (SLED) framework
  • 18.
    Prioritize climate hazards– existing and potential coping strategies (CRiSTAL) Fishers vs. farmers (within the same community)
  • 19.
    Priority climate hazards Relevantto all: Climate variability, in the language of “the people” … • High rainfall/floods • Strong winds Relevant to fishers: • Strong waves Relevant to farmers/others • No rainfall/drought/heat Distant seconds: - Coral bleaching - Mangrove recession/erosion - Fishery species changes We are not looking at the right things!
  • 20.
    Climate hazard -forecasting WIO bleaching product, CORDIO www.cordioea.net/bleachingalert 1) Global indicators 2) Regional/inter-annual variability indicators 3) 2-week to monthly forward 4) Present state of SST, clouds etc. Three alert levels: 1. ‘watch’ 2. Moderate bleaching 3. Strong bleaching January February March April May June Prepare for implementation Regular alerts and monitor Assess impact & Assess coral bleaching of response plan conditions in the field recovery
  • 21.
    How well doesit work? Performance tests: 1. Accuracy 2. Probability of detection 3. Critical success index 4. Pierces's skill score 5. Probability of false detection 6. False alarm 7. Bias Three alert levels: 1. ‘watch’ 2. Moderate bleaching Findings: 1. Good performance of Next steps: 3. Strong bleaching level 2 (moderate 1. Expand the relevance bleaching) and level 3 by covering primary (strong bleaching) hazards to coastal forecasts communities – storms, rainfall, dry/wet spells 2. With higher number of subregions, problem is of 2. Partnership with network reports of – regional climate OBSERVED RESULTS institutes (ICPAC – Greater Horn of Africa), UNESCO-IOC, national meterological depts.
  • 22.
    Informed decision-making These providethe ecosystem/resource foundation or basis for deeper analysis of the primary social work – • Participatory approaches - decision mapping, poverty analyses, etc. • Information layers for models - BMU Agent Based Model Pointers to next steps – Assessment of Key Ecosystem Services for integrated coastal zone management planning for Poverty Alleviation (AKESPA) • Produce an integrated coastal zone management (ICZM) framework • Use it to identify (and collect/derive) ‘missing’ data relating to ecosystem functioning, services, and benefit • Multiple modelling approaches (modules – GIS (spatial, structure), stock-flow (Stella), agents (NetLogo) • Simplicity/elegance of indicators, and relationships between different modules in the GIS/models

Editor's Notes

  • #5 CORDIO started in 1999 as a regional network withcoordination nodes in Sweden, Kenya, Sri Lankaand SeychellesCORDIO East Africa… not‐for‐profit research organisation.
  • #21 Mainly note that the alert is available on the website and each two-week update is sent an email list.Observations start at the beginning of the bleaching season, and end in May/June depending on the severity of bleaching.
  • #22 Past year’s alerts are being analyzed in three geographic belts – south, central and north.Accuracy of the alerts can be analysed by coding them, and coding the bleaching observations reported …Graphs of the alert levels by month, and bleachaing observations by month …