Download as PDF, PPTX
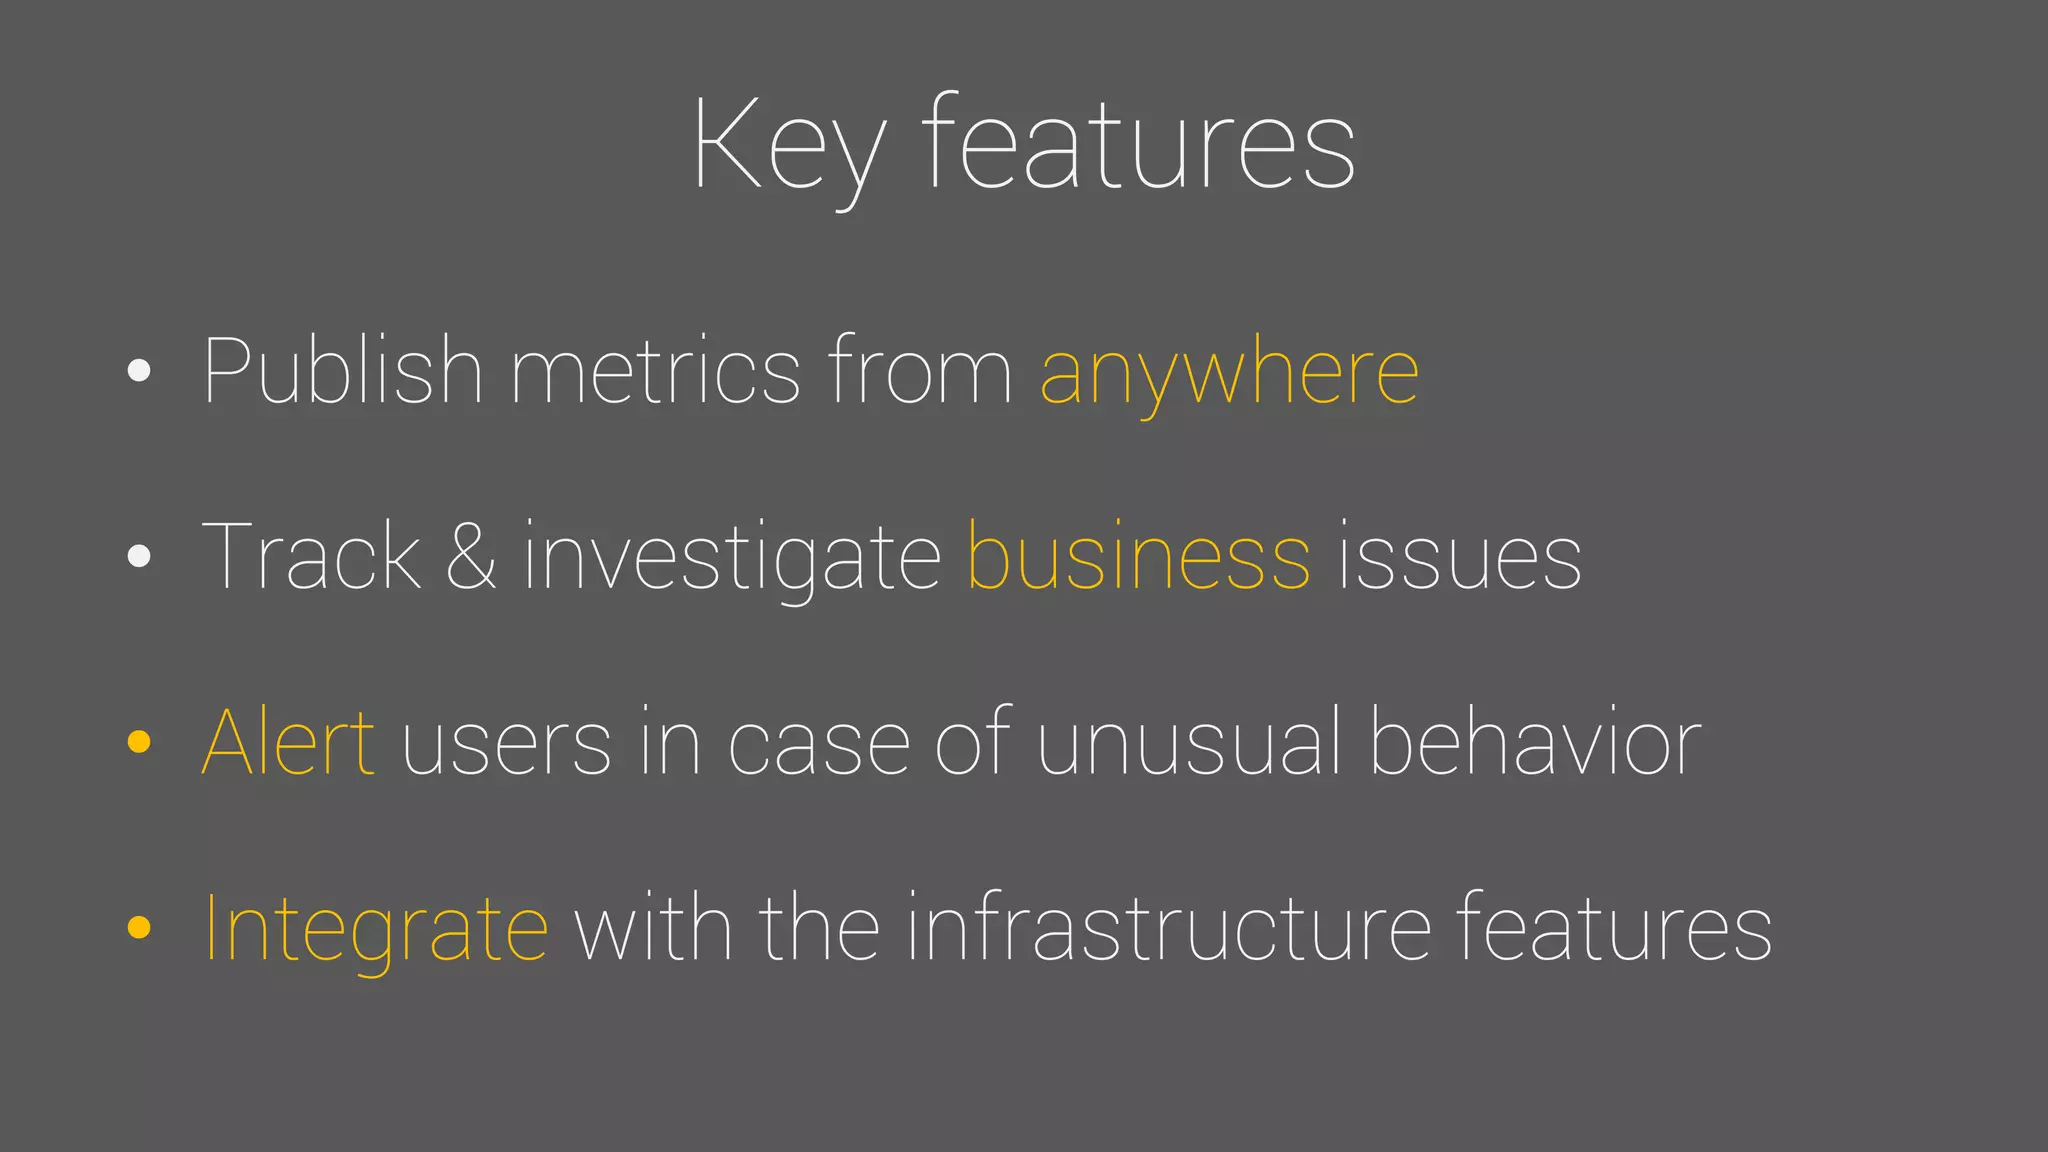
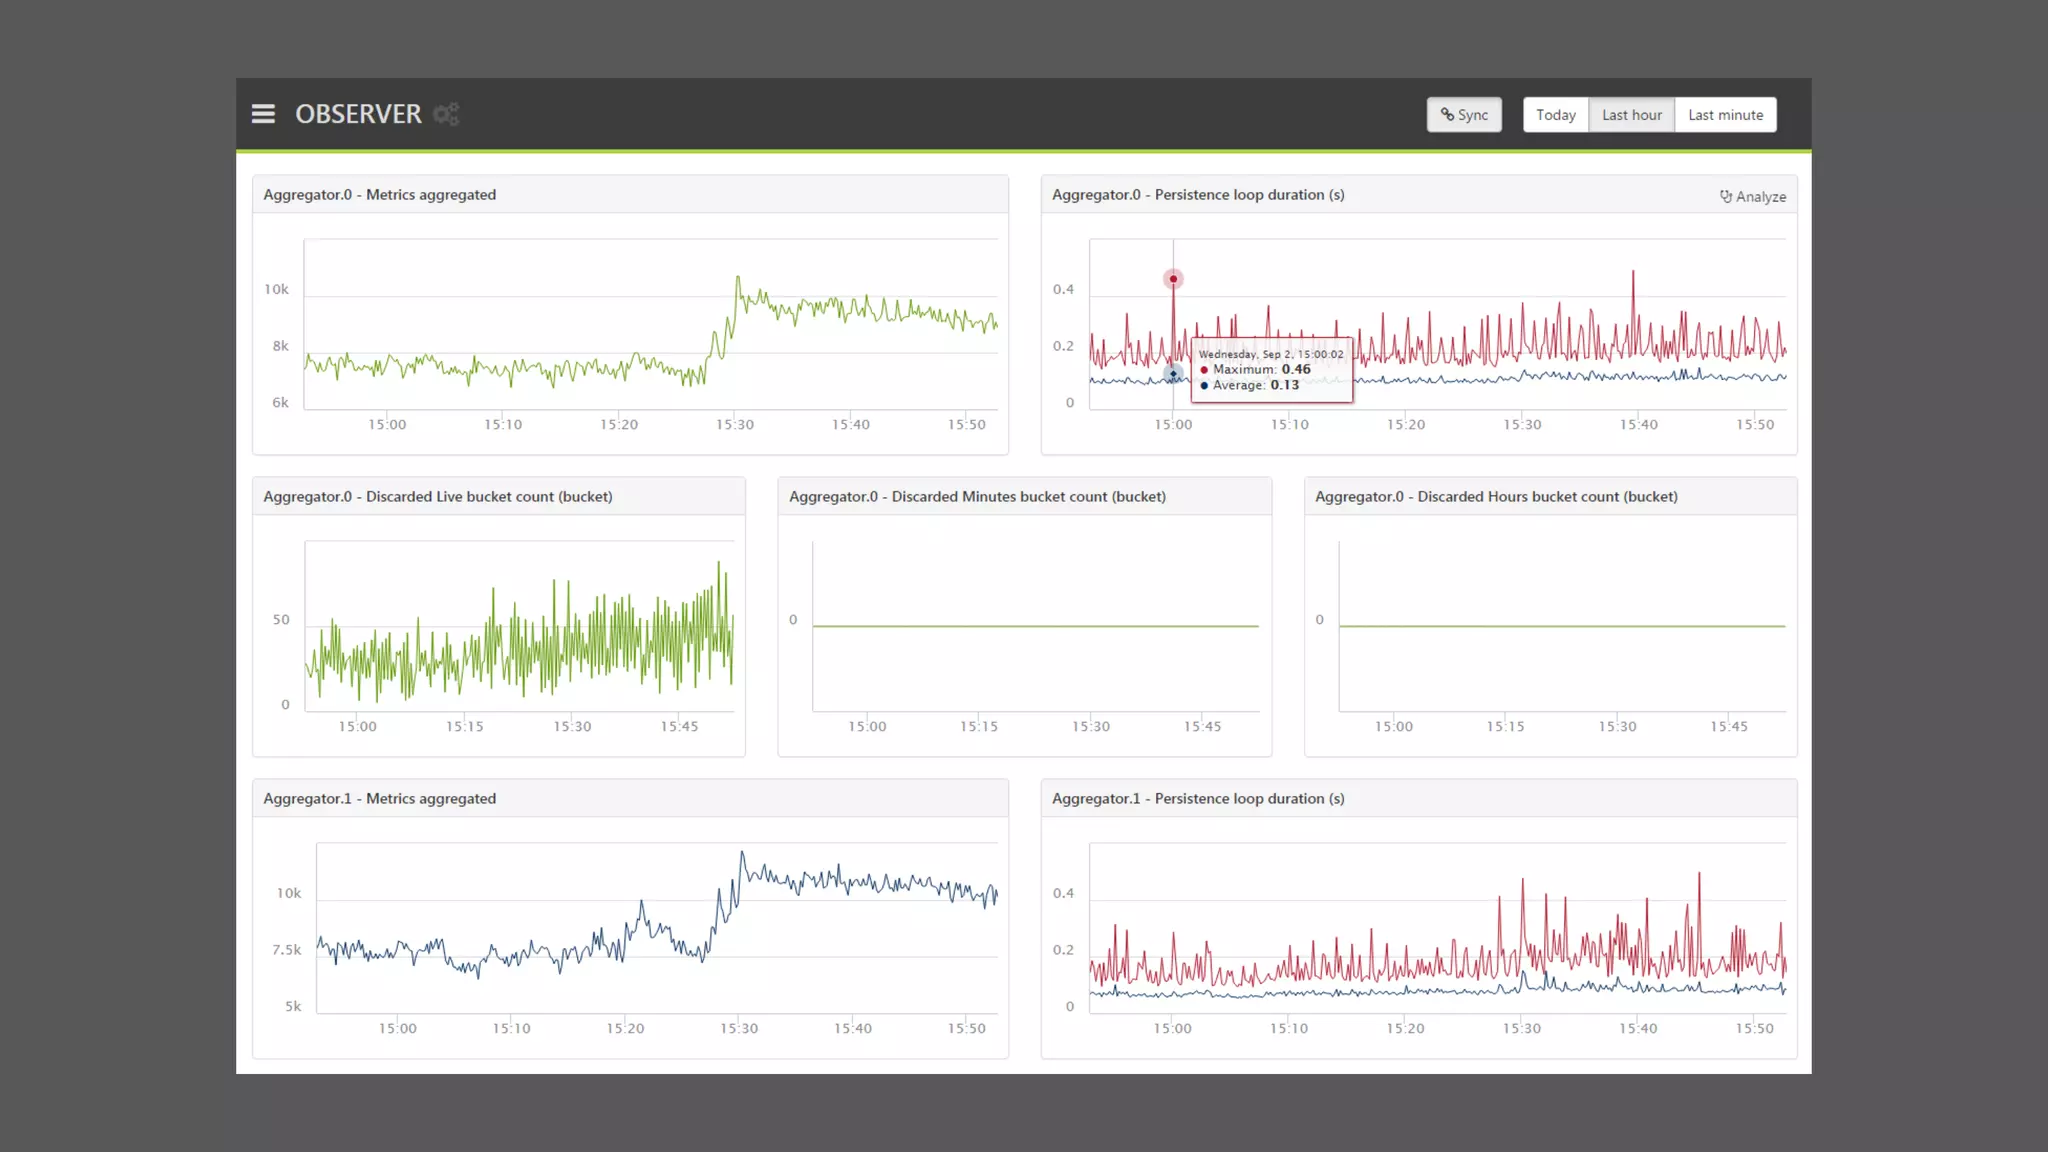
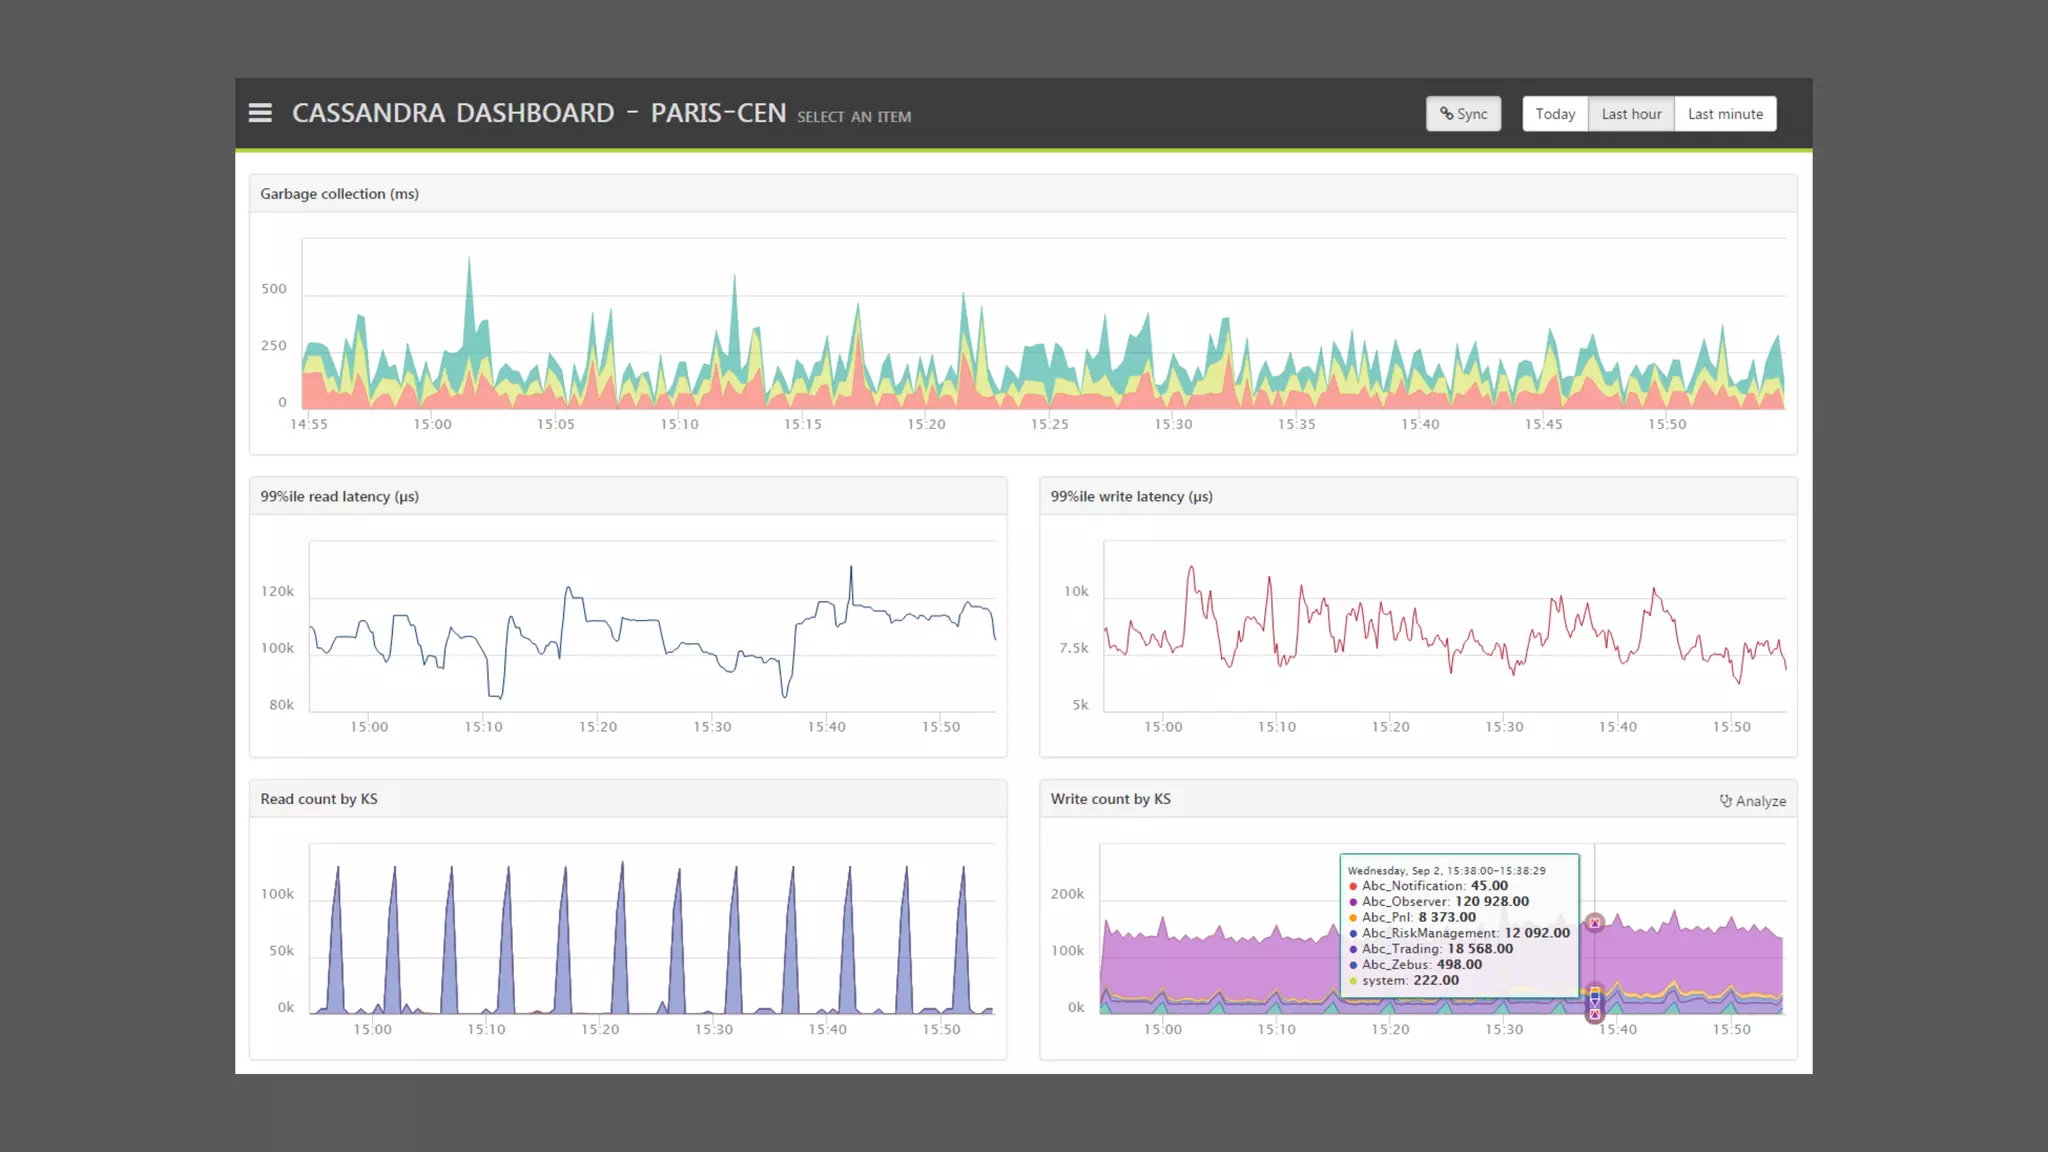
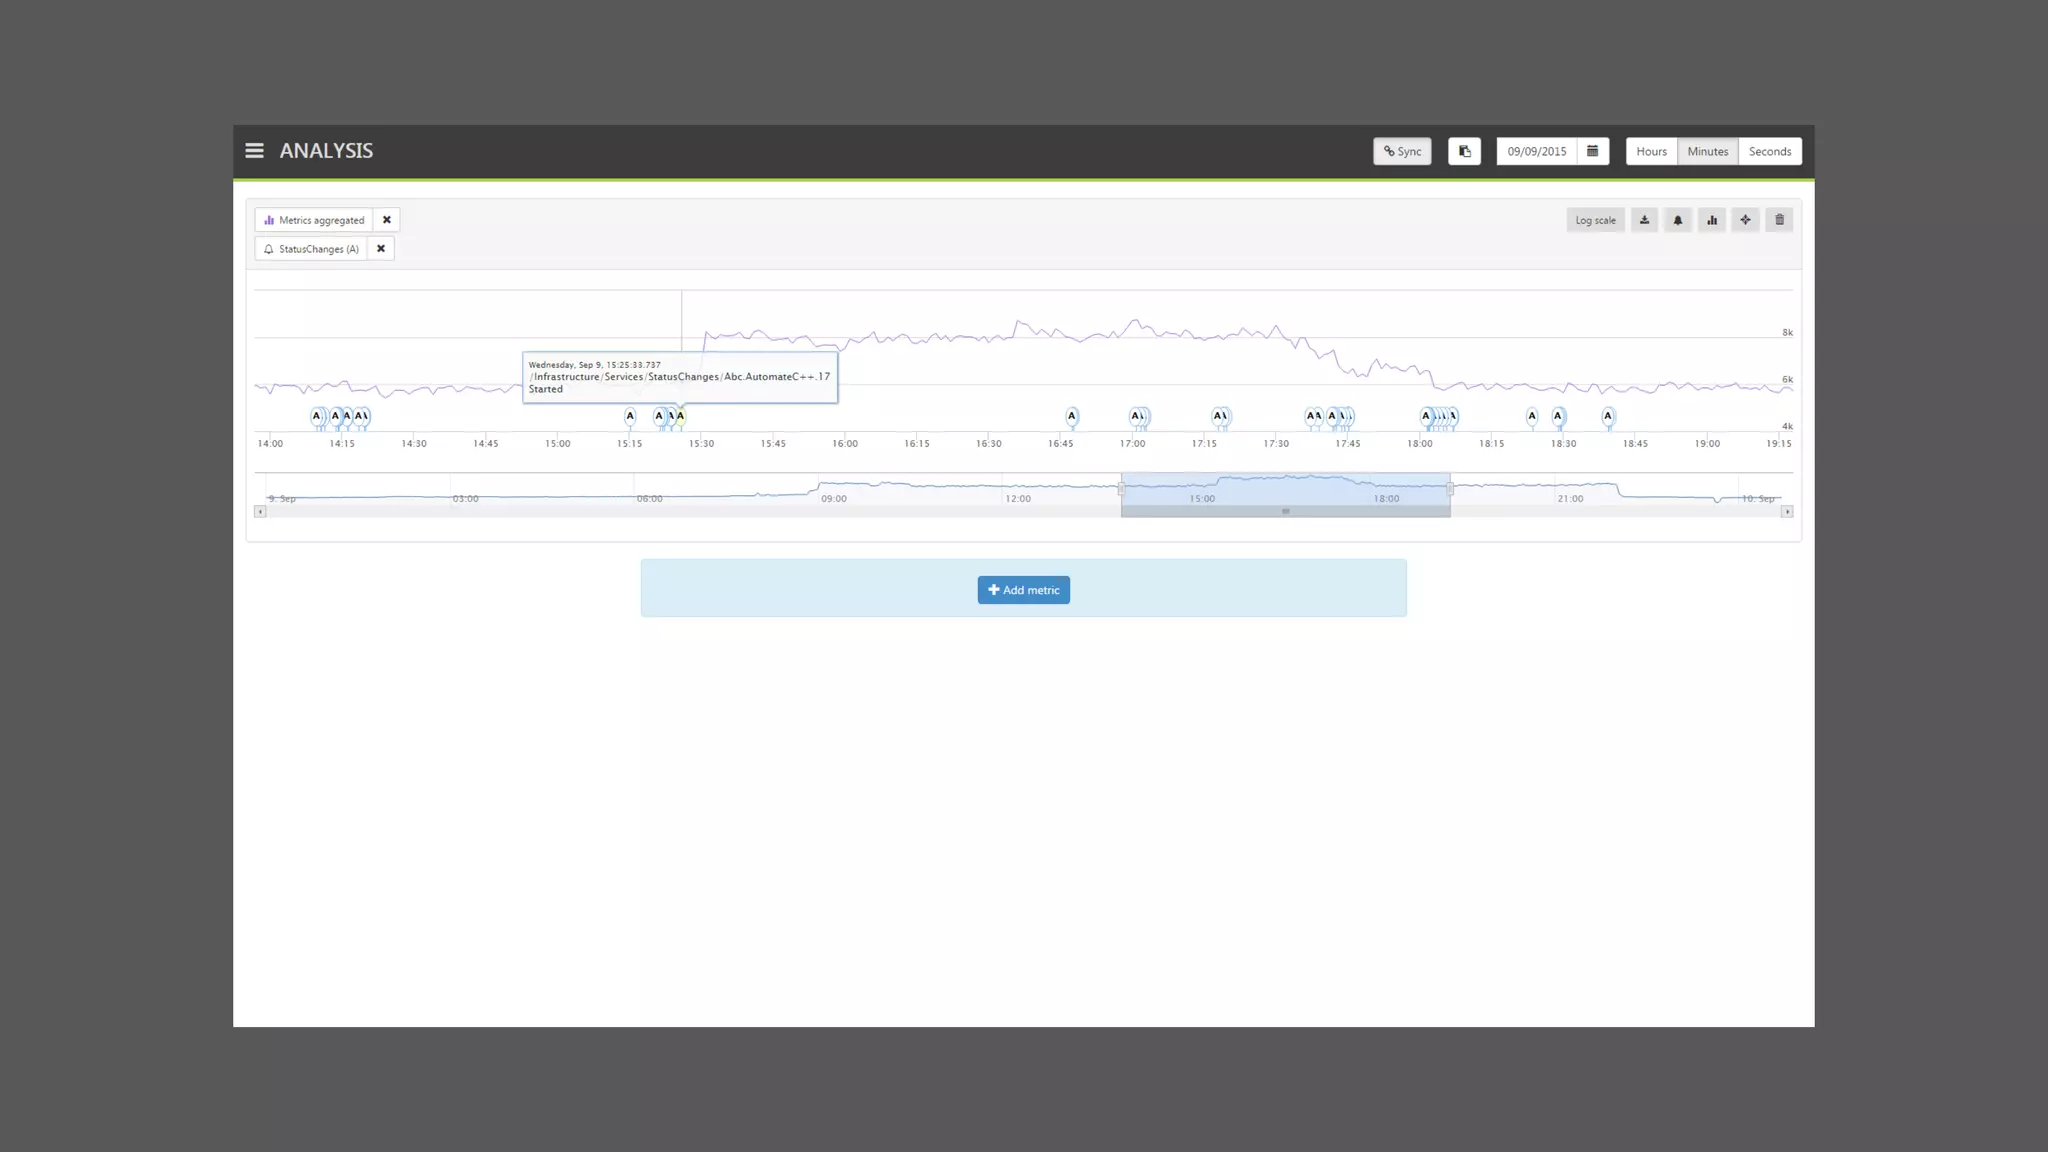

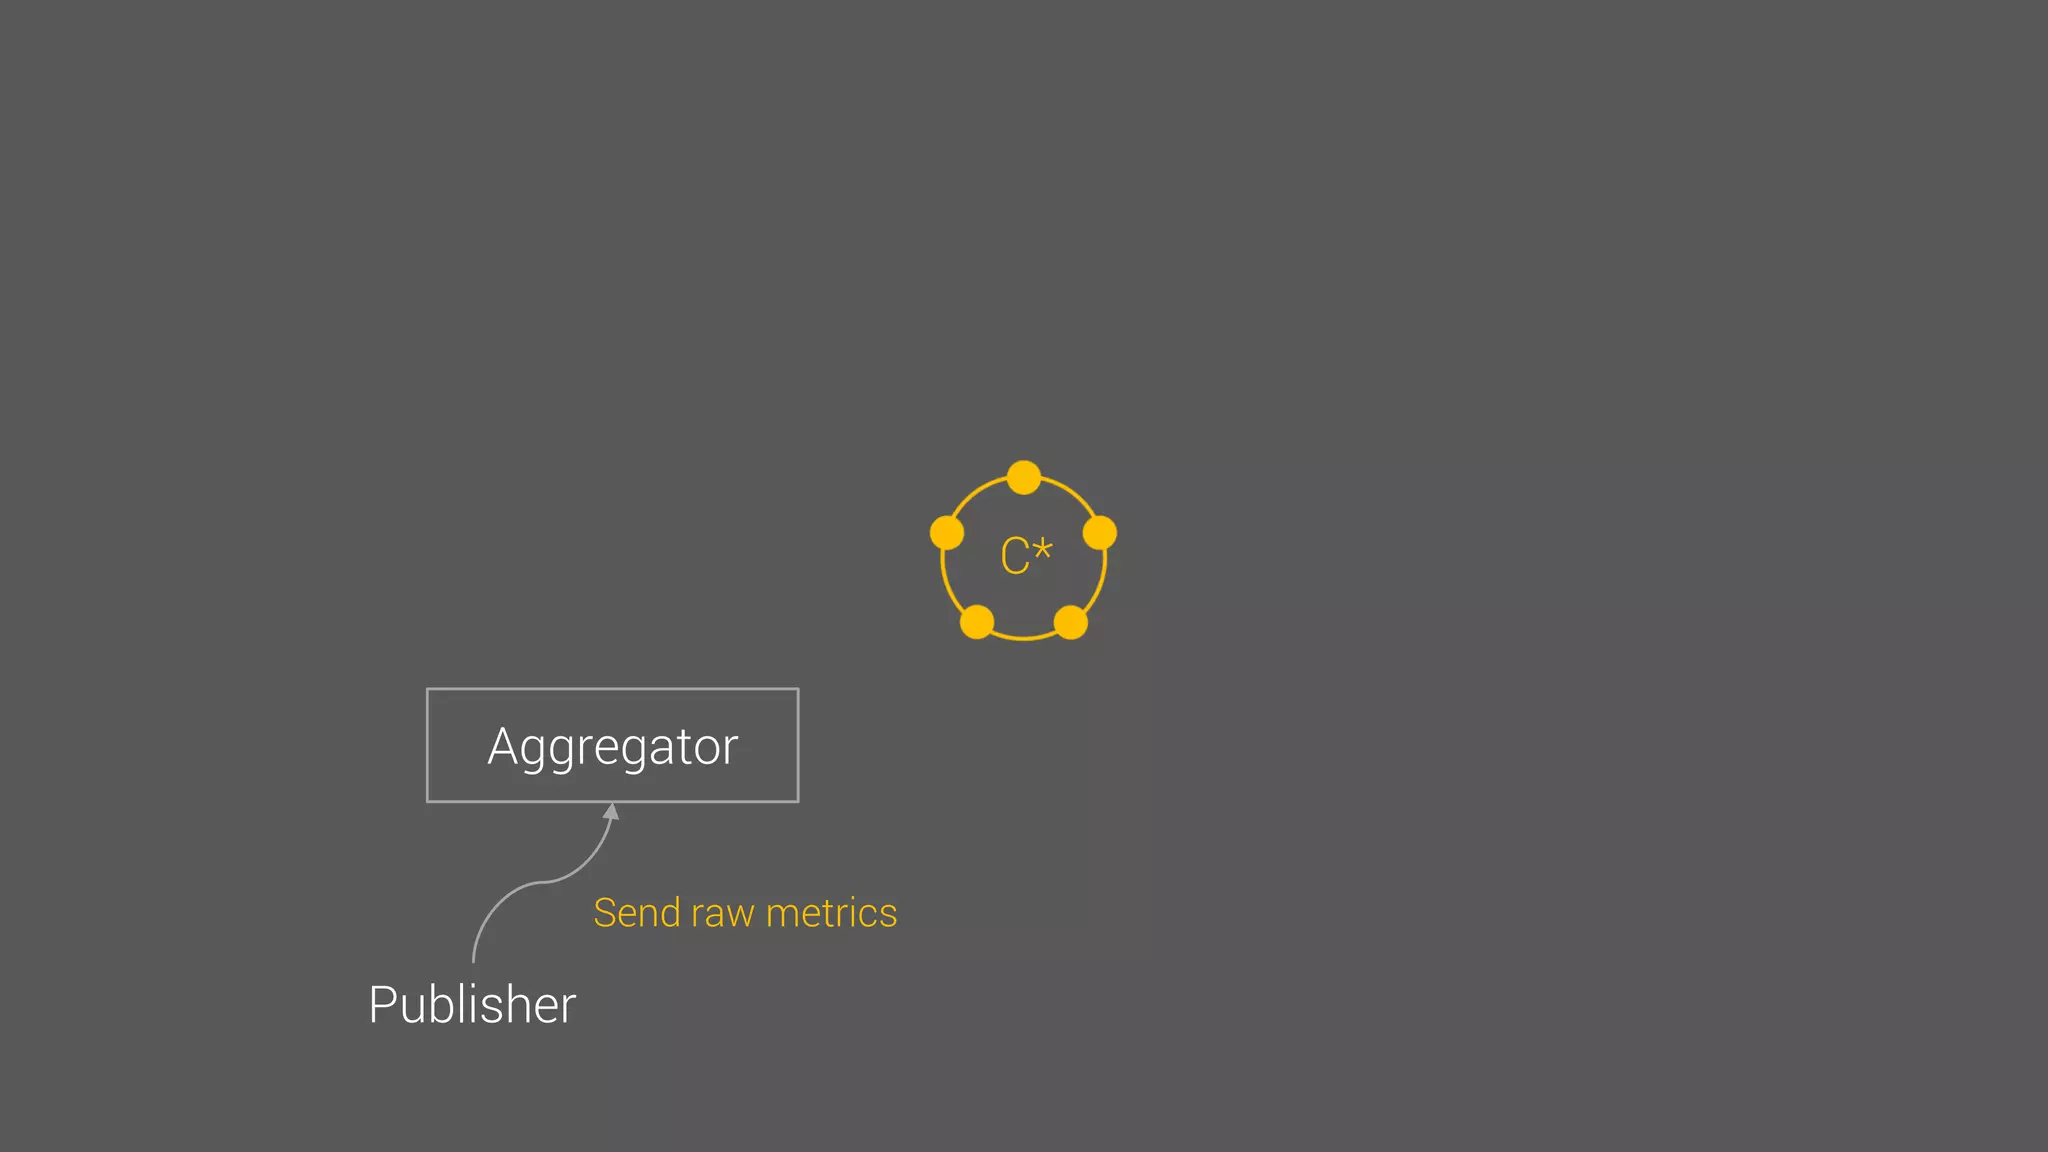
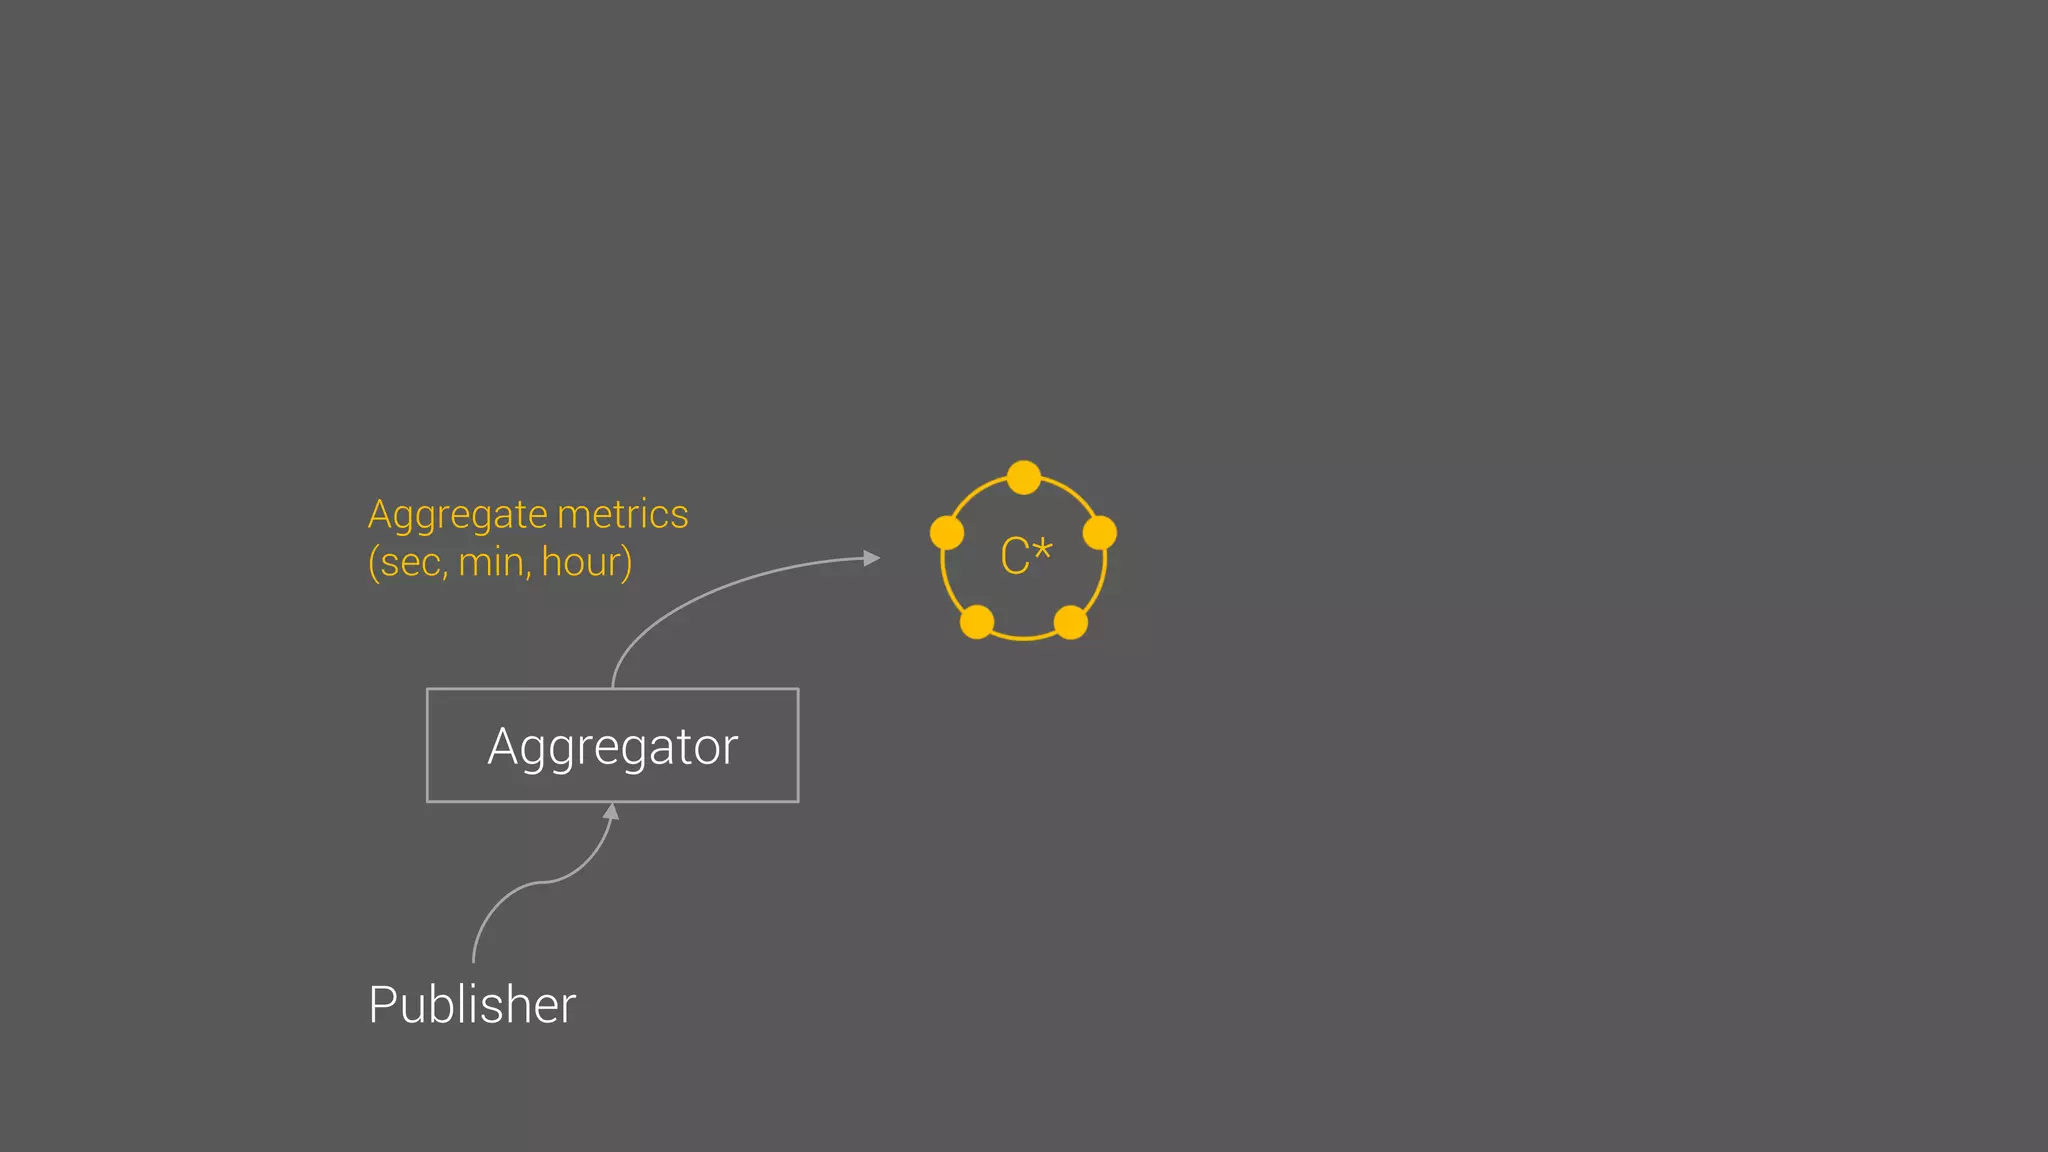
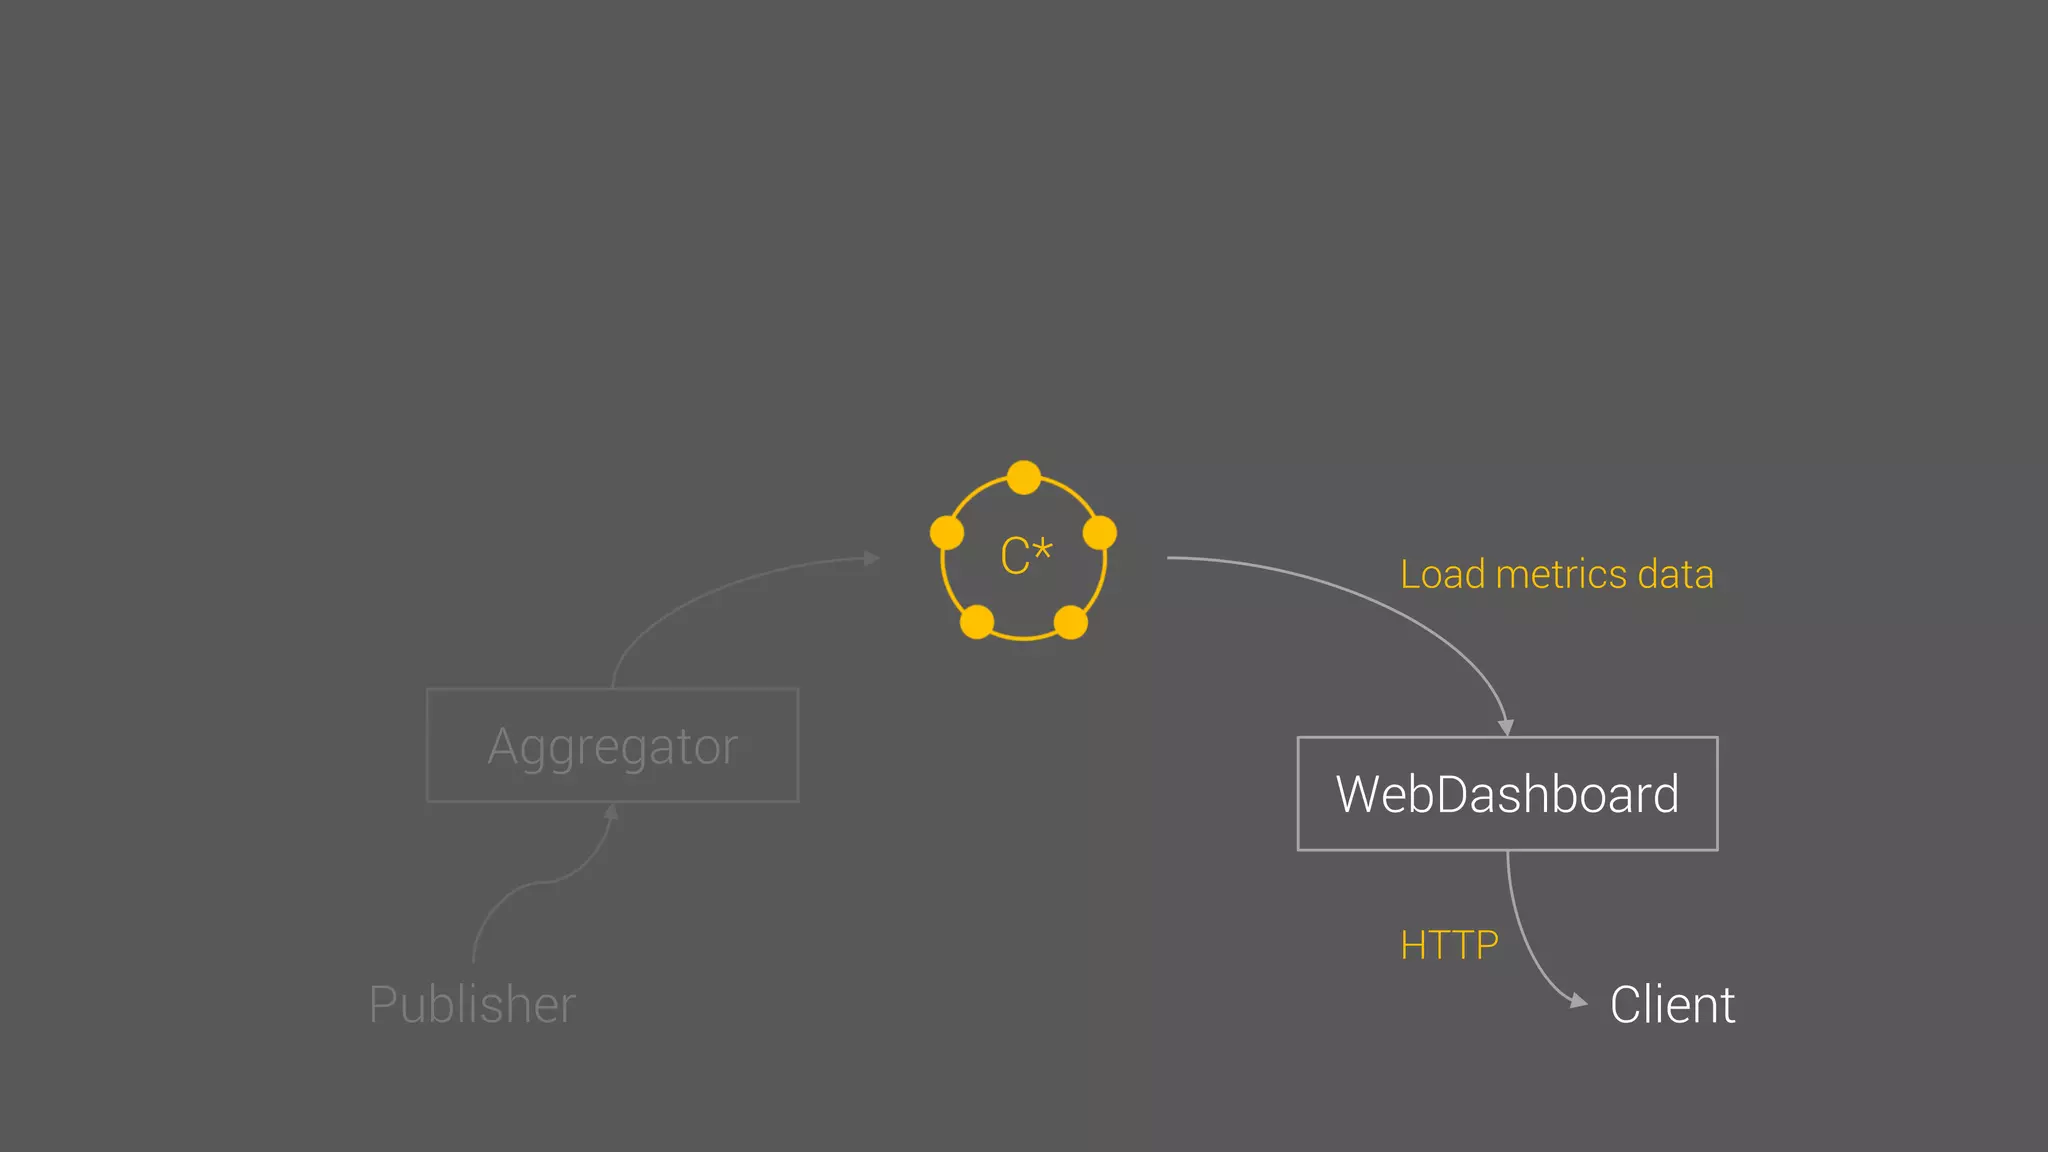
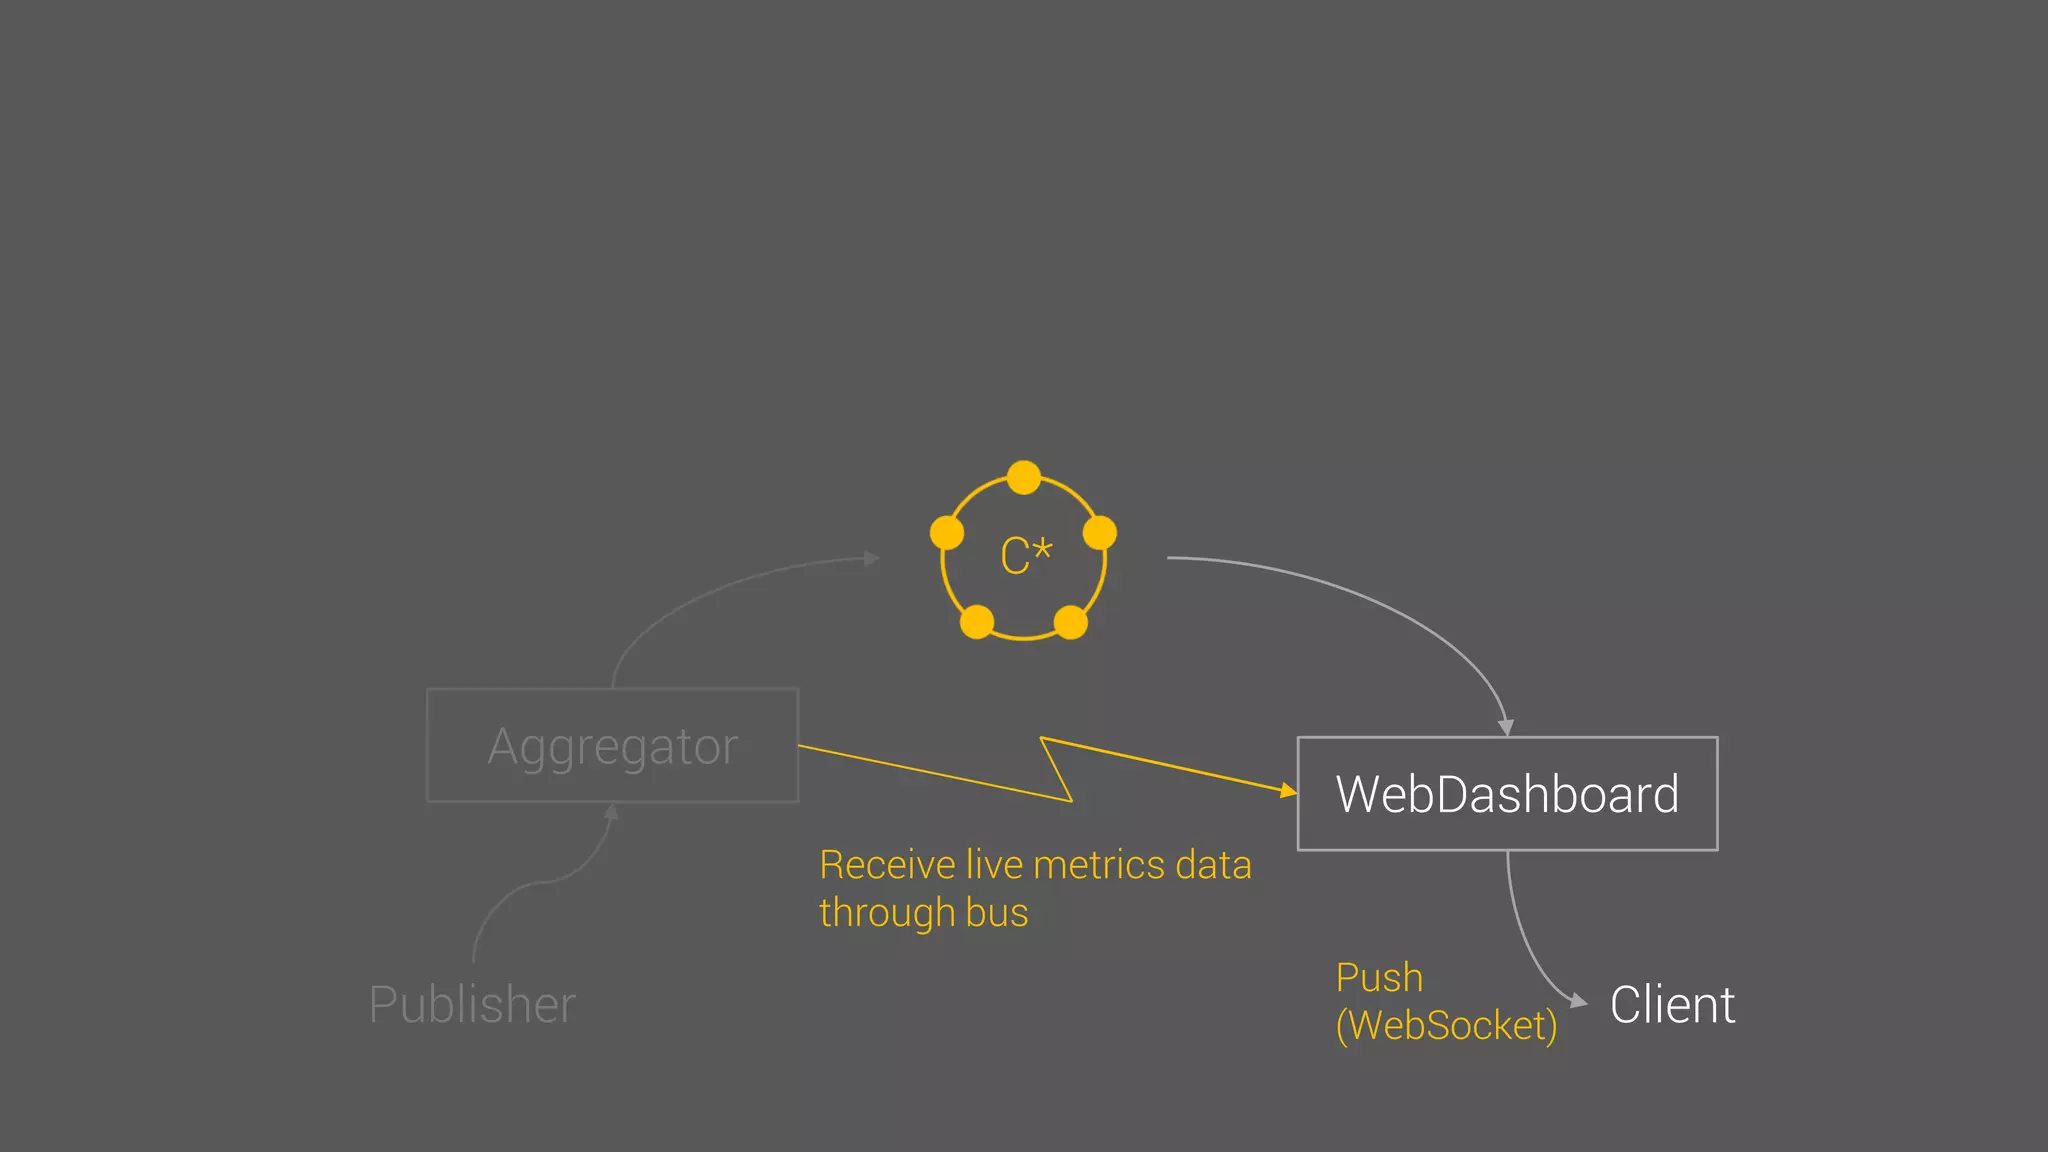
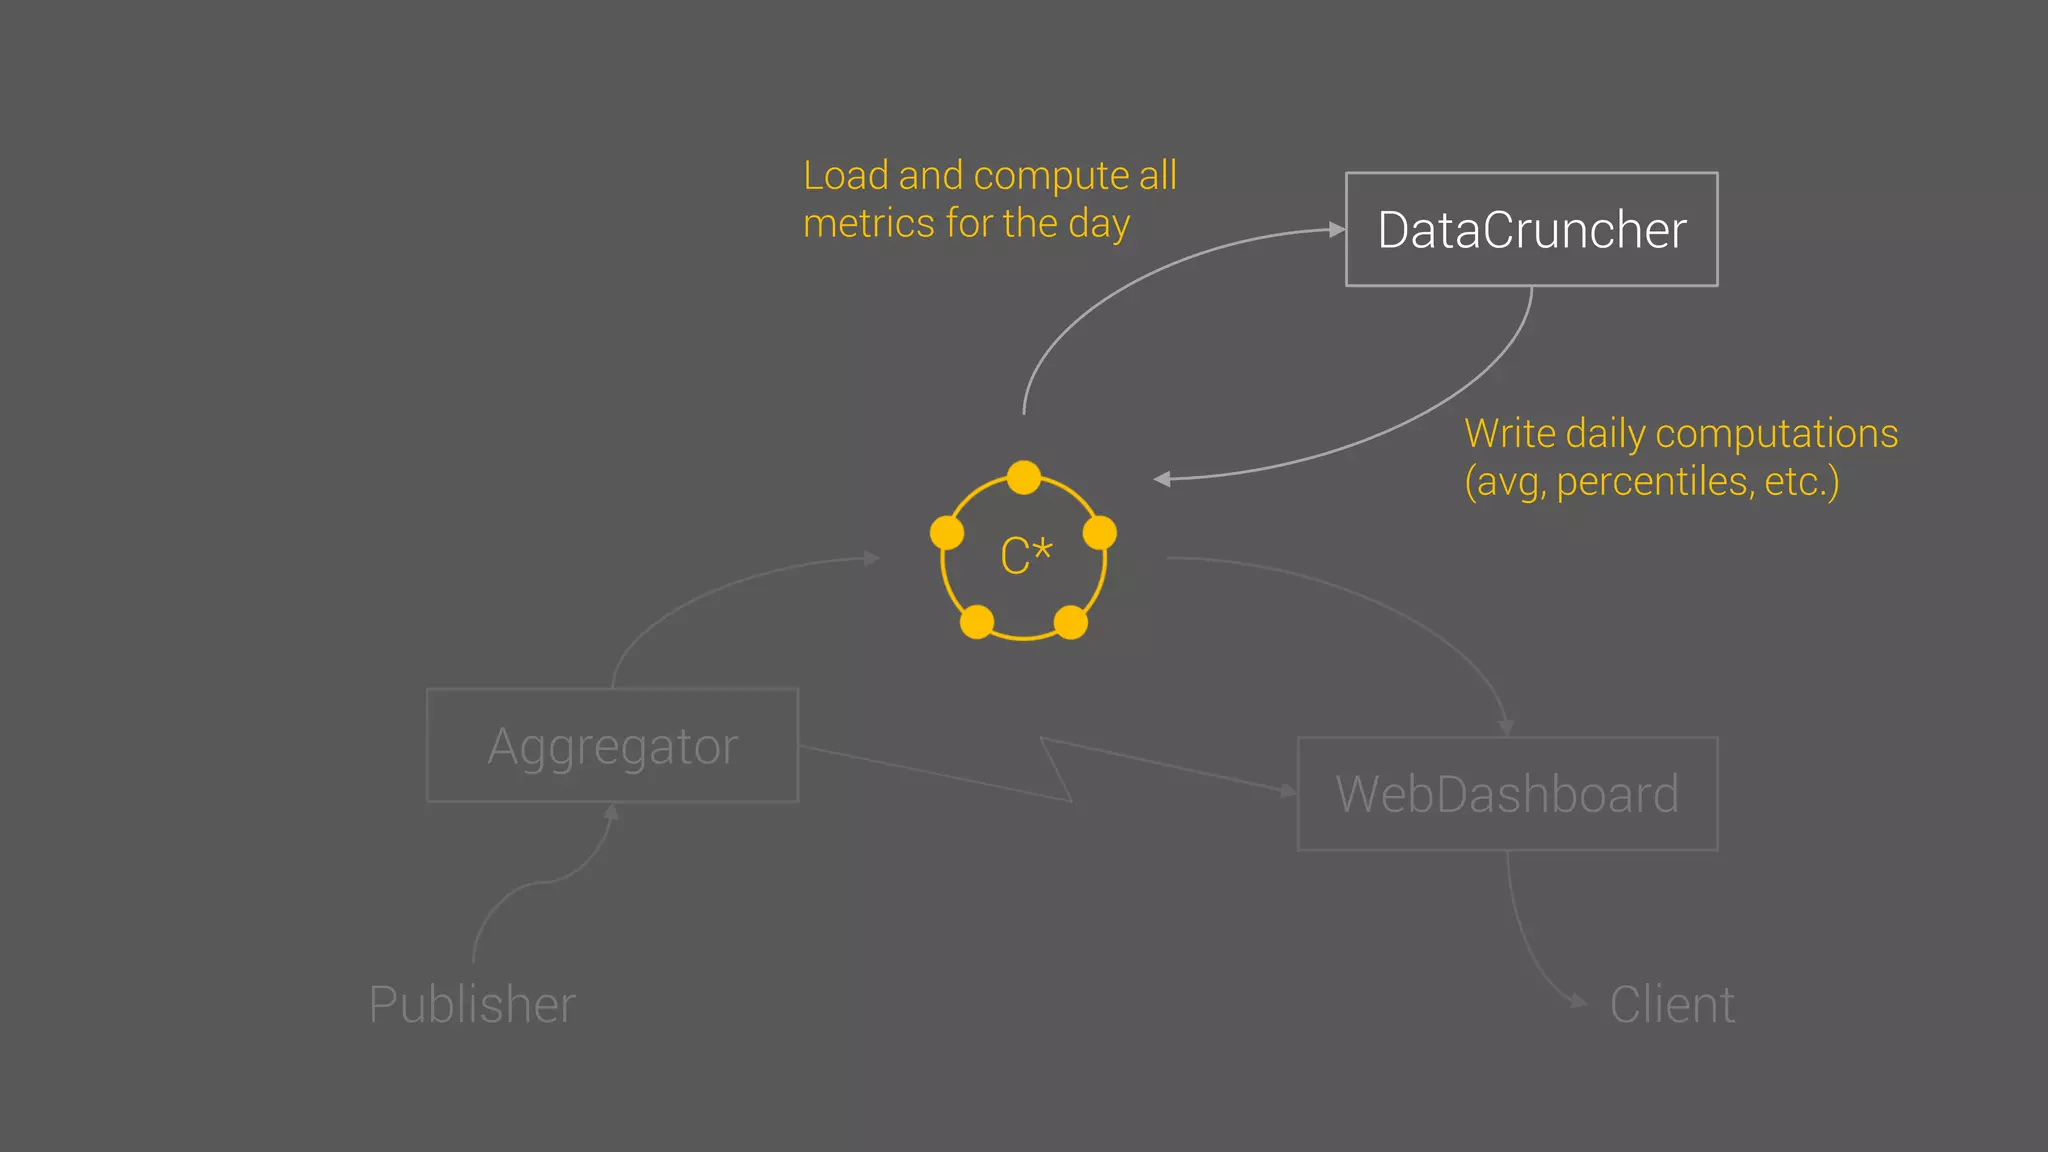
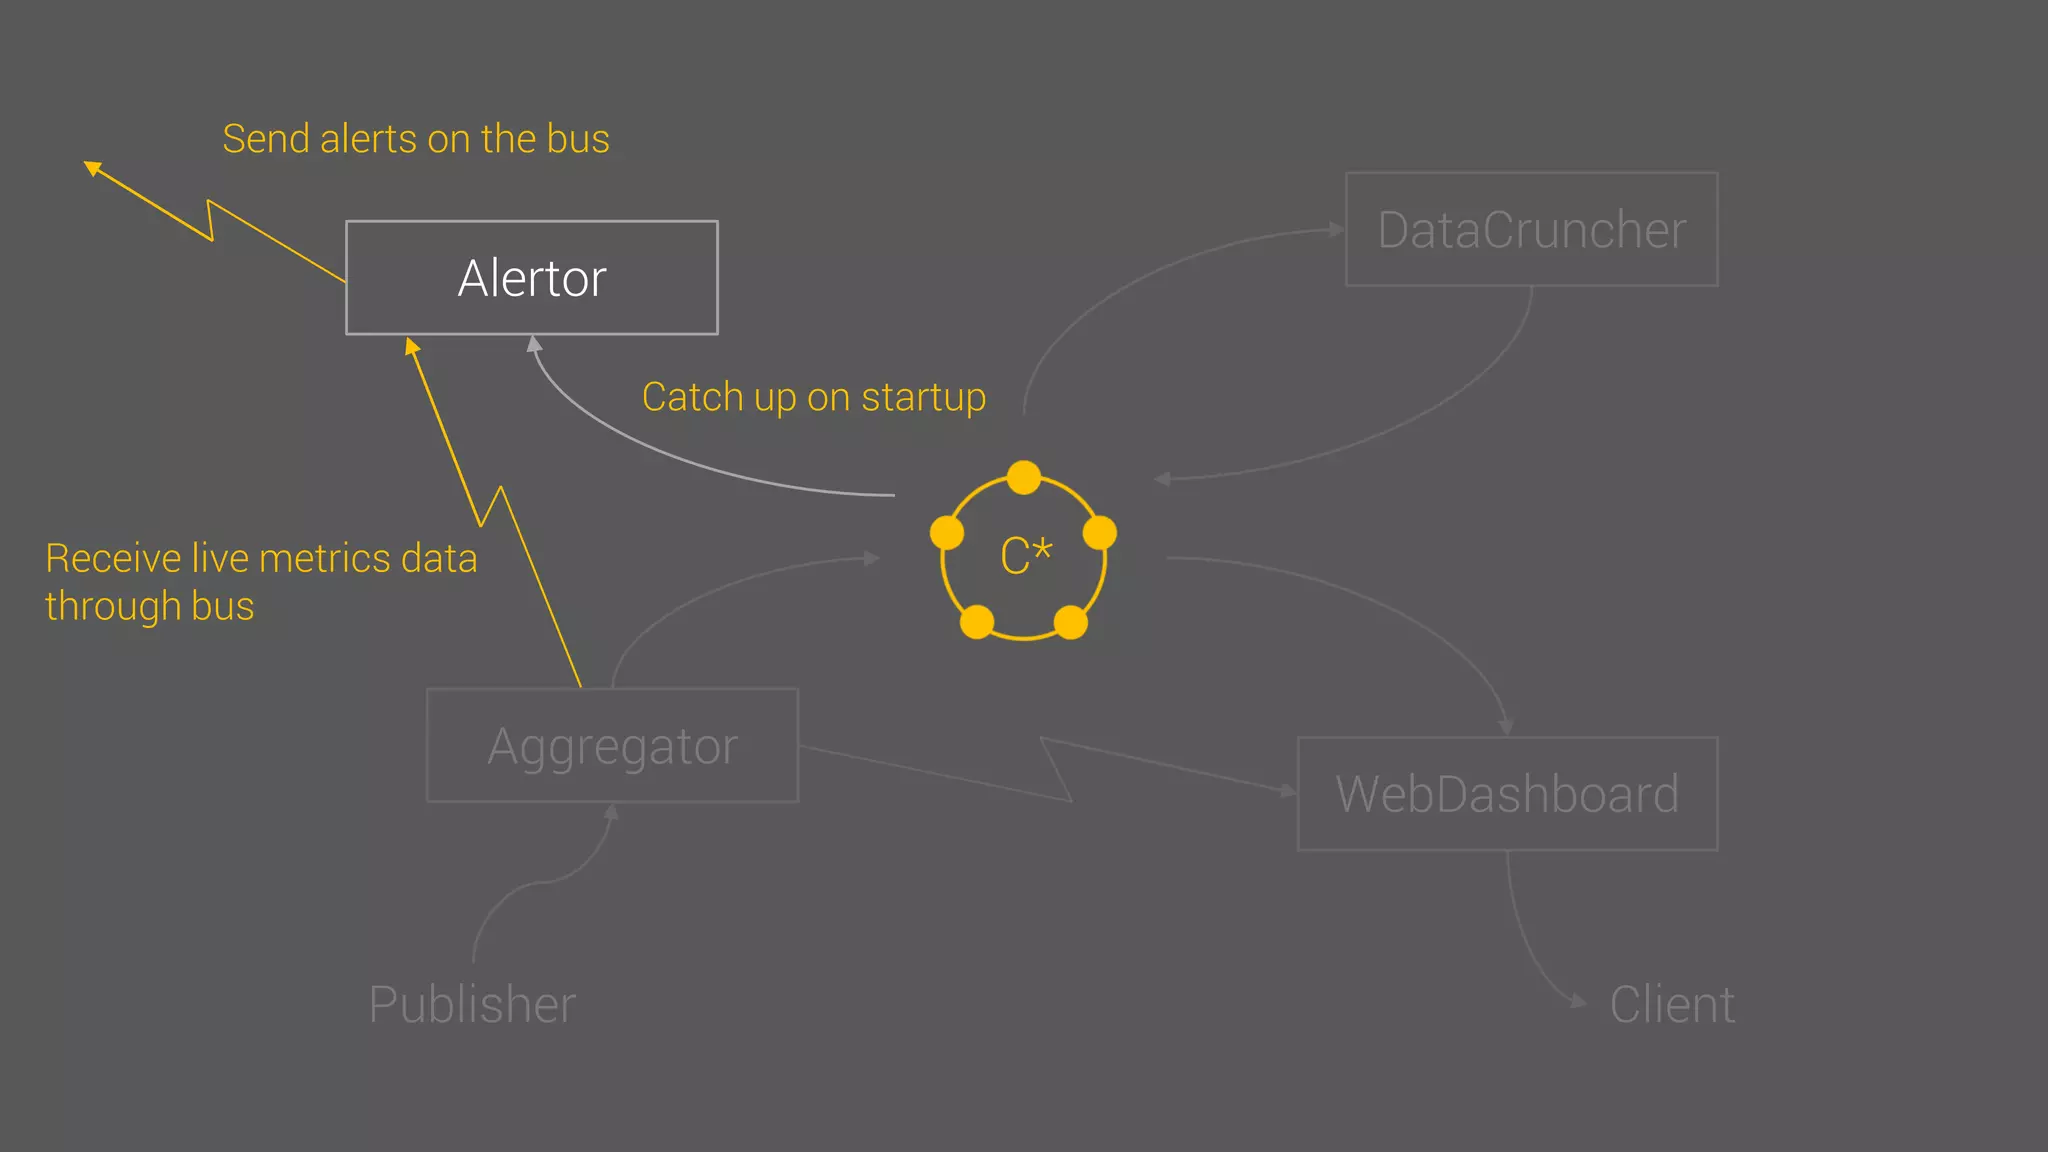
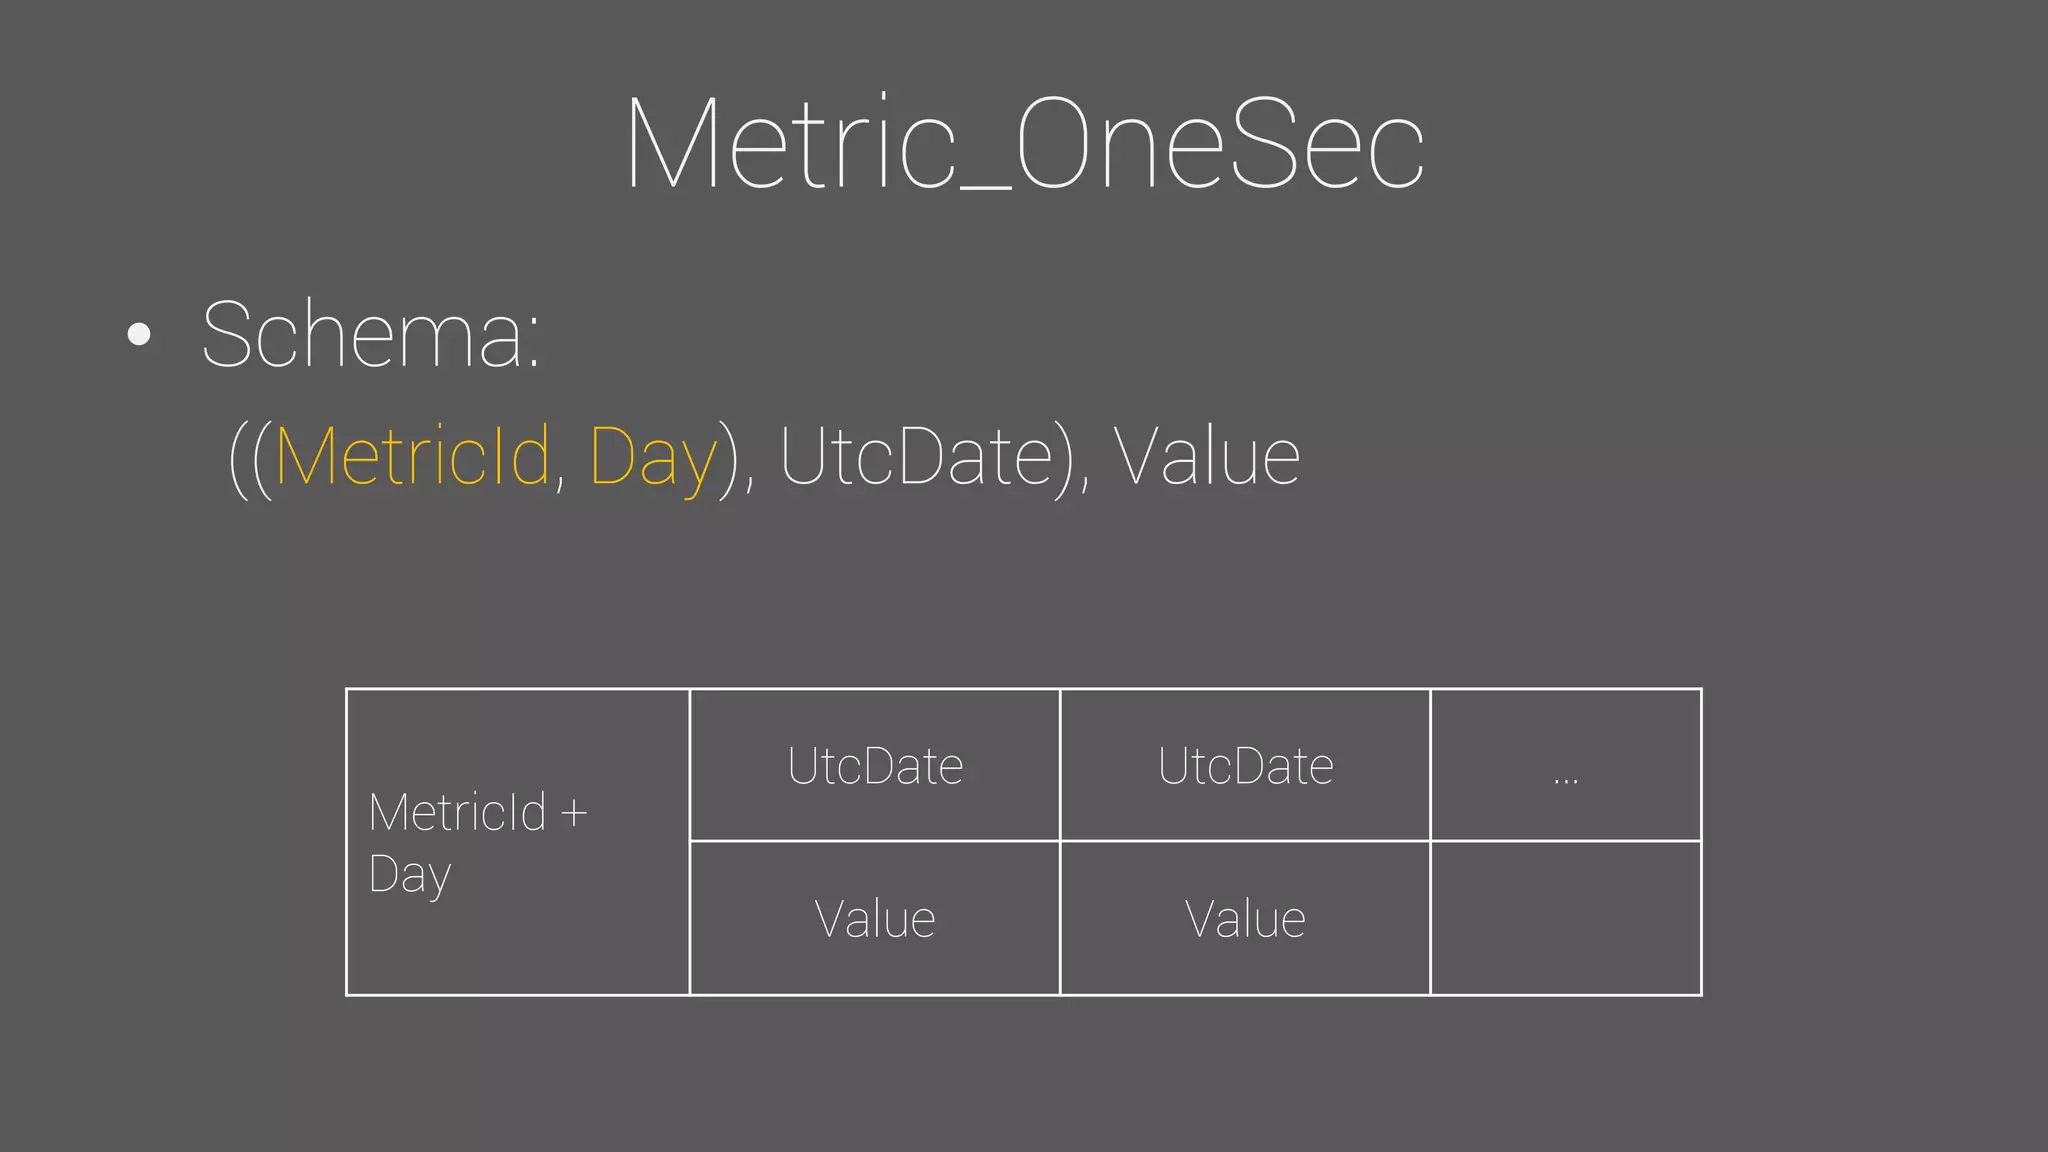
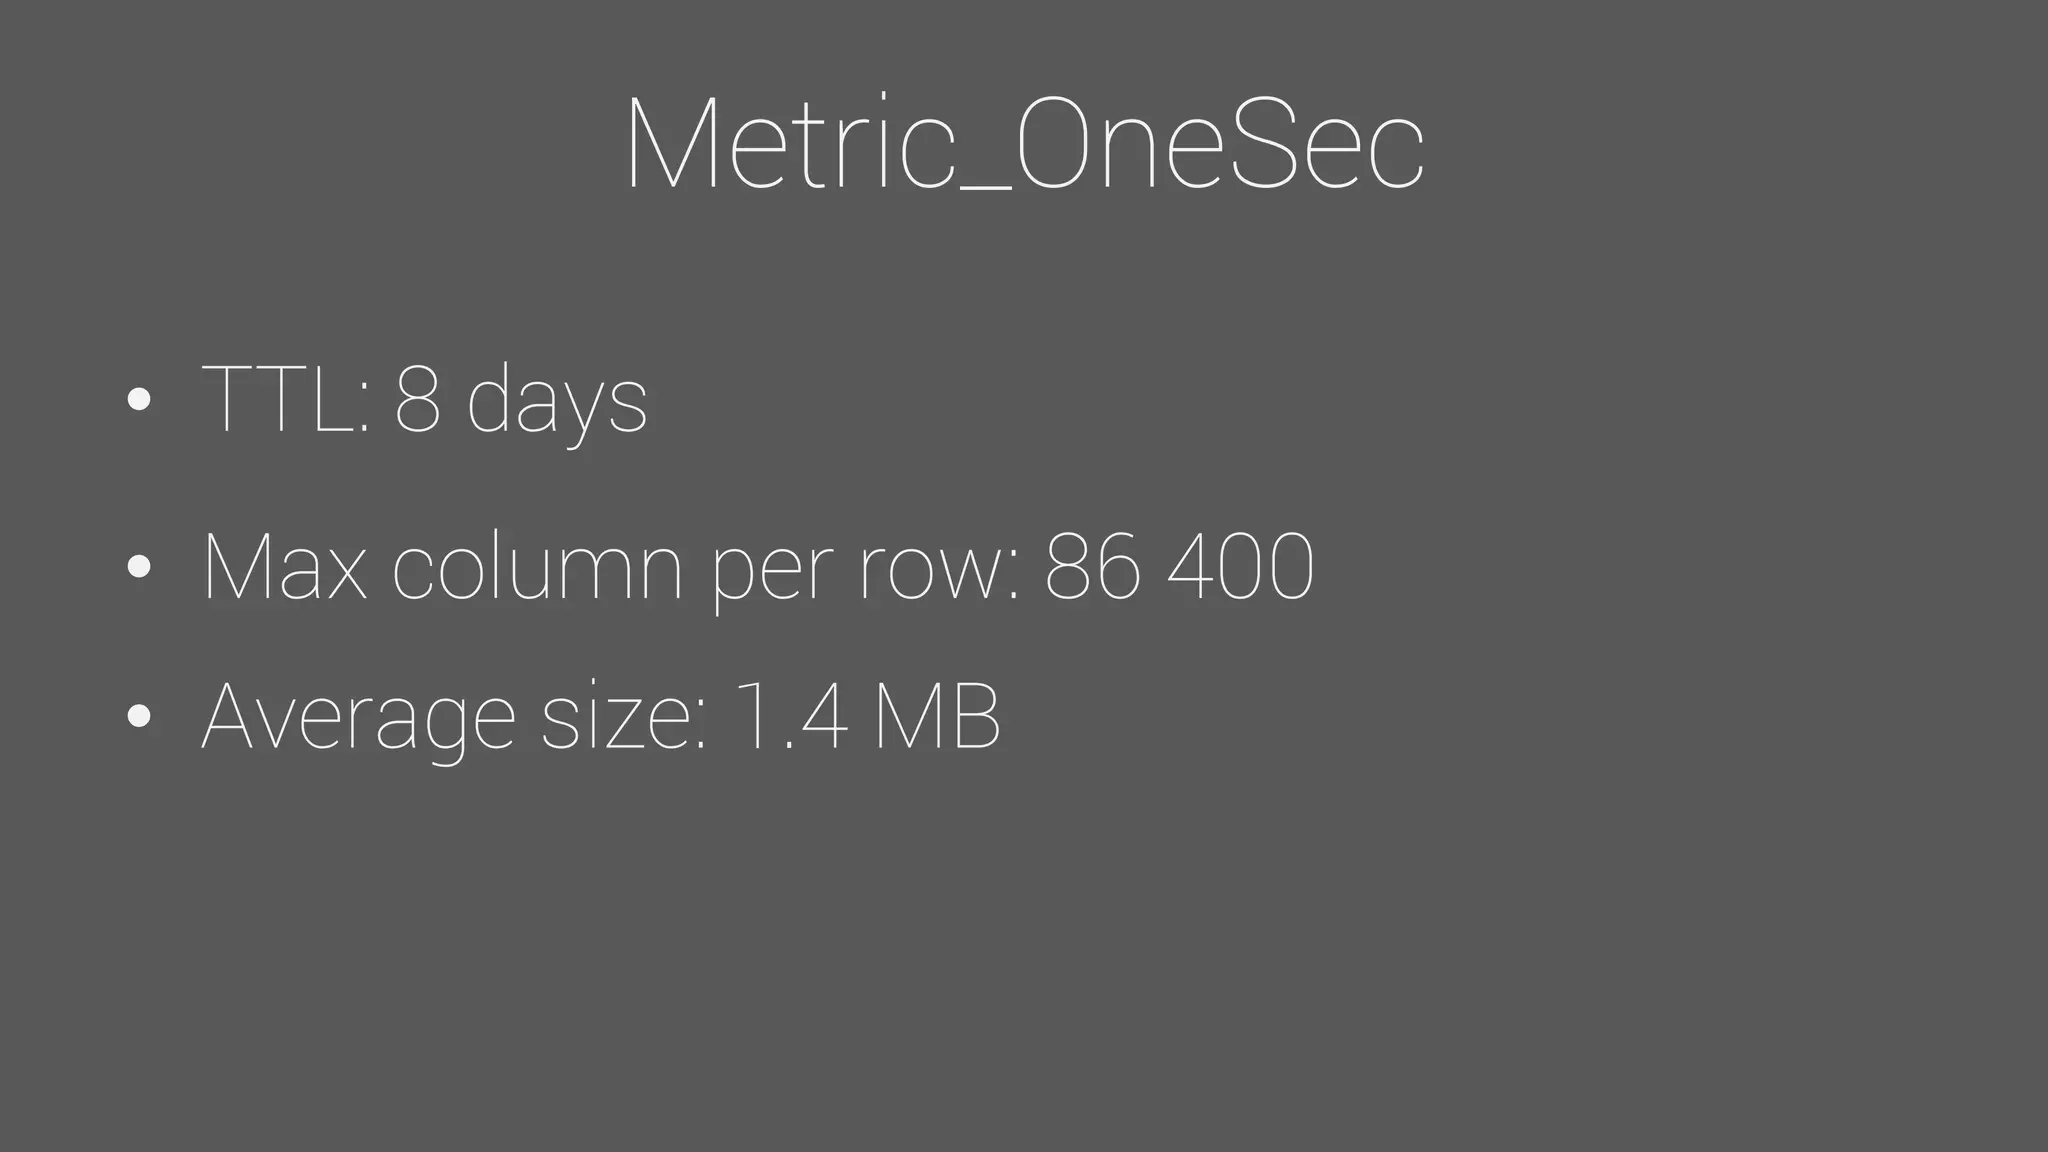
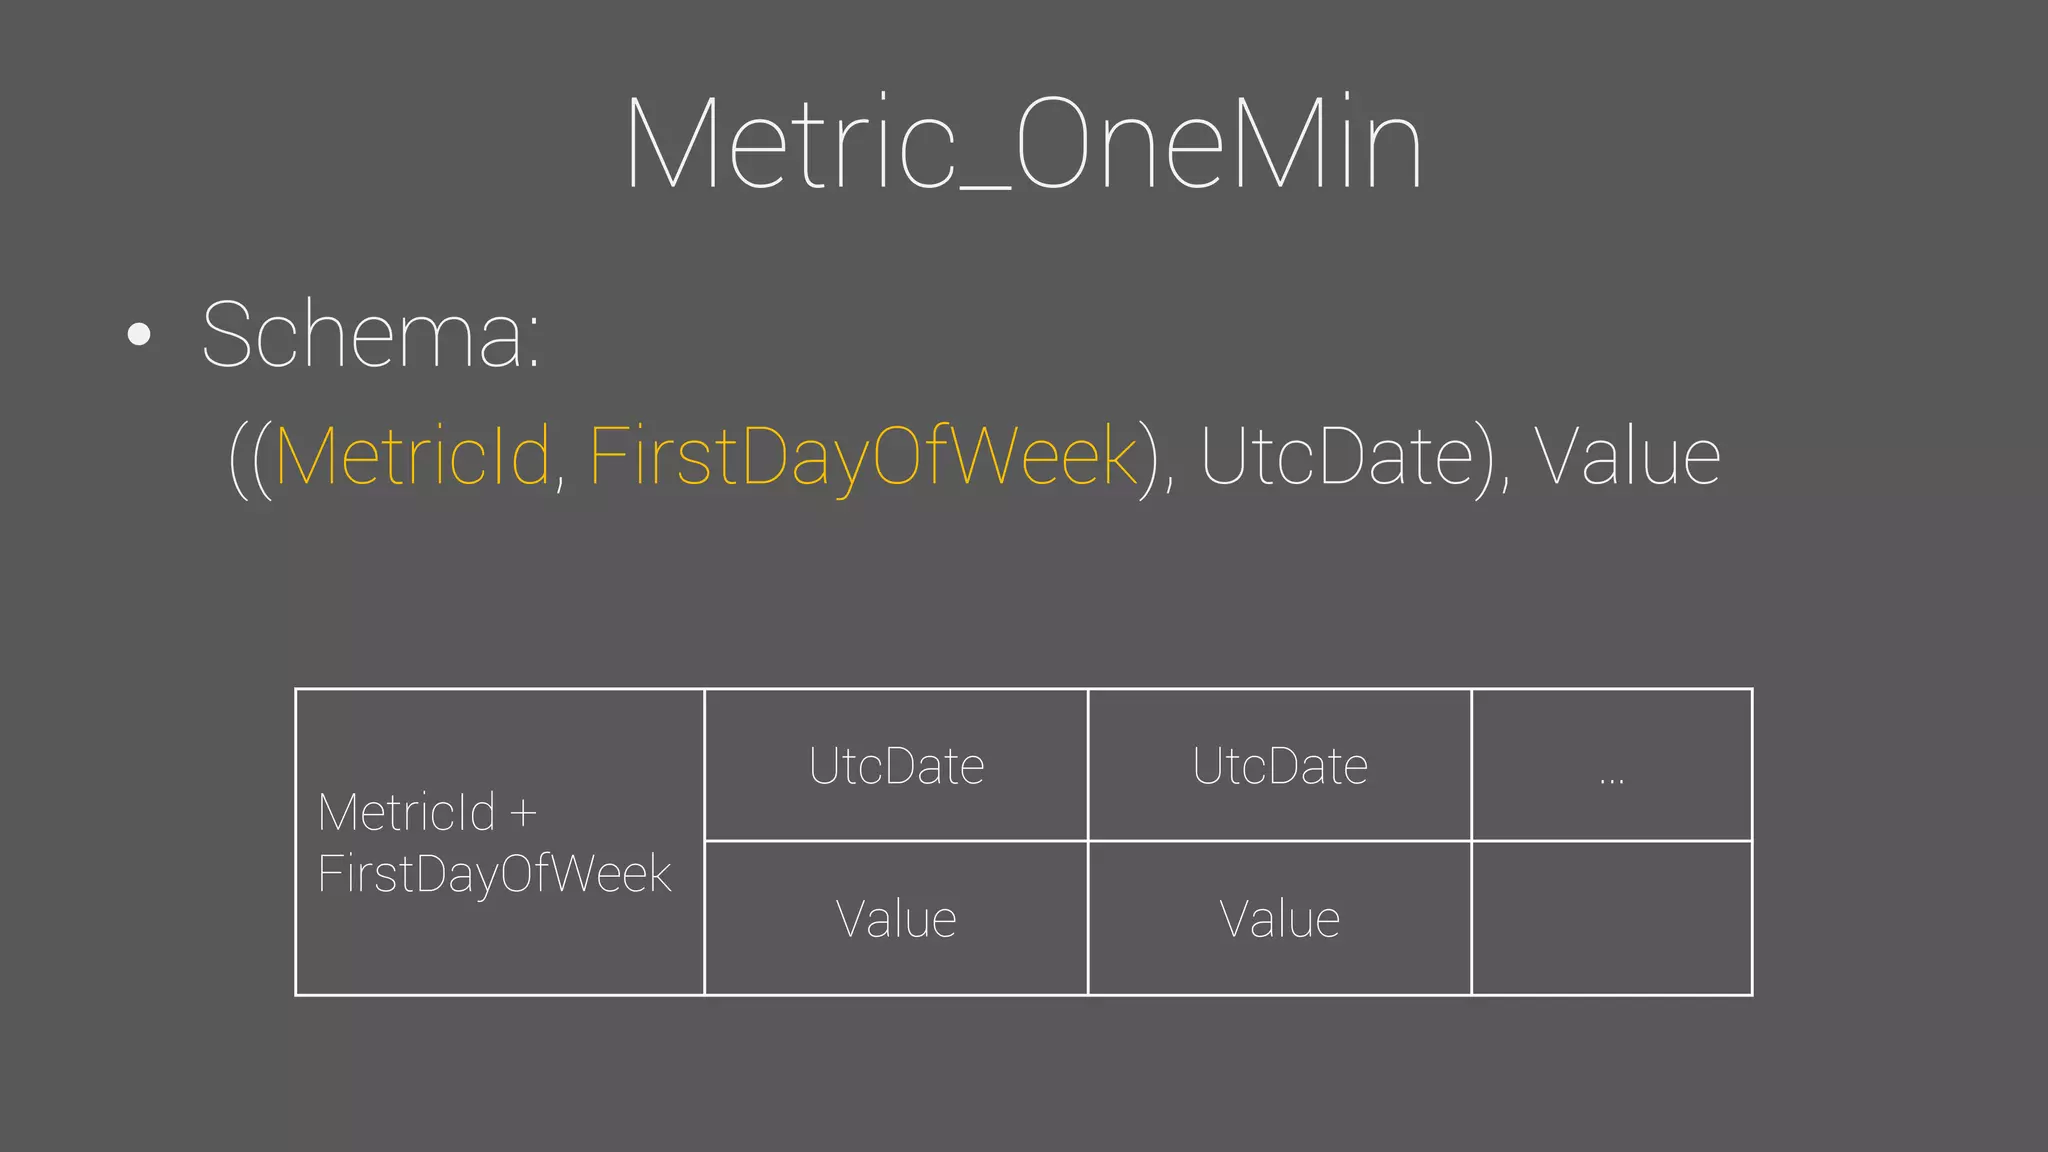
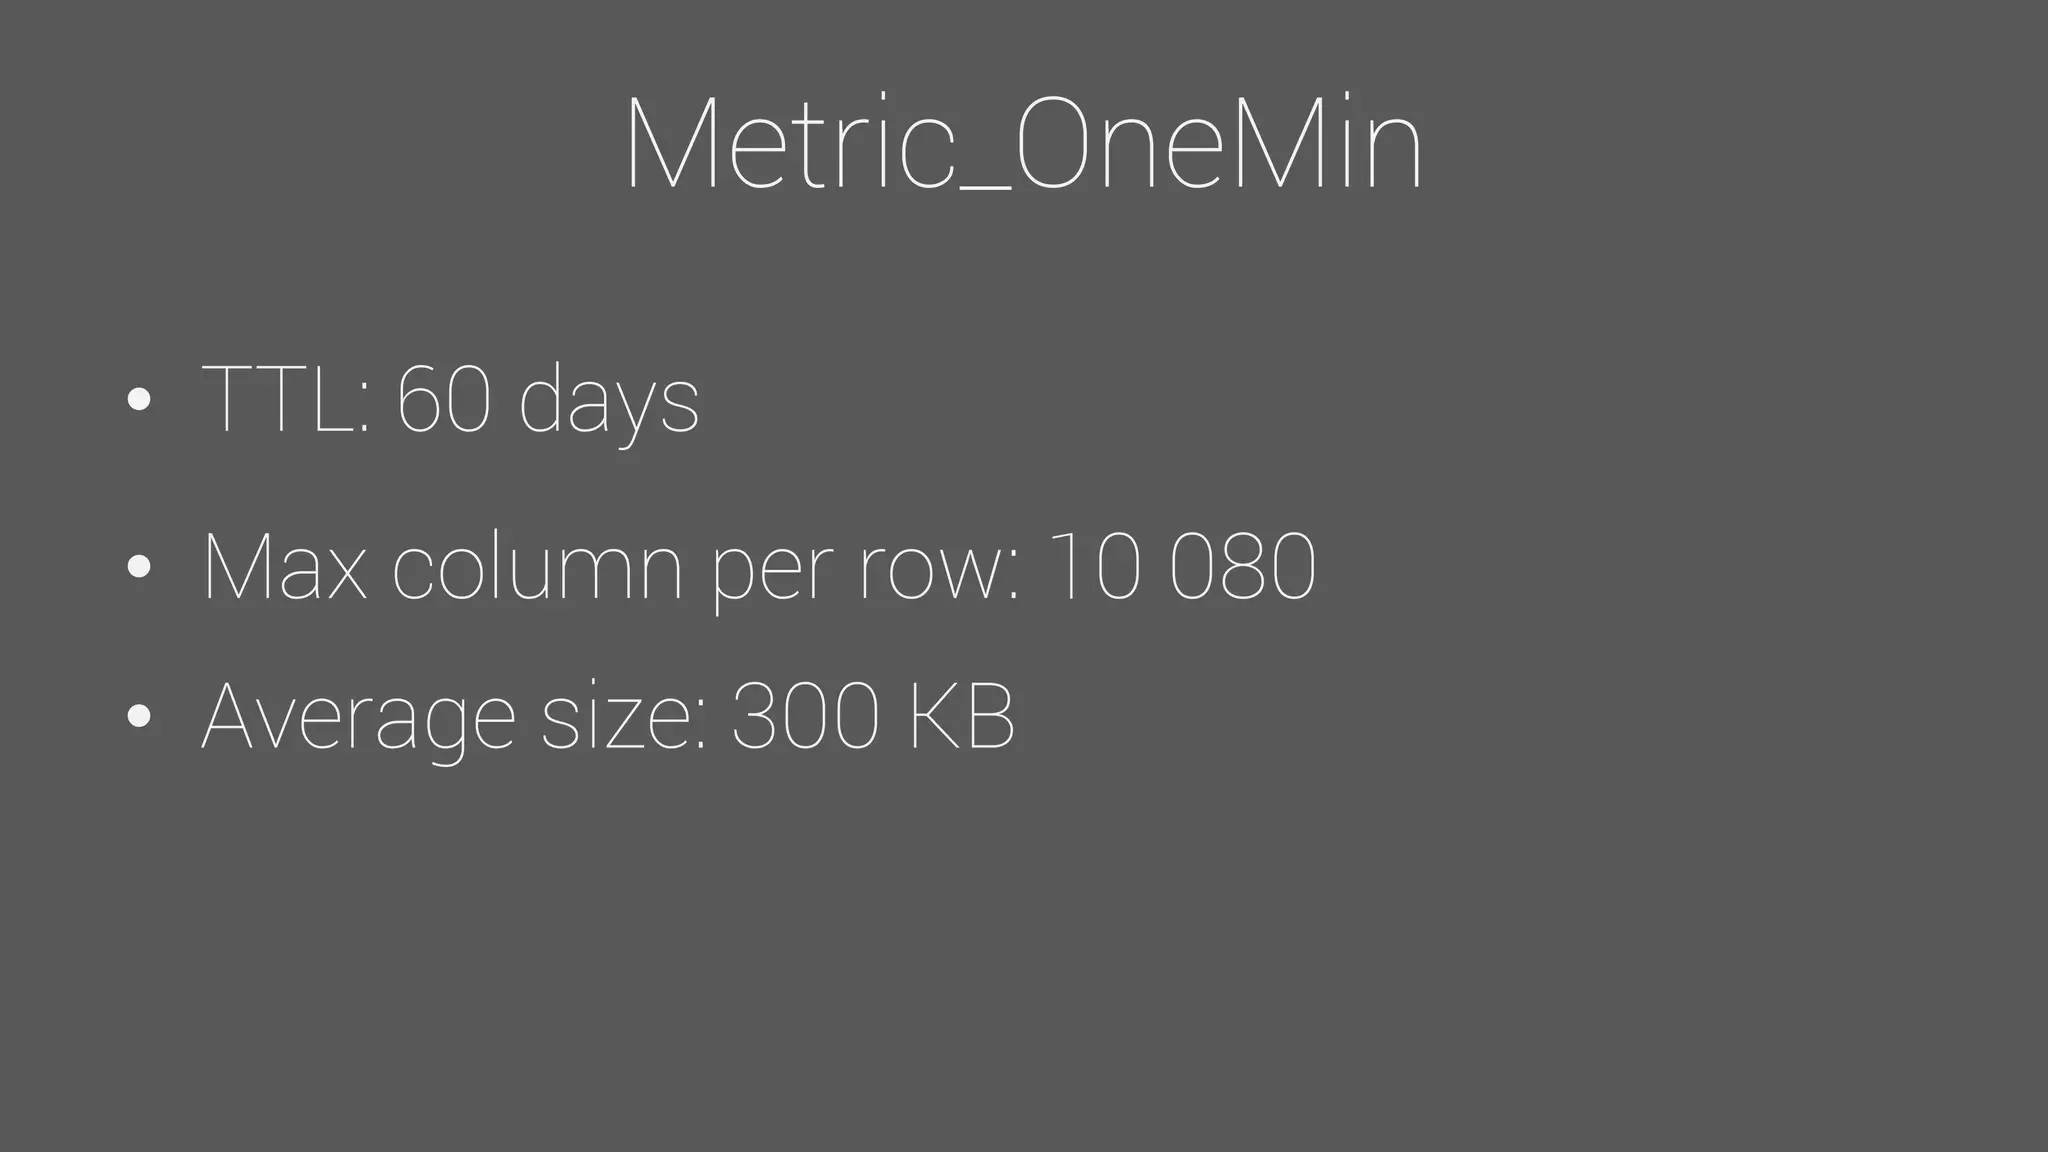
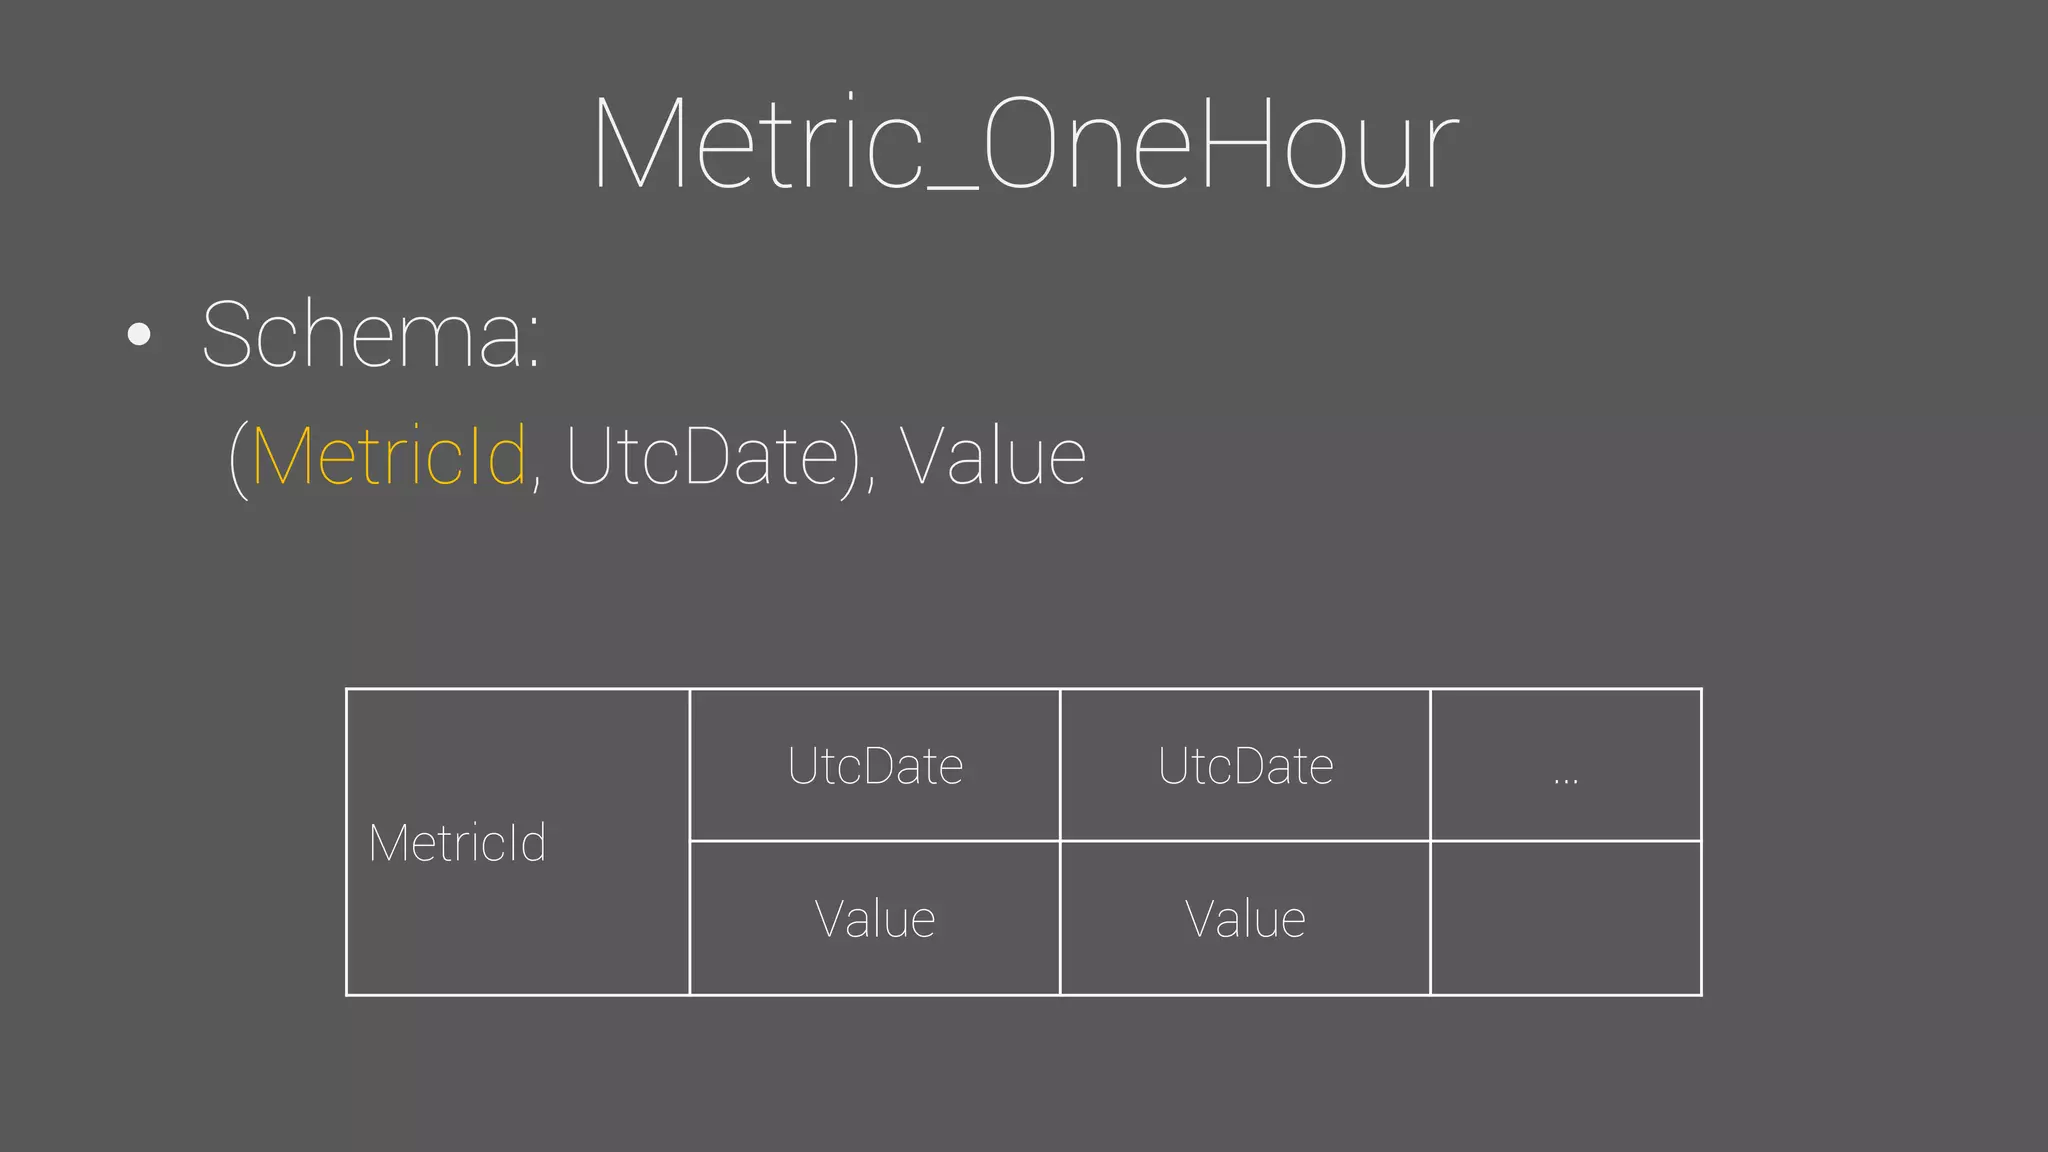
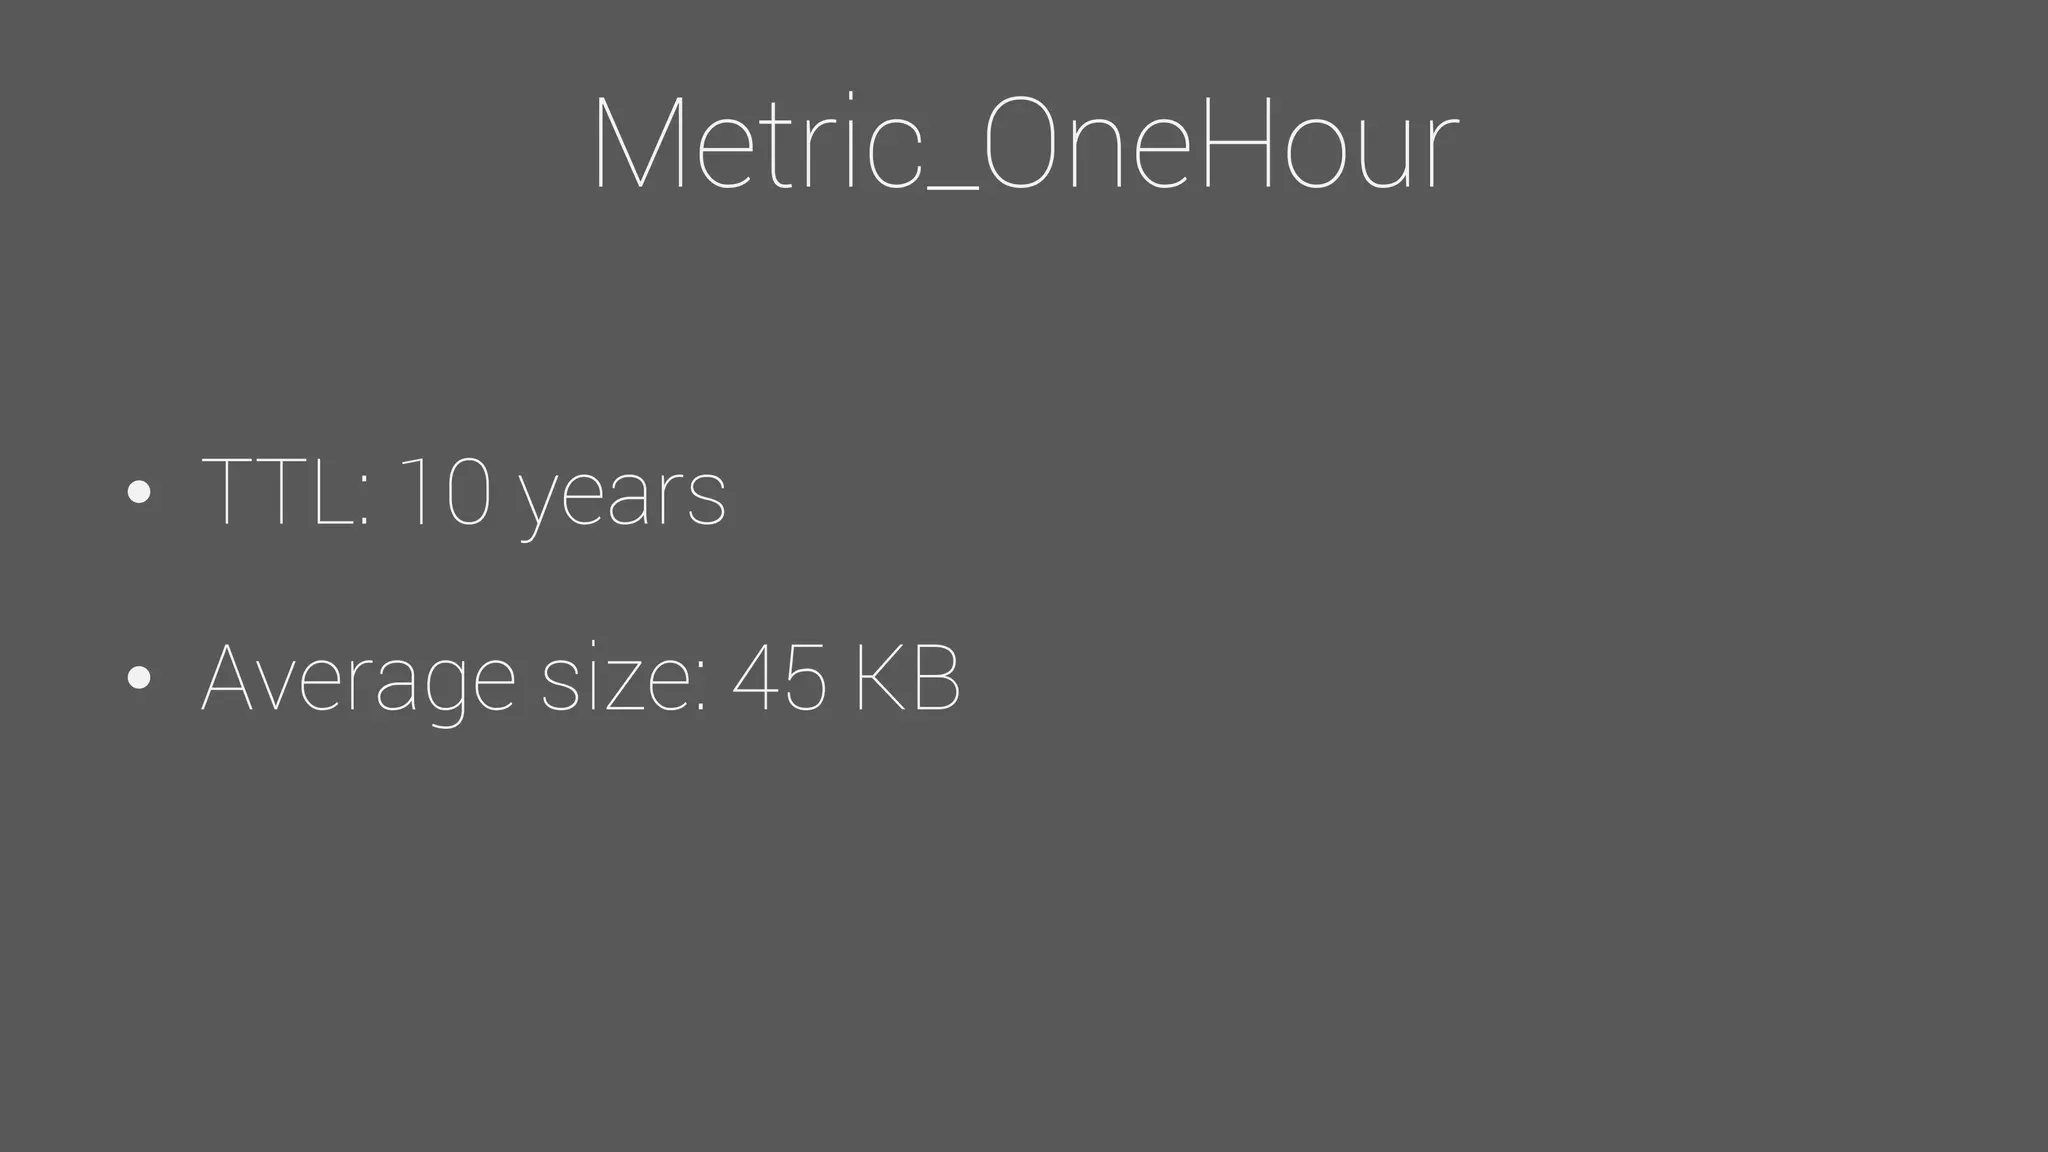
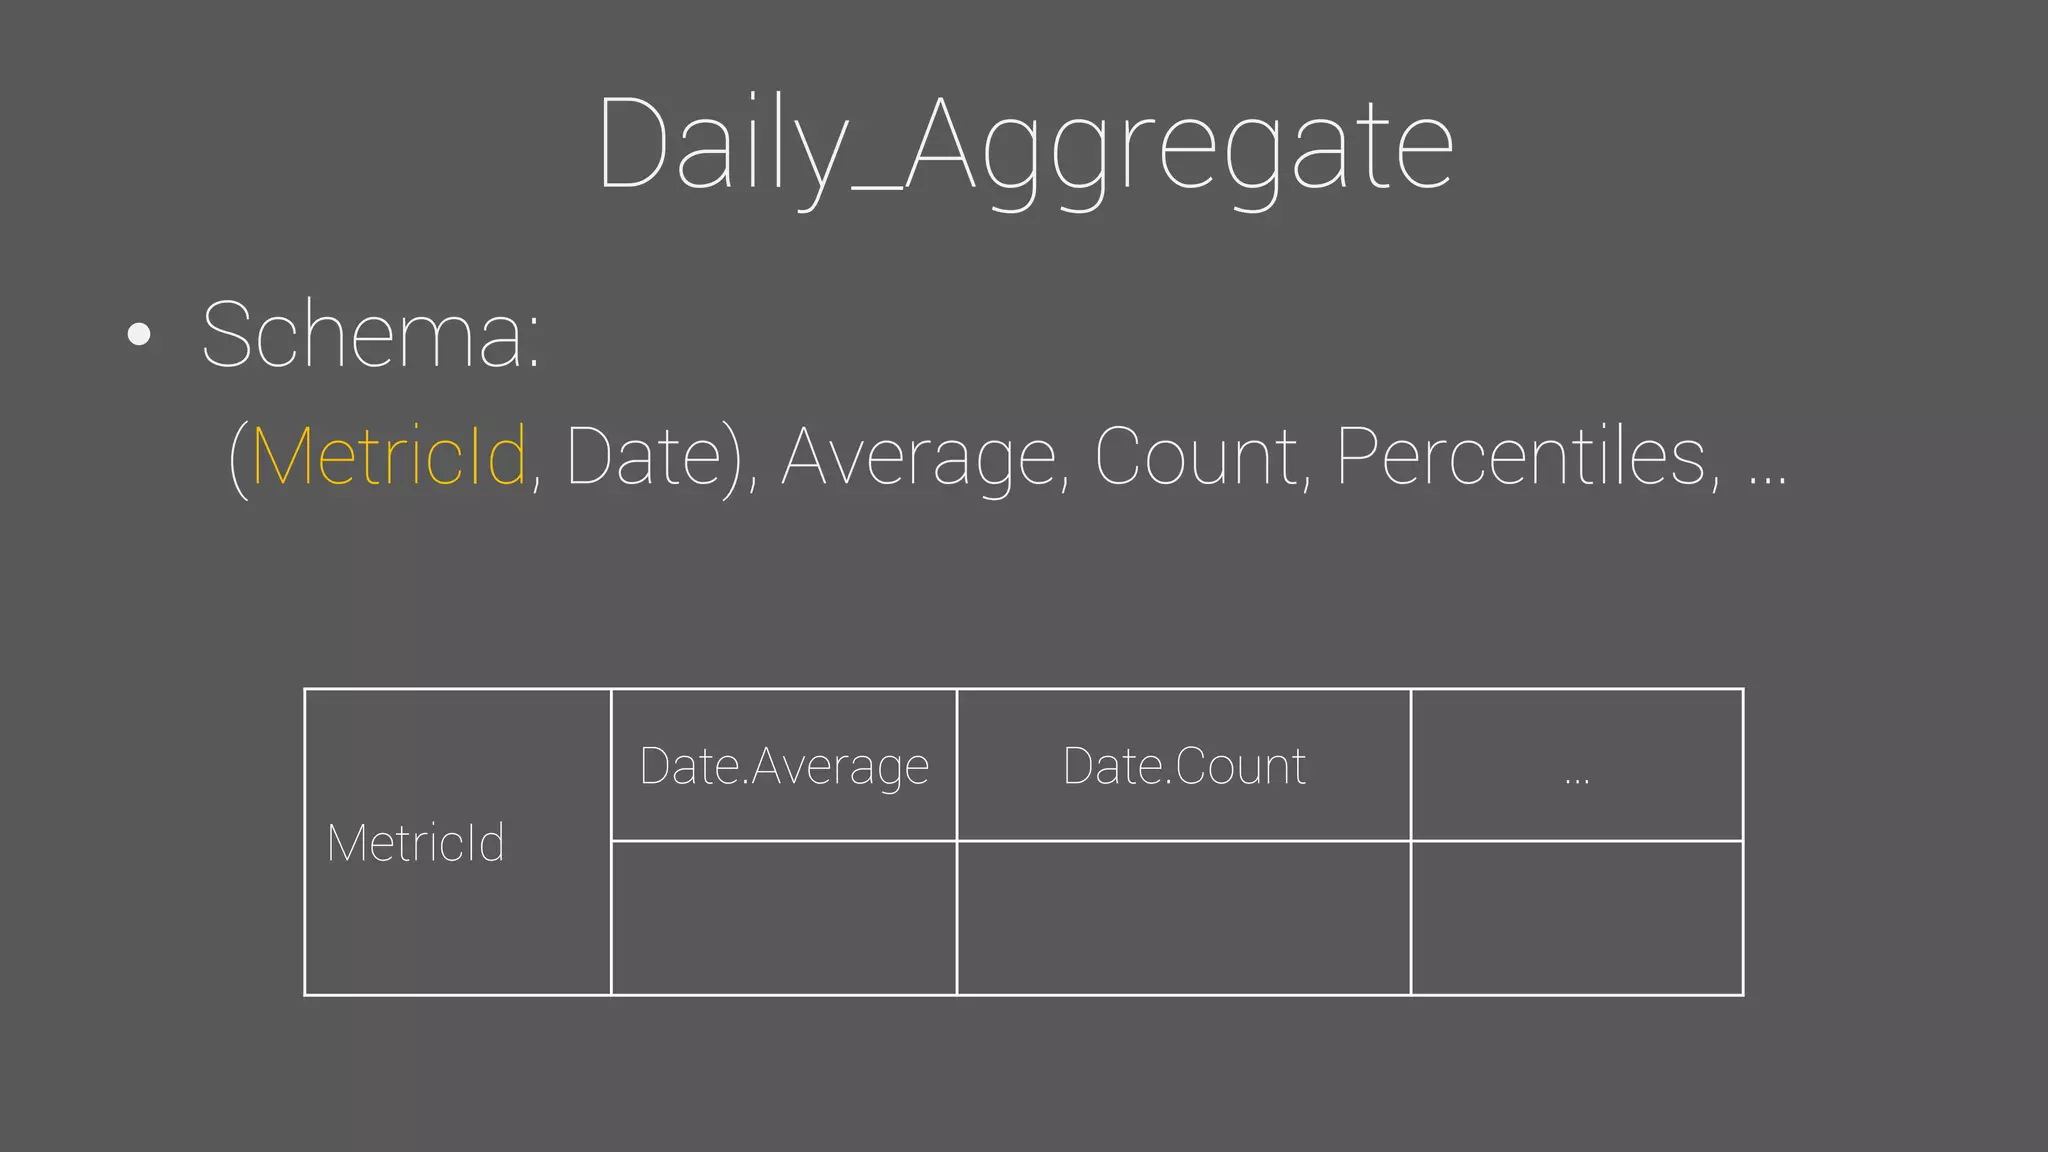
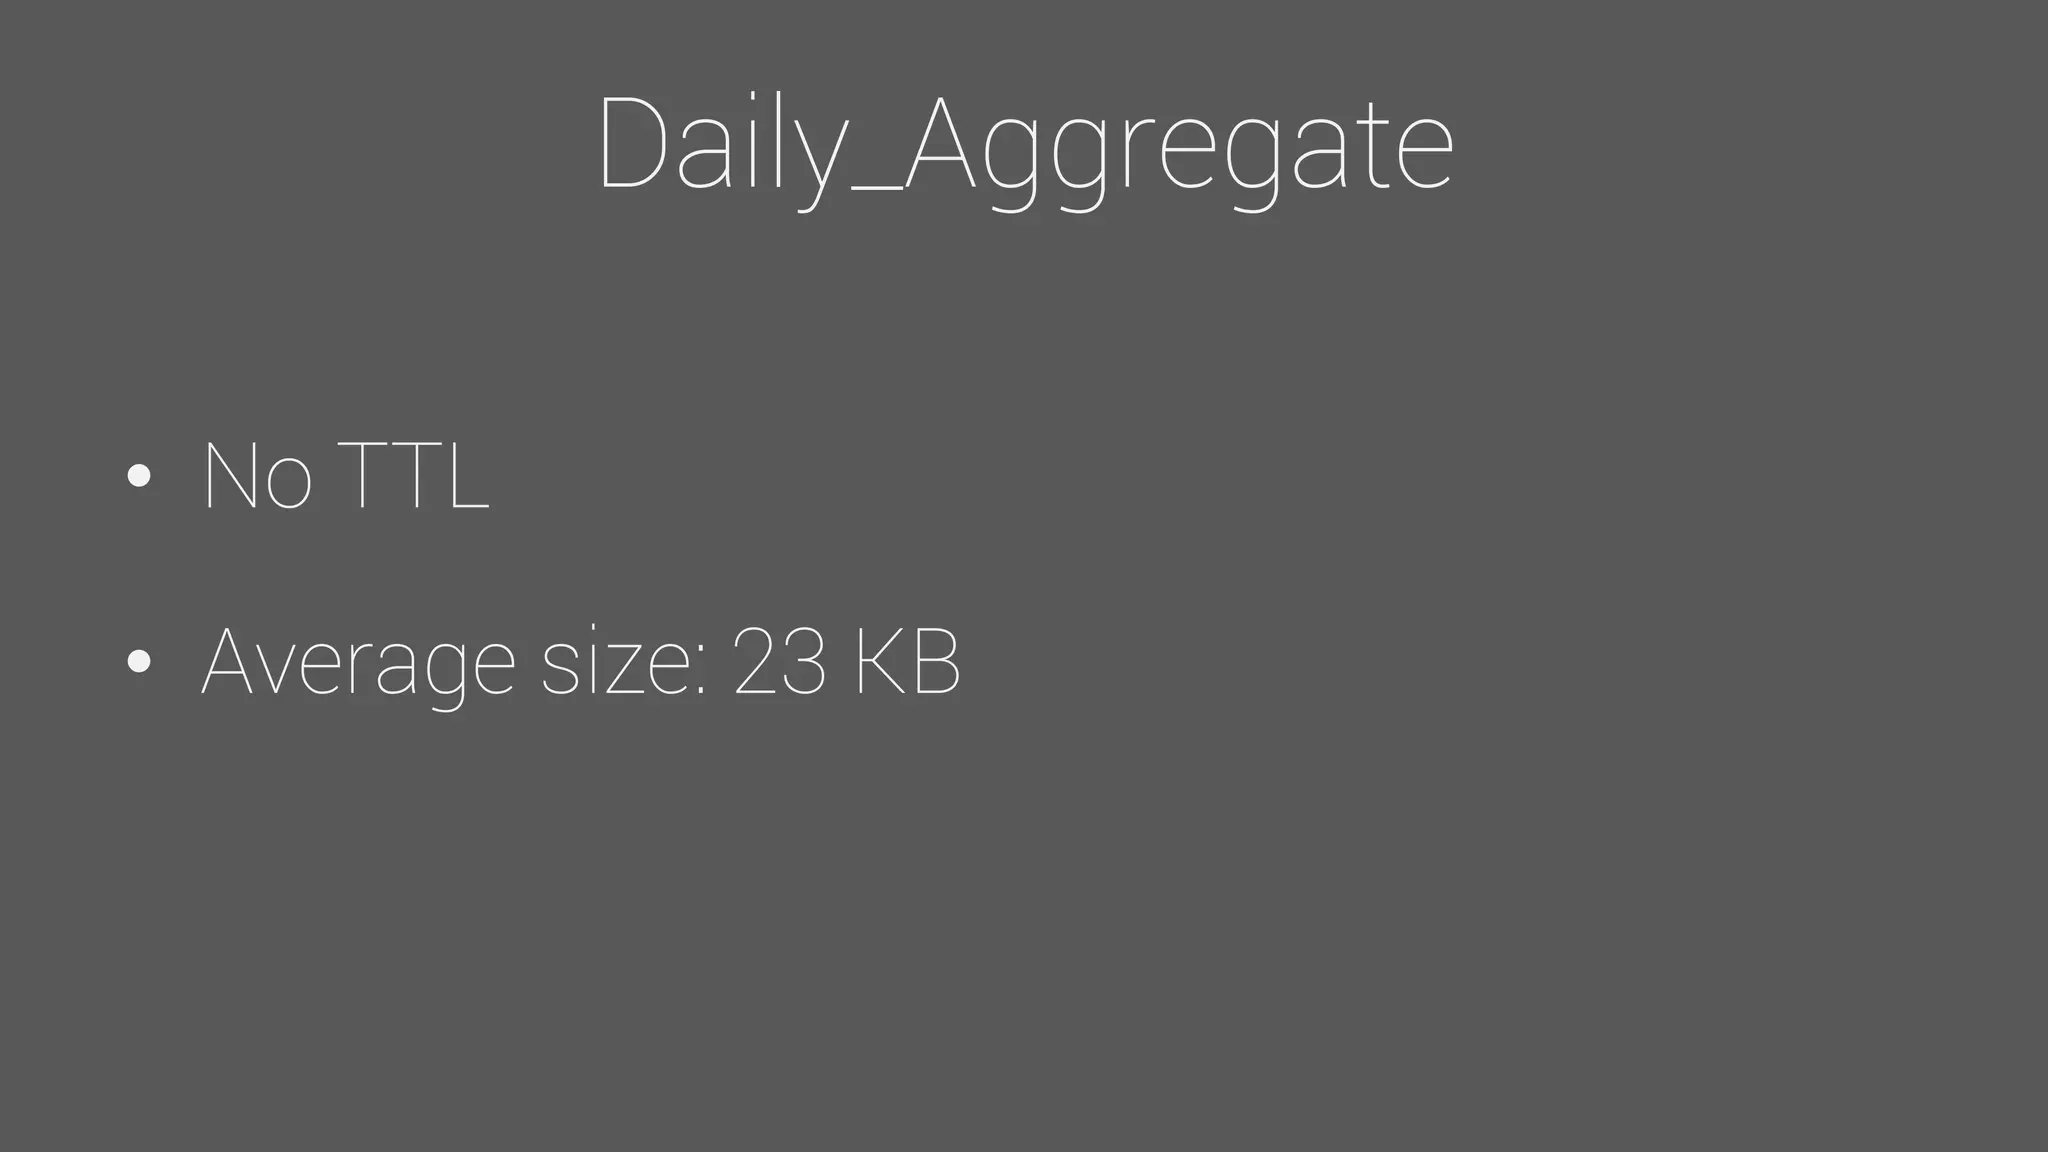
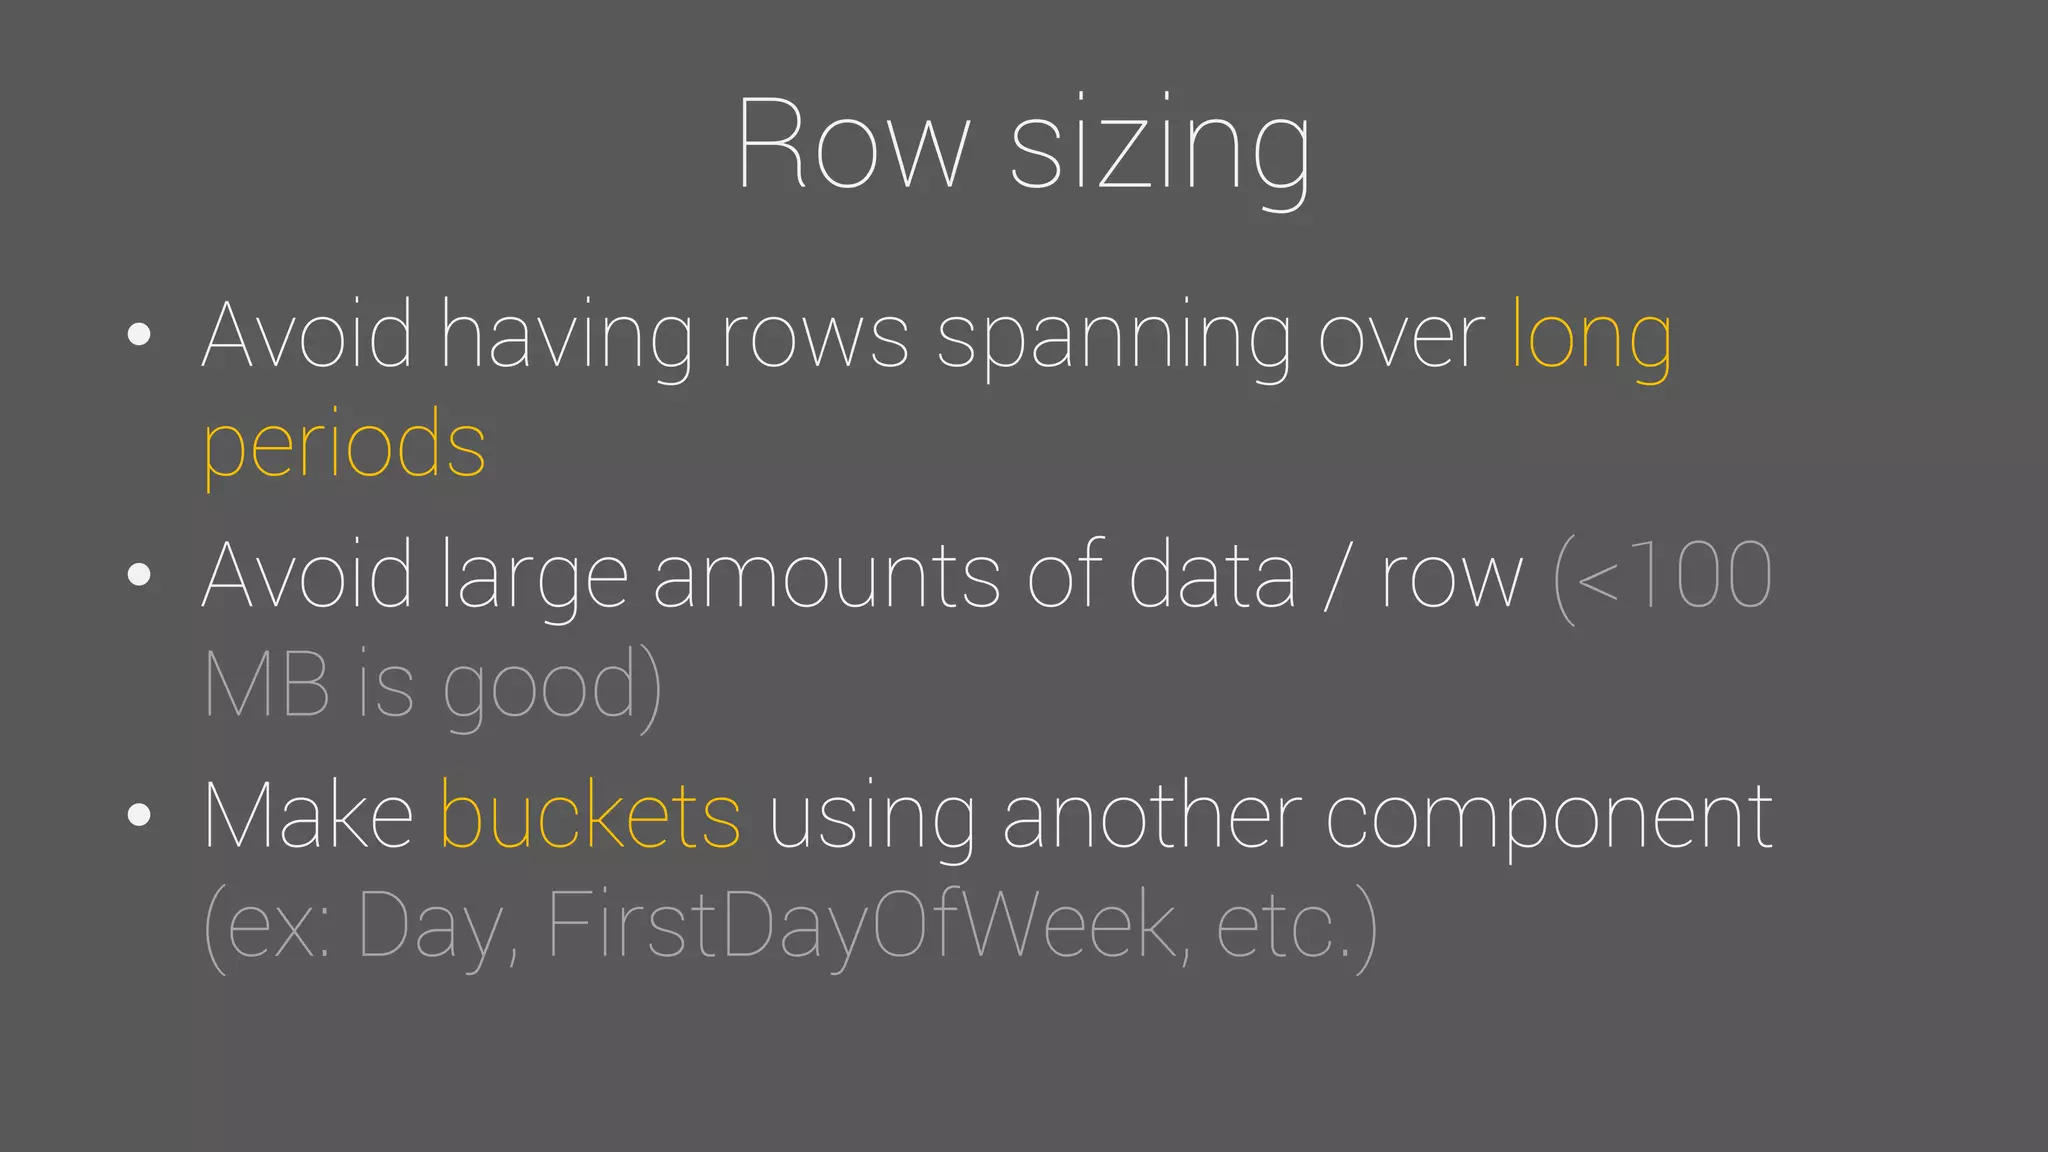
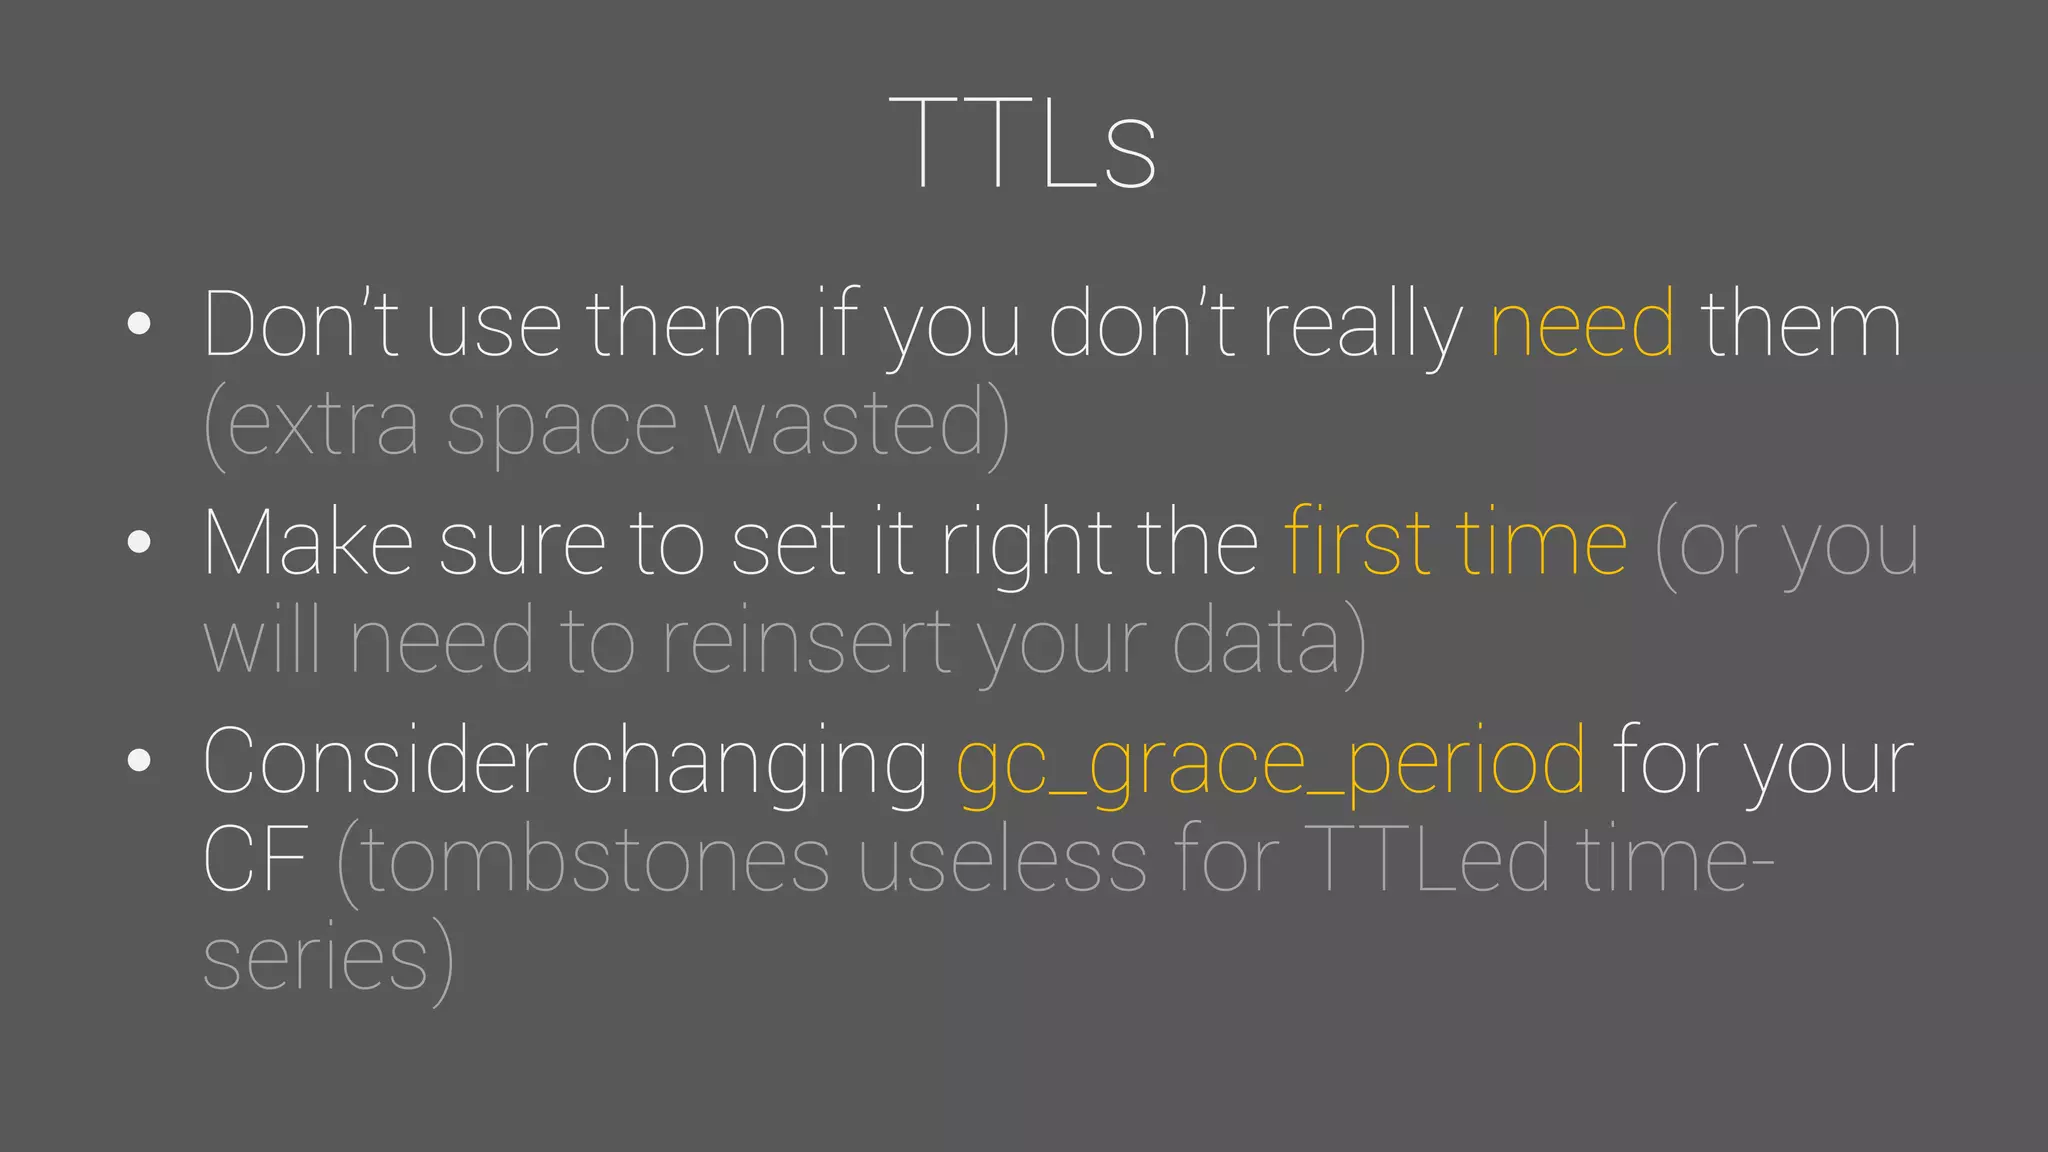
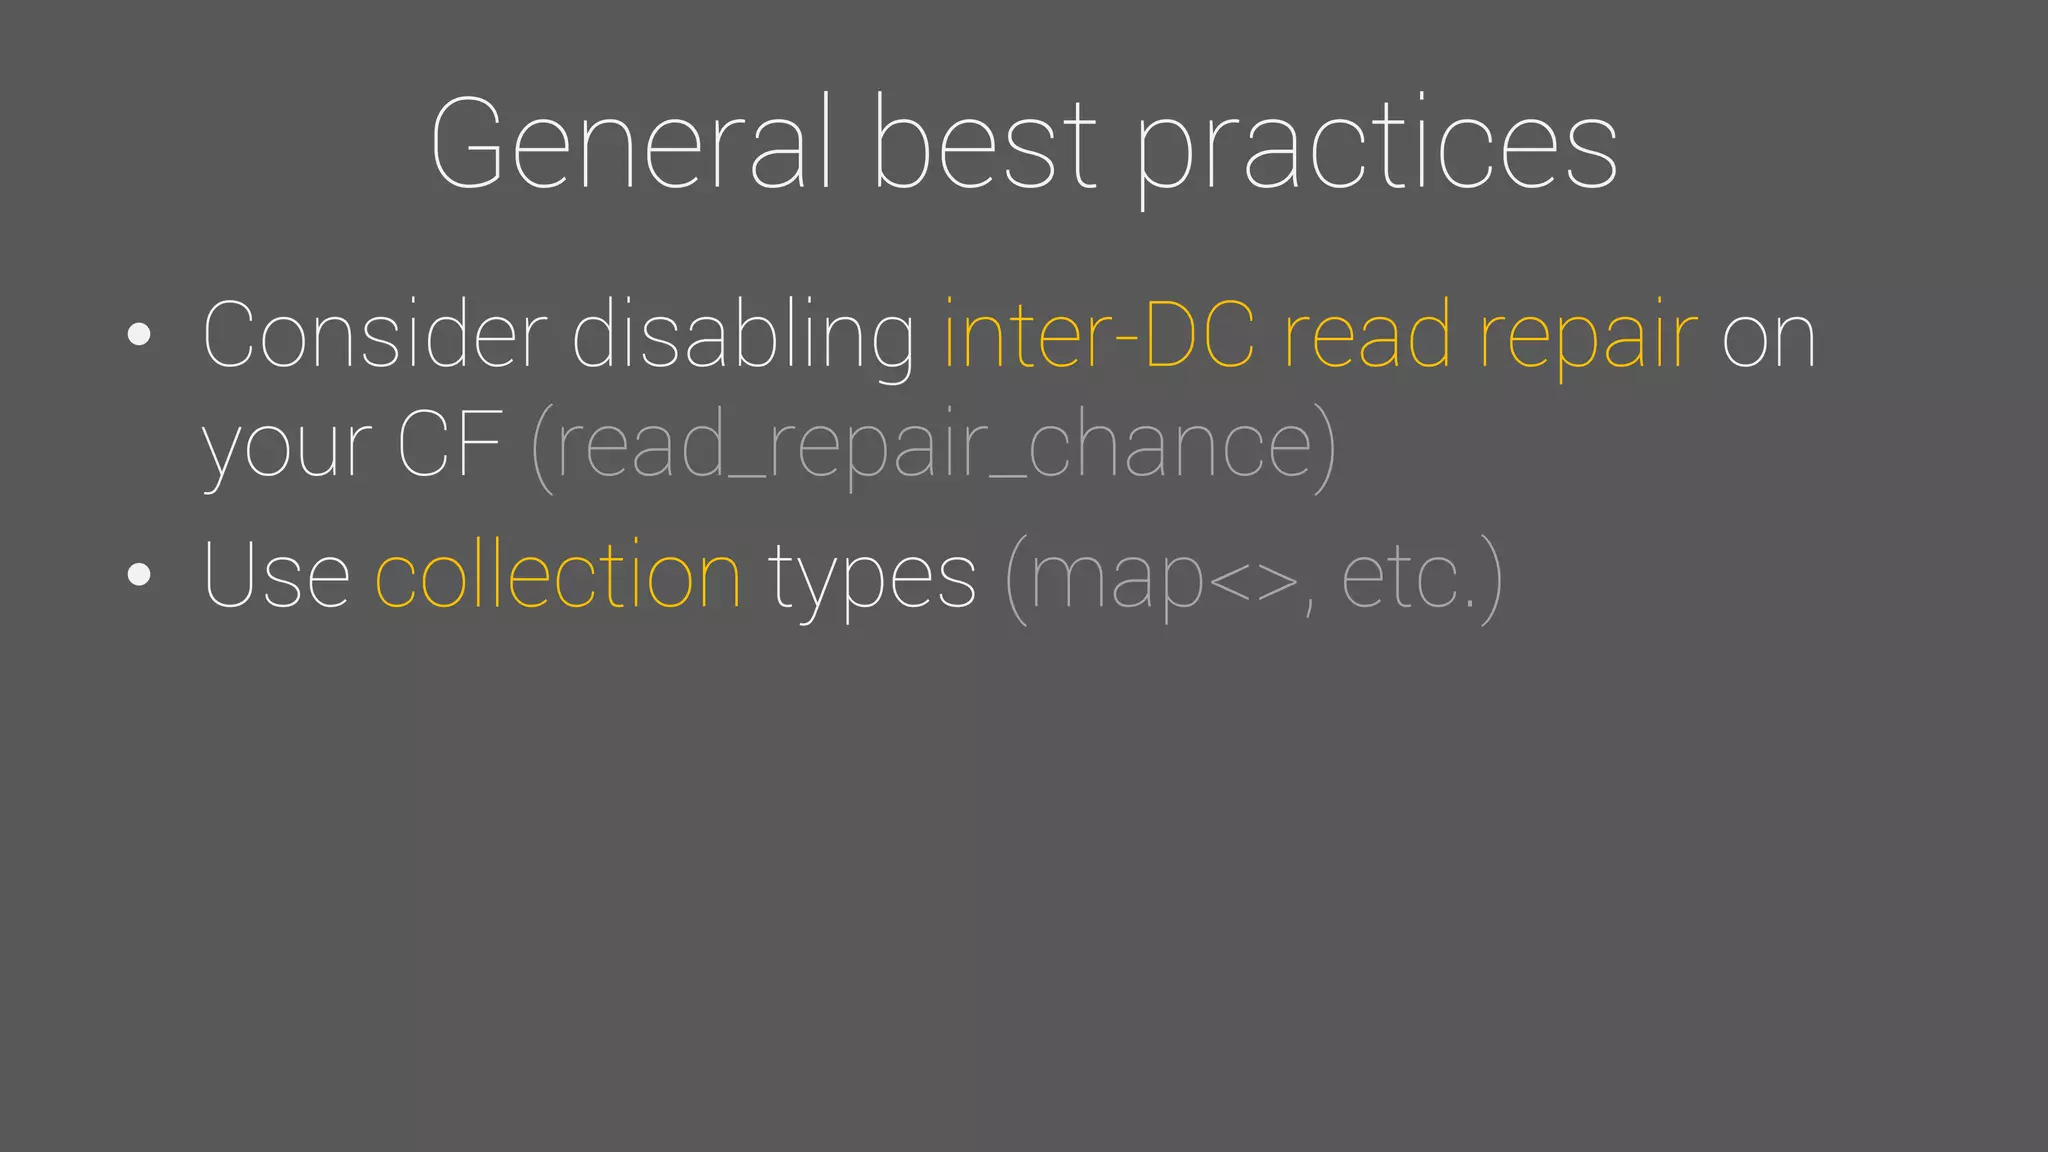

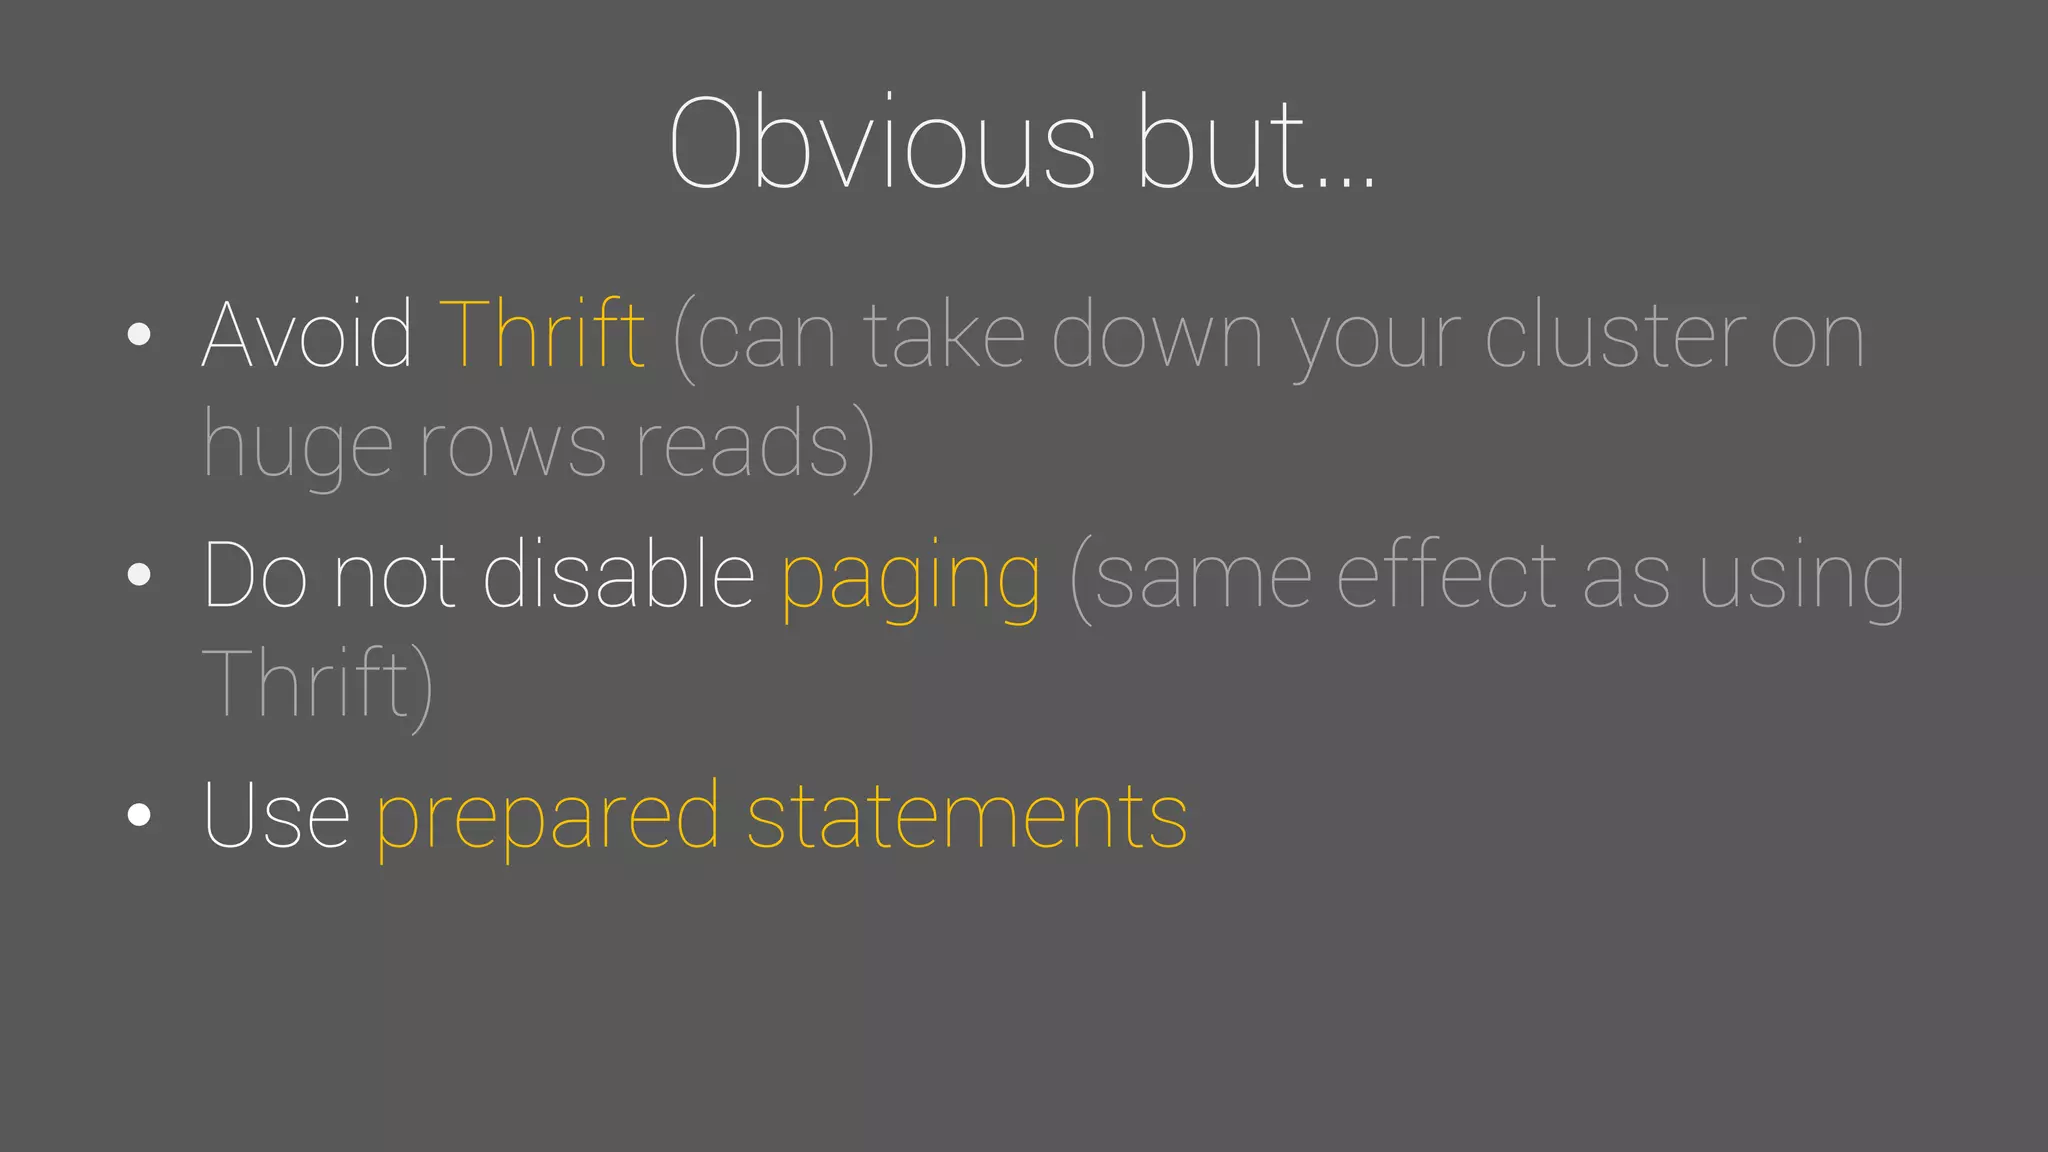
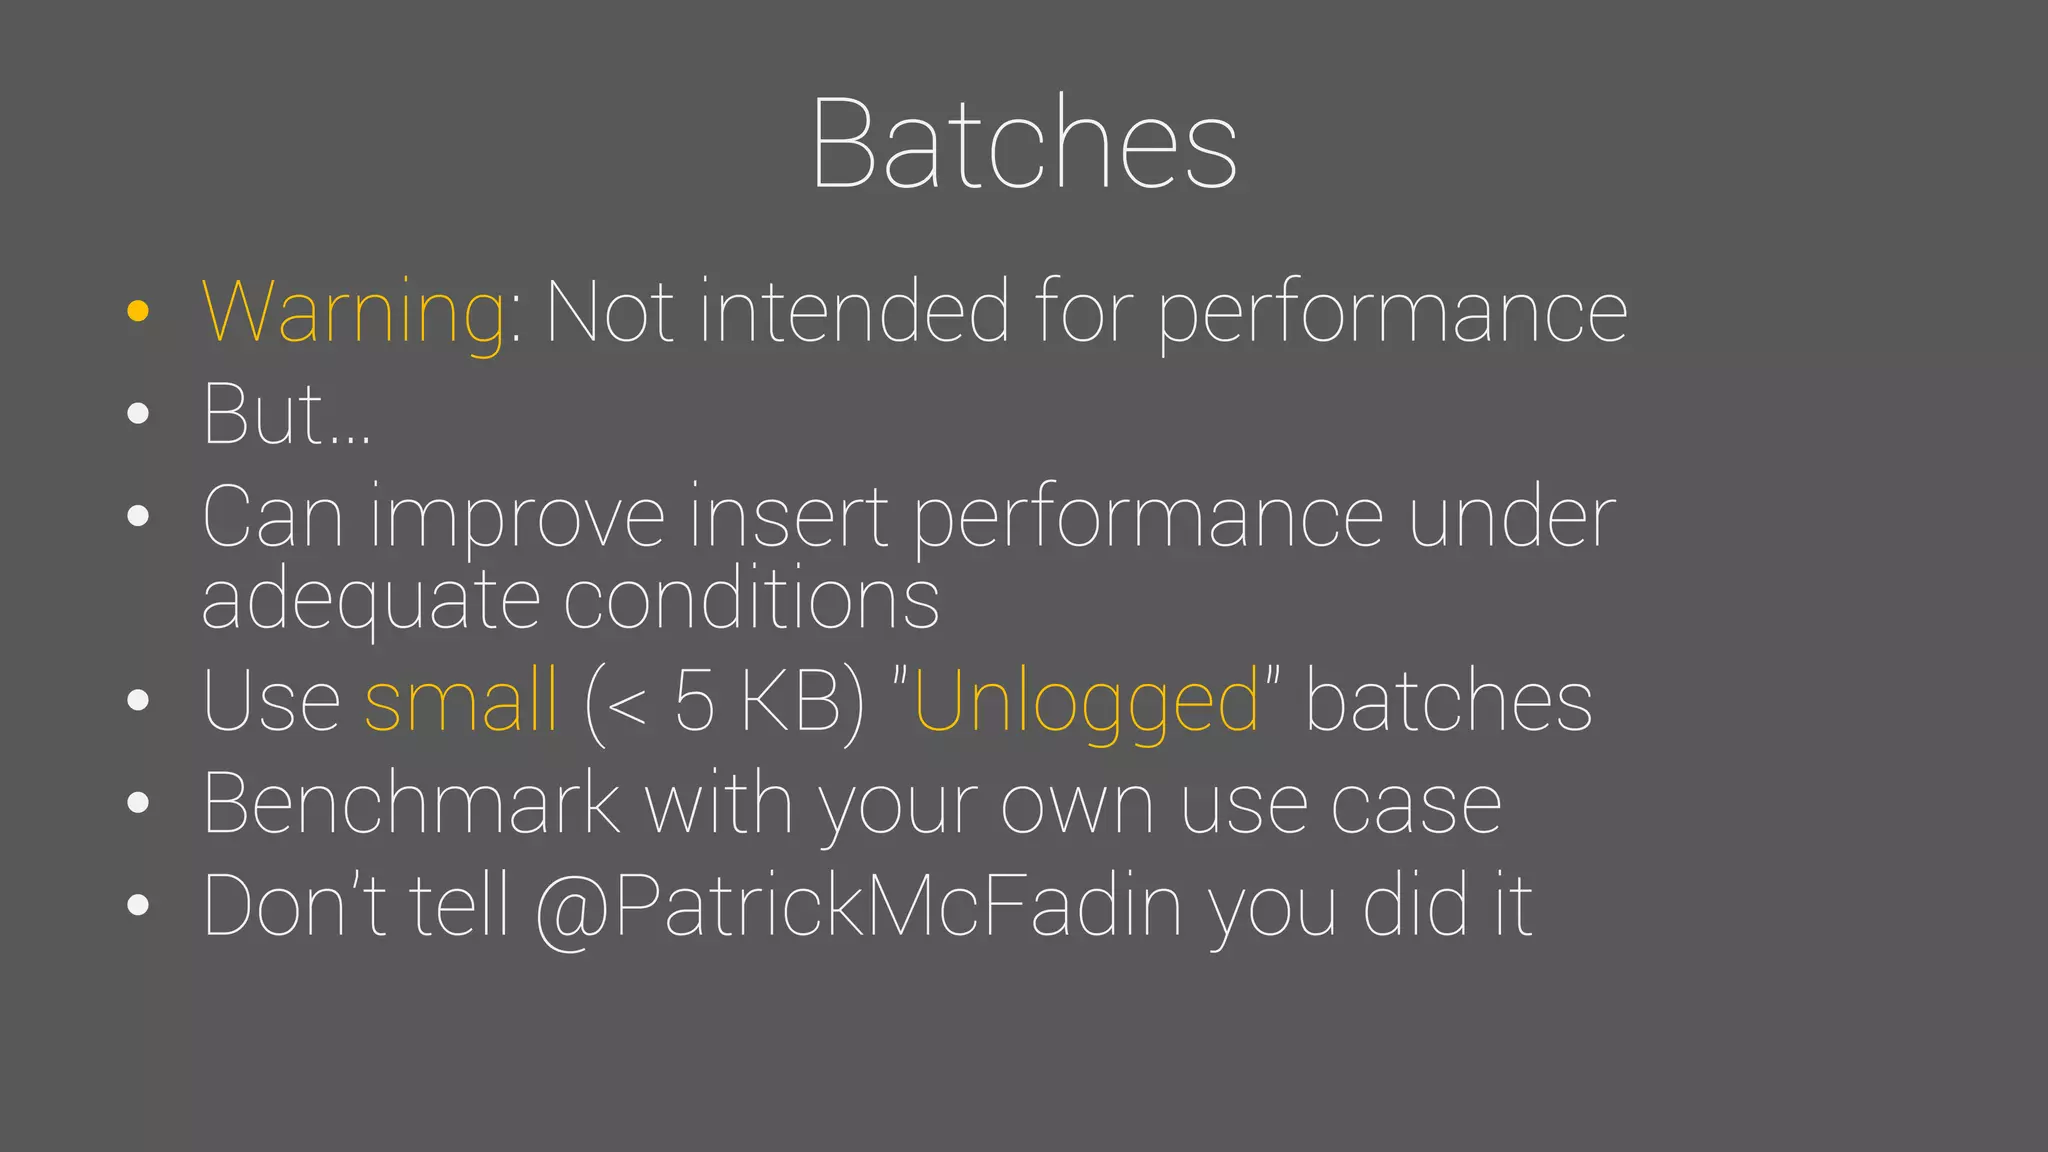
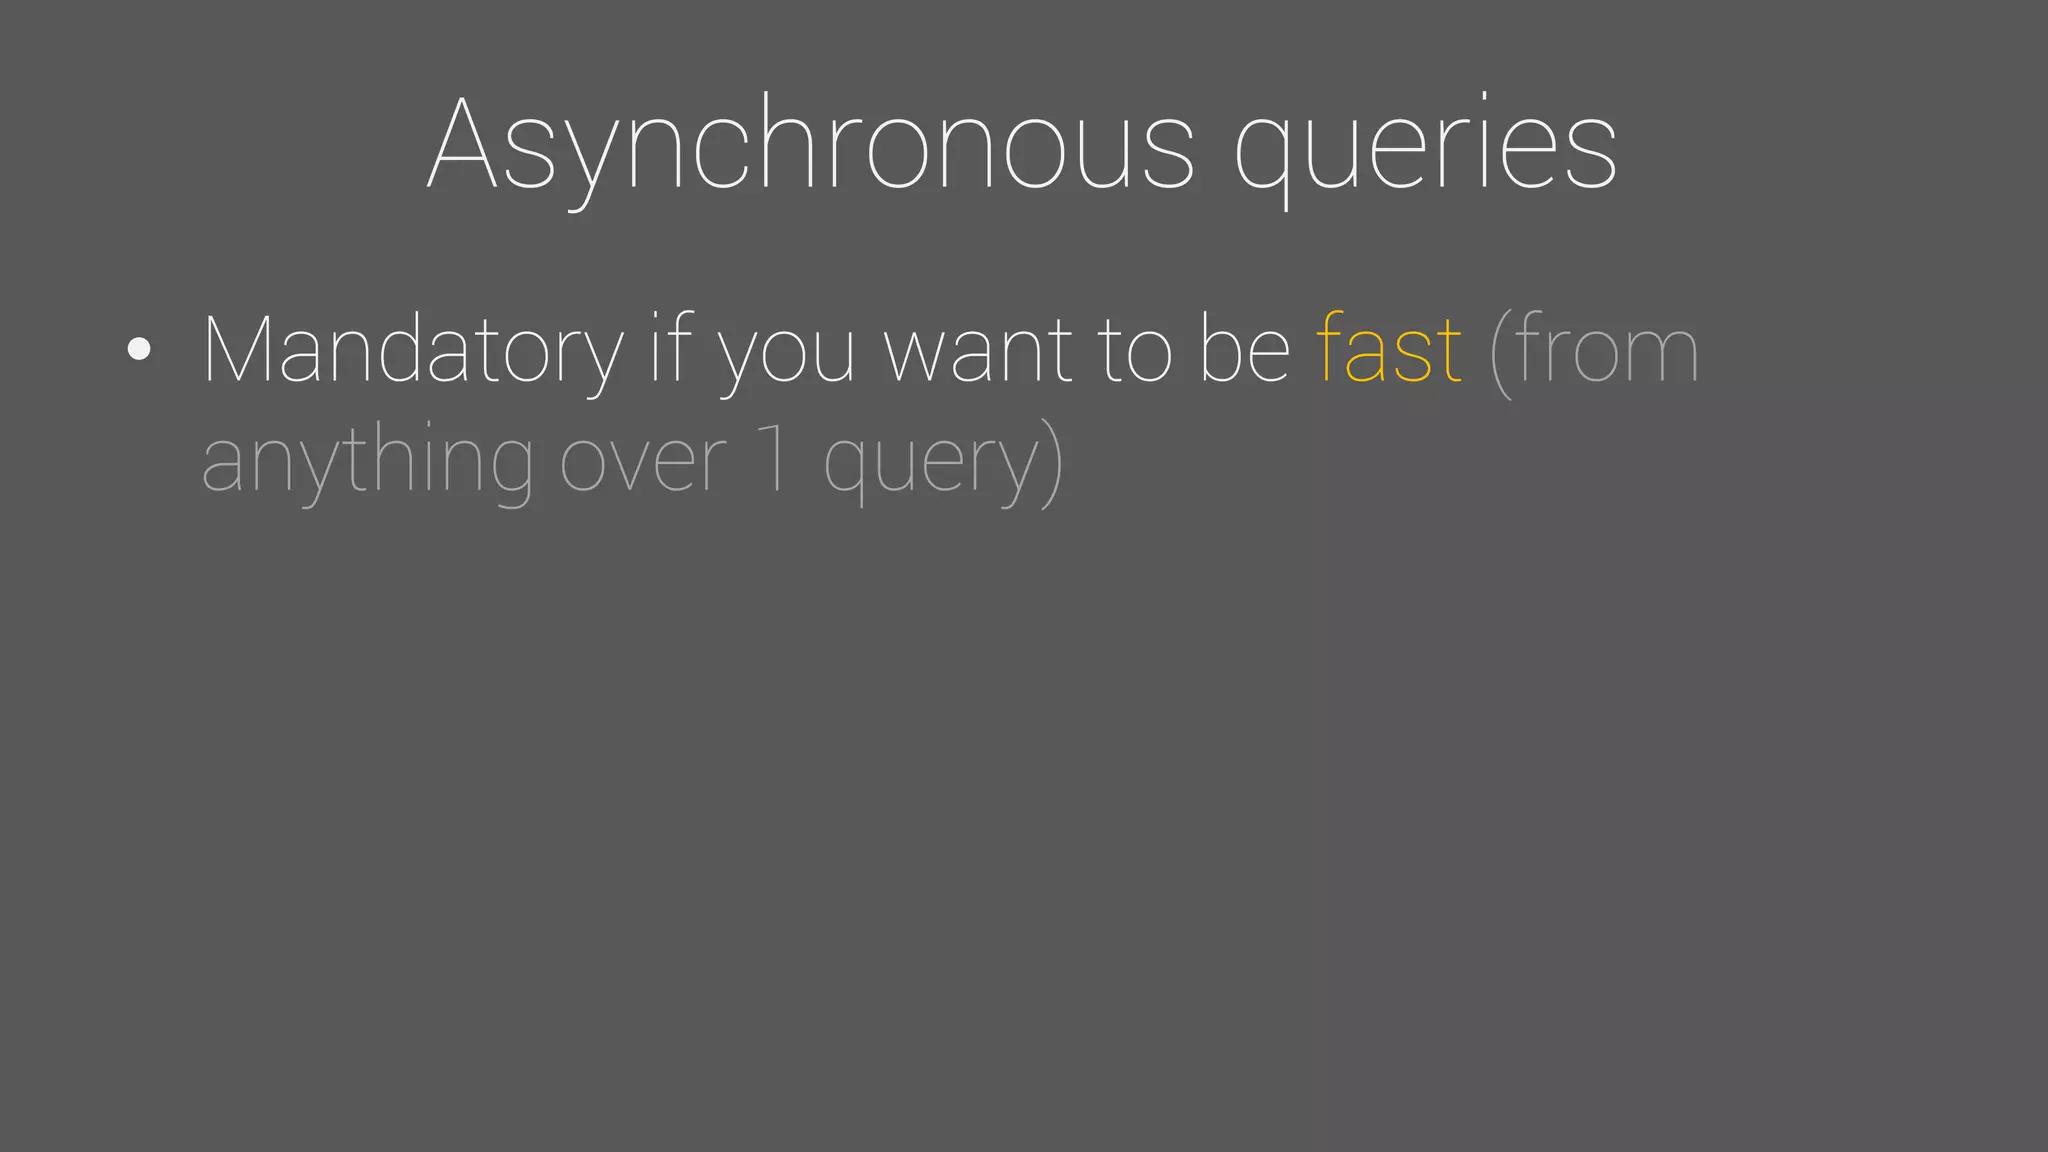

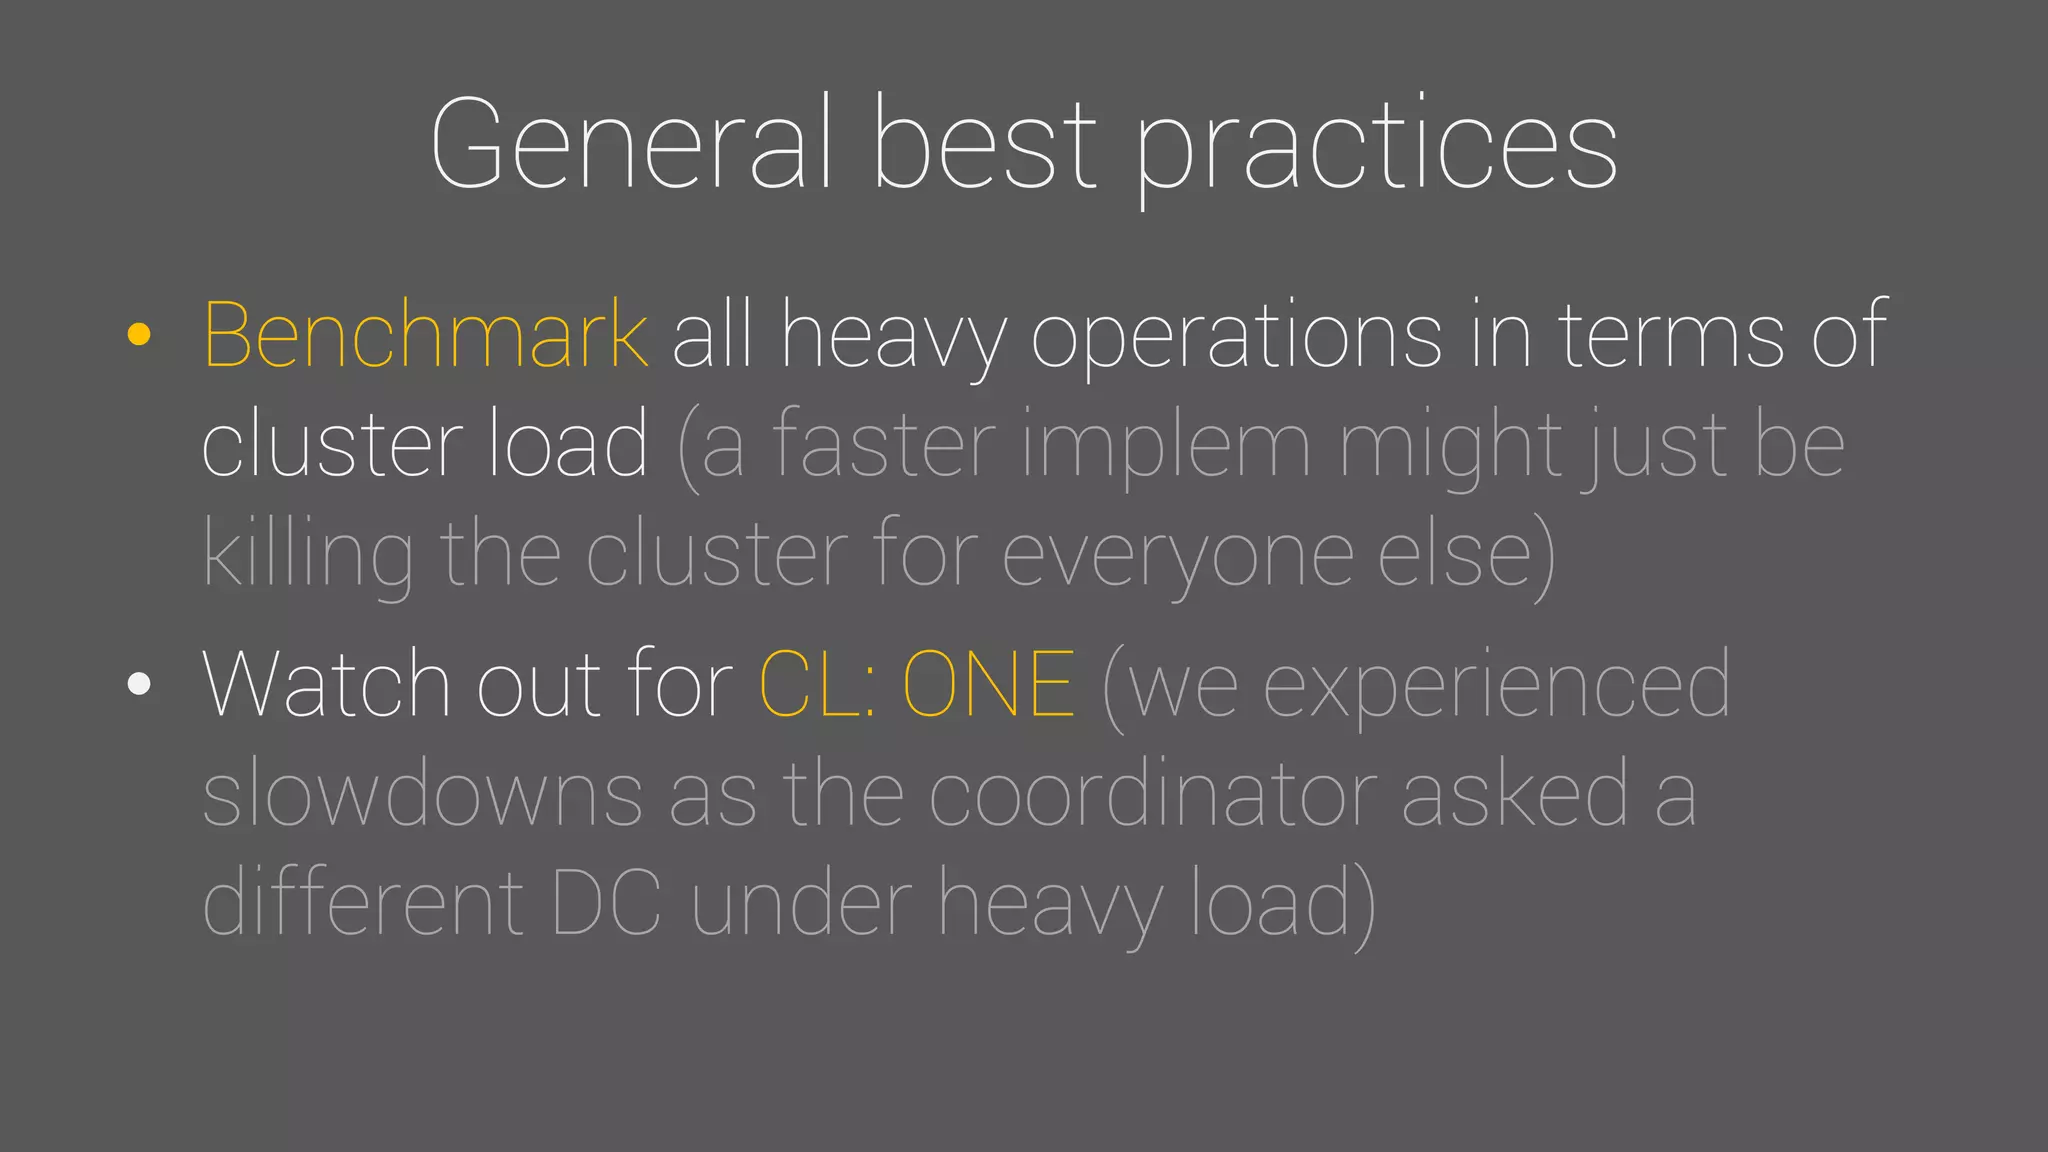

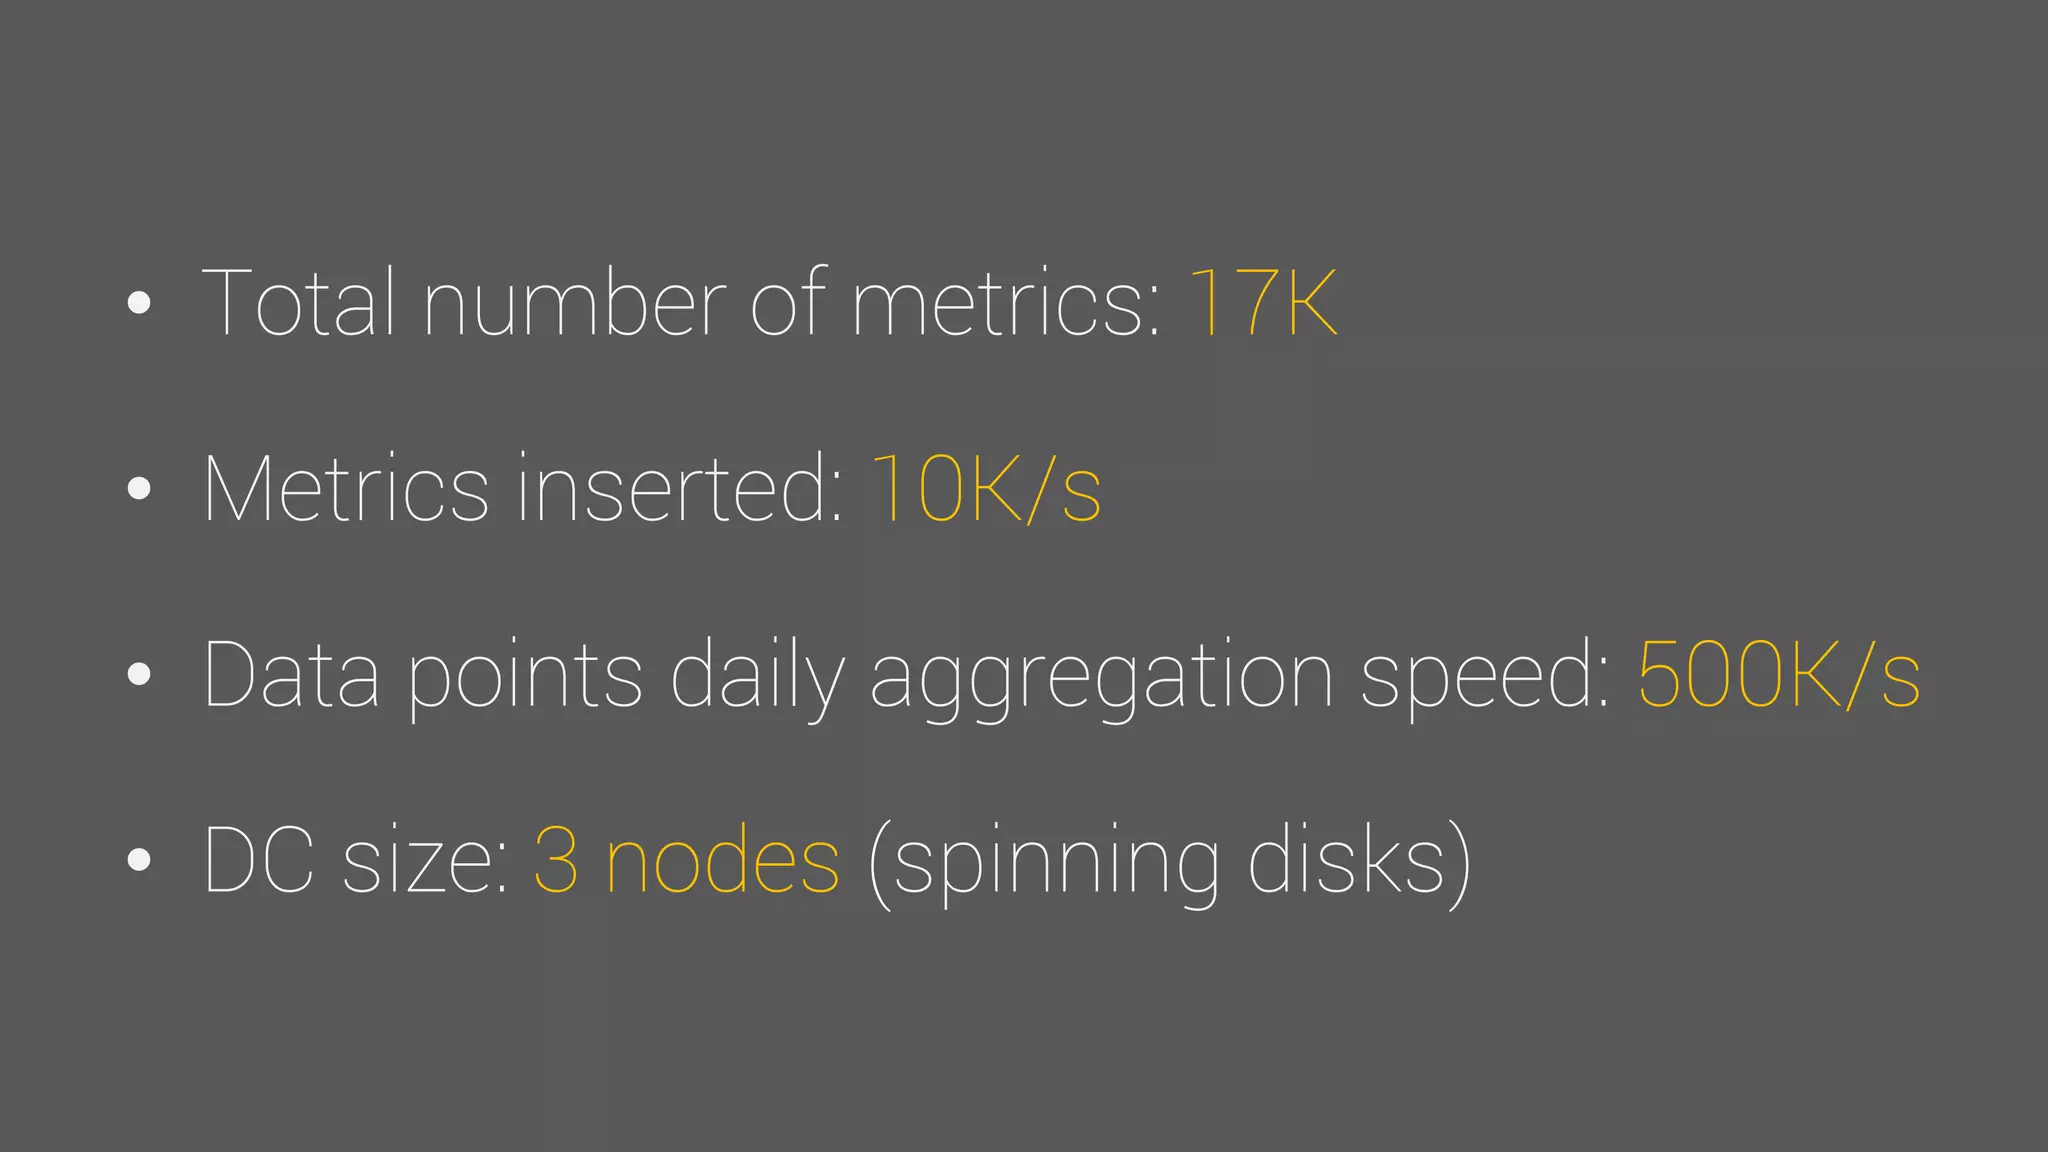
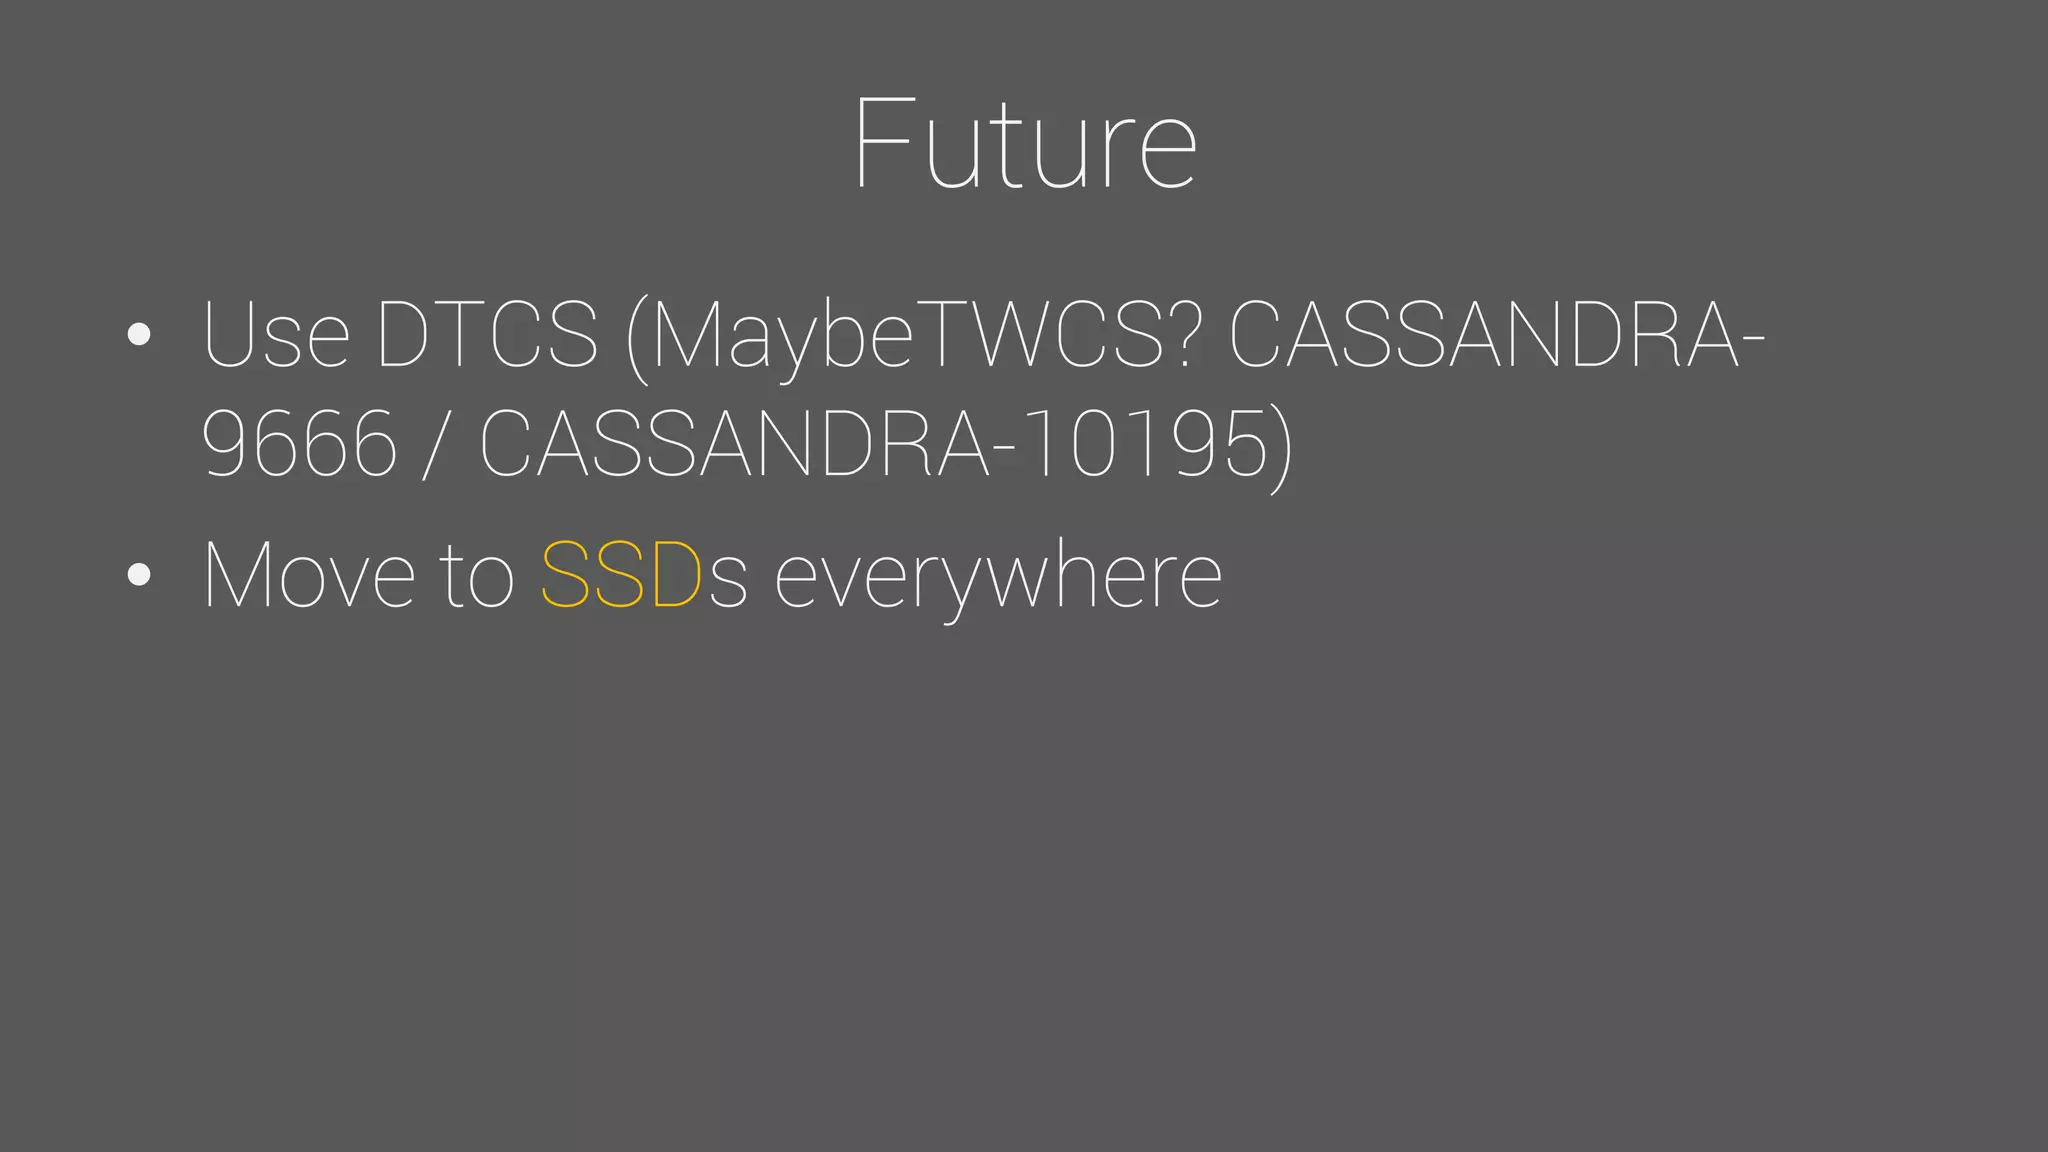


The document provides an overview of the Observer time-series application developed by Kévin Lovato, detailing its architecture, key features, and CQL schema for data management. It discusses various components like metrics aggregation, alerting mechanisms, schema best practices, and performance optimization strategies. Additionally, it outlines future plans including transitioning to SSDs and using different data storage configurations.


![Coded Agents – with UiPath SDK + LangGraph [Virtual Hands-on Workshop]](https://cdn.slidesharecdn.com/ss_thumbnails/codedagentsdeck-251215155422-5497c599-thumbnail.jpg?width=640&height=640&fit=bounds)


![Vibe Coding vs. Spec-Driven Development [Free Meetup]](https://cdn.slidesharecdn.com/ss_thumbnails/vibecodingvsspecdrivendevelopment-251209105622-43f455e7-thumbnail.jpg?width=640&height=640&fit=bounds)


