O R I G I N A L P A P E R
Social and Psychological Challenges of Poker
Kyle Siler
Published online: 25 December 2009
� Springer Science+Business Media, LLC 2009
Abstract Poker is a competitive, social game of skill and luck, which presents players
with numerous challenging strategic and interpersonal decisions. The adaptation of poker
into a game played over the internet provides the unprecedented opportunity to quantita-
tively analyze extremely large numbers of hands and players. This paper analyzes roughly
twenty-seven million hands played online in small-stakes, medium-stakes and high-stakes
games. Using PokerTracker software, statistics are generated to (a) gauge the types of
strategies utilized by players (i.e. the ‘strategic demography’) at each level and (b) examine
the various payoffs associated with different strategies at varying levels of play. The results
show that competitive edges attenuate as one moves up levels, and tight-aggressive
strategies––which tend to be the most remunerative––become more prevalent. Further,
payoffs for different combinations of cards, varies between levels, showing how strategic
payoffs are derived from competitive interactions. Smaller-stakes players also have more
difficulty appropriately weighting incentive structures with frequent small gains and
occasional large losses. Consequently, the relationship between winning a large proportion
of hands and profitability is negative, and is strongest in small-stakes games. These
variations reveal a meta-game of rationality and psychology which underlies the card
game. Adopting risk-neutrality to maximize expected value, aggression and appropriate
mental accounting, are cognitive burdens on players, and underpin the rationality work––
reconfiguring of personal preferences and goals––players engage into be competitive, and
maximize their winning and profit chances.
Keywords Poker � Gambling � Risk � Uncertainty � Competition � Behavioral economics �
Strategy � Economic sociology
K. Siler (&)
Department of Sociology, Cornell University, 323 Uris Hall, Ithaca, NY 14853, USA
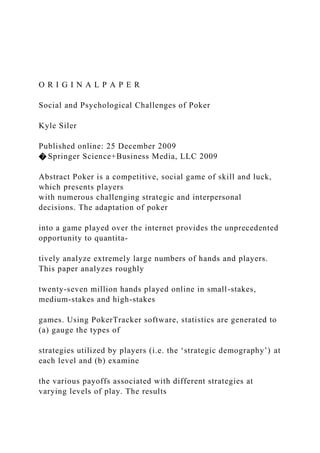
e-mail: [email protected]
123
J Gambl Stud (2010) 26:401–420
DOI 10.1007/s10899-009-9168-2
Introduction
Poker is a social and strategic card game of imperfect information, which is often invoked
as a microcosm or metaphor for economic (von Neumann and Morgenstern 1944), exis-
tential (Hayano 1982, pp. 138–140), and strategic dilemmas people face in life (Sklansky
2009). The game involves a complex tapestry of skill and luck, rationality and intuition,
mathematics and psychology, fraught with uncertainty over outcomes, best practices and
their relationships to success. Thus, poker provides a fertile context to observe micro-level
economic and social behaviors in contexts of risk and uncertainty. The advent of internet
poker in the late 1990s spurred a major increase of interest in and adoption of the game,
due to its convenience and affordable free and smal.
O R I G I N A L P A P E RSocial and Psychological Challeng.docx
1. O R I G I N A L P A P E R
Social and Psychological Challenges of Poker
Kyle Siler
Published online: 25 December 2009
� Springer Science+Business Media, LLC 2009
Abstract Poker is a competitive, social game of skill and luck,
which presents players
with numerous challenging strategic and interpersonal
decisions. The adaptation of poker
into a game played over the internet provides the unprecedented
opportunity to quantita-
tively analyze extremely large numbers of hands and players.
This paper analyzes roughly
twenty-seven million hands played online in small-stakes,
medium-stakes and high-stakes
games. Using PokerTracker software, statistics are generated to
(a) gauge the types of
strategies utilized by players (i.e. the ‘strategic demography’) at
each level and (b) examine
the various payoffs associated with different strategies at
varying levels of play. The results
2. show that competitive edges attenuate as one moves up levels,
and tight-aggressive
strategies––which tend to be the most remunerative––become
more prevalent. Further,
payoffs for different combinations of cards, varies between
levels, showing how strategic
payoffs are derived from competitive interactions. Smaller-
stakes players also have more
difficulty appropriately weighting incentive structures with
frequent small gains and
occasional large losses. Consequently, the relationship between
winning a large proportion
of hands and profitability is negative, and is strongest in small-
stakes games. These
variations reveal a meta-game of rationality and psychology
which underlies the card
game. Adopting risk-neutrality to maximize expected value,
aggression and appropriate
mental accounting, are cognitive burdens on players, and
underpin the rationality work––
reconfiguring of personal preferences and goals––players
engage into be competitive, and
maximize their winning and profit chances.
Keywords Poker � Gambling � Risk � Uncertainty �
Competition � Behavioral economics �
Strategy � Economic sociology
3. K. Siler (&)
Department of Sociology, Cornell University, 323 Uris Hall,
Ithaca, NY 14853, USA
e-mail: [email protected]
123
J Gambl Stud (2010) 26:401–420
DOI 10.1007/s10899-009-9168-2
Introduction
Poker is a social and strategic card game of imperfect
information, which is often invoked
as a microcosm or metaphor for economic (von Neumann and
Morgenstern 1944), exis-
tential (Hayano 1982, pp. 138–140), and strategic dilemmas
people face in life (Sklansky
2009). The game involves a complex tapestry of skill and luck,
rationality and intuition,
mathematics and psychology, fraught with uncertainty over
outcomes, best practices and
their relationships to success. Thus, poker provides a fertile
context to observe micro-level
economic and social behaviors in contexts of risk and
uncertainty. The advent of internet
poker in the late 1990s spurred a major increase of interest in
4. and adoption of the game,
due to its convenience and affordable free and small-stakes
niches. Reflective of the ‘‘poker
boom’’, the number of entrants in the annual $10,000 buy-in
World Series of Poker Main
Event increased from 512 in 2000, to a high of 8,773 in 2006
(Dalla 2009).
1
Internet poker
has also enabled new and more complex understandings of
poker, both when played online
and in person, via the analysis of quantitative data.
With millions of players online, wagering hundreds of millions
of dollars (Newsweek,
Nov. 20, 2009), competition is fierce. Some players use poker
as their sole or a partial
means of income, others use it as a lucrative avocation, while
others play as recreational
gamblers (Matros 2005). Thus, online poker provides an ideal
laboratory for observing the
economic decisions people make with their money, in different
competitive contexts. Since
information is almost always imperfect in poker, and
reinforcement schedules are erratic
5. for making correct moves, due to uncertainty, luck, or ‘noise’ in
the game, formulating
correct strategies cannot be done through operant conditioning,
or other objective decision-
frames alone (Tallman and Gray 1990). Given its complex and
social nature, decision-
making in poker almost always possesses some degree of
subjectivity. Tversky and
Kahneman (1974) famously posited that when people are faced
with making difficult
decisions under conditions of uncertainty, they adopt
heuristics––subjective rules and
strategies––to reach a resolution. Given that poker is rife with
such situations, and poker
literature offers a variety of strategies for approaching the
game, and numerous styles, or
belief systems (Hayano 1982, p. 106) have been observed
throughout the history of the
game (Boyd 1976; Harrington 2004).
Theoretical Overview
The confluence of short and long-term incentives and
information is another large part of
the allure and challenge of poker. The long-term strategic
heuristics of poker players
interact with contrasting short-term tactical interests, as each
6. hand and pot is contested. As
participants play numerous hands and iterate interactions, their
strategies become at least
partially revealed through their actions in the game. Thus, a bet
from a player who appears
loose-aggressive, as defined via interactions in the game,
acquires a very different
meaning, than an equivalent bet from a player employing a
tight-passive strategy. In turn,
impression management (Goffman 1959) in poker is as much
about controlling one’s own
behavior in consort with one’s impressions (i.e. ‘‘table image’’
in poker parlance) as it is
1
While the controversial UIGEA (Unlawful Internet Gambling
Enforcement Act) in the United States, and
similar restrictions on money flows in online commerce and
poker in other jurisdictions, have tempered this
growth somewhat in recent years, both online and live poker
remain much larger than they were prior to the
internet boom.
402 J Gambl Stud (2010) 26:401–420
123
influencing the perceptions of others. Advantages are derived in
7. poker from the strategic
and tactical use of betting patterns, which double as
information-rich market signals
(Spence 1973). Ideally, a player is able to control and exploit
the definitions and inter-
actions of players, including themselves. Part of the challenge
of poker is not only con-
cealing information, but also propagating bad, or lemon
(Akerlof 1970) information, for
one’s own benefit.
The increased speed, volume of hands and relative anonymity of
online poker have
changed the nature and amount of information in the game.
Firstly, internet poker removes
in-person social interaction, so symbols or ‘tells’, like personal
gestures, facial expressions,
voice tenor, braggadocio and body posture, which are famously
important in live poker
(Caro 2003). Secondly, the increased speed of online poker
hands, in addition to the ability
to play multiple games simultaneously, thus significantly
increasing the number of hands a
player can play in an hour. These large size increases allow
players to more quickly even
8. out effects of variance, short-term luck, or ‘‘statistical noise.’’
Previously, many profes-
sionals would play live poker sessions exceeding twenty-four
hours to achieve the variance
reduction from large sample sizes (Craig 2005, pp. 14, 36, 74).
Additionally, players can
acquire larger sample sizes on their own play, as well of their
opponents, and have a deeper
context to interpret actions and devise strategies.
In poker, information and interactions are used to make
decisions regarding how to
make the most competitive and profitable decisions. Knight’s
(1921) distinction between
risk and uncertainty is particularly germane to this challenge.
Risk involves uncertain
outcomes, where the probabilities of those potential outcomes
are known. Uncertainty also
involves uncertain outcomes, but where information is less
complete and perfect, and
numerical probabilities cannot be precisely assigned to various
potential outcomes. Both
risk and uncertainty are omnipresent in poker, and part of the
challenge of the game is the
ability to commensurate (Espeland and Stevens 1998)
uncertainty into risk, so precise and
9. profitable quantitative decisions can be made in each unique,
uncertain scenario the game
presents. Commensuration involves converting subjective and
uncertain qualitative data
(e.g., a hunch that an opponent may be bluffing, and the range
of cards they might play in
such a manner) converted into an objective, certain, quantitative
risk, which can then be
mathematically and logically weighted vis-à-vis pot odds and
monetary considerations.
Even without uncertainty, risk itself provides a challenge for
players to manage the
mathematically inevitable ups and downs of gambling
intelligently and responsibly.
Since poker is an emotionally evocative game rife with
uncertainty, reflective of its
strategic diversity, numerous forms of mental and monetary
accounting can emerge. Almost
all poker strategy guides advocate that players maximize
expected value in all circumstances
(e.g., Brunson 1979; Sklansky and Miller 2006), thus playing in
a risk-neutral manner (von
Neumann and Morgenstern 1944). Since simple game theory and
rational choice value
10. calculations are rendered problematic by uncertainty (Harsanyi
1986; Tallman and Gray
1990, p. 410), a more nuanced approach is needed to understand
decision making and heu-
ristic formation in poker. Prospect theory (Kahneman and
Tversky 1979) provides a lens for
understanding idiosyncratic, subjective accounting processes
and decisions people make
under conditions of uncertainty. While humans tend to be risk-
averse with gains, they tend to
be risk-loving with losses. Of note is that the difference
between a ‘gain’ and a ‘loss’ can often
be a subjective matter of framing and perception. Thus, just as
bets, actions and strategies in
poker games can carry a diversity of genuine, obfuscated and
lemon information, the social
meanings of money (Zelizer 1997) in a poker game are also part
of the mental accounting that
players engage into handle risk and uncertainty. Whether chips
represent fun, a bigger house,
a status symbol, next month’s rent and groceries, and/or one’s
self-worth, also influences
J Gambl Stud (2010) 26:401–420 403
123
11. subjective framing and accounting decisions, which influence
perceptions of, and orienta-
tions towards, risk and uncertainty.
This study maps out the ‘strategic demography’ of poker players
at different levels of
play (from small-stakes to high-stakes), and analyzes which
strategies are conducive to
winning at these different levels. In turn, this sheds light on
how reward structures and the
strategic demography of players interact at different levels.
Examining strategies helps
reveal the heuristics and economic dispositions they enact in
response to these challenges.
These data and analyses show hierarchies of knowledge and
competition, and sheds light
on why poker is challenging beyond the nuts and bolts of the
card game.
The poker game empirically analyzed in this study is No-Limit
Texas Hold’em
(NLHE), with six seats at the table (‘6Max’), with at least five
players at the table.
Famously dubbed the ‘‘Cadillac of poker’’ by poker legend
12. Doyle Brunson, this most
famous variant of poker is characterized by its simplicity of
rules (and thus, easy adoption),
and the fact that any single hand can involve players risking
their entire stack of chips. Due
in part to this freedom in the game and its inherently social
nature, NLHE has a significant
social-psychological component, in addition to the technicalities
of the card game. Further,
subterfuge and deception in poker often trump mathematics, as
encapsulated in the cli-
mactic scene of the 1962 movie, The Cincinnati Kid, where the
triumphant player muses,
‘‘[I]t’s all about…making the wrong move at the right time.’’
Due to these frequent twists
in logic, and the need for responsiveness to similarly twisted
moves by opponents, com-
puter scientists have not yet been able to create a NLHE bot
competitive at elite levels.
This lies in contrast with checkers, which has been entirely
solved; chess, where the game
has been solved to the point that the best computer program has
surpassed the best human
player alive, and Fixed-Limit Texas Hold’em, where
programmers have devised bots
13. which are very competitive with the best players in the world
(Boyle 2008). Thus, No-
Limit Hold’em is an ideal context to study heuristics, rationality
and strategy from a social-
psychological perspective, as the game transcends logic and
mathematics. As poker legend
Doyle Brunson (1979, p. 17) famously posited in his seminal
strategy text Super/System,
‘‘Poker is a game of people. That is the most important lesson
you should learn from my
book.’’ This human element further complexifies the hundreds
of millions of permutations
and combinations of cards that can be dealt.
Data
Data used for this study were acquired from HandHQ.com, a
business which observes
online poker games, then archives .txt file records of the games.
Many players use these
data to supplement sample sizes of hands on their opponents, so
they can have more
reliable statistics of the play of their opponents. The datasets
used for this research are
comprised of 17.25 million hands at NL50 (small-stakes game),
6.79 million hands at
14. NL200 (medium-stakes game) and 2.87 million hands at
NL1000 (high-stakes game). The
labels of these games refer to the standard buy-in, which is one
hundred big blinds (e.g.,
NL50 has a standard buy-in of $50, with big blinds of $0.50).
This yielded databases with
212,224 players
2
(NL50), 64,262 players (NL200) and 18,596 players (NL1000)
respec-
tively. All records of players were anonymized. Hands were
culled from December 2008 to
April 2009. Money values are in United States dollars.
2
Due to computational limitations, only 120,000 of these NL50
players could be rated by PokerTracker.
Regardless, this is still an enormous sample.
404 J Gambl Stud (2010) 26:401–420
123
Methods
These data were uploaded and analyzed using PokerTracker;
software designed to archive
15. and analyze data from poker hands played online. More
commonly, PokerTracker is also
used by many serious players, to gather quantitative information
on their own play, as well
as that of their opponents. PokerTracker, coupled with the
availability of .txt file archives
of millions of recorded hands, presents the unprecedented
opportunity to operationalize
and quantify strategies––and in turn the economic decisions and
behaviors––of tens of
thousands of players.
3
Information on the number of hands played, the cards dealt to
players, win (or loss)
rates, percentage of hands won, strategy type and overall
amount won, were compiled.
Labeling strategies is subjective and derived from behavioral
tendencies of how frequently
players bet or raise at different parts of the hand. Regardless of
how boundaries of strat-
egies are demarcated and gerrymandered, what is most
important is the relative perfor-
mance and tendencies of the player, since poker is a contextual,
interactive game. As Boyd
16. (1976) observes, someone labeled a ‘tight’ player in one game,
might be a ‘loose’ player in
another game, while implementing the same strategies. The
rules for assigning strategy
categories yielded a fairly well-dispersed population of players
across all categories (See
Appendix Table 13 for rating criteria). Hand categories vary by
the number of pots a player
enters along a continuum ‘between’ loose and ‘tight’, while
aggression is operationalized
by the propensity of players to bet or raise and put money at
risk throughout the hand.
Poker sites profit by siphoning $0.05 to $3.00 from every pot
which involves community
cards being dealt. As one moves up limits, players pay more
rake at an absolute level, but
lesser proportion of the total money on the table; this is a small
incentive for players to play
higher-stakes games. While beating the rake (in addition to the
other players at the table) is a
vital part of being a profitable poker player, adjusted big
blinds/100 hands rates are reported to
facilitate equivalent comparisons between levels. The adjusted
rate is merely the raw BB/100
17. rate (i.e. win rate), plus a correction factor for the rake taken at
each level. At NL50, the
adjustment was ?4.98 BB/100; NL 200, ?3.00 BB/100 and
NL1000, ?0.95 BB/100. Except
where noted, analyses were conducted weighting by the number
of hands each player par-
ticipated in. For example, the results of a player who played
5,000 hands was weighted five
times more heavily than a player who played 1,000.
Results
Strategic Payoff Structures and Demography
Tables 1, 2, and 3 show the payoffs for various strategies.
Payoffs are operationalized by
big blinds won per one hundred hands. Additionally, the tables
show the ‘‘strategic
demographics’’ of games at the various stakes, via the
proportion of total players labeled
with a given strategy at each level.
In general tight and aggressive strategies have the best returns
across all levels. Semi-
loose aggressive strategies also are relatively successful. As one
moves up stakes, win-rates
18. 3
While this methodology is ideal for understanding the actual
behaviors and consequences of players, from
a ‘‘pure poker’’ standpoint the theoretical relationships between
strategies, win rates and variance (i.e.
standard deviations of win rates) would be better handled by
simulation studies, which could keep player
abilities, interactions, games and luck constant.
J Gambl Stud (2010) 26:401–420 405
123
get smaller as games become tighter, more aggressive and
competitive. Profitable tight-
aggressive niches get more crowded, and the strategy becomes
less novel and remunera-
tive. Additionally, passivity gets increasingly punished as one
moves up levels.
The most obvious trend in regards to the strategic demographics
of the various levels, is
the increased proportion of aggressive players as one moves up
stakes. The tables also
show that as one moves up levels to higher stakes, the number
of passive players decreases.
This may be linked to the fact that the win rate coefficients for
passive strategies decreased
19. at higher stakes. While the number of loose players decreases
somewhat, there is a large
increase in semi-loose players. As a result of these trends, there
is a notable convergence of
players around similar tight-aggressive and semi-loose-
aggressive strategies. Since most
leading poker instructional texts advocate this type of strategy
(Sklansky and Miller 2006;
Table 1 Adjusted counts and big blind win rates for various
strategies––NL1000 (N = 1962)
Strategy Adjusted BB/100 SD N N (% of total)
Loose-aggressive/aggressive -2.59 18.44 129 6.57
Loose-aggressive/passive -10.17 20.27 110 5.61
Loose-passive/aggressive -9.12 14.48 19 0.97
Loose-passive/passive -11.55 18.45 55 2.80
Semi-loose-aggressive/aggressive 0.89 13.16 366 18.65
Semi-loose-aggressive/passive -1.31 14.78 170 8.66
Semi-loose-passive/aggressive -3.42 14.69 55 2.80
Semi-loose-passive/passive -3.32 14.28 66 3.36
Tight-aggressive/neutral 0.34 10.05 333 16.97
21. Tight-passive/aggressive 1.70 8.23 336 5.94
Tight-passive/passive 1.47 9.20 202 3.57
Minimum 750 hands played
406 J Gambl Stud (2010) 26:401–420
123
Harrington 2004), this is not a surprise. An implication of this
is that as strategies become
more similar, this may make the game more tactical than
strategic, or create niches for
other strategies. The attenuation of the negative coefficient at
the NL1000 level for loose-
aggressive-aggressive strategy is particularly interesting.
Although the mean coefficient for
this strategy is slightly negative, the high standards deviation
suggests that there are some
players who play this strategy very effectively. This may be a
function of this audit study,
where better players, capable of playing this notoriously
lucrative but risky and difficult
strategy (Harrington 2004, p. 42) tend not to occupy small-
stakes games, while recreational
22. players may emulate or utilize this same strategy with
disastrous results.
Another way of understanding the incentives and payoffs
associated with various strate-
gies involves examining the characteristics of the biggest
winners and losers at each level.
This will be done first by win rate (big blinds/100 hands), then
by overall amount won.
Getting Rich Quick, or the Road to Ruin?
Tables 4, 5 and 6 show the representation of different strategies
amongst the players with
the highest and lowest win rates (or loss rates) at each level.
Notable is the consistent overrepresentation of loose and
aggressive players amongst
both the top and bottom hundred players. Such strategies are
much more overrepresented
amongst losing than winning players. This raises the question of
to what degree these
divergent values are out of skill and luck respectively. If loose-
aggressive strategies are
more difficult to play, it stands to reason, particularly at lower
levels, that such strategies
would be particularly overrepresented amongst the biggest
23. losers. However, it could also
be expected that there would be a reasonable proportion of such
players who have mastered
the difficult and stressful strategy who also occupy the upper
tail of the bell curve. This
thesis would be supported by the data, as would an additional or
hypothesis that it is merely
luck and variance causing these outliers. Since loose-aggressive
strategies appear to have
significantly higher standard deviations, it is inevitable that
some players would be placed
on the high end of the relatively wider bell curve, regardless of
their skill level. This
dilemma illustrates the fusion of skill and luck in poker, and
how difficult the two entities
are to parse out from one another.
Table 3 Adjusted counts and big blind win rates for various
strategies––NL50 (N = 9313)
Strategy Adjusted BB/100 SD N N (% of total)
Loose-aggressive/aggressive -6.24 19.49 893 9.59
Loose-aggressive/passive -9.47 18.62 507 5.44
Loose-passive/aggressive -5.03 16.35 468 5.03
28. 123
Grinding for Gold
When one looks at the top players by actual amount won, a
different trend emerges.
Tables 7 and 8 show summary statistics of the top twenty
winners and losers at each level,
while Tables 9 and 10 shows the strategic demographics of
those categories.
The most notable trend in the tables is that the mean win-rates
are relatively modest.
None of the biggest winners at any of the levels were even close
to being in the top
hundred win rates. The average win rates in Table 7 work out to
the 76th percentile of win
rates for the entire population of NL50 and NL200 players, and
the 68th percentile for
NL1000. The way these players distinguished themselves to be
the biggest winners in the
sample was by playing an enormous volume of hands at a
moderately profitable rate. There
are a number of potential explanations for this phenomenon.
Firstly, players with a higher
29. (or lower) win rate are likely to move up or down stakes, and
thus fall outside of the sample
in the study. Secondly, big winners may be the inevitable
upward outliers of a large
community of players with similar skill levels playing large
volumes of hands. Thirdly,
some players might get ‘‘stuck’’ at a level, where they are good
enough to break even or
marginally profit, but do not feel comfortable moving up any
higher, where the stakes are
higher, and their already razor-thin win rate will be eroded.
Fourthly, some poker players
adopt a standard tight-aggressive ‘‘grinding’’ (Matros 2005, p.
69) strategy, oriented
towards low-risk outcomes, via capitalizing on occasional
mistakes of others. While this
strategy puts a glass ceiling on one’s win rate, it is simple and
low-variance enough to play
at a high volume, playing multiple games simultaneously online
to generate these sub-
stantial winnings. Variance may be reduced, but since potential
win-rate is constrained by
conservative play, even this lower degree of variance can put
skilled players in the red,
30. especially without a large volume of hands to realize the small,
but stable and positive win-
rate over the long-term.
Figure 1 shows the adjusted win rates for players with a
minimum of 750 hands at
NL200. While win rates can be very volatile in the short-term,
through some combination
of players moving up or down stakes (or in some cases, going
broke), long term win rates
converge slightly above zero, after the rake adjustment and the
removal of players with less
than 750 hands, who tended to be losing players.
Patience and Pyrrhic Victories
Another cognitive challenge in online poker which
differentiates winners and losers––
particularly at lower stakes––is distinguishing the difference
between winning hands and
winning money. As Table 11 shows, a high win percentage (i.e.
the percentage of total
hands won by a player) is negatively correlated with win rate,
although this value decreases
at higher stakes.
This is an unusual and seemingly counterintuitive incentive
31. structure. After all, is not
the object of every hand in poker to win it? This phenomenon
can be explained by the fact
that players who win large proportions of hands lose money,
because they lose a few hands
of great value. In other words, these players overweight
frequent small gains vis-à-vis
occasional large losses. This is an issue particularly germane to
No-Limit Hold’em, where
on any given hand, all of a player’s chips can be put at risk. It
also appears that patience is
rewarded, although the more aggressive and skilled games at
NL1000 attenuates this
somewhat, as players presumably cannot rely on winning big
pots off of mistake-prone
players as often or lucratively, as in lower limit games. Since
one of the tenets of prospect
theory (Kahneman and Tversky 1979; Degeorge and Zeckhauser
1993, p. 1331) is that
J Gambl Stud (2010) 26:401–420 409
123
people tend to underweight large losses and overweight small
32. gains, it makes sense that
many players employ strategies influenced by this unprofitable
disposition.
4
An additional
explanation for this, is that money online assumes a non-
material form, which is easily
thrown around. Studies in behavioral economics have shown
that people tend to be more
profligate spenders with credit cards over cash (Feinberg 1986).
Thus, while winning hands
Table 6 Proportions of strategies among top and bottom 100
(BB/100 hands rates) players, NL50
Strategy Bottom 100 players Top 100 players
N % of
overall
sample
Over(under)-
representation
N % of
overall
sample
Over(under)-
representation
34. amount
won
Min Max Avg.
BB_100
Min Max
NL50 76418 13632 268658 2313 1712 4172 5.33 1.21 13.99
NL200 78416 28343 199848 13586 9961 24402 5.10 2.3 9.29
NL1000 90049 30966 195516 67227 39641 188983 4.53 1.17
11.01
Table 8 Summary statistics of top 20 losing players (amount
lost) at various stakes
Stakes Avg.
hands
Min Max Avg.
amount
lost
Min Max Avg.
BB_100
Min Max
NL50 22152 1801 106096 2839 2052 4856 28.96 1.96 156.00
NL200 53982 5256 241193 7399 5706 24939 11.43 0.87 82.71
NL1000 32914 4224 134729 34804 21874 75935 16.82 1.12
61.73
35. 4
Other implications of this is that players will tend to play more
tentatively and protect small wins, and
play more aggressively during a losing session, desperately
trying to get even at any risk or cost.
410 J Gambl Stud (2010) 26:401–420
123
may be cognitively satisfying and reinforces learning, the
occasional large loss, repre-
sented similarly as flashing pixels on a computer screen, does
not carry a proportional
cognitive, social or economic accounting impact for many.
Table 9 Strategies of top 20
winning players (amount won)
at various stakes
NL50 NL200 NL1000
Semi-loose-aggressive/aggressive 1 1 4
Tight-aggressive/aggressive 9 14 9
Tight-aggressive/neutral 3 6 7
Tight-aggressive/passive 1 0 0
37. Poker Hands and Prospect Theory
The challenges and incentive structures in poker can be further
clarified through under-
standing the various card combinations players are dealt in No
Limit Hold’em. As per
Billings et al.’s (2002) artificial intelligence model of poker,
poker hands differ in the main
categories of strength, certainty and speculativity. Strength
entails the likelihood that a
hand will be best after five random community cards are drawn.
Uncertainty involves the
need for additional information (via additional––and preferably
all five––face-up com-
munity cards to be dealt) to gauge and the strength, or lack
thereof, of the hands. For
further details on the combinations of cards which yield these
categories, see Appendix
Table 14. Of note is that these strategic categories entail broad
boundaries, and there still
remains heterogeneity in strategies and tendencies of players
within each category.
However, the categories serve as a solid starting point to sort
out the relative strategies
38. employed by players.
No-Limit Hold’em is a game defined by implied odds (Sklansky
and Miller 2006, p. 33),
which often makes chasing speculative and uncertain hands
profitable, even if the chances
of them succeeding are slim. Since speculative ‘‘long-shot’’
hands have the potential for
large payoffs, they can be extremely valuable. In contrast,
strong hands suffer from reverse
implied odds (p. 58), as they have fewer options for
improvement as the community cards
get dealt and the hand progresses. Implied odds offer the
prospect of large losses in the
future, against small losses in the present, while reverse implied
odds offer the prospect of
small gains in the present against potentially large losses in the
future. Thus, stronger and
more certain hands provide a payoff structure more conducive
to frequent small to medium
wins and occasional large losses. As shown in Table 11 this
incentive structure (frequent
small gains, occasional large losses) is particularly dangerous
for weaker players. In
contrast, uncertain and weaker hands offer an incentive
structure based on frequent small
39. losses, tempered by the prospect of occasional large wins.
Big pairs are the hands with the strongest initial strength, and
carry high levels of
certainty, as a high pair is often the winning hand, even after all
of the community cards are
dealt. However, like all pairs, they are relatively unlikely to
improve as community cards
are dealt. Further, when big pairs improve, it is often
superfluous and prone to scaring off
further bets, so they have little speculative value. Medium pairs
have moderate initial
strength, and may end up being the winning hand unimproved.
Like all pairs, its value
tends to be very certain, whether the hand is improved by the
community cards or not.
While medium pairs are less rarely winning hands than their big
pair counterparts, they do
Table 11 Regression of big blind win rates (per 100 hands) on
win percentage at various stakes
Stakes NL1000 NL200 NL50
Win percentage -0.348***
(0.001)
-0.734***
(0.000)
-0.876***
40. (0.000)
Constant 7.08***
(0.015)
14.44***
(0.008)
17.20***
(0.007)
N (hands) 15520695 35948809 49521492
R
2
0.011 0.072 0.092
Note: Numbers in parentheses are standard errors
Weighted by number of hands played per player
?
p 0.10; * p 0.05; ** p 0.01; *** p 0.001 (two-tailed tests)
412 J Gambl Stud (2010) 26:401–420
123
have high speculative value. Finally, small pairs have low
initial strength, but have high
certainty and high speculative value.
Similarly, Broadway cards are primarily oriented towards
41. becoming pairs, so they share
the characteristics of pairs of having high certainty. Since they
rely on community cards to
make a pair, their initial strength is moderate, and their
speculative value is low.
Suited and connected cards are drawing hands oriented towards
making straights and
flushes; uncertain drawing hands which only become certain
after all community cards are
dealt. Betting patterns and incentives (which can make players
fold) can often preclude all
of the hands being dealt, so these hands are both uncertain and
speculative. Since these
include many low cards, their initial value is very low.
Suited Broadway cards simultaneously possess both of the
differing incentive structures
of suited connectors and offsuit Broadway cards.
Table 12 shows the distributions of different hand categories at
different stakes, in
addition to their payoffs. These data reveal differing incentive
structures existing at each
level.
The larger coefficients associated with most hand categories at
NL1000 may be
reflective of a greater willingness to play hands to completion,
42. which is a consequence of
the increased aggression at that level. In particular, the
increased proportion of big and
medium pairs shown down suggest that due to the aggressive
context, higher-stakes players
often need to intelligently accept uncertain risks and
propositions to be profitable, even
though they involve the potential for large losses. Players who
continually avoid risk,
uncertainty and conflict, will be prone to being dominated.
Another interesting finding is
that the gap between the profitability of medium and small pairs
widens as one moves up
stakes, as does their frequency of being shown down. Notably,
the value of medium pairs is
less than small pairs at NL50, despite the fact that medium pairs
are a stronger starting
hand. Small pairs are speculative and acquire fairly certain
values, so they are generally
easy to play at all levels. Thus, the differences in payoffs and
proportions played between
the limits are relatively small compared to other hand
categories. However, medium pairs
also possess showdown value (the possibility the hand will
remain a winner unimproved),
43. which add reverse implied odds and marginally (un)profitable
bets to their incentive
structure. These data suggest that on the whole, these payoff
sets are difficult for the
relatively less skilled players at NL50 to handle, and are
increasingly mastered as one
moves up stakes. Thus, lower-stakes players appear to have
more difficulty with ambig-
uous and narrowly (un)profitable payoff sets and incentives.
The results for suited connectors––weak, speculative and
uncertain hands––show some
of the risks and consequences of aggression at higher stakes.
The progressively lower
proportion of hands of this category, and lower coefficients
suggest at higher levels suggest
that as one moves up stakes, one must take gambles with
uncertain values in order to be
successful. Gordon (2005, p. 245) suggests that one of the big
innovations of high-stakes
internet players, is to play uncertain or marginal hands very
aggressively, to capitalize on
fold equity (winning the pot uncontested by making opponents
fold). The increased speed
44. and quantity of hands that online poker allows, makes the
absorption of the high variance
of such moves and strategies possible. This strategy is in part a
counter-exploitation of the
scenario that players at higher skill levels are generally skilled
enough to shape incentives
to discourage uncertain hands from acquiring additional
information by getting to see one
additional card cheaply. As obvious and lucrative sources of
profit are eroded by increased
skill and competition in a game, riskier and marginal sources of
value with greater
uncertainty must be exploited. In contrast, players at NL50 are
less skilled and less
aggressive, and thus allow uncertain and/or speculative hands to
see all of the community
J Gambl Stud (2010) 26:401–420 413
123
cards, which allows them to acquire certainty and be shown
down profitably more often;
hence, the higher proportion and coefficient for suited
connectors at NL50.
45. The offsuit Broadway results suggest that at higher stakes,
players use these hands more
selectively, but more profitably. These moderately strong,
certain and non-speculative
hands are often deceptively attractive to weaker players. The
lower proportion of offsuit
Broadway hands suggests that at higher stakes, players are more
likely to fold these hands,
which are very conducive to reverse implied odds. As a result,
the profitability of these
hands increases. Finally, suited Broadway hands––which are
comprised of both the
incentives of suited connectors and Broadway hands––are more
played and profitable at
higher levels. This appears to speak to the ability of high stakes
players to reconcile
complex and complementary incentive structures.
A limitation of this audit study is that hand information is only
available when hands are
played to their conclusion, and are not shown down and
recorded in the poker site’s .txt
Table 12 Regression of big
blind win rates (per 100 hands)
on hand type at various stakes
46. For hand type categories, % of
total N values do not include
mucked N
Note: Numbers in parentheses are
standard errors
?
p 0.10; * p 0.05;
** p 0.01; *** p 0.001
(two-tailed tests)
Stakes NL1000 NL200 NL50
Hand type
Big pair 958.31***
(56.77)
797.78***
(41.82)
713.53***
(36.95)
N 50906 83426 343102
% Total N 11.18 10.78 10.67
Medium pair 341.69***
(49.36)
274.23***
(36.37)
274.82***
47. (32.13)
N 57957 90855 355731
% total N 12.73 11.73 11.07
Small pair 296.15***
(40.62)
260.19***
(29.93)
280.91***
(26.44)
N 50817 85405 360583
% total N 11.16 11.03 11.22
Suited connectors 73.48**
(24.50)
74.44***
(18.05)
87.72***
(15.95)
N 95358 164778 690270
% total N 20.95 21.28 21.47
Suited broadway 107.23**
(35.95)
91.23**
48. (26.49)
73.01**
(23.40)
N 65199 108596 447924
% total N 14.32 14.03 13.93
Offsuit broadway 61.13
?
(31.96)
51.05*
(23.55)
51.51*
(20.80)
N 134990 241174 1017006
% total N 29.65 31.15 31.64
Mucked -74.41
(97.53)
-74.07
(71.86)
-82.80
(63.49)
N 15480211 23986034 92013486
% total N 97.14 96.87 96.62
49. Constant 63.86***
(8.81)
61.60***
(6.49)
67.27***
(5.74)
R
2
0.704 0.757 0.779
Total N (hands) 15935438 24760268 95228102
414 J Gambl Stud (2010) 26:401–420
123
files. As evidenced by the extremely large proportion of hands
that were mucked (where
the player did not have to reveal their cards due to folding, or
inducing other players to
fold), such hands comprise the vast majority of the sample data.
5
However, the propensity
of players to play different hands can still be deduced by
looking at the proportion of times
50. the hand was shown down (i.e. played to completion).
Comparing the proportions of hands
shown down and available in the dataset provides data to
suggest which hands are more
prone to being mucked, and filling in these lacunae in the
datasets. Even though a 0.5%
difference in N values between stakes works out to only one
hand in two hundred, this is an
important difference, considering these premium hand
categories only comprise roughly
one in fifteen hands and that hands are rarely shown down (as
shown by the large mucked
proportions). Thus, trends across limits suggest that there are
subtle, but profound changes
in the behaviors and incentive structures when one moves up
stakes.
Implications
DiMaggio (2002) adapted Keynes’ (1936) famous edict that
‘‘animal spirits’’ shape eco-
nomic behavior and the economy, emphasizing the role of
‘‘emotional buoyance’’ in
economic success. Analogously, the results in this study suggest
that, on the whole,
aggression is a profitable strategy in the uncertain realm of
51. online poker. However, the
heavy losses often associated with loose-aggressive play,
suggests that there is a fine line
between aggression and foolhardiness for many players. To be
successful in poker, animal
spirits must be stoked, but also intelligent, refined and
channeled strategically. As Holden
(2005) mused about Lee Jones’ tight-aggressive strategy
suggestions, ‘‘I only hope I can
summon the self-discipline to play [them.]’’ The optimal
tradeoffs between aggression and
restraint can be difficult to reach, given the contradictions
between the two elements. Given
that animal spirits are most important under conditions of
Knightian uncertainty
(DiMaggio 2002, p. 80), the successful channeling and
regulation of these human impulses
and cognitions is key to success in poker, and beyond.
Most elite high-stakes players are known for prominently
employing loose-aggressive
strategies (Harrington 2004, pp. 42–45; Greenstein 2005). Given
the high standard devi-
ations of win rates associated with such strategies, this raises
the question of to what degree
52. extreme positive outliers enjoy their status due to luck or skill.
Taleb (2004) suggested that
many successful investors with suboptimal strategies can
become rich, due to the fact that
there are so many people in the population taking chances, and
even suboptimal strategies
have a modest chance of succeeding. In a population of
thousands, it is conceivable, if not
inevitable, that some unskilled players will sneak through.
Thus, being able to distinguish
random but powerful trends as caused by skill or luck (Gilovich
et al. 1985) is a recurrent
challenge in poker. This also explains why, unlike in pure skill
games like chess, less
skilled players will buy-into poker games. Such players may be
unable to acknowledge
they have inferior chances, and the chance to win despite
lacking skill helps obscure this
reality.
The research suggests that competitive edges in high-stakes
games are relatively
modest, and elite players generally play higher-stakes, higher
variance and more com-
53. petitive games than the highest limit in this study (NL1000,
6Max). Thus, it is not sur-
prising that stories abound of wealthy and successful
professional poker players who have
5
The only way to get information about folded hands would be to
receive data directly from online poker
companies themselves. Thus far, such sites have been very
reluctant to release data.
J Gambl Stud (2010) 26:401–420 415
123
gone deeply into debt (Duke 2006, p. 198) or broke on
numerous occasions (Greenstein
2005, p. 9) throughout their careers. As Malmuth muses (1999,
p. 35), the difference
between good and great gamblers is that the latter are willing to
take high variance
marginal gambles with favorable odds, often with standard
deviations higher than their
win-rate. Accordingly, some great gamblers will go broke––
sometimes repeatedly––in
their careers. This raises the paradox and cognitive framing
issue that high-stakes players
54. must treat money and their decisions with reverent strategic
care, yet also willing to be
daring and cavalier with them. Money is simultaneously all-
important and worthless.
Successful players tend to handle bad beats and financial swings
stoically, if not robotically
(Hayano 1982; Browne 1989). However, alexithymia - difficulty
identifying and
expressing feelings - is also associated with problem gambling
among poker players
(Mitrovic and Brown 2009). In another paradox, the line
between riches and ruin can be
extremely precarious and volatile, which presents a difficult
incentive structure for risk-
averse humans to handle.
There are a number of cognitive challenges inherent to
successful poker strategy.
Coupled with the need for ‘‘refined aggression’’, profitable
players must learn to not
overweight high frequencies of small gains vis-à-vis rare large
losses. However, at the
same time, such players also benefit from a willingness to
accept gambles with reverse
implied odds intelligently, and sometimes be willing to not
swerve in risky ‘‘chicken’’
55. games of aggression encapsulated within the larger game of
poker. Further, successful
loose-aggressive players must accept stress and high variance,
in addition to mastering the
technical complexities of the strategy. Players must also
distinguish between skill and luck
effects to learn more about the game, their opponents and refine
their strategies. The
process of dealing with these challenges and shaping ones
behaviors and preferences
accordingly is dubbed rationality work (also see: Elster 1983;
Sally 2000).6 As prospect
theory (Kahneman and Tversky 1979) suggests, many of these
impulses and predisposi-
tions toward risk and uncertainty are widespread amongst
humans, and thus, it requires a
concerted effort to reconfigure such preferences appropriately.
Not surprisingly, some
successful (Hanusa 2006; Dalla and Alson 2006; Matusow et al.
2009) and losing (Sch-
wartz 2006) poker players have exhibited an inability to harness
their attitudes towards risk
in other contexts in their lives, with disastrous consequences.
In addition to this myriad of cognitively challenging incentive
56. structures, players still
must learn how to appropriately distinguish skill and luck as
causal factors in the game, to
learn and refine strategies. As it is impossible to parse skill and
luck out perfectly, poker
players are particularly prone to committing the fundamental
attribution error. Heider
(1958) divided internal (in this case, skill) and external (luck)
factors into four main
attributes (Hayano 1982, p. 109). Difficulty of the task and luck
serve as external attributes,
while skill and effort function as internal attributes. Hayano
(1982, p. 110) found that
losing players highly emphasized the role of luck in explaining
their losses. While this
allowed them to retain their self-image as competent poker
players, albeit at a cost of
further justifying and perpetuating their incompetence and
further losses. In contrast,
winning players were prone to including personal responsibility
and efficacy in their
explanations for winning or losing. In turn, poker provides the
sort of context where a
player can be ‘‘unskilled and unaware of it’’ (Kruger and
Dunning 1999), which is a large
57. 6
Poker is rife with emotion work (Hochschild 1983) as well,
from concealing one’s true feelings about the
situations they are in (i.e. ‘‘keeping a poker face’’) and dealing
with adversity and maintaining emotional
control and staying off ‘‘tilt’’, where emotions cloud the ability
of a player to make intelligent and optimal
decisions (Browne 1989).
416 J Gambl Stud (2010) 26:401–420
123
source of profits for skilled players. This is particularly
dangerous for some weaker players,
as since the skill-based components of poker give players some
elements of control, they
may be unaware of the reality that their naı̈ veté has rendered
this control illusory (Griffiths
1990; Mitrovic and Brown 2009). Thus, receiving and filtering
feedback appropriately to
facilitate learning and strategic and tactical adjustments is
important, and is another
cognitive challenge poker presents.
Utility maximization and most poker strategy guides
(Harrington 2004; Sklansky and
58. Miller 2006) emphasize the importance of maximizing expected
value for playing winning
poker. This is a theory where risks and bets are taken,
regardless of their variance, or
payout structure, as long as they have a positive expected value.
Maximizing expected
value often involves taking risks with frequent low or negative
payouts, as long as they are
outweighed by relatively rare positive events. Risk neutrality is
assumed by such a valu-
ation frame, which lies in contrast to marginal utility theory and
prospect theory, which
have both found that humans tend towards risk aversion,
particularly when dealing with
gains. Thus, adopting risk neutrality (or even risk-loving)
dispositions is part of challenge
of poker, and is part of the emotional and preference
management poker players engage in.
Given that poker is an emotionally evocative game (Browne
1989), and players often have
a variety of economic, psychological, house-holding and social
pressures hinging on the
results of their play (Hanusa 2006), adopting a risk-neutral
orientation of maximizing
59. expected utility can be very difficult, emotionally, if not also
cognitively.
Conclusion
Beneath the card game of poker is a meta-level competition of
rationalities and handling
the burdens of different psychological stressors. As players
move up stakes, competitive
edges shrink, and uncertainty about the strategic play of
opponents and chances for profit
increases, commensurating uncertainty into precise, quantitative
risk becomes much more
difficult. Further, to maximize profitability, players must
reconfigure their preferences and
behaviors in a manner which goes against normal human
preferences. Going against
marginal utility theory in economics, risk neutrality perceives a
dollar to keep one out of
poverty the same way it treats a dollar serving as tip money at a
fancy restaurant. Relat-
edly, Gray and Tallman (1987) found that the risk and cost
sensitivity characteristic of
most people’s preferences leads to decisions which do not
maximize gains and minimize
losses. Losing these sensitivities and adopting a risk-neutral
frame for decision-making
60. may maximize income potential, but also requires effort to
reconfigure often deeply rooted
human preferences.
Poker is a very complex game, and the nuts and bolts strategy of
the card game takes a
great deal of effort and intelligence to master. However,
mastering the card game is only
part of the challenge of becoming a successful poker player
over the long run. Rationality
work is vital, as many ‘‘best strategies’’ in poker implicitly
involve adopting dispositions
towards risk, uncertainty and accounting that often go against
the normal economic
preferences of most humans. When dealing with the mercurial
vicissitudes of chance and
luck in poker, players need to learn how to parse out correctly
what they can and cannot
control, without attributing errors to chance or external
circumstances in defense of their
confidence, and emotional and intellectual self-control. As not
all players develop these
skills fully, weaknesses or ‘‘leaks’’ in players’ games can be
psychological and sociological
61. in nature, in addition to being due to weaknesses in how they
calculate odds or play the
game.
J Gambl Stud (2010) 26:401–420 417
123
The rationality work and challenges poker players face, entail
meta-games of orienta-
tions towards risk, which underlie the more visible game of
cards being played. Doyle
Brunson was right to say that poker is primarily a game of
people. However, the biggest
opponent for many players is themselves, given the challenges
of optimizing one’s mindset
and strategies, both in the card game, and the meta-games of
psychology, rationality and
socio-economic arbitrage which hover beneath it.
Acknowledgments The author thanks Tony Puddephatt, H. Ted
Welser, Robb Willer and the Cornell
Social Psychology Lab Group for helpful feedback and
suggestions in regards to this project. The author
also acknowledges Kim Burlingame, Janet Heslop and the
Cornell Institute for Social and Economic
Research for providing the computing resources and support
necessary to make this project possible. Finally,
62. the author is very grateful to HandHQ.com for providing access
to the data which this research is based
upon.
Appendix
Table 13 Rating criteria and operationalizations for various
strategies
Strategy % of hands played % of hands raised Aggression factor
a
Loose-aggressive/aggressive C35 C12 C2.0
Loose-aggressive/passive C35 C12 2.0
Loose-passive/aggressive C35 12 C2.0
Loose-passive/passive C35 12 2.0
Semi-loose-aggressive/aggressive 25 35 C12 C2.0
Semi-loose-aggressive/passive 25 35 C12 2.0
Semi-loose-passive/aggressive 25 35 12 C2.0
Semi-loose-passive/passive 25 35 12 2.0
Tight-aggressive/aggressive 25 C12 [3.0
Tight-aggressive/neutral 25 C12 2.0 3.0
Tight-aggressive/passive 25 C12 2.0
Tight-passive/aggressive 25 12 [2.0
Tight-passive/passive 25 12 2.0
a
The formula for aggression factor is (total times bet ? total
times raised)/(total times called). See Pok-
erTracker Manual (2009)
Table 14 Poker hand classifications
Big pairs AA, KK, QQ
63. Medium pairs 88, 99, TT, JJ
Small pairs 22, 33, 44, 55, 66, 77
Suited
connectors
32s, 42s, 43s, 53s, 54s, 64s, 65s, 75s, 76s, 86s, 87s, 97s, 98s,
AKs, AQs, J9s, JTs, KJs, KQs,
KTs, QJs, QTs, T8s, T9s [Note: Two and three-gap suited
connectors (e.g., 96s, J7s)
could arguably also be included, but for these purposes, a more
focused sample is
preferable]
Suited
broadway
AJs, ATs, AKs, AQs, JTs, KJs, KQs, KTs, QJs, QTs
Offsuit
broadway
AJo, AKo, AQo, ATo, JTo, KJo, KQo, KTo, QJo, QTo
418 J Gambl Stud (2010) 26:401–420
123
References
Akerlof, G. A. (1970). The market for ‘‘lemons’’: Quality
uncertainty and the market mechanism. Quarterly
64. Journal of Economics, 84(3), 488–500.
Billings, D., Davidson, A., Schaeffer, J., & Szafron, D. (2002).
The challenge of poker. Artificial Intelli-
gence, 134(1–2), 201–240.
Boyd, S. H. (1976). Poker playing as a dramaturgical event:
Bull power, the meaning and commitment for
efficacious gamesmanship. In D. F. Lancy & B. A. Tindall
(Eds.), The study of play: Problems and
prospects: Proceedings of the first annual meeting of the
association for the anthropological study of
play (pp. 123–130). West Point, NY: Leisure Press.
Boyle, A. (2008). Poker-playing robots and more. Posted:
Friday, July 11, 2008. Retrieved June 13, 2009,
from
http://cosmiclog.msnbc.msn.com/archive/2008/07/11/1195348.a
spx.
Browne, B. R. (1989). Going on tilt: Frequent poker players and
control. Journal of Gambling Studies, 5(1),
3–21.
Brunson, D. (1979). Super/system: A course in power poker.
New York: Cardoza.
Caro, M. (2003). Caro’s book of poker tells. New York:
Cardoza.
Craig, M. (2005). The professor, the banker and the suicide
king: Inside the richest poker game of all time.
New York: Grand Central Publishing.
Dalla, N. (2009). WSOP history––from Moss to Gold.
http://www.wsop.com/wsop/history.asp.
Dalla, N., & Alson, P. (2006). One of a kind: The rise and fall
of Stuey ‘‘the kid’’ Ungar, the world’s greatest
65. poker player. New York: Atria.
Degeorge, F., & Zeckhauser, R. (1993). The reverse LBO
decision and firm performance: Theory and
evidence. The Journal of Finance, 48(4), 1323–1348.
DiMaggio, P. (2002). Endogenizing ‘‘animal spirits’’: Toward a
sociology of collective response to
uncertainty and risk. In M. Guillen, R. Collins, P. England, &
M. Meyer (Eds.), The new economic
sociology (pp. 35–59). New York: Sage.
Duke, A. (2006). How I raised, folded, bluffed, flirted, cursed,
and won millions. New York: Plume.
Elster, J. (1983). Sour grapes: Studies in the subversion of
rationality. Cambridge: Cambridge University
Press.
Espeland, W. N., & Stevens, M. L. (1998). Commensuration as
a social process. Annual Review of Soci-
ology, 24, 313–331.
Feinberg, R. A. (1986). Credit cards as spending facilitating
stimuli: A conditioning interpretation. Journal
of Consumer Research, 13(3), 348–356.
Gilovich, T., Vallone, R., & Tversky, A. (1985). The hot hand
in basketball: On the misperception of
random sequences. Cognitive Psychology, 17, 295–314.
Goffman, E. (1959). The presentation of self in everyday life.
New York: Anchor Books.
Gordon, P. (2005). Phil Gordon’s little green book: Lessons and
teachings in no limit Texas Hold’em. New
66. York: Simon Spotlight.
Gray, L. N., & Tallman, I. (1987). Theories of choice:
Contingent reward and punishment applications.
Social Psychology Quarterly, 50(1), 16–23.
Greenstein, B. (2005). Ace on the river: An advanced poker
guide. Fort Collins: Last Knight Publishing.
Griffiths, M. D. (1990). The cognitive psychology of gambling.
Journal of Gambling Studies, 6(1), 31–42.
Hanusa, E. (2006). Full house: Raising a family on poker. Slate.
Retrieved June 3, 2006, from
http://www.slate.com/id/2144866/.
Harrington, D. (2004). Harrington on Hold’em (Vol I).
Henderson, NV: Two Plus Two Publishing.
Harsanyi, J. (1986). Advances in understanding rational
behavior. In J. Elster (Ed.), Rational choice (pp. 82–
105). New York: NYU Press.
Hayano, D. M. (1982). Poker faces: The life and work of
professional card players. Berkeley: University of
California Press.
Heider, F. (1958). The psychology of interpersonal relations.
New York: Wiley.
Hochschild, A. (1983). The managed heart. Berkeley:
University of California Press.
Holden, A. (2005). Foreword in Winning low limit Hold’em, by
Lee Jones. Pittsburgh: ConJelCo.
Kahneman, D., & Tversky, A. (1979). Prospect theory: An
analysis of decision under risk. Econometrica,
47(2), 263–291.
Keynes, J. M. (1936). The general theory of employment,
interest and money. London: Macmillan.
Knight, F. H. (1921). Risk, uncertainty and profit. Boston and
67. New York: Kelley.
Kruger, J., & Dunning, D. (1999). Unskilled and unaware of it:
How difficulties in recognizing one’s own
incompetence lead to inflated self-assessments. Journal of
Personality and Social Psychology, 77(6),
1121–1134.
Malmuth, M. (1999). Gambling theory and other topics.
Henderson, NV: Two Plus Two Publishing.
J Gambl Stud (2010) 26:401–420 419
123
http://cosmiclog.msnbc.msn.com/archive/2008/07/11/1195348.a
spx
http://www.wsop.com/wsop/history.asp
http://www.slate.com/id/2144866/
Matros, M. (2005). The making of a poker player. New York:
Lyle Stuart.
Matusow, M., Calistri, A., & Lavalli, T. (2009). Check-raising
the devil. Las Vegas: Cardoza Publishing.
Mitrovic, D. V., & Brown, J. (2009). Poker mania and problem
gambling: A study in distorted cognitions,
motivation and alexithymia. Journal of Gambling Studies.
Newsweek. (November 20, 2009). High stakes for online
gamblers. Retrieved November 23, 2009, from
http://blog.newsweek.com/blogs/thegaggle/archive/2009/11/20/h
igh-stakes-for-online-gamblers.aspx.
PokerTracker Strategy Guide. (2009). Aggression factor.
Retrieved June 13, 2009, from
68. http://www.pokertracker.com/products/PT3/docs/?doc=statref.
Sally, D. (2000). I, too, sail past: Odysseus and the logic of
self-control. Kyklos, 53(2), 173–200.
Schwartz, M. (2006, June 11). The Hold’em hold-up. New York
Times Magazine.
Sklansky, D. (2009). Poker, gaming and life (2nd ed).
Henderson, NV: Two Plus Two Publishing.
Sklansky, D., & Miller, E. (2006). No-limit Hold’em: Theory
and practice. Henderson, NV: Two Plus Two
Publishing.
Spence, M. (1973). Job market signaling. Quarterly Journal of
Economics, 87(3), 355–374.
Taleb, N. N. (2004). Fooled by randomness. New York: Random
House.
Tallman, I., & Gray, L. N. (1990). Choices, decisions and
problem solving. Annual Review of Sociology, 16,
405–433.
Tversky, A., & Kahneman, D. (1974). Judgment under
uncertainty: Heuristics and biases. Science,
185(4157), 1124–1131.
von Neumann, J., & Morgenstern, O. (1944). Theory of games
and economic behavior. Princeton: Princeton
University Press.
Zelizer, V. (1997). The social meaning of money. Princeton:
Princeton University Press.
420 J Gambl Stud (2010) 26:401–420
123
http://blog.newsweek.com/blogs/thegaggle/archive/2009/11/20/h