- The document discusses a study that tested whether completing origami activities would improve students' visual-spatial skills. Students took a pre-and post-test and completed five origami projects over five weeks.
- While both male and female students improved their scores from pre-to-post-test, males saw greater improvements overall. However, females performed relatively well given they made up only 27% of the class.
- The conclusion is that origami is an effective way to boost visual-spatial skills for both genders, but that engaging female students more could lead to even better outcomes, especially given the male-dominated class. Going forward, the importance of testing would be emphasized more to students.
Students’ Conceptual Understanding and Misconceptions on Force and Motion through different instruments combined with Certainty Response Index (CRI)
Force & motion misconceptions among AL students among different schools
Research Presentation keynote (not yet result)Riniort Huang
This slide was made for the research program of Social Science Methodology course (PO300), BMIR program, Thammasat University, Thailand
Our current research status is under the process of data collection. Our questionnaire that show in this slide is the beta version and may not being use in our actual form of our questionnaire.
Insider's Guide to Value-Exchange Video Advertising - Understanding the Brand...Grant Gudgel
Value-Exchange video is quickly becoming known as the highest performance mobile ad format. 84% of mobile users are actually favorable to the format. But it remains one of the most misunderstood ad formats around. This insider's guide seeks to cut through the mystery and help advertisers make informed decisions.
Jeff Bonwick from EMC DSSD presented this deck at the 2016 MSST Conference.
"MSST 2016 features keynote speaker Jeff Bonwick, co-founder and CTO of DSSD, where he co-invented both the system hardware architecture and the Flood software stack. His talk will focus on extracting maximum performance from flash at scale. Jeff has a long history of developing at-scale storage starting with leading the team that developed the ZFS filesystem, which powers Oracle’s ZFS storage line as well as numerous startups including Nexenta, Delphix, Joyent, and Datto."
Watch the video presentation: http://wp.me/p3RLHQ-ffq
Learn more: http://www.emc.com/dssd
and
http://storageconference.us/
Sign up for our insideHPC Newsletter: http://insidehpc.com/newsletter
Los 5 Retos Más Comunes de Innovación - eBook Innovare
Lograr que la innovación suceda en las empresas no es tarea fácil. Hay restricciones de tiempo, de presupuesto, de capacidades… y todo siempre urge. Hemos conversado con gerentes de toda América Latina para recopilar los retos más frecuentes, y que usted los compare con lo que enfrenta en su día a día.
Conozca más de nuestros servicios de consultoría en www.quieroinnovar.com
This handout is accompanies the Cleveland 5th Grade Curriculum Night presentation for 2013-14. It outlines the Grading Policies of the team and Curriculum based on the Common Core Georgia Performance Standards. Created by Catherine Douthard.
2
Mary Jones
My name is Mary Jones. I completed my field experience at Parkside Elementary School. I am observed a third and fourth grade self-contained class. This class was made up of a 10:1 student teacher ratio. There were three girls (African American) and seven boys (African American). Their disabilities range from autism to mild intellectual disabled. There were also two students who are served for autism.
Ms. Paramore, my supervising teacher showed many direct interactions with students. She also showed higher order thinking beyond their ability level, to challenge them. She provided stimulating educational programs; such as lexia and dreambox with the use of i-pads. This in itself required high expectations not only academically but behavior wise as well. Ms. Paramore provided emotional development and self-efficacy with consistent praise towards the students. All the students are currently below grade level in Reading and Language Arts. Ms. Paramore set high expectations to increase motivation in students who may find their work to be below grade level. She does this by pushing them to read above grade level. The students in this classroom are currently reading on a 1st grade level (1.0 book level) but she pushes them to read on a higher level. She gives them books between 1.5-2.0 reading level this gives these students a positive attitude toward learning to have read a book above grade level; even if it’s not that big of a margin. This also broadens their knowledge and interpretation of concepts.
There are multiple exceptionalities in this classroom. Those issues are also addressed through differentiating. This is where the she modifies assignments and activates to meet the student ability level. This includes but not limited to all assessments on the state and local level. Ms. Paramore used modified grading and used the platform grading on-line. She modified students test by limiting their answer choices. For example, marking out two of the four answer choices so students would have to choose from A and B verses A,B,C,and D. She also uses platform grading on-line which are the assessment the students take on dreambox and Lexia. Ms. Paramore used this data to focus on standards that students have not yet mastered to improve their skills, and to better prepare students for the GA Milestones Test. She also used a program called Khan Academy, where she goes and create an assessment based on taught material, to see if they have mastered the skill. This also prepare the students for GA Milestones which are also taken on student computers. Students are placed in flexible grouping and the rules are clear and concise. She uses flexible grouping to access their individual needs. One of her grouping methods was High-Low, this is a group that consist of one high functioning and one low functioning student in a skill or area of study. This is considered peer tutoring; this method is effective because many studen.
1. Origami and Visual-Spatial Skills in the Classroom:
Introduction and the Research Process:
The hypothesis is that the students will improve their visual-spatial skills with
several activities involving origami. They were tested at the beginning of this project using
a online visual spatial skills test (http://www.queendom.com/tests/access_page
/index.htm?idRegTest=1118). The students were given five origmi acitivities (bear face,
hopping frog, cootie catcher, popper, and tadpole), and then they were tested again at the
end of the experiment. After an initial discussion of the make up of the class there is an
analysis of the final data and a conclusion as to whether the origami made a difference—
not only generally for the class, but specifically about the impact of this hands on
experience on the visual and spatial skills of the girls in the class. Lastly, there is an action
plan discussing what will be done as a result of this research.
Background Information:
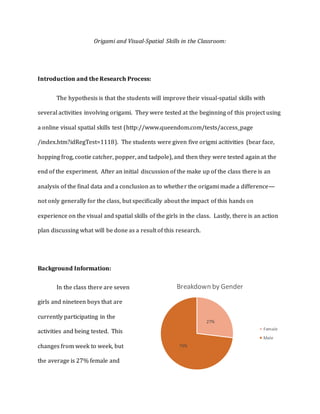
In the class there are seven
girls and nineteen boys that are
currently participating in the
activities and being tested. This
changes from week to week, but
the average is 27% female and
27%
73%
Breakdown by Gender
Female
Male
2. 2 | P a g e
73% male in this class. This class was specifically chosen because it has a larger percentage
of females then other classes taught.
The class is an
extended mathematics
learning class that is known
as LAP class. The students
are there to get extra help in
a subject that they struggle
in. They come from a
variety of classes including sixth grade math (19%), seventh grade math (42%), pre-
Algebra (35%), and one student who is in seventh grade math but served in special
education. The classroom make up is six, seventh, and eight graders only.
At the beginning of the
school year the students were
given a visual-spatial test
online. Some of the students
were absent or not enrolled
(8% and 23%, respectively),
but overall 8%, or two
students, scored average, and
61%, or sixteen students, scored much below average.
19%
42%
4%
35%
Count of the Class
6th Math
7th Math
7th/SPED
Pre-Algebra
8%
8%
61%
23%
Test One
Absent
Average
MBA
Not Enrolled
3. 3 | P a g e
The students’ sexes
were also compared to the
classes that they are in. The
females are relatively well
spread out, with two in sixth
grade math, three in seventh,
and two in pre-Algebra. The
majority of the male students
are in seventh grade math and pre-algebra with very few in sixth grade math or special
education enchanced seventh grade math.
Lastly, for
general information
gender was
compared with test
scores. Excluding the
two absenses (one for
each sex) and the
gender not enrolled
(one female and five males), the scores are interesting to compare. Of the two students
who did average on the test, one was male and one was female. The remaining four
females and twelve males did much below average.
2
3 3
8
1
2
7
0
1
2
3
4
5
6
7
8
9
F M F M M F M
6th Math 7th Math 7th/SPED Pre-Algebra
Gender versus Class
1 1
4
1 1 1
12
5
0
2
4
6
8
10
12
14
Absent Average MBA Not
Enrolled
Absent Average MBA Not
Enrolled
F M
Test One by Gender
4. 4 | P a g e
Analysis of the Data:
The experience was paced for one origami project a week over a series of five
weeks. They were designed to get slightly harder each week. There were instuructions
that were places up on the board, and the teacher demonstrated the folds. The instructions
were from the origami website and included pictures of each fold and step. However, the
students were expected to persevere through the activity somewhat on their own. The
instructions for the tadpole were given to the students to figure out on their own. In this
way the project culminated with the most difficult task, but not necessarily the hardest
project to fold. Most were okay with this and confident in their own directions following
and folding skills.
However, overall they
did do better on the second
test. Instead of having just
two students who did average
and all of the rest doing below
average, 46% of the students
did slightly above average or
above, and only 50% did
much below average. It was an impressive improvement on the scores. In this case there
was even one student who scored way above average.
While we had the same number of much below average and average males, there
were fewer average females than much below average females. There were no females in
4%
38%
50%
4% 4%
Test Two
Absent
Average
MBA
SAA
WAA
5. 5 | P a g e
the the slightly
above average and
way above avearge
areas. There was
one absent male,
though. Two
females scored
above average
instead of one (a
two-fold
improvement), while ten males scored slightly above average or higher over one (a ten-fold
improvement). This outcome is most likely due to the fact that the classroom make up is
heavily male (three times as many males as females). Taking into account that more than
70% of the class is male, it is safe to say that that females in the class held their own
relatively well. Unfortunately the visual-spatial exercise did seem to have a larger impact
on the male students, as opposed to the female students.
With each activity the students started by giving themselves lower, safer scores. So,
for fold one they had an average of 2.39, 4.15 on the second origami activity, 4.34 on the
third activity, 4.14 on the fourth folding activity, and 4.08 on the last fold. As you can see,
they generally trend toward more confidence as time passes until the folding activities get
hard enough that they were thrown off before they could even start.
1
2
8
5
8
1 1
0
1
2
3
4
5
6
7
8
9
M F M F M M M
Absent Average MBA SAA WAA
Test Two by Gender
6. 6 | P a g e
The trends are similar for their post-fold self-assessments. On the first one they
gave themselves a 3.87, a 4.4 on the second fold, a 4.39 on the third origami fold, 4.62 on
the forth fold, and a 4.08 on the fifth folding activity. Again, the trend seemed to be toward
improving until they got to the last folding activity which was all based on following
written and drawn directions.
The post-fold observations that I made followed a more random pattern. Students
earned a 3.57 on the first origmai activity, a 3.1 on the second fold, 3.74 on the third
activity, a 4.48 on the fourth folding activity, and a 3.4 on the last fold. I do not have any
theories as to why the observations bounce except that student confidence rose and fell as
they went along, making them less successful on some folding activities.
Overall their average on the five pre-fold assessments was 3.78. The student
average on the five post-fold assessments was 4.29. The overall observation score for all
the students was 3.65. Overall it is clear that the students were tentative about their initial
chances at the fold activities, and then they found confidence after the activity had finished.
However, my observations were tougher on the students than they were on themselves.
Plan of Action and Conclusion:
Some of the students did not realize the importance or care about taking the test the
first time, so they spent more effort pushing buttons until they were able to get through it.
One of the students confided that this is what he had done because he did not think this
was an important activity. However, after the addition of origami to the weekly lessons he
said that he was much more interested in trying hard on the final assessment.
7. 7 | P a g e
If I were to do this again I would spend more time emphasizing the importance of
the test from the beginning. I would also do more origami projects, more often. In this way
the students would have more practice at visual-spatial skills and perhaps see even greater
improvements in their skills. I would also look for ways to make this more interesting for
the female students, perhaps by changing what animals and objects were folded so that
they appealed to a female audience a little better. Over all, however, the improvements are
there and origmai does seem to be an effective way to improve a student’s visual-spatial
skills, whether they are male or female.