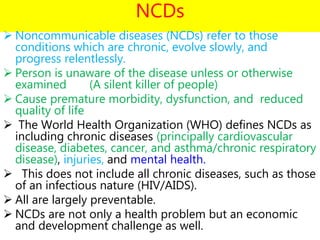
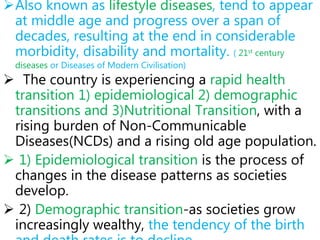
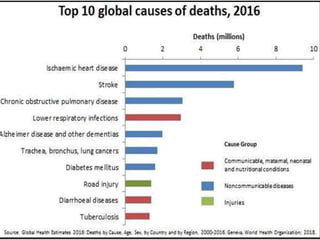
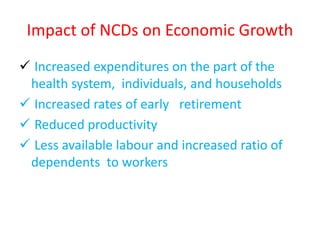
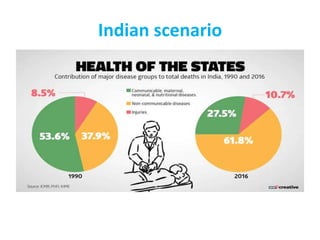
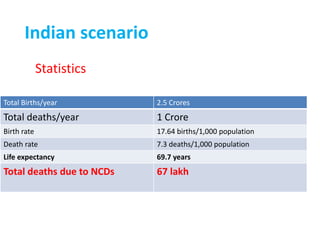
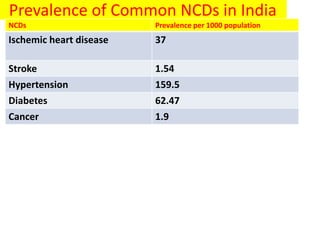
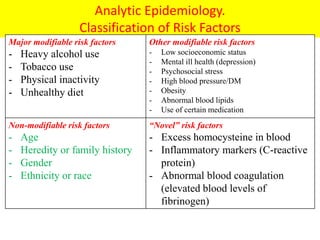
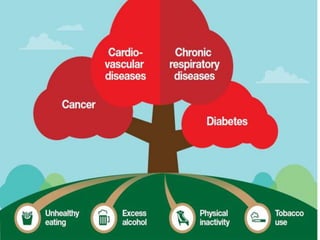
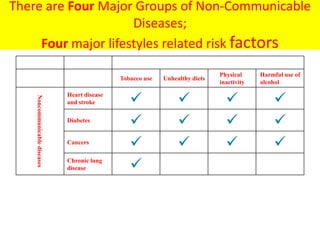
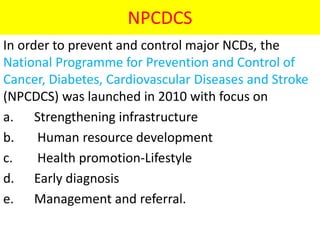
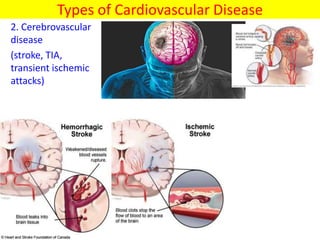
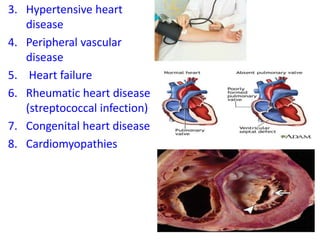
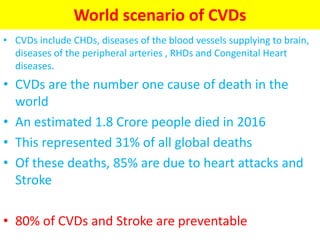
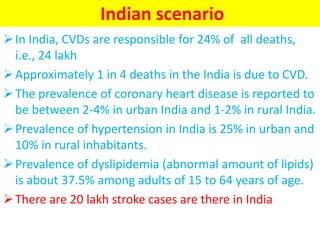
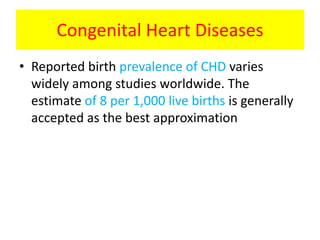
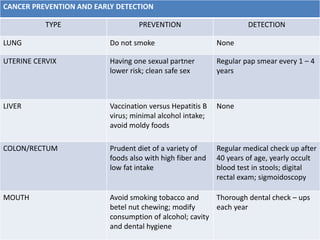
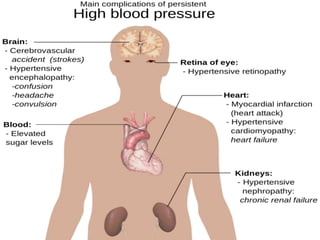
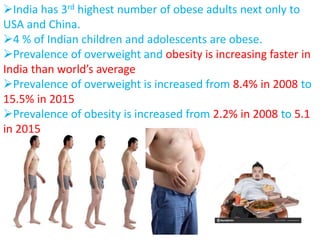
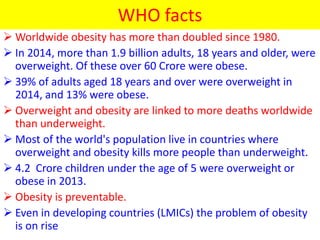
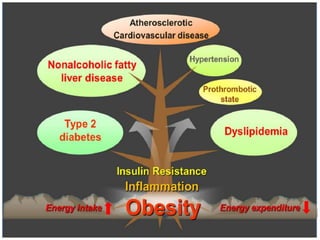
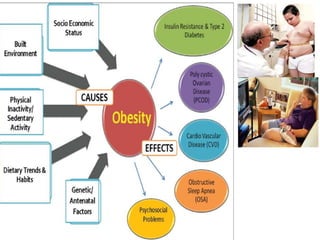
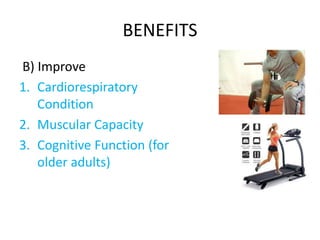
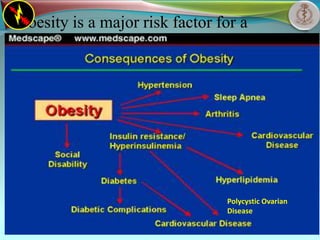
National Programme for Prevention
and Control of Cancer, Diabetes,
CVDs and Stroke.
Dr. Jagadish Nuchin
MD,MBA
District Surveillance Officer and Programme
Officer for NCD
NCD cell, DSU, Gadag
SHIVA
NPCDCS
 Burden of NCD in the world and India
Risk factors
 Four major NCDs
Prevention
NPCDCS
2
Today we’re going to discuss…
NCDs
 Noncommunicable diseases (NCDs) refer to those
conditions which are chronic, evolve slowly, and
progress relentlessly.
 Person is unaware of the disease unless or otherwise
examined (A silent killer of people)
 Cause premature morbidity, dysfunction, and reduced
quality of life
 The World Health Organization (WHO) defines NCDs as
including chronic diseases (principally cardiovascular
disease, diabetes, cancer, and asthma/chronic respiratory
disease), injuries, and mental health.
 This does not include all chronic diseases, such as those
of an infectious nature (HIV/AIDS).
 All are largely preventable.
 NCDs are not only a health problem but an economic
and development challenge as well.
Also known as lifestyle diseases, tend to appear
at middle age and progress over a span of
decades, resulting at the end in considerable
morbidity, disability and mortality. ( 21st century
diseases or Diseases of Modern Civilisation)
 The country is experiencing a rapid health
transition 1) epidemiological 2) demographic
transitions and 3)Nutritional Transition, with a
rising burden of Non-Communicable
Diseases(NCDs) and a rising old age population.
 1) Epidemiological transition is the process of
changes in the disease patterns as societies
develop.
 2) Demographic transition-as societies grow
increasingly wealthy, the tendency of the birth
3. Nutrition transition- increased consumption of
unhealthy foods compounded with increased
prevalence of overweight inmiddle to low income
countries
Demographic transition
Epidemiologic transition
9
Health and lifestyle Transition
Key facts-WHO-June 2018
• Tobacco use, physical inactivity, the harmful
use of alcohol and unhealthy diets all increase
the risk of dying from an NCD.
• Onset of NCDs is 10 years earlier in LMICs than
high income countries
• Early detection by screening, change in the life
style followed by treatment of NCDs, as well as
palliative care, are key components of the
response to NCDs.
• More than 20% of the adult population have at
least one chronic disease
• More than 10% have more than one chronic
disease
Key facts-WHO-June 2018- World scenario
• Noncommunicable diseases (NCDs) kill 4.1
Crore people each year, equivalent to 71% of
all deaths globally.
• One of the most serious concerns is that it
affects the people in their most productive
years (35-64 Years)
• Of these "premature" deaths, over 85% are
estimated to occur in low- and middle-
income countries.
• In developed countries nearly 70- 80% of the
NCD mortality occurs after 70 years of age
People of all age groups, regions and countries
are affected by NCDs.
Children, adults and the elderly are all
vulnerable to the risk factors contributing to
NCDs, whether from unhealthy diets, physical
inactivity, exposure to tobacco smoke or the
harmful use of alcohol.
India is one of the developing countries which
has witnessed a 'double burden‘.
World Scenario
Total births per
year
14 Crores
Total Deaths per 6 Crores
Total NCD deaths
(71%)
Nearly 4.1 crore
80% of the NCD
deaths in the world is
due to these major
diseases
Expected by 2030
Main cause of Death Worldwide
(Projected by 2030)
37%
31%
22%
5% 5%
CVDs
Other Chronic
Diseases
Cancer
Injury
Communicable
diseases
Indian scenario
• In the Hospitals in 2004- NCD burden
accounts for 35% of all outpatient and
40% ( Expected to reach 70% by 2020) of
inpatient hospitalization bed-days.
• NCDs have been estimated to reduce the
economic growth by about 5-10% of GDP.
Impact of NCDs on Economic Growth
 Increased expenditures on the part of the
health system, individuals, and households
 Increased rates of early retirement
 Reduced productivity
 Less available labour and increased ratio of
dependents to workers
Indian scenario
Total Births/year 2.5 Crores
Total deaths/year 1 Crore
Birth rate 17.64 births/1,000 population
Death rate 7.3 deaths/1,000 population
Life expectancy 69.7 years
Total deaths due to NCDs 67 lakh
Indian scenario
Statistics
Prevalence of Common NCDs in India
NCDs Prevalence per 1000 population
Ischemic heart disease 37
Stroke 1.54
Hypertension 159.5
Diabetes 62.47
Cancer 1.9
Analytic Epidemiology.
Classification of Risk Factors
Major modifiable risk factors
- Heavy alcohol use
- Tobacco use
- Physical inactivity
- Unhealthy diet
Other modifiable risk factors
- Low socioeconomic status
- Mental ill health (depression)
- Psychosocial stress
- High blood pressure/DM
- Obesity
- Abnormal blood lipids
- Use of certain medication
Non-modifiable risk factors
- Age
- Heredity or family history
- Gender
- Ethnicity or race
“Novel” risk factors
- Excess homocysteine in blood
- Inflammatory markers (C-reactive
protein)
- Abnormal blood coagulation
(elevated blood levels of
fibrinogen)
MAJAOR RISK FACTORS OF TODAY
WIL BE DISEASES OF TOMORROW
Alcohol
The harmful use of alcohol is one of the world’s
leading risk factors for illness, disability and death.
It is a primary cause of more than 200 diseases and
injuries
It globally results in approximately 33 lakhs (5.9% of all
deaths) deaths each year, greater than HIV/AIDS,
violence or tuberculosis.
Globally, alcohol consumption is estimated to cause more than
10% of the burden of noncommunicable diseases, including
cirrhosis of the liver, pancreatitis, cancers (oral and pharynx,
larynx, oesophagus, liver, colorectal), haemorrhagic stroke and
hypertension.
Traffic accidents, mental disorders, depression or memory loss.
Since 2010, the consumption level in
the European Region has decreased
by 12%, while consumption levels
have increased by almost 30% in the
South-East Asia Region during the
same period.
Despite the reduction, levels in consumption in the
European Region, remained the highest in the world in
2016, at 9.8 litres of pure alcohol per person aged 15
years or older.
 Globally in 2016, 28% of all adults aged 18 years and
older were insufficiently physically active – defined
as not meeting the WHO recommendation to
perform at least 150 minutes of moderate-intensity
physical activity per week, or the equivalent.
High-income countries had more than double the
prevalence of physical inactivity (37%) than low-
income countries (16%) in 2016.
Physical Inactivity
A lack of physical activity is one of the
leading causes of preventable death worldwide.
Sitting still may cause premature death.
The risk is higher among those who sit still more
than 5 hours per day.
The more still, the higher risk of chronic diseases.
People who sit more than 4 hours per day have
a 40 percent higher risk than those that sit lesser
than 4 hours per day.
 However, those who exercise at least 4 hours per week are as
healthy as those that sit lesser than 4 hours per day.
Risk facors
Urbanisation in India
Urbanization processes have amplified lifestyle risk factors for
NCDs (including unhealthy diets, tobacco use, harmful alcohol
intake, and physical inactivity), especially among individuals of
low and middle social economic status.
Strategy for NCD surveillance
Disease
Outcomes
 Heart disease
 Stroke
 Diabetes
 Cancer
 Respiratory
Physiological RF
 BMI
 Blood pressure
 Blood glucose
 Cholesterol
Behavioral RF
 Tobacco
 Alcohol
 Physical
inactivity
 Nutrition
The causal chain explains the risk factor approach for surveillance of
non communicable diseases
There are Four Major Groups of Non-Communicable
Diseases;
Four major lifestyles related risk factors
Modifiable causative risk factors
Tobacco use Unhealthy diets
Physical
inactivity
Harmful use of
alcohol
Noncommunicable
diseases
Heart disease
and stroke    
Diabetes
   
Cancers
   
Chronic lung
disease 
NPCDCS
In order to prevent and control major NCDs, the
National Programme for Prevention and Control of
Cancer, Diabetes, Cardiovascular Diseases and Stroke
(NPCDCS) was launched in 2010 with focus on
a. Strengthening infrastructure
b. Human resource development
c. Health promotion-Lifestyle
d. Early diagnosis
e. Management and referral.
Cardio Vascular Diseases (CVDs)
There has been an increase in CVD morbidity
and mortality: in age-group of 30-44 years.
1. Coronary heart disease
(CHD, ischemic heart
disease, heart attack,
myocardial infarction,
angina pectoris)
Types of Cardiovascular Disease
2. Cerebrovascular
disease
(stroke, TIA,
transient ischemic
attacks)
3. Hypertensive heart
disease
4. Peripheral vascular
disease
5. Heart failure
6. Rheumatic heart disease
(streptococcal infection)
7. Congenital heart disease
8. Cardiomyopathies
World scenario of CVDs
• CVDs include CHDs, diseases of the blood vessels supplying to brain,
diseases of the peripheral arteries , RHDs and Congenital Heart
diseases.
• CVDs are the number one cause of death in the
world
• An estimated 1.8 Crore people died in 2016
• This represented 31% of all global deaths
• Of these deaths, 85% are due to heart attacks and
Stroke
• 80% of CVDs and Stroke are preventable
Indian scenario
In India, CVDs are responsible for 24% of all deaths,
i.e., 24 lakh
Approximately 1 in 4 deaths in the India is due to CVD.
The prevalence of coronary heart disease is reported to
be between 2-4% in urban India and 1-2% in rural India.
Prevalence of hypertension in India is 25% in urban and
10% in rural inhabitants.
Prevalence of dyslipidemia (abnormal amount of lipids)
is about 37.5% among adults of 15 to 64 years of age.
There are 20 lakh stroke cases are there in India
Congenital Heart Diseases
• Reported birth prevalence of CHD varies
widely among studies worldwide. The
estimate of 8 per 1,000 live births is generally
accepted as the best approximation
RHDs- WHO-2014
 RHD is responsible for about 233,000 deaths
annually.
At least 1.56 Crore people are estimated to be
currently affected by RHD with a significant number
of them requiring repeated hospitalization and,
often unaffordable, heart surgery in the next five to
20 years.
The worst affected areas are sub-Saharan Africa,
south-central Asia, the Pacific and indigenous
populations of Australia and New Zealand.
Up to 1 per cent of all schoolchildren in Africa, Asia,
the Eastern Mediterranean region, and Latin
America show signs of the disease.
RHD in India
• The overall prevalence estimated to be about
1.5-2/1000 in all age groups, in India (total
population about 1.3 billion) suggests that
there are about 2.0 to 2.5 million patients of
RHD in the country. (1/5th of them are severly
affected
Cancer
World-
 Cancer, the second leading cause of preventable
death in the world.
 Each year 1.25 Crore new cases of cancer occur in
the world.
 Each year 90 lakh (22% of NCD deaths) people die
due to cancer in the world
India-
India has the third-highest number of cancer cases in the
world.
 Each year 15-16 lakh new cancer patients are detected in
India (Cancer Registry)
 There are 25 lakh cancer patients are there in India
 Each year 8-9 lakh people die of cancer in India
 That means every case of cancer dies within (approx) 2-4
years of diagnosis.
 Age group affected: 60-70% in 35-64 years
 Tobacco related cancers about 40 %
 2/3rd cases are in advanced stage at the time of diagnosis
Common Cancers in India are
 Breast, uterine cervix & oral cavity in females
 Oral cavity, lung & oesophagus in males
 1 in 9 Indians will develop cancer during their lifetime (0-74 years of
age).Jul 16, 2020.
 National Cancer Control Programme (1975-76), an on-
going programme, has been integrated under NPCDCS.
• Breast cancer
• Breast cancer is on the rise, both in rural and urban India.
• A 2018 report of Breast Cancer statistics recorded 1,62,468 new
registered cases and 87,090 reported deaths.
• Cancer survival becomes more difficult in higher stages of its growth,
and more than 50% of Indian women suffer from stage 3 and 4 of
breast cancer.
• Cervical cancer
• Every year in India, 122,844 women are diagnosed with cervical cancer
and 67,477 die from the disease.
• Oral cancer
• In India, around 77,000 new cases and 52,000 deaths are reported
annually, which is approximately one-fourth of global incidences
• In India, 20 per 100000 population are affected by oral cancer which
accounts for about 30% of all types of cancer.
• Over 5 people in India die every hour everyday because of oral cancer
and the same number of people die from cancer in oropharynx and
hypo pharynx.
Cancer Risk Factors
 Age – incidence increases with age
 Sex – significant differences among sexes, e.g. breast cancer
 Race – skin color, diet, custom
 Occupational – petrochemical workers with higher rates of bladder
cancer
 Family history – those with family history of breast cancer and
colorectal cancer have increased risk of developing these
 Socio – economic status- Contemporary data indicate lower rates of
lung, stomach, liver, cervical, esophageal, and oropharyngeal cancer
and higher rates of breast cancer and melanoma at higher SES levels
 Lifestyle – smoking, excessive alcohol drinking, betel nut chewing,
diet, sexual activity and sun exposure are associated with cancer
Screening for Cancer
1. Oral
2. Breast
3. Uterine cervix
HEALTH PROMOTION (REDUCING CANCER RISK)
•Increase consumption of fresh vegetables
(especially those of the cabbage family) since
studies show that roughage and vitamin – rich
foods help prevent certain types of cancer
•Increase fiber intake. This reduces the risk for
breast, prostate and colon cancer
•Increase intake of food rich in Vitamin C (E.g.
citrus fruits and broccoli). This protects
against stomach and esophageal cancer
•Practice weight control. Obesity is linked to
cancer of the uterus, gallbladder, breast and
colon
•Reduce intake of dietary fat since a high – fat
diet increase the risk for breast, colon and
prostate cancer
•Practice moderate consumption of salt – cured
smoked and nitrate – cured food. These are
linked to esophageal and gastric cancers
•Stop smoking cigarettes and cigars
•Reduce alcohol intake. Large amount of alcohol
intake increases the risk of liver cancer
• avoid over expoure to the sun, wear
protective clothing and use sunscreen to
prevent skin damage from ultraviolet rays which
increases the risk of skin cancer
CANCER PREVENTION AND EARLY DETECTION
TYPE PREVENTION DETECTION
LUNG Do not smoke None
UTERINE CERVIX Having one sexual partner
lower risk; clean safe sex
Regular pap smear every 1 – 4
years
LIVER Vaccination versus Hepatitis B
virus; minimal alcohol intake;
avoid moldy foods
None
COLON/RECTUM Prudent diet of a variety of
foods also with high fiber and
low fat intake
Regular medical check up after
40 years of age, yearly occult
blood test in stools; digital
rectal exam; sigmoidoscopy
MOUTH Avoid smoking tobacco and
betel nut chewing; modify
consumption of alcohol; cavity
and dental hygiene
Thorough dental check – ups
each year
CANCER PREVENTION AND EARLY DETECTION
TYPE PREVENTION DETECTION
BREAST No conclusive evidence Monthly self – exam, 7 to 10
days after the first day of
menses; mammography for
high risk groups or for
females >50 years old
SKIN Avoid excessive sun exposure Skin self - examination
PROSTATE No conclusive evidence Digital transrectal exam for
early diagnosis
Diabetes Mellitus
 A group of metabolic
diseases characterized by
hyperglycemia resulting from
defects of insulin secretion,
insulin action or both of
these.
 Symptoms
Two Major Classifications of DM
• Type 1 – previously referred to as
IDDM
– Develops during childhood or
adolescence and affects about 10%
of all diabetic patients.
– Sufferer require a lifetime of insulin
injection for survival since their
pancreas cannot produce insulin
• Type II – referred as NIDDM
– Comprises about 90% of all
diabetic patients who are mostly
overweight or obese.
– They usually have insulin resistance
– Frequently undiagnosed for many
years because hyperglycemia
develop gradually, thus making the
symptoms go unnoticed
– Type 2 diabetes is on rise among
children/adolescents with obesity
 The other type is Gestational Diabetes- Pre existing and true GDM
 Prevalence- 10% of all pregnancies
 Mother, new-born and child
Diabetes data
World-
Leading cause of renal failure, heart attacks, stroke,
blindness and lower limb amputation (more than
that due to any accidents)
46.3 Crore people are living with diabetes in the
world
 The number of people afflicted with the disease
has been rising at a rate of 1 Crore per year globally.
One in 2 do not know that they are suffering from
Diabetes
16 lakh deaths occur directly due to DM
World Diabetic day- November 14th
Indian scenario
 India is “Diabetes Capital” of the
world.
 Cases are being found increasingly
in developing countries.
 In India,7.7 Crore people (6%) are
there with DM next only to China
 One in six in the world is an Indian
Indian scenario
Risk Factors for DM
 Family history of diabetes
 Obesity
 Age >45 years old
 Previously identified impaired fasting glucose or impaired
glucose tolerance
 Hypertension >140/90mmHg ( Same underlying cause,
more complications, if they coexist)
 HDL cholesterol level <35mg/dl and/or triglyceride level
>250mg/dl
 History of gestational diabetes or delivery of babies over 9
lbs (4.08 Kg).
Nutrition Management
 Maintain body weight
 Restrictions on fats and oils
 Avoid simple sugar like cakes and chocolates.
 Instead, have complex carbohydrates like Ragi, Wheat, unpolished rice,
cereals and fresh fruits
 Do not skip or delay meals. It causes fluctuations in blood sugar levels-
Fixed meal time
 Eat more fiber – rich foods like vegetables-Normalizes bowel movements.
 Cut down on salt
 Avoid alcohol.
 Dietary potassium lowers the risk
 Regular frequent intake of fruits and vegetables- protective against
hypertension

Prevalence of hypertension in India is
The Silent killer
• You can have high blood
pressure (hypertension) for
years without any
symptoms.
• Even without symptoms,
damage to blood vessels
and your heart continues
and can be detected.
• Uncontrolled high blood
pressure increases your
risk of serious health
problems, including heart
attack and stroke.
1.Primary
 Chronic high blood
pressure without a source
or associated with any
other disease
 Most common form
of hypertension
2. Secondary
 Elevation of blood
pressure associated with
another disease such as
kidney disease
Classification of blood pressure in Adults
(> or = 18 years)
classification Systolic Blood
Pressure ( mmHg)
Diastolic blood
Pressure (mmHg)
Normal <120 And < 80
Prehypertension 120-139 OR 80-89
Stage 1
Hypertension
140-159 OR 90-99
Stage 2
Hypertension
> Or = 160 OR > Or = 100
In Screening programme individuals with a Blood
Pressure of 140/90 mmHg must be referred to a
Medical Officer
Obesity
 Overweight and obesity are
defined as "abnormal or
excessive fat accumulation that
may impair health“
 Obesity is the second-leading
cause of preventable death in
the U.S, surpassed only by
Tobacco consumption.
 At least 300,000 Americans die
each year as a result of factors
attributed to obesity, American
Obesity Association
India has 3rd highest number of obese adults next only to
USA and China.
4 % of Indian children and adolescents are obese.
Prevalence of overweight and obesity is increasing faster in
India than world’s average
Prevalence of overweight is increased from 8.4% in 2008 to
15.5% in 2015
Prevalence of obesity is increased from 2.2% in 2008 to 5.1
in 2015
ENERGY BALANCE
Energy in = calories consumed per day.
Energy out = basal metabolic rate (BMR) +
thermic effect of foods or Specific dynamic
action)+ physical activity per day.
 Energy balance = energy in – energy out.
Small increments in calories consumed per day
or week can contribute to weight gain over time.
For easier calculations, normal BMR for an adult
is fixed as 24 kcal/ kg body weight/day.
WHO facts
 Worldwide obesity has more than doubled since 1980.
 In 2014, more than 1.9 billion adults, 18 years and older, were
overweight. Of these over 60 Crore were obese.
 39% of adults aged 18 years and over were overweight in
2014, and 13% were obese.
 Overweight and obesity are linked to more deaths worldwide
than underweight.
 Most of the world's population live in countries where
overweight and obesity kills more people than underweight.
 4.2 Crore children under the age of 5 were overweight or
obese in 2013.
 Obesity is preventable.
 Even in developing countries (LMICs) the problem of obesity
is on rise
CLASSIFICATION OF PHYSICAL
ACTIVITY
The activity level may be divided into 3
groups—sedentary, moderate and heavy.
Additional calories are to be added for each
category:
For sedentary work, +30% of BMR;
For moderate work, +40% of BMR; and
For heavy work, +50% of BMR should be
added .
iv. Requirement for energy
During pregnancy is +300 kcal/day, and
During lactation is + 500 kcal/day, in addition
to the basic requirements.
REQUIREMENT
FOR A 55 KG PERSON, DOING
MODERATE WORK
1)For BMR = 24 × 55 kg = 1320 kcal
2)+ For activity = 40% ofBMR =528 kcal
3)Subtotal =1320+528=1848 kcal
4)+Need for SDA=1848 × 10% =184 kcal
5)Total = 1848 + 184 = 2032 kcal
Physical activity
• Physical activity is any body movement.
• Exercise consists of activities that are
planned and structured, and that maintain
or improve one or more of the
components of physical fitness.
• Physical activity suggests a wide variety of
activities that promote health and well-
being.
Exercise
• Lowers blood glucose by increasing the
uptake of glucose by body muscles and
by improving insulin utilization
• Increases the insulin secretion
• Improves circulation and muscle tone
• Exercise should be done
at least 5 times a week
for at least 30 minutes
each session
• For children- 60 minutes
per day
Physical activity
Physical activity is defined by its duration,
intensity, and frequency
Duration is the amount of time spent
participating in a physical activity session
Intensity is the rate of energy expenditure
Frequency is the number of physical activity
sessions during a specific time period (e.g. one
week).
PHYSICAL ACTIVITY
• There are different levels of physical activity.
A. Light Physical Activity
B. Moderate Physical Activity
C. Vigorous Physical Activity
LIGHT PHYSICAL ACTIVITY
• Walking normally, where your heart beats
normally
• Does not contribute to health benefits
• Examples:
Slow walk
Gardening
House cleaning
Caring for children
MODERATE PHYSICAL ACTIVITY
• Walking quickly, when you feel your heart beat
faster than normal and sweat
• You should be able to maintain a conversation
while walking.
• Examples:
Walking quickly
Yoga
Riding a bicycle
Dancing
VIGOROUS PHYSICAL ACTIVITY
• Walking at a fast pace, you should feel your
heart beat strongly and sweat
• It will be difficult to talk.
• Examples:
Walking quickly &
carrying weights
Aerobics, Zumba
Playing soccer
BENEFITS
A) Lowers the risk of:
1. Premature Death
2. Type 2 Diabetes
3. Colon Cancer
4. Breast Cancer
5. Arterial Hypertension
6. CHD
7. Cerebral-Vascular Accident
BENEFITS
B) Improve
1. Cardiorespiratory
Condition
2. Muscular Capacity
3. Cognitive Function (for
older adults)
BENEFITS
C) Weight Loss
Especially when combined
with a diet low in calories
D) Prevention of Falls-
Strengthens bones
E) Reduce Stress
F) Reduce Depression
Goal
• 5 times a week,30 minutes per day
This is just an example of how you can burn so many calories in a week. We can plan as per
your wish
This amount may not seem like much, but if you walked five days a week, within one year
you would burn over 32,000 calories which would burn off more than 5 kg of fat.
30 minutes of brisk means, 3,000 steps, taken at the 100-steps-per-minute pace.
• You will lose weight
when the calories
you eat in food and
drinks are less than those
you burn or use.
Obesity is a major risk factor for a
number of serious health conditions,
including:
Coronary heart disease.
Cancer.
Diabetes.
Fatty liver disease.
Gallbladder disease.
High blood pressure..
Osteoarthritis.
Stroke.
Sleep apnea and other breathing problems.
Polycystic Ovarian
Disease
• The WHO definition is:
BMI provides the most useful
population-level measure of
overweight and obesity as it is
the same for both sexes and for
all ages of adults.
 However, it should be
considered as a rough guide
because it may not correspond
to the same degree of fatness in
different individuals.
A BMI greater than or equal to 25 is overweight
A BMI greater than or equal to 30 is obesity
BMI Classification
Less than 18.5 Underweight
18.5–24.9 Normal weight
25.0–29.9 Overweight
30.0–34.9 Class I obesity
35.0–39.9 Class II obesity
> 40 Class III obesity
You have a higher risk
of health problems if
your waist size is:
more than 94cm (37
inches) in case of
males. more
than 80cm (31.5
inches) in case of
females.
Waist Circumference
Waist-Hip Ratio
Waist–hip ratio (WHR) is the ratio of
the circumference of the waist to
that of the hip.
Measured simply at the smallest
circumference of the natural waist,
usually just above the belly button,
and the hip circumference be
measured at its widest part of the
buttocks or hip.
Intervention Points for NCD Prevention-
Primordial ( Nutritional)
Tertiary
Secondary
Primary
Before
disease
occurs After disease
occurs but
before
patient
notices
symptoms
After disease occurs
and symptoms arise
Goal:
prevent disease
from occurring
Goal:
diagnose and
treat disease
early
Goal:
Prevent damage,
prevent
complications,
rehabilitate
25 By 25
World Health Organisation has
pledged to reduce premature
deaths from non-communicable
diseases by 25% by 2025.
97
Source of icons: World Heart Federation Champion Advocates Programme
Global NCD
Targets

Npcdcs for Ncd team 2021- Jagadish Nuchin

  • 1.
    National Programme forPrevention and Control of Cancer, Diabetes, CVDs and Stroke. Dr. Jagadish Nuchin MD,MBA District Surveillance Officer and Programme Officer for NCD NCD cell, DSU, Gadag SHIVA NPCDCS
  • 2.
     Burden ofNCD in the world and India Risk factors  Four major NCDs Prevention NPCDCS 2 Today we’re going to discuss…
  • 3.
    NCDs  Noncommunicable diseases(NCDs) refer to those conditions which are chronic, evolve slowly, and progress relentlessly.  Person is unaware of the disease unless or otherwise examined (A silent killer of people)  Cause premature morbidity, dysfunction, and reduced quality of life  The World Health Organization (WHO) defines NCDs as including chronic diseases (principally cardiovascular disease, diabetes, cancer, and asthma/chronic respiratory disease), injuries, and mental health.  This does not include all chronic diseases, such as those of an infectious nature (HIV/AIDS).  All are largely preventable.  NCDs are not only a health problem but an economic and development challenge as well.
  • 4.
    Also known aslifestyle diseases, tend to appear at middle age and progress over a span of decades, resulting at the end in considerable morbidity, disability and mortality. ( 21st century diseases or Diseases of Modern Civilisation)  The country is experiencing a rapid health transition 1) epidemiological 2) demographic transitions and 3)Nutritional Transition, with a rising burden of Non-Communicable Diseases(NCDs) and a rising old age population.  1) Epidemiological transition is the process of changes in the disease patterns as societies develop.  2) Demographic transition-as societies grow increasingly wealthy, the tendency of the birth
  • 5.
    3. Nutrition transition-increased consumption of unhealthy foods compounded with increased prevalence of overweight inmiddle to low income countries
  • 6.
  • 8.
  • 9.
  • 10.
    Key facts-WHO-June 2018 •Tobacco use, physical inactivity, the harmful use of alcohol and unhealthy diets all increase the risk of dying from an NCD. • Onset of NCDs is 10 years earlier in LMICs than high income countries • Early detection by screening, change in the life style followed by treatment of NCDs, as well as palliative care, are key components of the response to NCDs. • More than 20% of the adult population have at least one chronic disease • More than 10% have more than one chronic disease
  • 11.
    Key facts-WHO-June 2018-World scenario • Noncommunicable diseases (NCDs) kill 4.1 Crore people each year, equivalent to 71% of all deaths globally. • One of the most serious concerns is that it affects the people in their most productive years (35-64 Years) • Of these "premature" deaths, over 85% are estimated to occur in low- and middle- income countries. • In developed countries nearly 70- 80% of the NCD mortality occurs after 70 years of age
  • 12.
    People of allage groups, regions and countries are affected by NCDs. Children, adults and the elderly are all vulnerable to the risk factors contributing to NCDs, whether from unhealthy diets, physical inactivity, exposure to tobacco smoke or the harmful use of alcohol. India is one of the developing countries which has witnessed a 'double burden‘.
  • 13.
    World Scenario Total birthsper year 14 Crores Total Deaths per 6 Crores Total NCD deaths (71%) Nearly 4.1 crore 80% of the NCD deaths in the world is due to these major diseases
  • 16.
  • 17.
    Main cause ofDeath Worldwide (Projected by 2030) 37% 31% 22% 5% 5% CVDs Other Chronic Diseases Cancer Injury Communicable diseases
  • 18.
    Indian scenario • Inthe Hospitals in 2004- NCD burden accounts for 35% of all outpatient and 40% ( Expected to reach 70% by 2020) of inpatient hospitalization bed-days. • NCDs have been estimated to reduce the economic growth by about 5-10% of GDP.
  • 19.
    Impact of NCDson Economic Growth  Increased expenditures on the part of the health system, individuals, and households  Increased rates of early retirement  Reduced productivity  Less available labour and increased ratio of dependents to workers
  • 20.
  • 21.
    Total Births/year 2.5Crores Total deaths/year 1 Crore Birth rate 17.64 births/1,000 population Death rate 7.3 deaths/1,000 population Life expectancy 69.7 years Total deaths due to NCDs 67 lakh Indian scenario Statistics
  • 22.
    Prevalence of CommonNCDs in India NCDs Prevalence per 1000 population Ischemic heart disease 37 Stroke 1.54 Hypertension 159.5 Diabetes 62.47 Cancer 1.9
  • 23.
    Analytic Epidemiology. Classification ofRisk Factors Major modifiable risk factors - Heavy alcohol use - Tobacco use - Physical inactivity - Unhealthy diet Other modifiable risk factors - Low socioeconomic status - Mental ill health (depression) - Psychosocial stress - High blood pressure/DM - Obesity - Abnormal blood lipids - Use of certain medication Non-modifiable risk factors - Age - Heredity or family history - Gender - Ethnicity or race “Novel” risk factors - Excess homocysteine in blood - Inflammatory markers (C-reactive protein) - Abnormal blood coagulation (elevated blood levels of fibrinogen)
  • 24.
    MAJAOR RISK FACTORSOF TODAY WIL BE DISEASES OF TOMORROW
  • 25.
    Alcohol The harmful useof alcohol is one of the world’s leading risk factors for illness, disability and death. It is a primary cause of more than 200 diseases and injuries It globally results in approximately 33 lakhs (5.9% of all deaths) deaths each year, greater than HIV/AIDS, violence or tuberculosis. Globally, alcohol consumption is estimated to cause more than 10% of the burden of noncommunicable diseases, including cirrhosis of the liver, pancreatitis, cancers (oral and pharynx, larynx, oesophagus, liver, colorectal), haemorrhagic stroke and hypertension. Traffic accidents, mental disorders, depression or memory loss.
  • 26.
    Since 2010, theconsumption level in the European Region has decreased by 12%, while consumption levels have increased by almost 30% in the South-East Asia Region during the same period. Despite the reduction, levels in consumption in the European Region, remained the highest in the world in 2016, at 9.8 litres of pure alcohol per person aged 15 years or older.
  • 28.
     Globally in2016, 28% of all adults aged 18 years and older were insufficiently physically active – defined as not meeting the WHO recommendation to perform at least 150 minutes of moderate-intensity physical activity per week, or the equivalent. High-income countries had more than double the prevalence of physical inactivity (37%) than low- income countries (16%) in 2016. Physical Inactivity
  • 29.
    A lack ofphysical activity is one of the leading causes of preventable death worldwide. Sitting still may cause premature death. The risk is higher among those who sit still more than 5 hours per day. The more still, the higher risk of chronic diseases. People who sit more than 4 hours per day have a 40 percent higher risk than those that sit lesser than 4 hours per day.  However, those who exercise at least 4 hours per week are as healthy as those that sit lesser than 4 hours per day.
  • 30.
  • 31.
    Urbanisation in India Urbanizationprocesses have amplified lifestyle risk factors for NCDs (including unhealthy diets, tobacco use, harmful alcohol intake, and physical inactivity), especially among individuals of low and middle social economic status.
  • 32.
    Strategy for NCDsurveillance Disease Outcomes  Heart disease  Stroke  Diabetes  Cancer  Respiratory Physiological RF  BMI  Blood pressure  Blood glucose  Cholesterol Behavioral RF  Tobacco  Alcohol  Physical inactivity  Nutrition The causal chain explains the risk factor approach for surveillance of non communicable diseases
  • 34.
    There are FourMajor Groups of Non-Communicable Diseases; Four major lifestyles related risk factors Modifiable causative risk factors Tobacco use Unhealthy diets Physical inactivity Harmful use of alcohol Noncommunicable diseases Heart disease and stroke     Diabetes     Cancers     Chronic lung disease 
  • 35.
    NPCDCS In order toprevent and control major NCDs, the National Programme for Prevention and Control of Cancer, Diabetes, Cardiovascular Diseases and Stroke (NPCDCS) was launched in 2010 with focus on a. Strengthening infrastructure b. Human resource development c. Health promotion-Lifestyle d. Early diagnosis e. Management and referral.
  • 36.
    Cardio Vascular Diseases(CVDs) There has been an increase in CVD morbidity and mortality: in age-group of 30-44 years. 1. Coronary heart disease (CHD, ischemic heart disease, heart attack, myocardial infarction, angina pectoris)
  • 37.
    Types of CardiovascularDisease 2. Cerebrovascular disease (stroke, TIA, transient ischemic attacks)
  • 38.
    3. Hypertensive heart disease 4.Peripheral vascular disease 5. Heart failure 6. Rheumatic heart disease (streptococcal infection) 7. Congenital heart disease 8. Cardiomyopathies
  • 39.
    World scenario ofCVDs • CVDs include CHDs, diseases of the blood vessels supplying to brain, diseases of the peripheral arteries , RHDs and Congenital Heart diseases. • CVDs are the number one cause of death in the world • An estimated 1.8 Crore people died in 2016 • This represented 31% of all global deaths • Of these deaths, 85% are due to heart attacks and Stroke • 80% of CVDs and Stroke are preventable
  • 40.
    Indian scenario In India,CVDs are responsible for 24% of all deaths, i.e., 24 lakh Approximately 1 in 4 deaths in the India is due to CVD. The prevalence of coronary heart disease is reported to be between 2-4% in urban India and 1-2% in rural India. Prevalence of hypertension in India is 25% in urban and 10% in rural inhabitants. Prevalence of dyslipidemia (abnormal amount of lipids) is about 37.5% among adults of 15 to 64 years of age. There are 20 lakh stroke cases are there in India
  • 41.
    Congenital Heart Diseases •Reported birth prevalence of CHD varies widely among studies worldwide. The estimate of 8 per 1,000 live births is generally accepted as the best approximation
  • 42.
    RHDs- WHO-2014  RHDis responsible for about 233,000 deaths annually. At least 1.56 Crore people are estimated to be currently affected by RHD with a significant number of them requiring repeated hospitalization and, often unaffordable, heart surgery in the next five to 20 years. The worst affected areas are sub-Saharan Africa, south-central Asia, the Pacific and indigenous populations of Australia and New Zealand. Up to 1 per cent of all schoolchildren in Africa, Asia, the Eastern Mediterranean region, and Latin America show signs of the disease.
  • 43.
    RHD in India •The overall prevalence estimated to be about 1.5-2/1000 in all age groups, in India (total population about 1.3 billion) suggests that there are about 2.0 to 2.5 million patients of RHD in the country. (1/5th of them are severly affected
  • 44.
    Cancer World-  Cancer, thesecond leading cause of preventable death in the world.  Each year 1.25 Crore new cases of cancer occur in the world.  Each year 90 lakh (22% of NCD deaths) people die due to cancer in the world India- India has the third-highest number of cancer cases in the world.  Each year 15-16 lakh new cancer patients are detected in India (Cancer Registry)  There are 25 lakh cancer patients are there in India  Each year 8-9 lakh people die of cancer in India  That means every case of cancer dies within (approx) 2-4 years of diagnosis.  Age group affected: 60-70% in 35-64 years  Tobacco related cancers about 40 %  2/3rd cases are in advanced stage at the time of diagnosis
  • 45.
    Common Cancers inIndia are  Breast, uterine cervix & oral cavity in females  Oral cavity, lung & oesophagus in males  1 in 9 Indians will develop cancer during their lifetime (0-74 years of age).Jul 16, 2020.  National Cancer Control Programme (1975-76), an on- going programme, has been integrated under NPCDCS.
  • 46.
    • Breast cancer •Breast cancer is on the rise, both in rural and urban India. • A 2018 report of Breast Cancer statistics recorded 1,62,468 new registered cases and 87,090 reported deaths. • Cancer survival becomes more difficult in higher stages of its growth, and more than 50% of Indian women suffer from stage 3 and 4 of breast cancer. • Cervical cancer • Every year in India, 122,844 women are diagnosed with cervical cancer and 67,477 die from the disease. • Oral cancer • In India, around 77,000 new cases and 52,000 deaths are reported annually, which is approximately one-fourth of global incidences • In India, 20 per 100000 population are affected by oral cancer which accounts for about 30% of all types of cancer. • Over 5 people in India die every hour everyday because of oral cancer and the same number of people die from cancer in oropharynx and hypo pharynx.
  • 47.
    Cancer Risk Factors Age – incidence increases with age  Sex – significant differences among sexes, e.g. breast cancer  Race – skin color, diet, custom  Occupational – petrochemical workers with higher rates of bladder cancer  Family history – those with family history of breast cancer and colorectal cancer have increased risk of developing these  Socio – economic status- Contemporary data indicate lower rates of lung, stomach, liver, cervical, esophageal, and oropharyngeal cancer and higher rates of breast cancer and melanoma at higher SES levels  Lifestyle – smoking, excessive alcohol drinking, betel nut chewing, diet, sexual activity and sun exposure are associated with cancer
  • 48.
    Screening for Cancer 1.Oral 2. Breast 3. Uterine cervix
  • 49.
    HEALTH PROMOTION (REDUCINGCANCER RISK) •Increase consumption of fresh vegetables (especially those of the cabbage family) since studies show that roughage and vitamin – rich foods help prevent certain types of cancer •Increase fiber intake. This reduces the risk for breast, prostate and colon cancer •Increase intake of food rich in Vitamin C (E.g. citrus fruits and broccoli). This protects against stomach and esophageal cancer •Practice weight control. Obesity is linked to cancer of the uterus, gallbladder, breast and colon •Reduce intake of dietary fat since a high – fat diet increase the risk for breast, colon and prostate cancer •Practice moderate consumption of salt – cured smoked and nitrate – cured food. These are linked to esophageal and gastric cancers •Stop smoking cigarettes and cigars •Reduce alcohol intake. Large amount of alcohol intake increases the risk of liver cancer • avoid over expoure to the sun, wear protective clothing and use sunscreen to prevent skin damage from ultraviolet rays which increases the risk of skin cancer
  • 50.
    CANCER PREVENTION ANDEARLY DETECTION TYPE PREVENTION DETECTION LUNG Do not smoke None UTERINE CERVIX Having one sexual partner lower risk; clean safe sex Regular pap smear every 1 – 4 years LIVER Vaccination versus Hepatitis B virus; minimal alcohol intake; avoid moldy foods None COLON/RECTUM Prudent diet of a variety of foods also with high fiber and low fat intake Regular medical check up after 40 years of age, yearly occult blood test in stools; digital rectal exam; sigmoidoscopy MOUTH Avoid smoking tobacco and betel nut chewing; modify consumption of alcohol; cavity and dental hygiene Thorough dental check – ups each year
  • 51.
    CANCER PREVENTION ANDEARLY DETECTION TYPE PREVENTION DETECTION BREAST No conclusive evidence Monthly self – exam, 7 to 10 days after the first day of menses; mammography for high risk groups or for females >50 years old SKIN Avoid excessive sun exposure Skin self - examination PROSTATE No conclusive evidence Digital transrectal exam for early diagnosis
  • 52.
    Diabetes Mellitus  Agroup of metabolic diseases characterized by hyperglycemia resulting from defects of insulin secretion, insulin action or both of these.  Symptoms
  • 53.
    Two Major Classificationsof DM • Type 1 – previously referred to as IDDM – Develops during childhood or adolescence and affects about 10% of all diabetic patients. – Sufferer require a lifetime of insulin injection for survival since their pancreas cannot produce insulin • Type II – referred as NIDDM – Comprises about 90% of all diabetic patients who are mostly overweight or obese. – They usually have insulin resistance – Frequently undiagnosed for many years because hyperglycemia develop gradually, thus making the symptoms go unnoticed – Type 2 diabetes is on rise among children/adolescents with obesity  The other type is Gestational Diabetes- Pre existing and true GDM  Prevalence- 10% of all pregnancies  Mother, new-born and child
  • 54.
    Diabetes data World- Leading causeof renal failure, heart attacks, stroke, blindness and lower limb amputation (more than that due to any accidents) 46.3 Crore people are living with diabetes in the world  The number of people afflicted with the disease has been rising at a rate of 1 Crore per year globally. One in 2 do not know that they are suffering from Diabetes 16 lakh deaths occur directly due to DM World Diabetic day- November 14th
  • 56.
    Indian scenario  Indiais “Diabetes Capital” of the world.  Cases are being found increasingly in developing countries.  In India,7.7 Crore people (6%) are there with DM next only to China  One in six in the world is an Indian
  • 57.
  • 59.
    Risk Factors forDM  Family history of diabetes  Obesity  Age >45 years old  Previously identified impaired fasting glucose or impaired glucose tolerance  Hypertension >140/90mmHg ( Same underlying cause, more complications, if they coexist)  HDL cholesterol level <35mg/dl and/or triglyceride level >250mg/dl  History of gestational diabetes or delivery of babies over 9 lbs (4.08 Kg).
  • 61.
    Nutrition Management  Maintainbody weight  Restrictions on fats and oils  Avoid simple sugar like cakes and chocolates.  Instead, have complex carbohydrates like Ragi, Wheat, unpolished rice, cereals and fresh fruits  Do not skip or delay meals. It causes fluctuations in blood sugar levels- Fixed meal time  Eat more fiber – rich foods like vegetables-Normalizes bowel movements.  Cut down on salt  Avoid alcohol.  Dietary potassium lowers the risk  Regular frequent intake of fruits and vegetables- protective against hypertension 
  • 62.
    Prevalence of hypertensionin India is The Silent killer • You can have high blood pressure (hypertension) for years without any symptoms. • Even without symptoms, damage to blood vessels and your heart continues and can be detected. • Uncontrolled high blood pressure increases your risk of serious health problems, including heart attack and stroke.
  • 63.
    1.Primary  Chronic highblood pressure without a source or associated with any other disease  Most common form of hypertension 2. Secondary  Elevation of blood pressure associated with another disease such as kidney disease
  • 64.
    Classification of bloodpressure in Adults (> or = 18 years) classification Systolic Blood Pressure ( mmHg) Diastolic blood Pressure (mmHg) Normal <120 And < 80 Prehypertension 120-139 OR 80-89 Stage 1 Hypertension 140-159 OR 90-99 Stage 2 Hypertension > Or = 160 OR > Or = 100 In Screening programme individuals with a Blood Pressure of 140/90 mmHg must be referred to a Medical Officer
  • 66.
    Obesity  Overweight andobesity are defined as "abnormal or excessive fat accumulation that may impair health“  Obesity is the second-leading cause of preventable death in the U.S, surpassed only by Tobacco consumption.  At least 300,000 Americans die each year as a result of factors attributed to obesity, American Obesity Association
  • 67.
    India has 3rdhighest number of obese adults next only to USA and China. 4 % of Indian children and adolescents are obese. Prevalence of overweight and obesity is increasing faster in India than world’s average Prevalence of overweight is increased from 8.4% in 2008 to 15.5% in 2015 Prevalence of obesity is increased from 2.2% in 2008 to 5.1 in 2015
  • 70.
    ENERGY BALANCE Energy in= calories consumed per day. Energy out = basal metabolic rate (BMR) + thermic effect of foods or Specific dynamic action)+ physical activity per day.  Energy balance = energy in – energy out. Small increments in calories consumed per day or week can contribute to weight gain over time. For easier calculations, normal BMR for an adult is fixed as 24 kcal/ kg body weight/day.
  • 71.
    WHO facts  Worldwideobesity has more than doubled since 1980.  In 2014, more than 1.9 billion adults, 18 years and older, were overweight. Of these over 60 Crore were obese.  39% of adults aged 18 years and over were overweight in 2014, and 13% were obese.  Overweight and obesity are linked to more deaths worldwide than underweight.  Most of the world's population live in countries where overweight and obesity kills more people than underweight.  4.2 Crore children under the age of 5 were overweight or obese in 2013.  Obesity is preventable.  Even in developing countries (LMICs) the problem of obesity is on rise
  • 75.
    CLASSIFICATION OF PHYSICAL ACTIVITY Theactivity level may be divided into 3 groups—sedentary, moderate and heavy. Additional calories are to be added for each category: For sedentary work, +30% of BMR; For moderate work, +40% of BMR; and For heavy work, +50% of BMR should be added . iv. Requirement for energy During pregnancy is +300 kcal/day, and During lactation is + 500 kcal/day, in addition to the basic requirements.
  • 76.
    REQUIREMENT FOR A 55KG PERSON, DOING MODERATE WORK 1)For BMR = 24 × 55 kg = 1320 kcal 2)+ For activity = 40% ofBMR =528 kcal 3)Subtotal =1320+528=1848 kcal 4)+Need for SDA=1848 × 10% =184 kcal 5)Total = 1848 + 184 = 2032 kcal
  • 78.
    Physical activity • Physicalactivity is any body movement. • Exercise consists of activities that are planned and structured, and that maintain or improve one or more of the components of physical fitness. • Physical activity suggests a wide variety of activities that promote health and well- being.
  • 79.
    Exercise • Lowers bloodglucose by increasing the uptake of glucose by body muscles and by improving insulin utilization • Increases the insulin secretion • Improves circulation and muscle tone • Exercise should be done at least 5 times a week for at least 30 minutes each session • For children- 60 minutes per day
  • 80.
    Physical activity Physical activityis defined by its duration, intensity, and frequency Duration is the amount of time spent participating in a physical activity session Intensity is the rate of energy expenditure Frequency is the number of physical activity sessions during a specific time period (e.g. one week).
  • 81.
    PHYSICAL ACTIVITY • Thereare different levels of physical activity. A. Light Physical Activity B. Moderate Physical Activity C. Vigorous Physical Activity
  • 82.
    LIGHT PHYSICAL ACTIVITY •Walking normally, where your heart beats normally • Does not contribute to health benefits • Examples: Slow walk Gardening House cleaning Caring for children
  • 83.
    MODERATE PHYSICAL ACTIVITY •Walking quickly, when you feel your heart beat faster than normal and sweat • You should be able to maintain a conversation while walking. • Examples: Walking quickly Yoga Riding a bicycle Dancing
  • 84.
    VIGOROUS PHYSICAL ACTIVITY •Walking at a fast pace, you should feel your heart beat strongly and sweat • It will be difficult to talk. • Examples: Walking quickly & carrying weights Aerobics, Zumba Playing soccer
  • 85.
    BENEFITS A) Lowers therisk of: 1. Premature Death 2. Type 2 Diabetes 3. Colon Cancer 4. Breast Cancer 5. Arterial Hypertension 6. CHD 7. Cerebral-Vascular Accident
  • 86.
    BENEFITS B) Improve 1. Cardiorespiratory Condition 2.Muscular Capacity 3. Cognitive Function (for older adults)
  • 87.
    BENEFITS C) Weight Loss Especiallywhen combined with a diet low in calories D) Prevention of Falls- Strengthens bones E) Reduce Stress F) Reduce Depression
  • 88.
    Goal • 5 timesa week,30 minutes per day This is just an example of how you can burn so many calories in a week. We can plan as per your wish This amount may not seem like much, but if you walked five days a week, within one year you would burn over 32,000 calories which would burn off more than 5 kg of fat. 30 minutes of brisk means, 3,000 steps, taken at the 100-steps-per-minute pace.
  • 89.
    • You willlose weight when the calories you eat in food and drinks are less than those you burn or use.
  • 90.
    Obesity is amajor risk factor for a number of serious health conditions, including: Coronary heart disease. Cancer. Diabetes. Fatty liver disease. Gallbladder disease. High blood pressure.. Osteoarthritis. Stroke. Sleep apnea and other breathing problems. Polycystic Ovarian Disease
  • 91.
    • The WHOdefinition is: BMI provides the most useful population-level measure of overweight and obesity as it is the same for both sexes and for all ages of adults.  However, it should be considered as a rough guide because it may not correspond to the same degree of fatness in different individuals. A BMI greater than or equal to 25 is overweight A BMI greater than or equal to 30 is obesity
  • 92.
    BMI Classification Less than18.5 Underweight 18.5–24.9 Normal weight 25.0–29.9 Overweight 30.0–34.9 Class I obesity 35.0–39.9 Class II obesity > 40 Class III obesity
  • 93.
    You have ahigher risk of health problems if your waist size is: more than 94cm (37 inches) in case of males. more than 80cm (31.5 inches) in case of females. Waist Circumference
  • 94.
    Waist-Hip Ratio Waist–hip ratio(WHR) is the ratio of the circumference of the waist to that of the hip. Measured simply at the smallest circumference of the natural waist, usually just above the belly button, and the hip circumference be measured at its widest part of the buttocks or hip.
  • 95.
    Intervention Points forNCD Prevention- Primordial ( Nutritional) Tertiary Secondary Primary Before disease occurs After disease occurs but before patient notices symptoms After disease occurs and symptoms arise Goal: prevent disease from occurring Goal: diagnose and treat disease early Goal: Prevent damage, prevent complications, rehabilitate
  • 96.
    25 By 25 WorldHealth Organisation has pledged to reduce premature deaths from non-communicable diseases by 25% by 2025.
  • 97.
    97 Source of icons:World Heart Federation Champion Advocates Programme Global NCD Targets