Download to read offline
![40
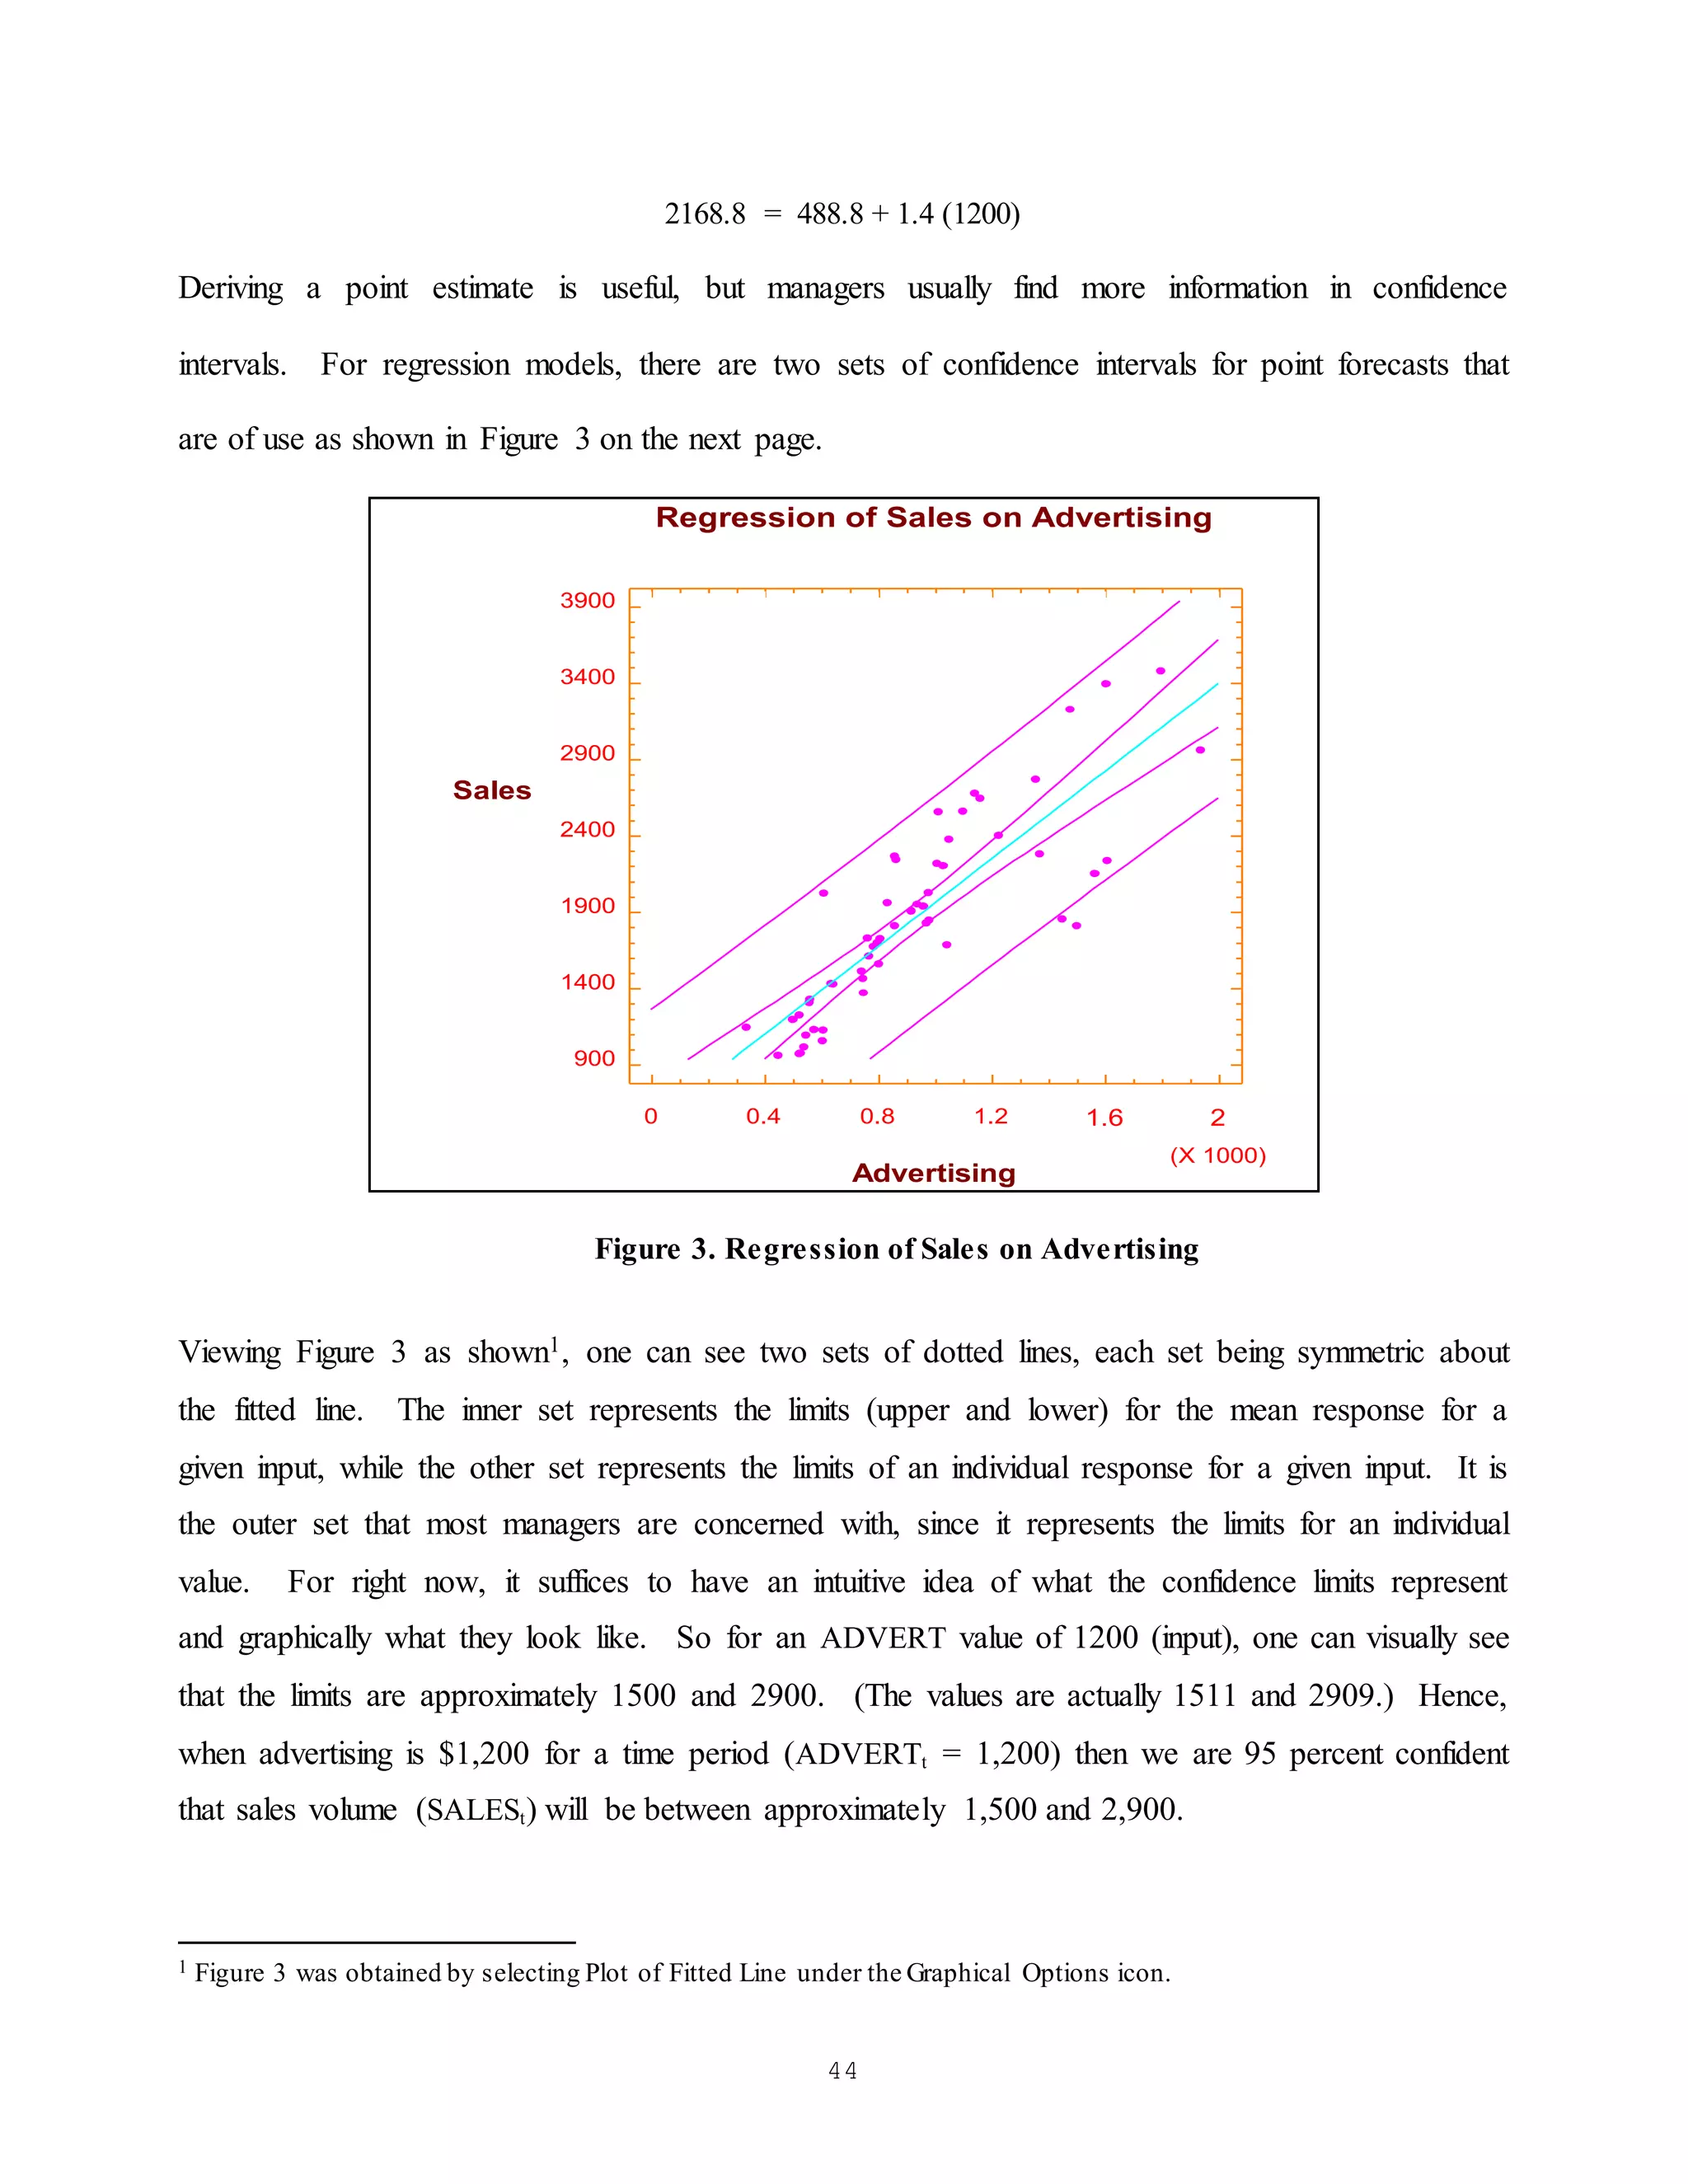
Note: If B1 = 0, (i.e. the null hypothesis is true), then changes in ADVERTt will not produce a
change in SALESt. From Table 1, we note that the p-value (probability level) for the hypothesis test,
which resides on the line labeled slope, is 0.00000 (truncation). Since the p-value is less than =.
05, we reject the null hypothesis and conclude that ADVERTt is a significant explanatory variable
for the model, where SALESt is the dependent variable.
An Example
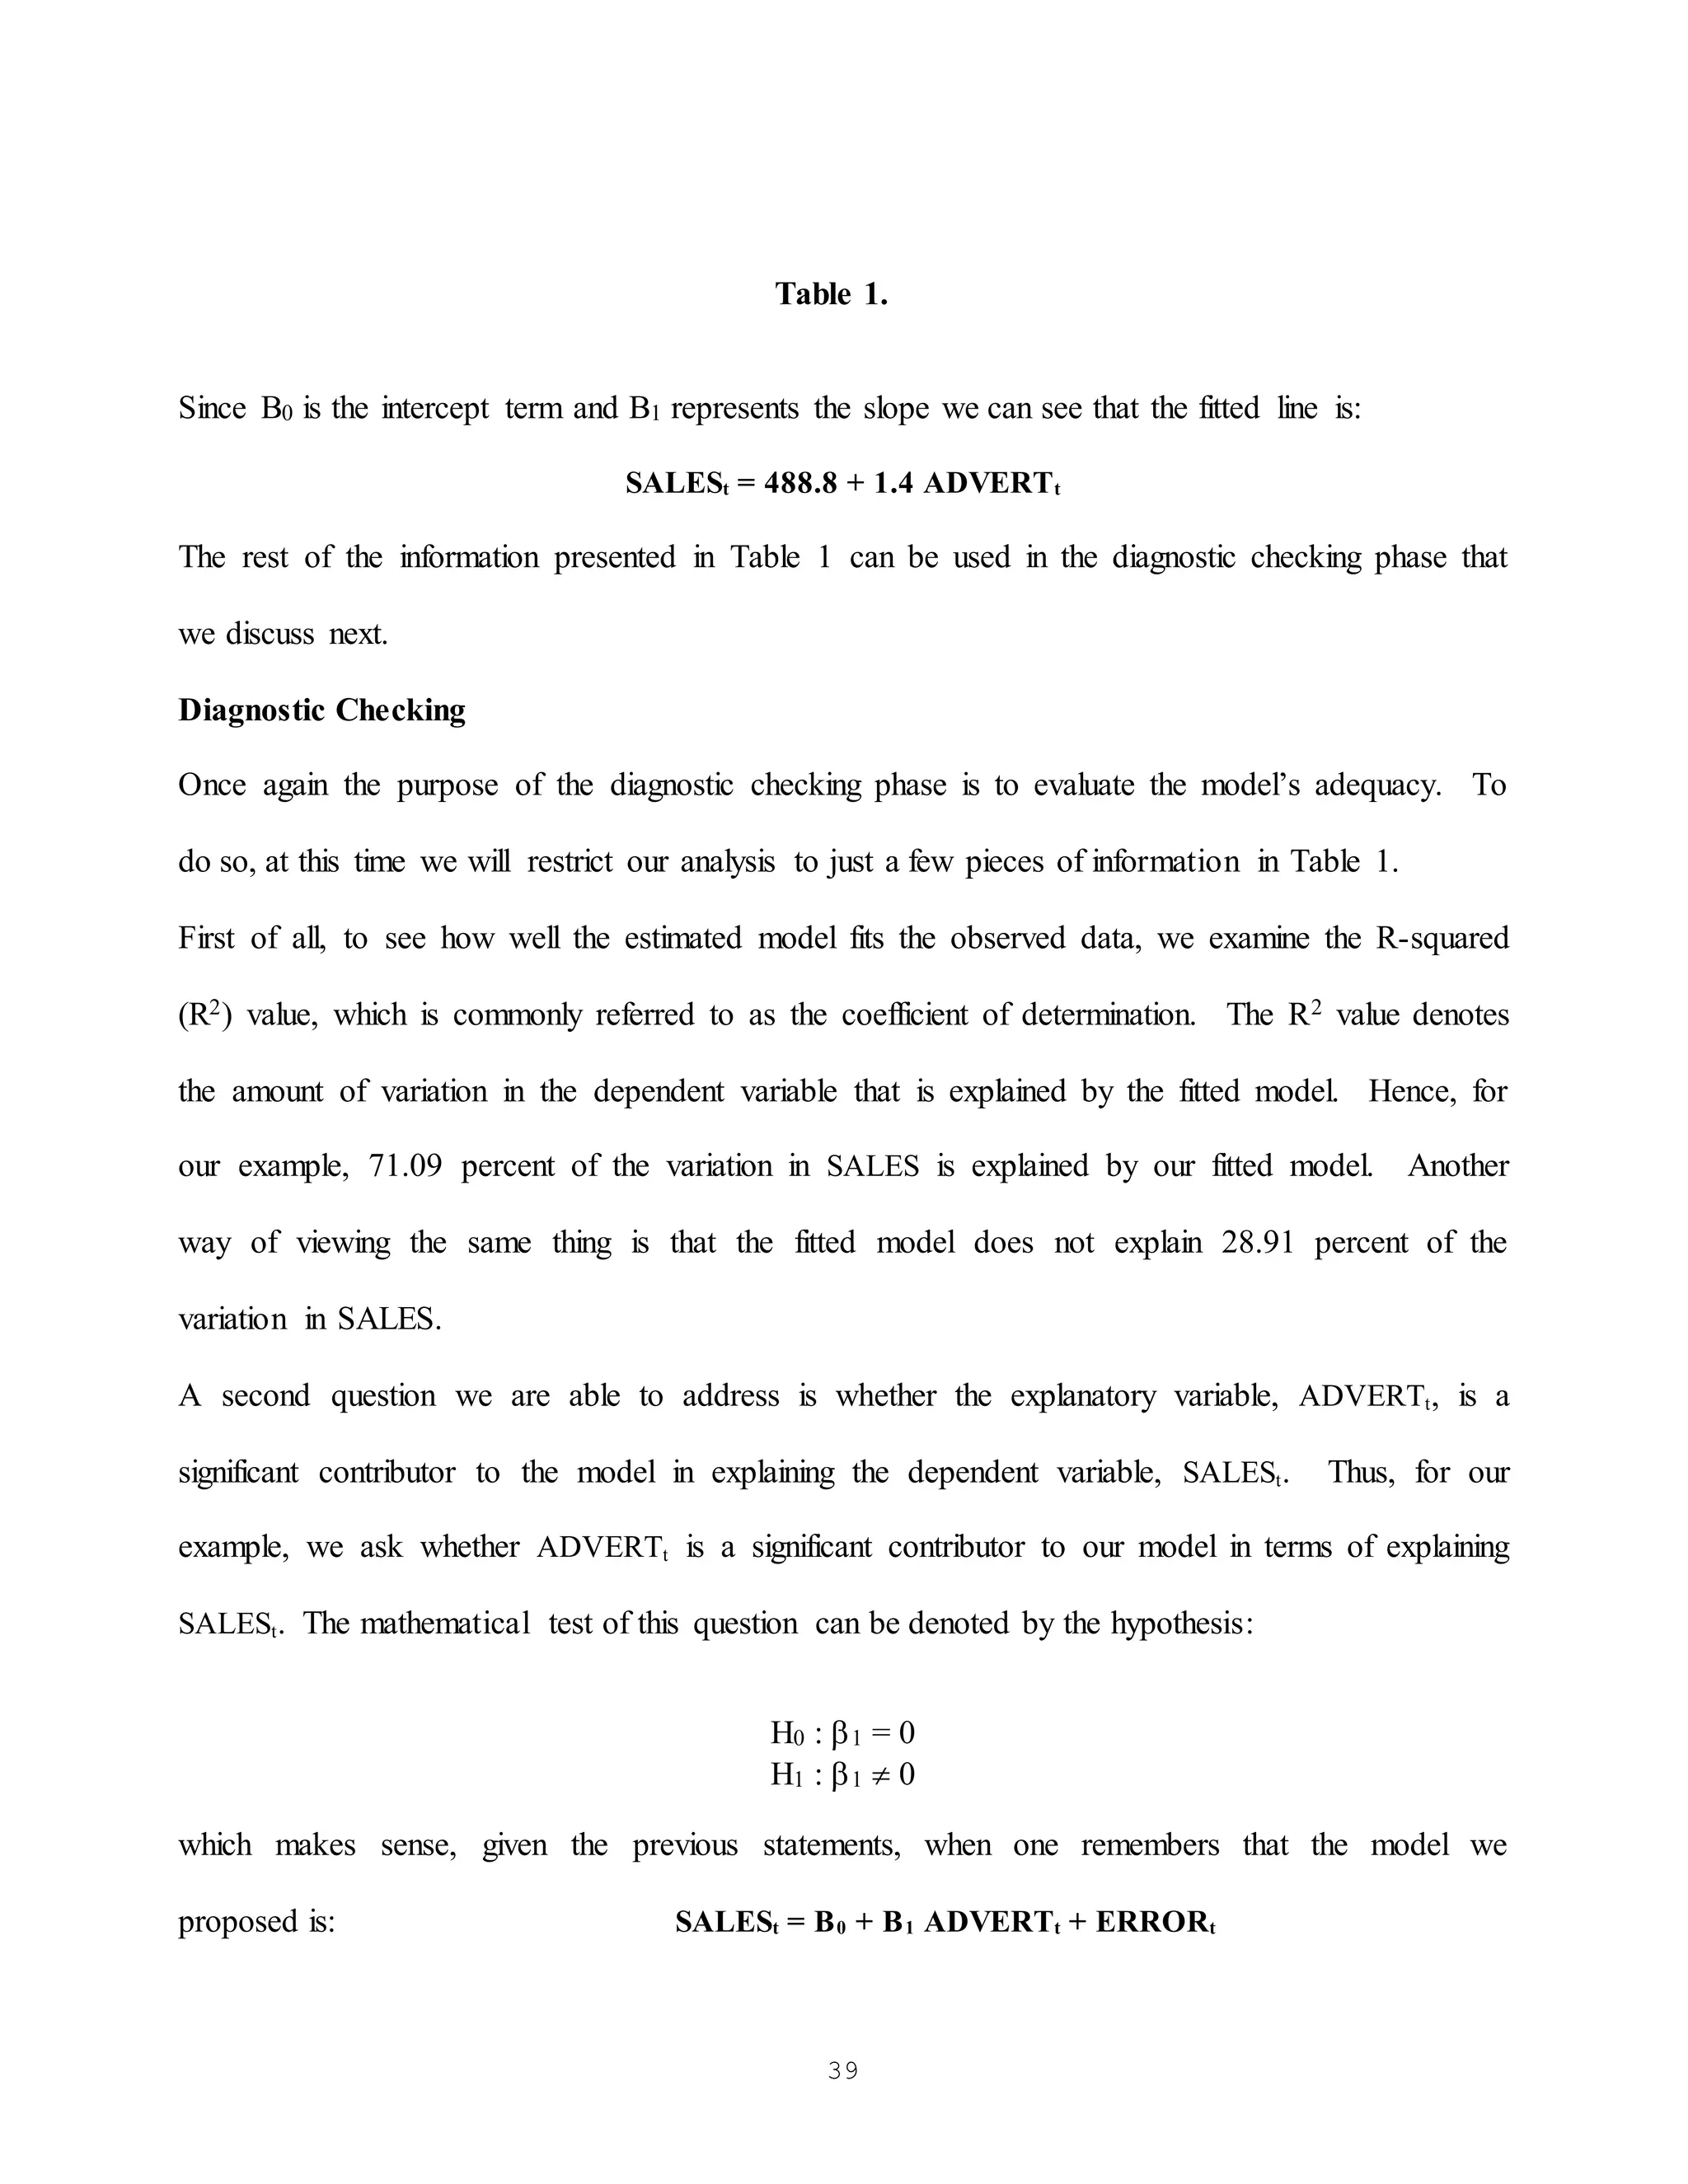
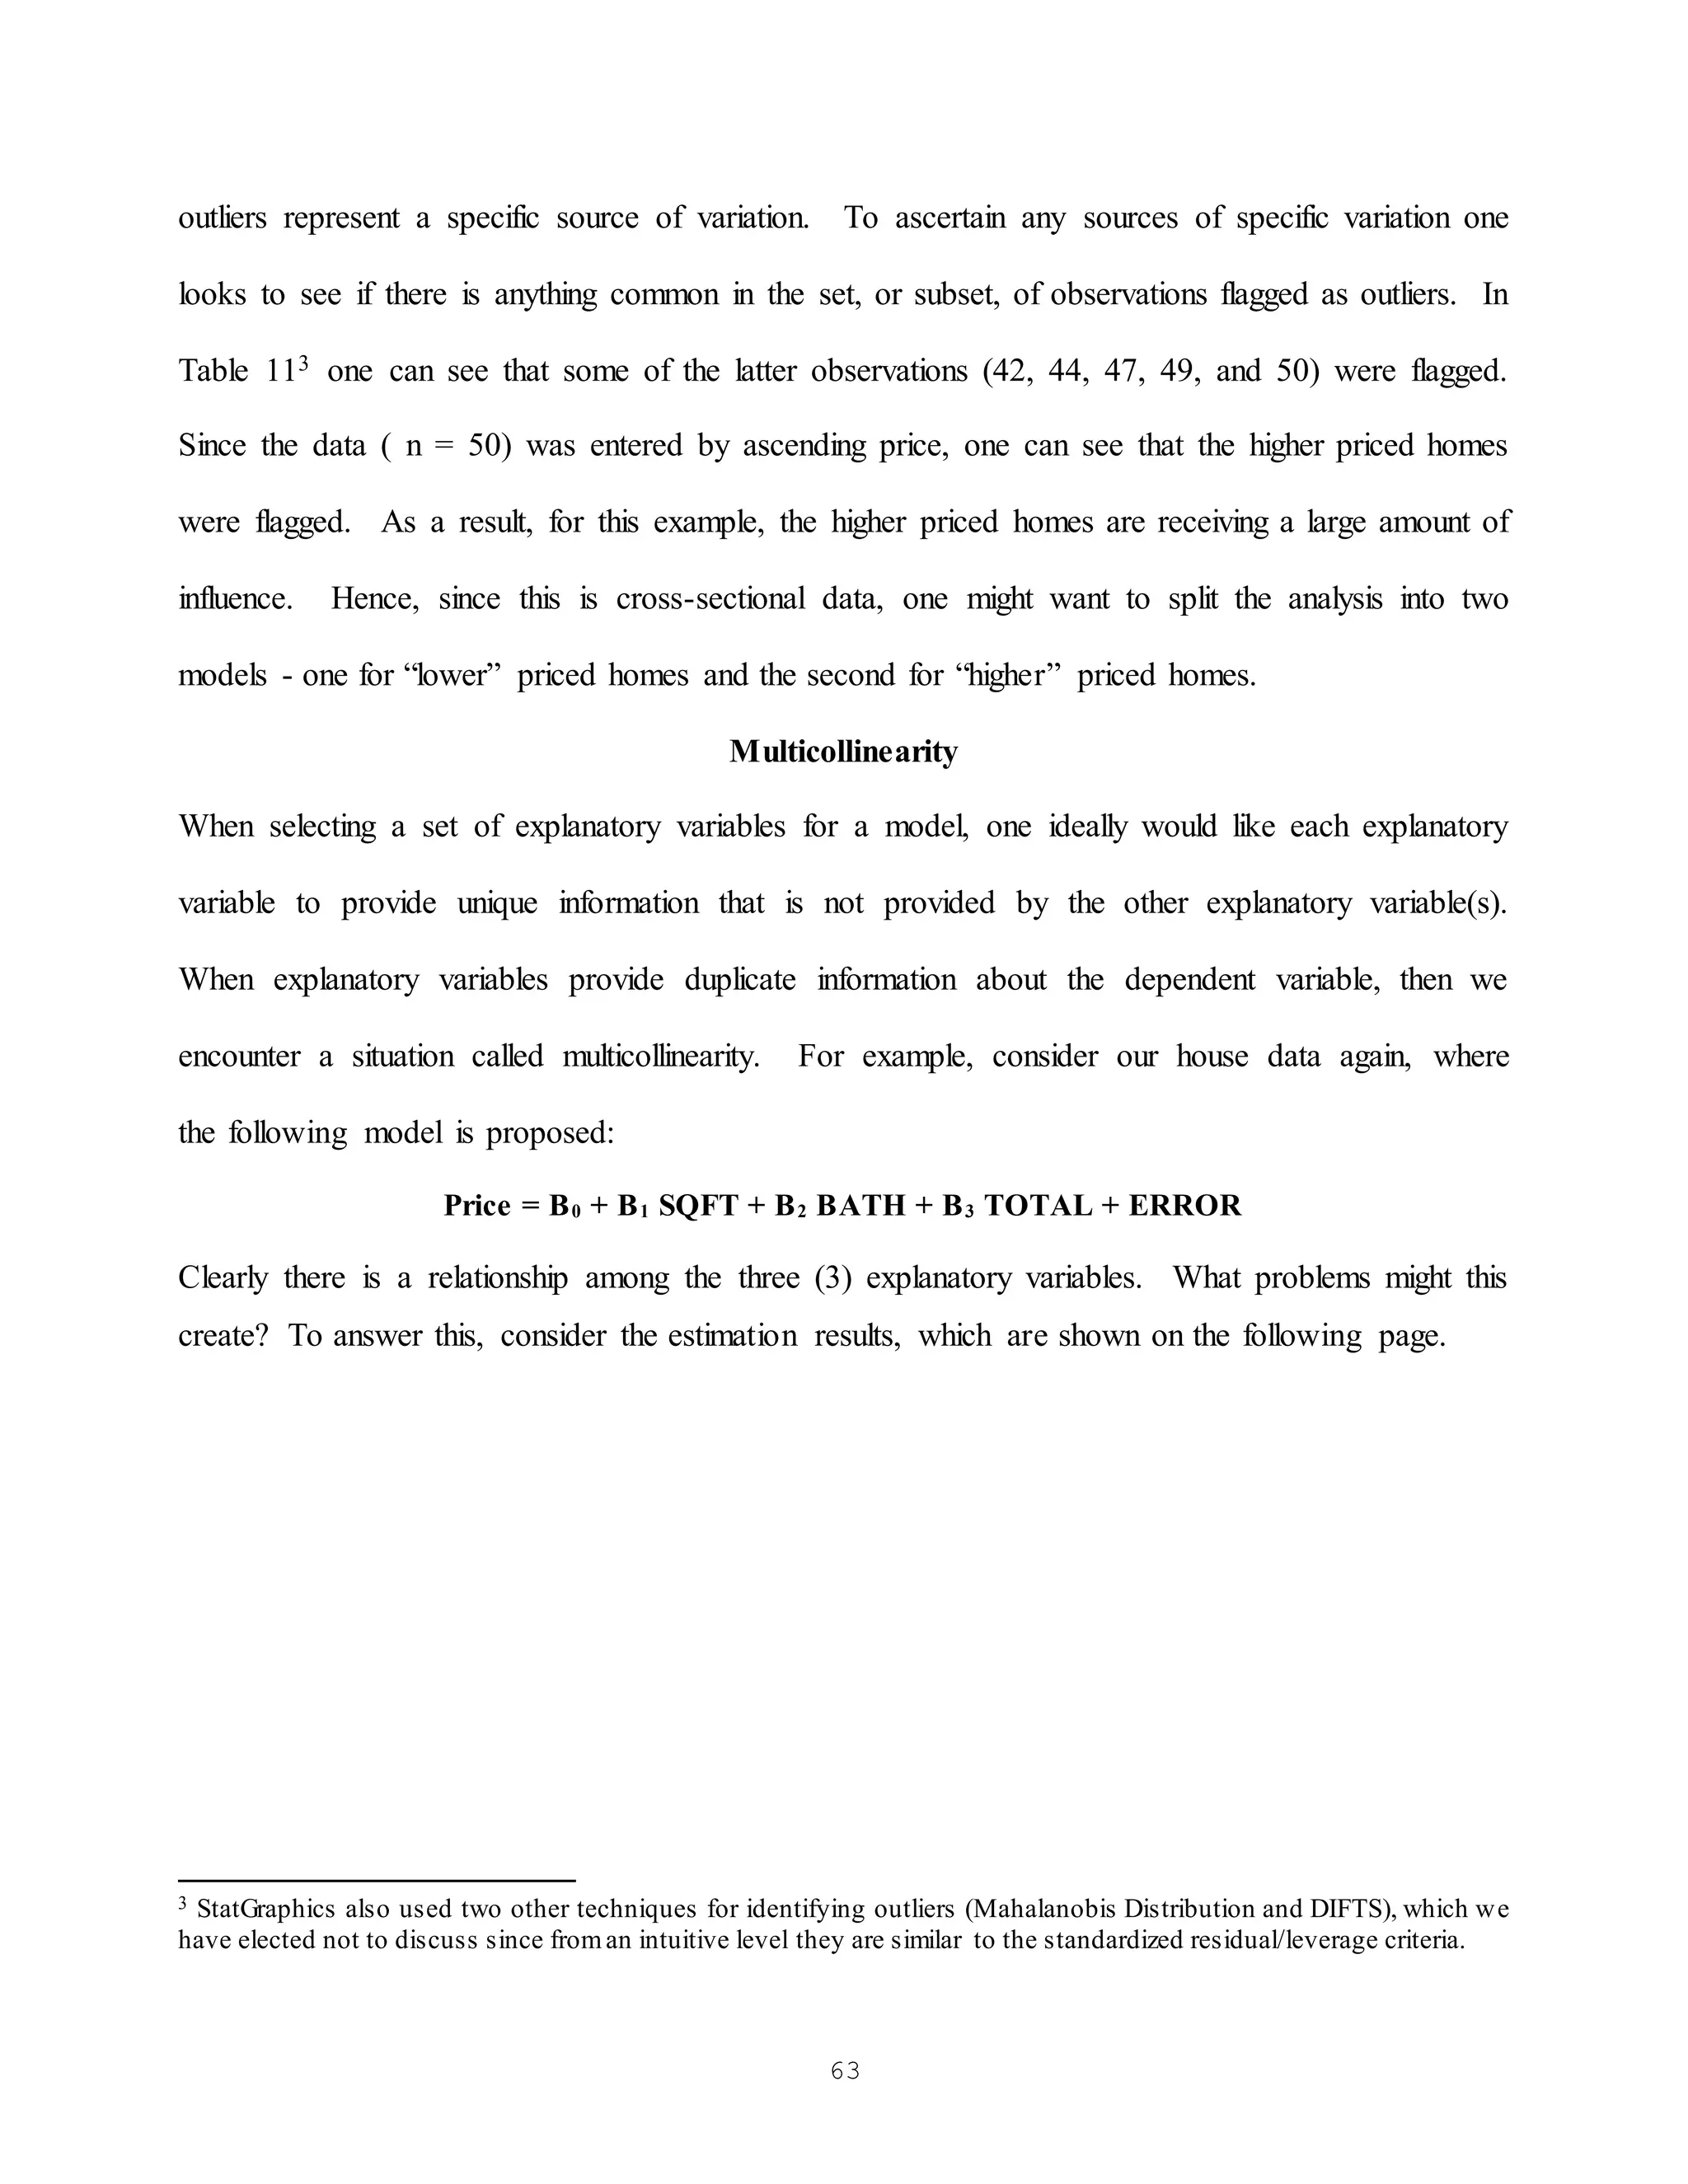
To further illustrate the topic of simple linear regression and the model building
process, we consider another model using the same data set. However, instead of
using advertising to explain the variation in sales, we hypothesize that a good
explanatory variable is to use sales lagged one year. Recall that our time series data is
in yearly intervals, hence, what we are proposing is a model where the value of sales
is explained by its amount one time period (year) ago. This may not make as much
theoretical sense [to many] as the previous model we considered, but when one
considers that it is common in business for variables to run in cycles, it can be seen to
be a valid possibility.
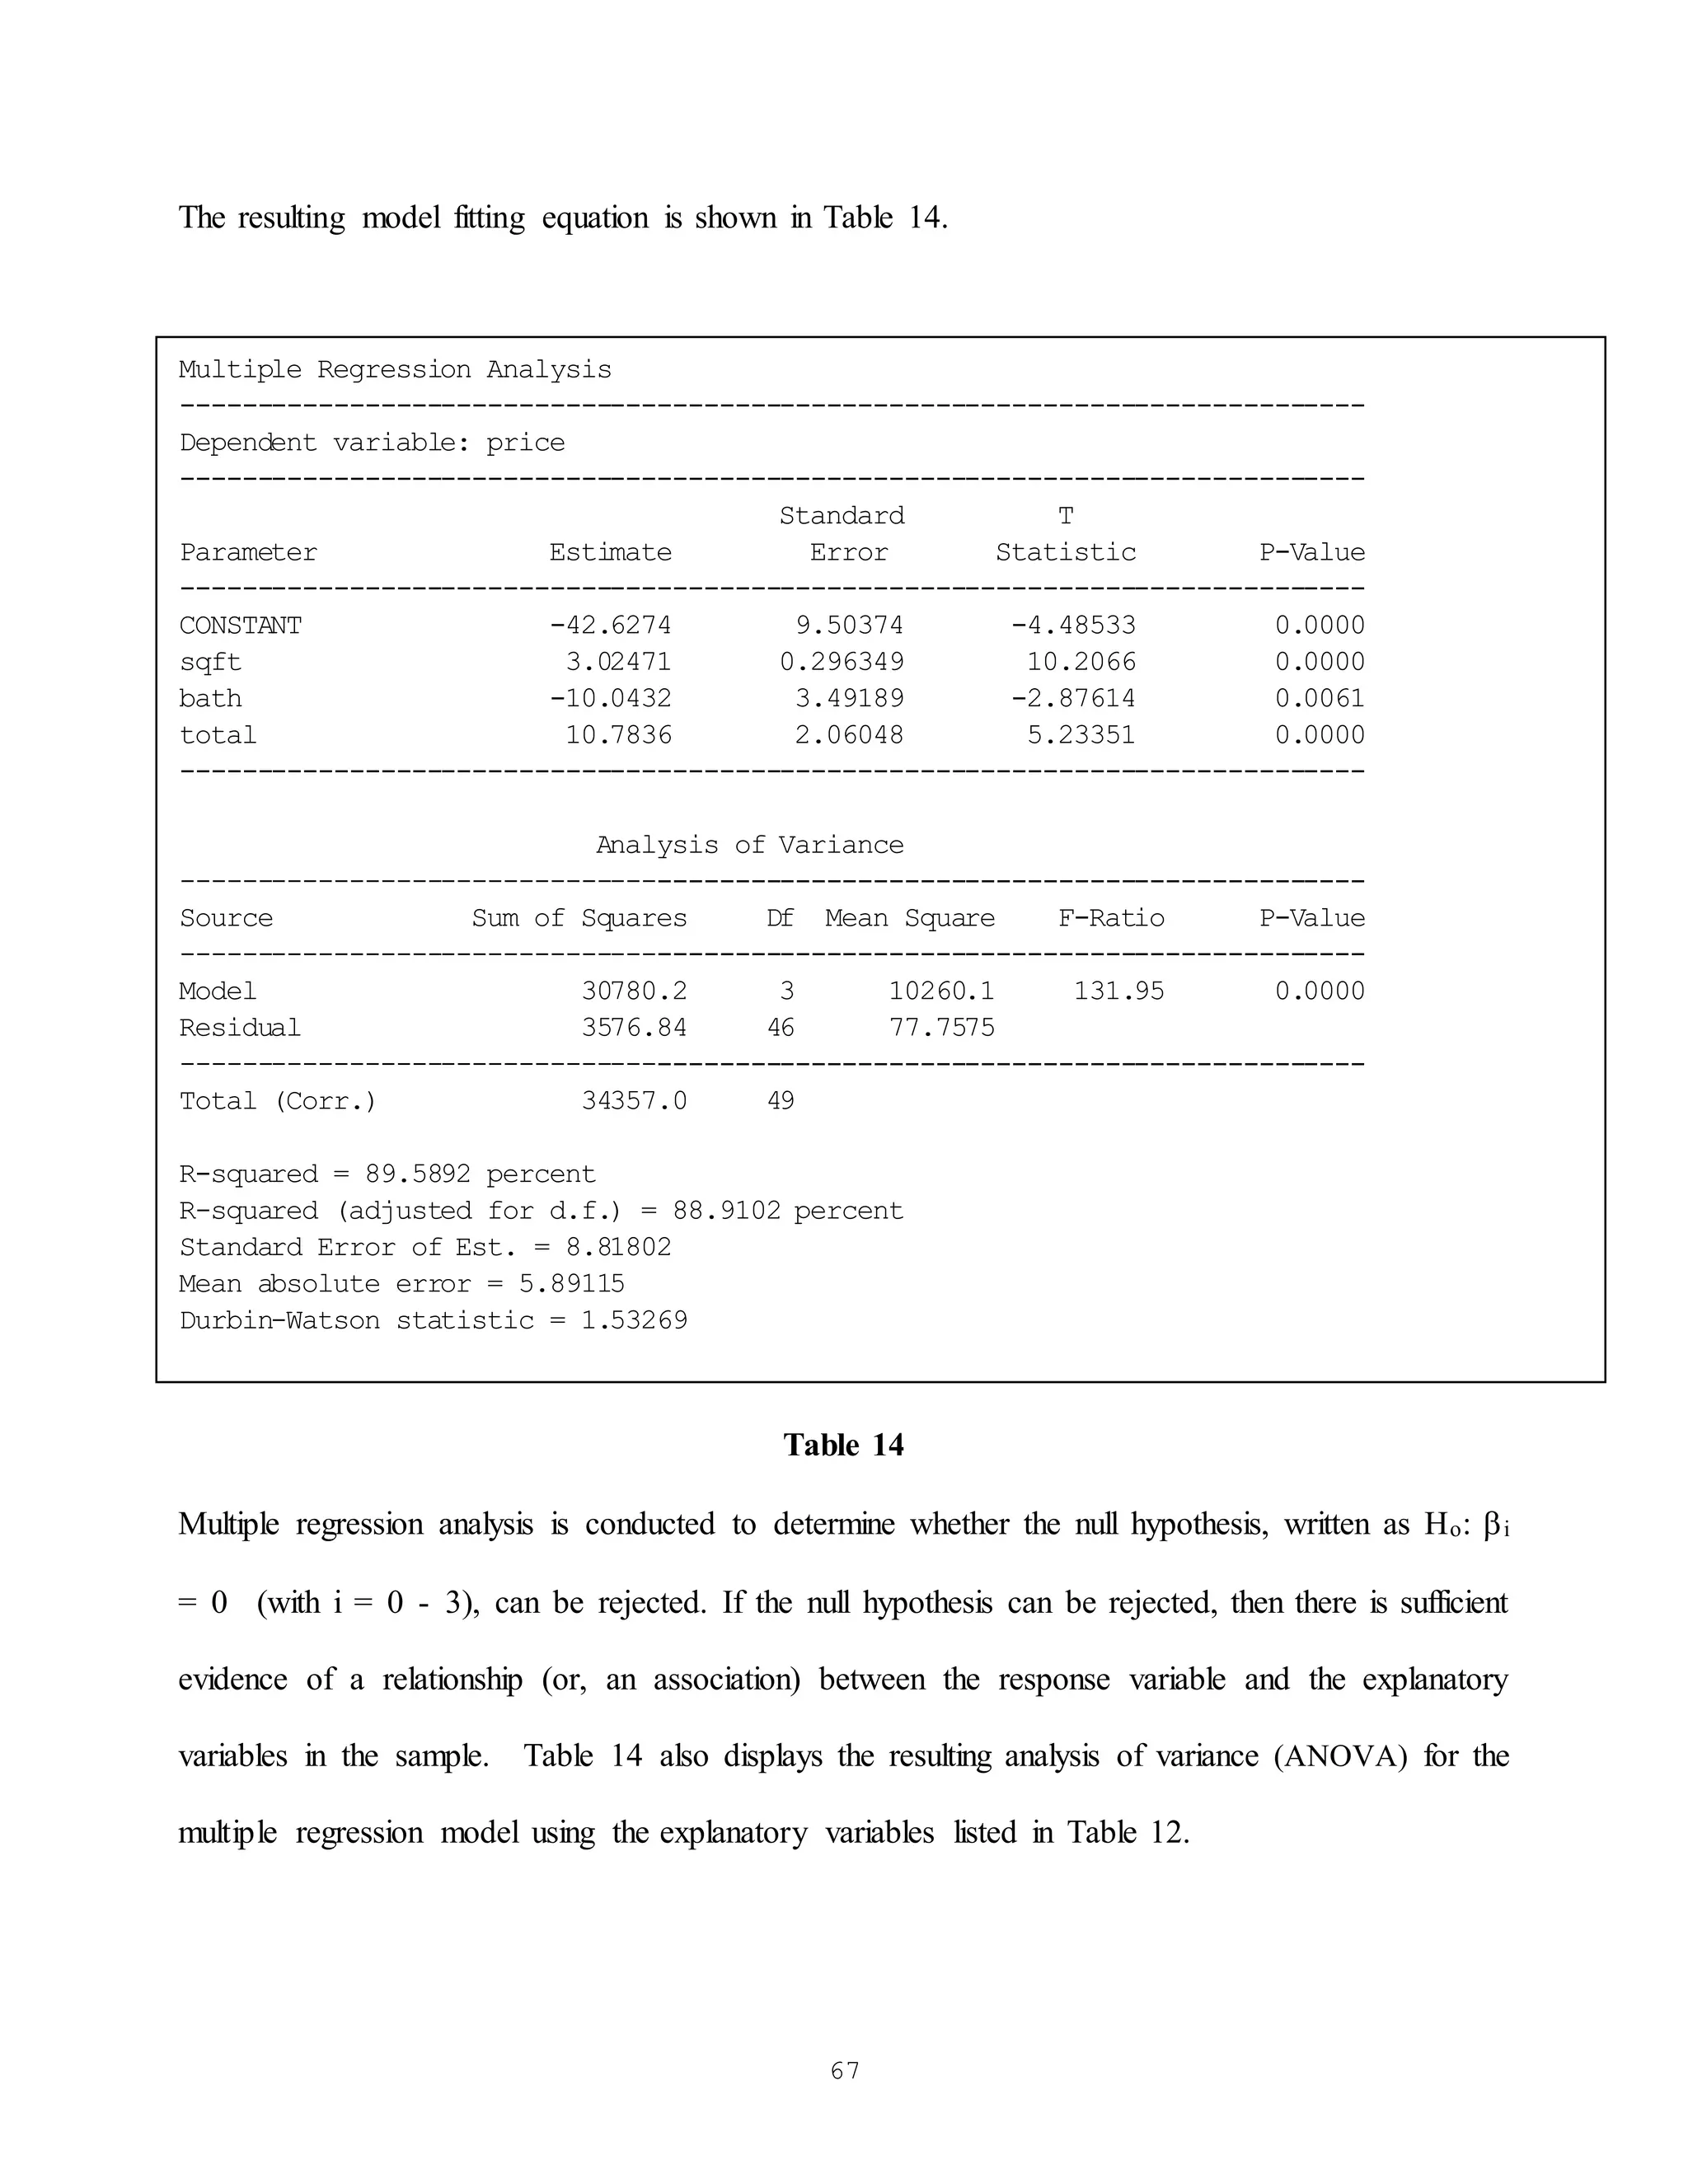
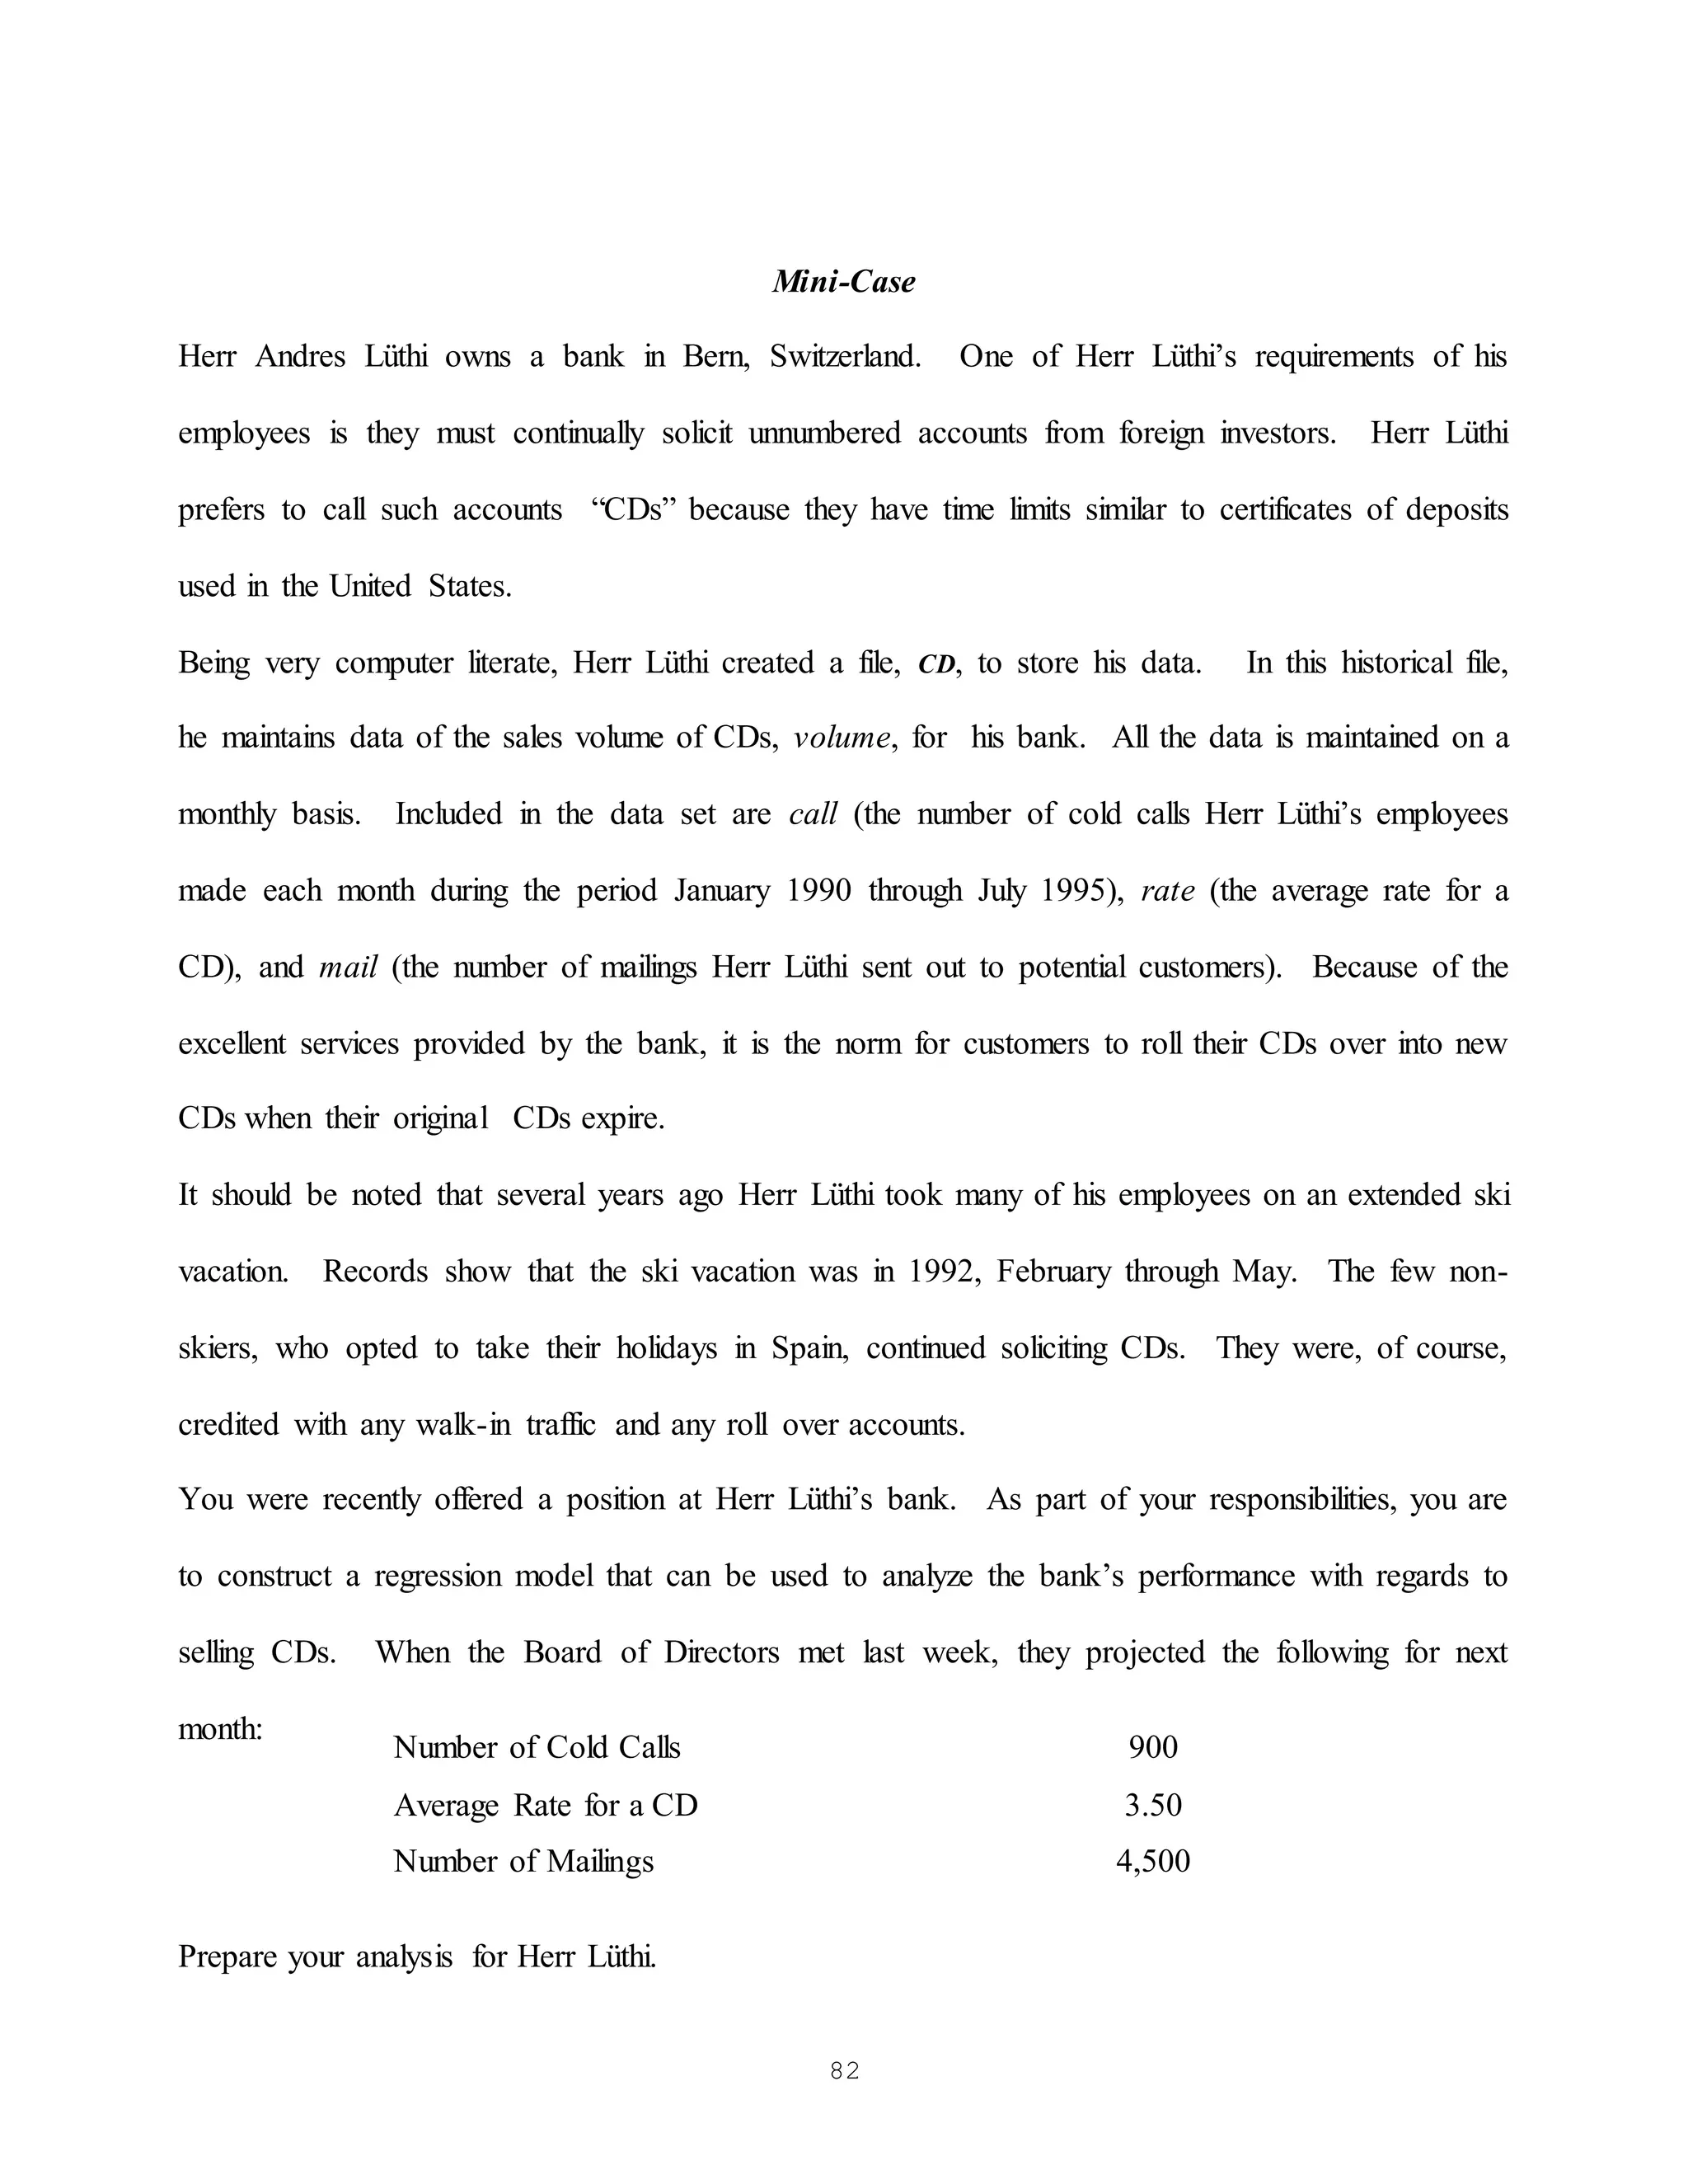
Plot of sales vs lag(sales,1)
900 1400 1900 2400 2900 3400 3900
lag(sales,1)
900
1400
1900
2400
2900
3400
3900
sales
Figure 2. Plot of Sales vs. Lag(Sales,1)
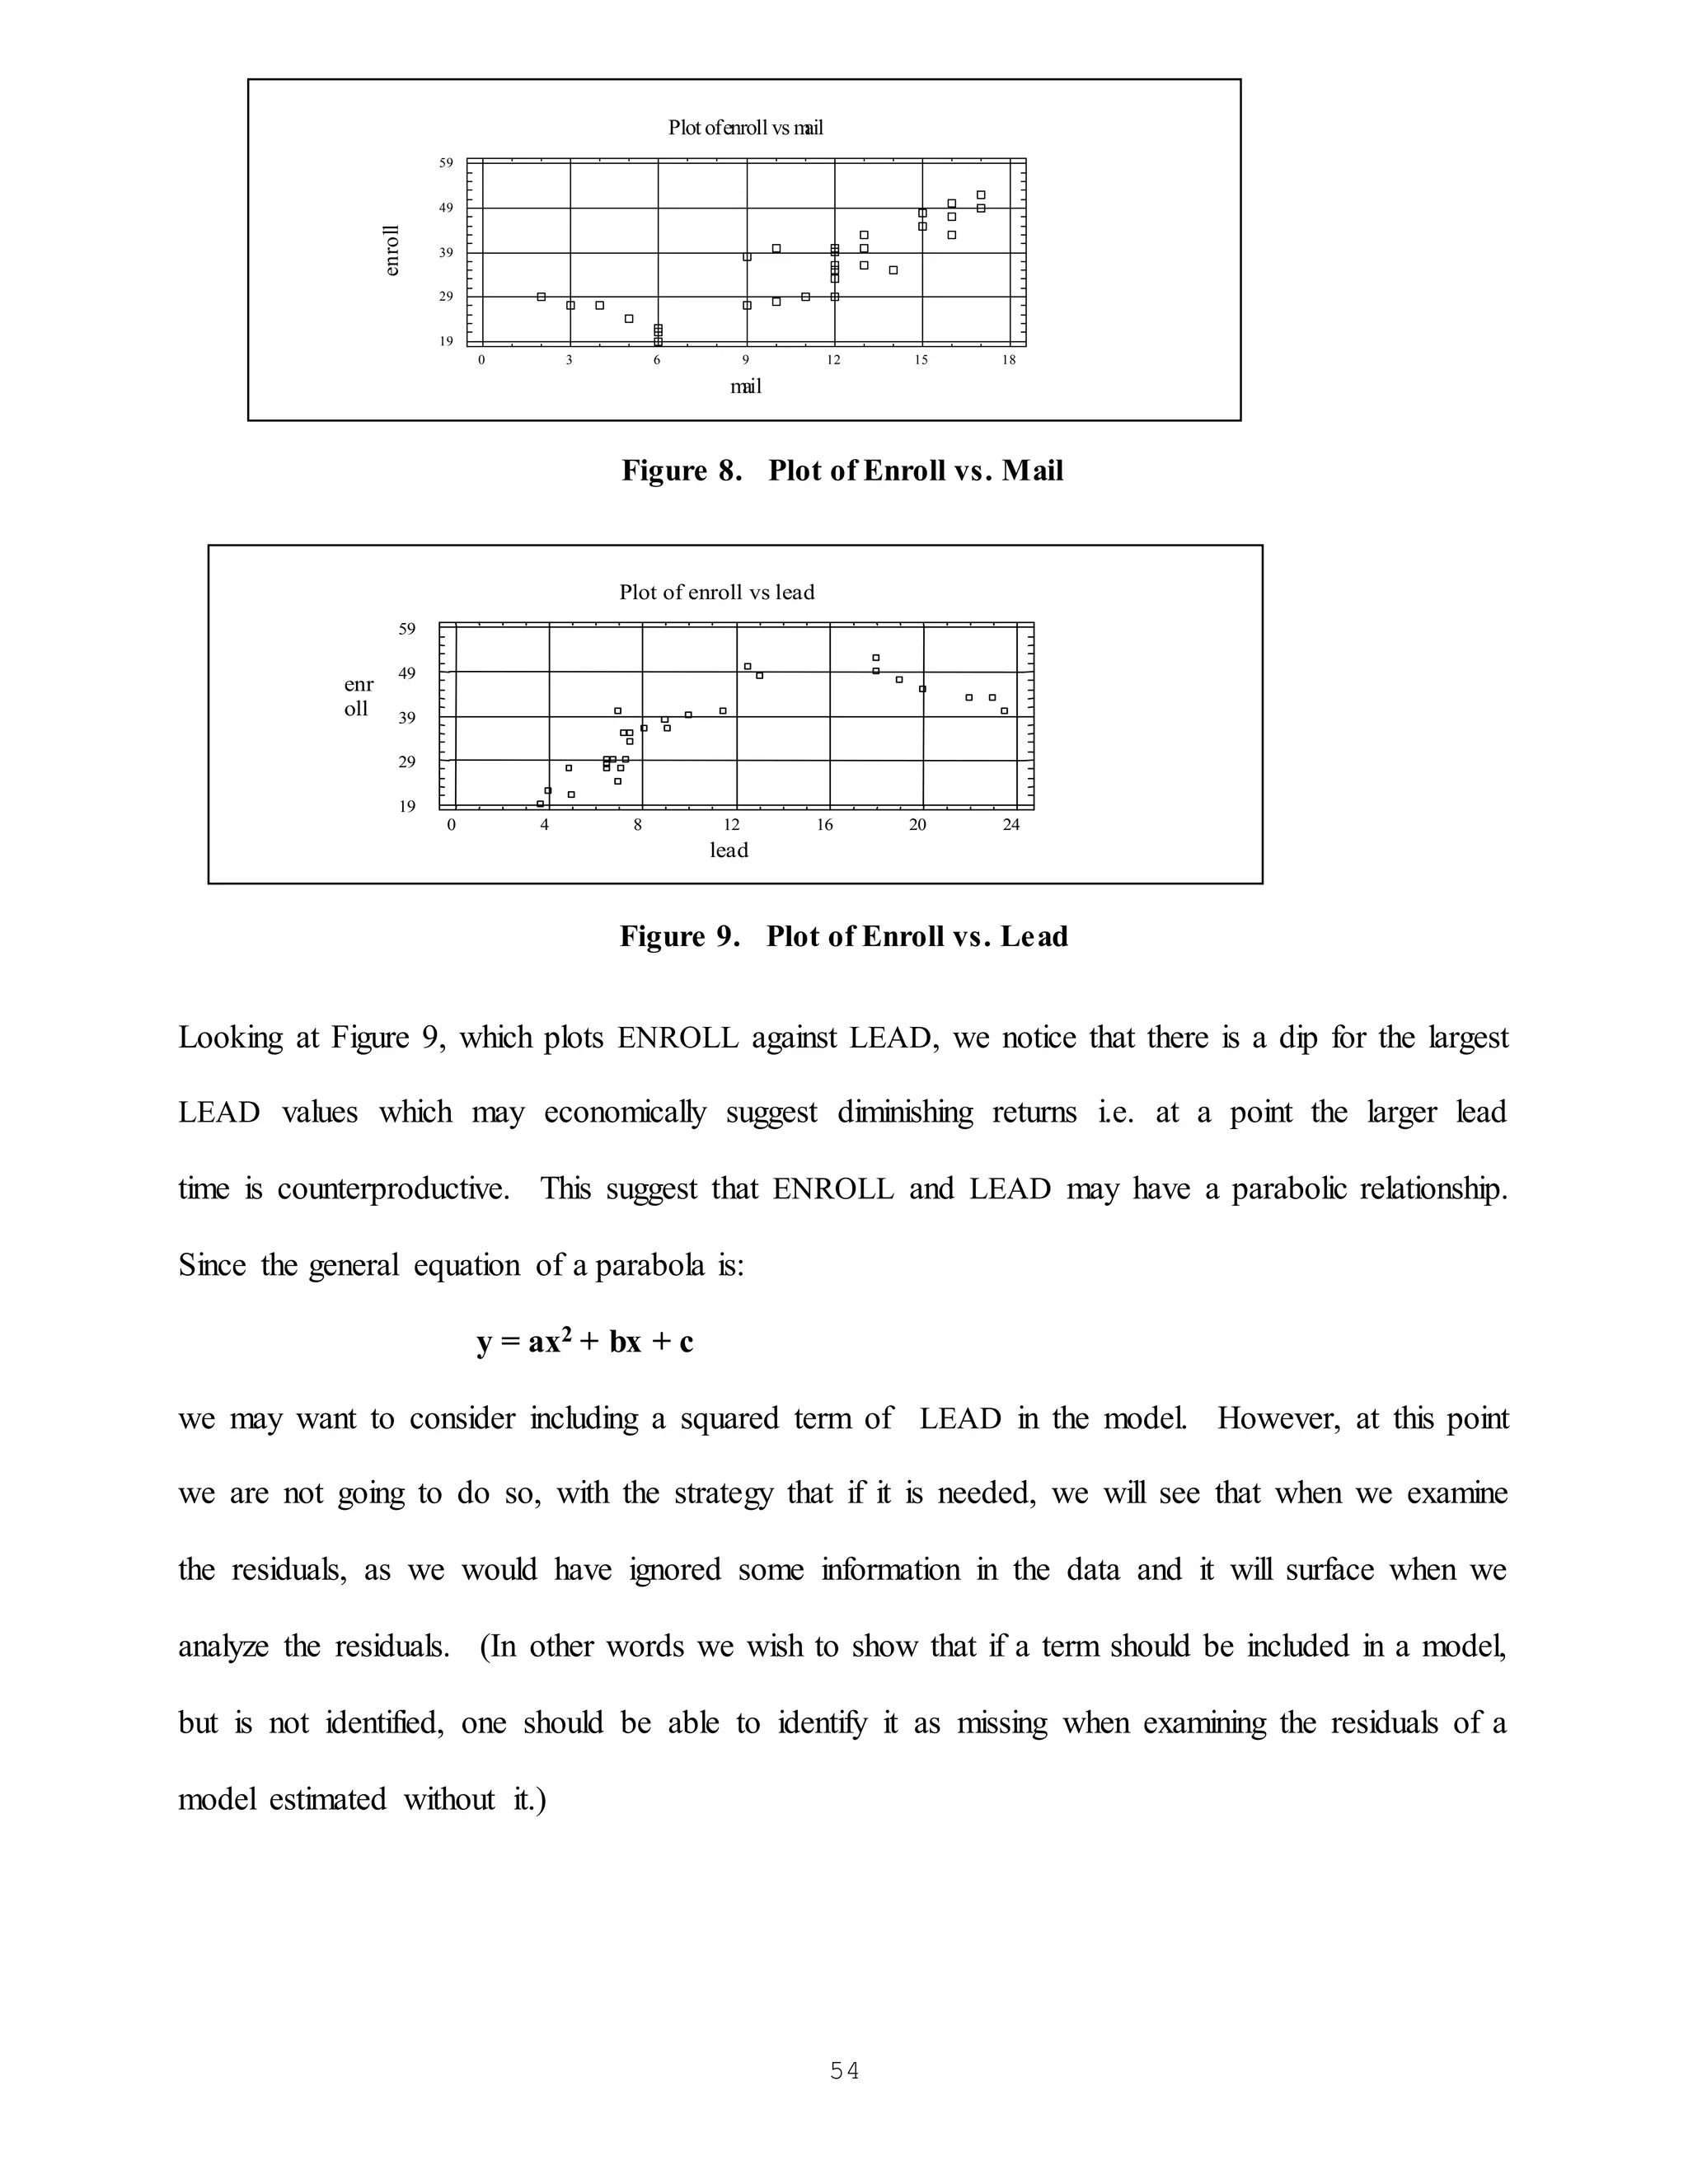
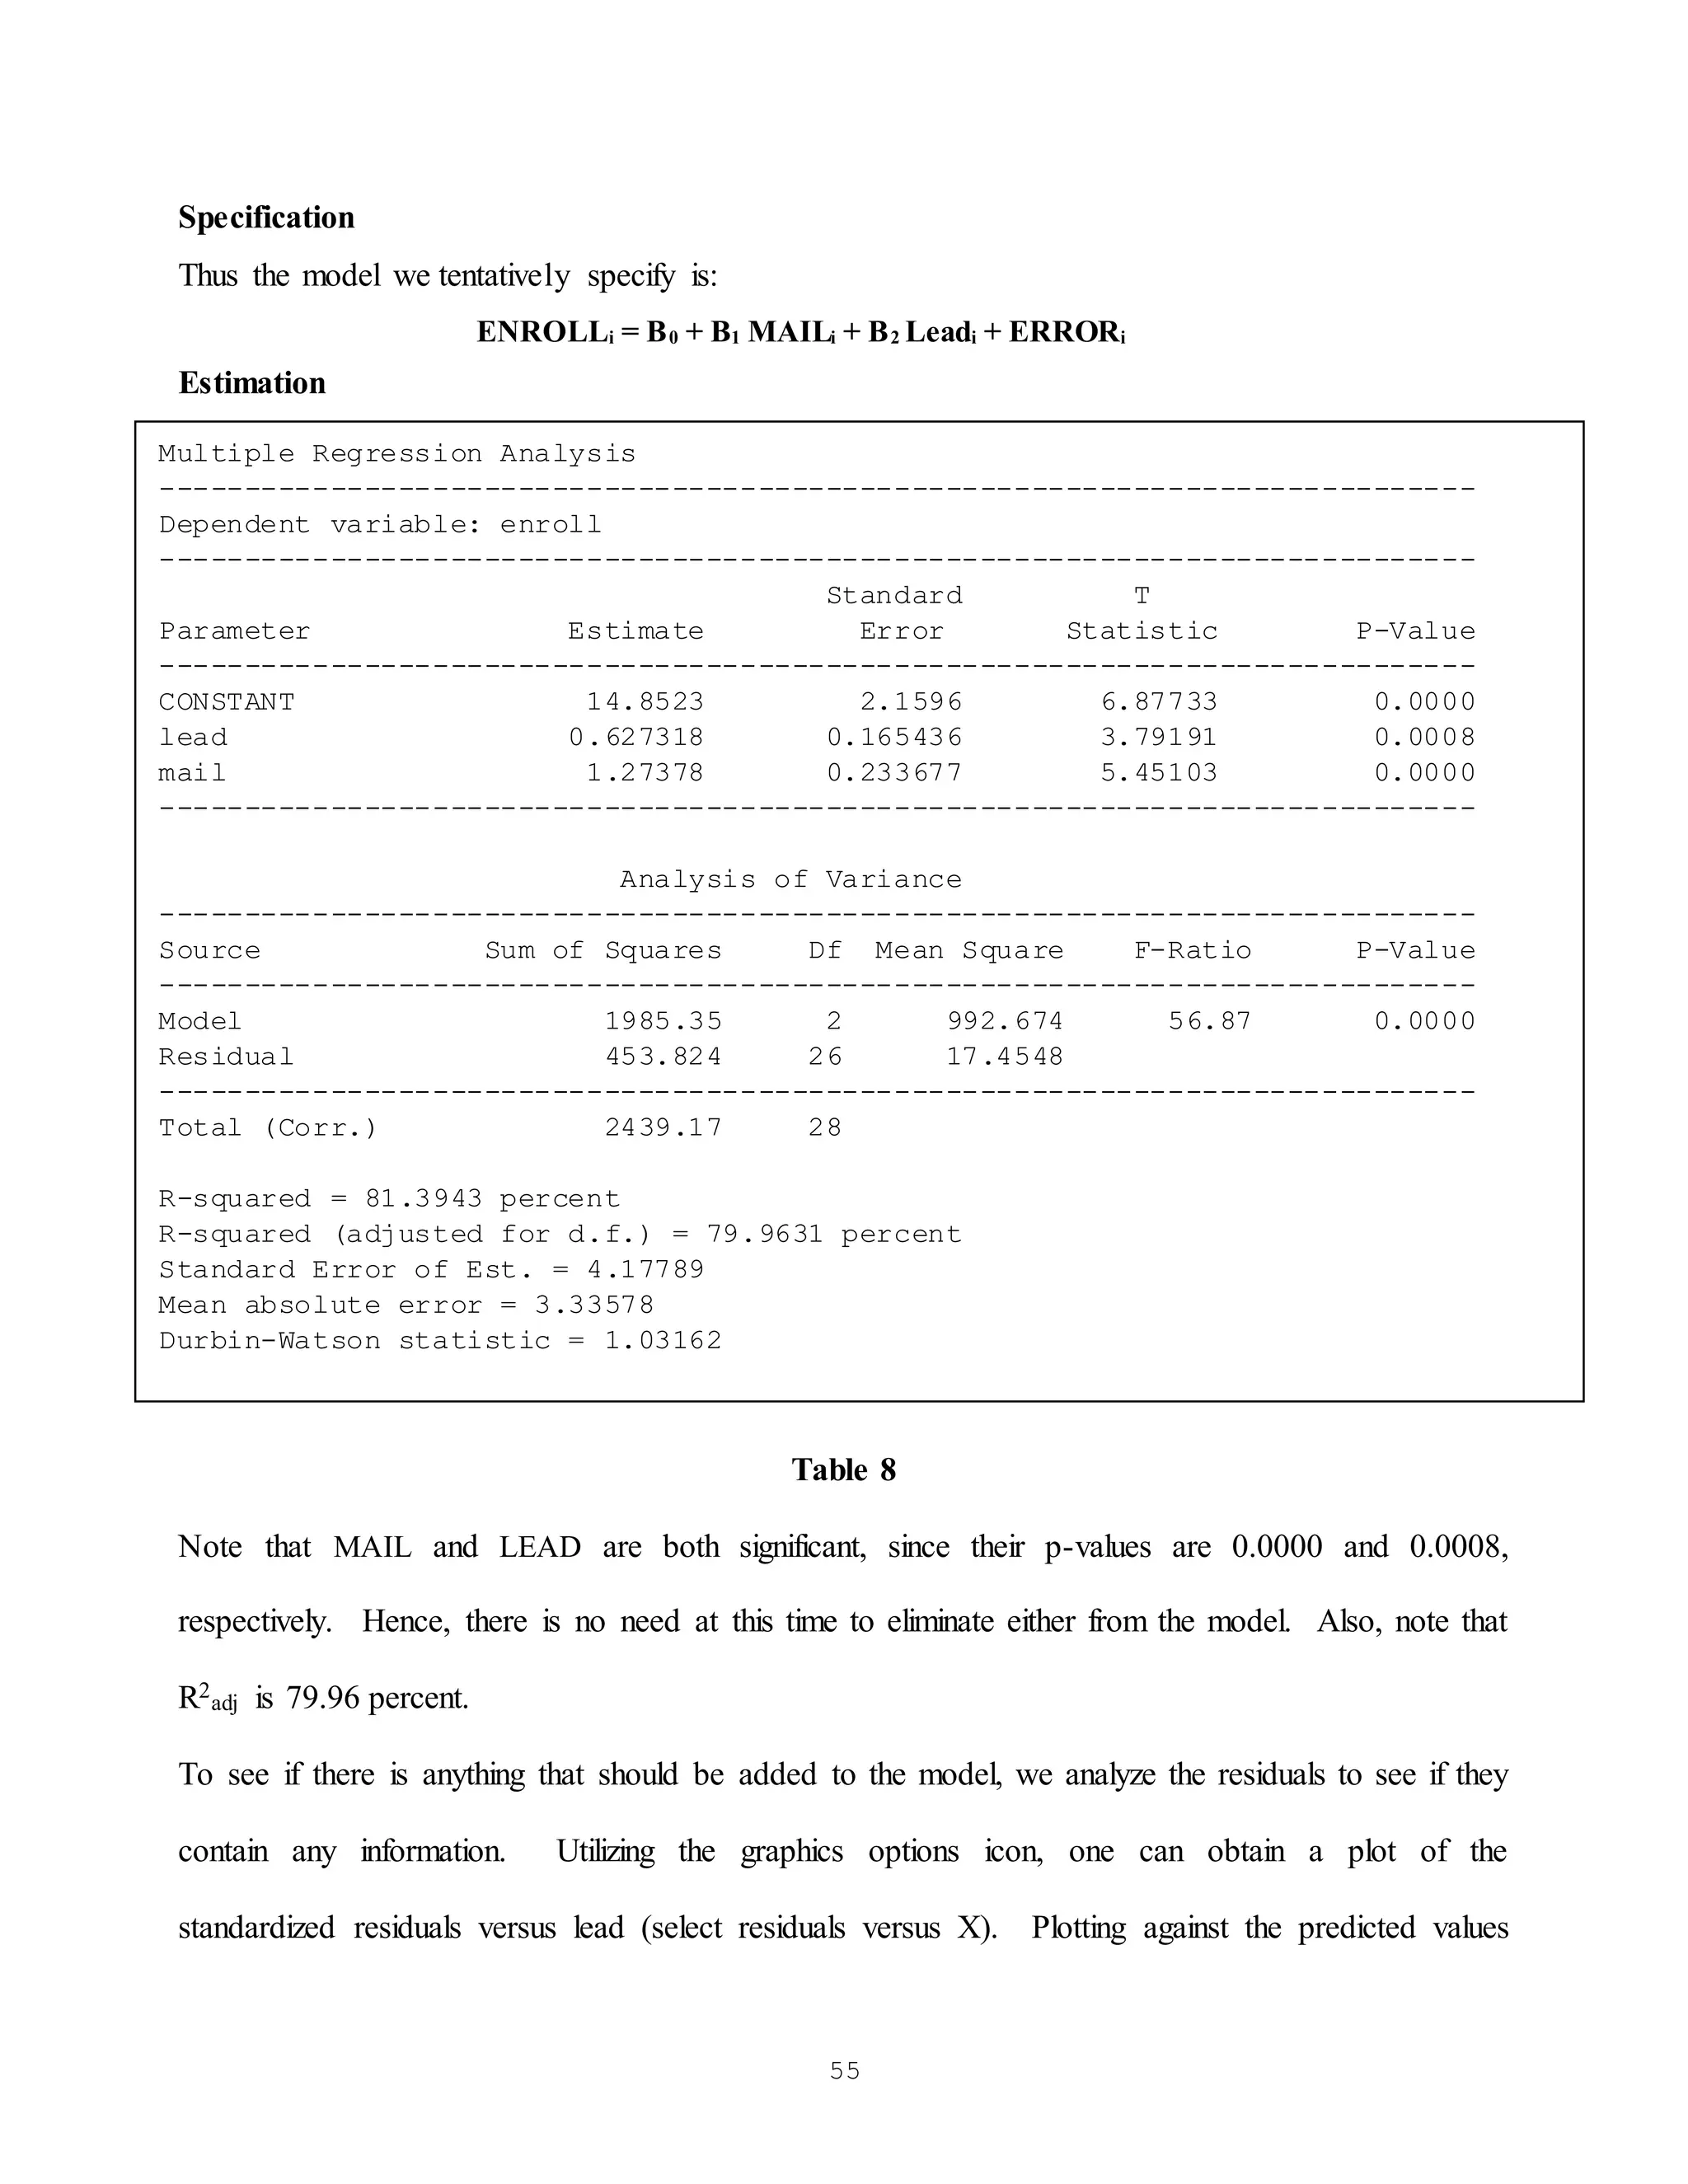
Looking at Figure 2 as shown above, one can see that there appears to be a linear relationship
between sales and sales one time period before. Thus the model being specified is:](https://image.slidesharecdn.com/notes-partii-211004051244/75/Notes-part-ii-5-2048.jpg)
![50
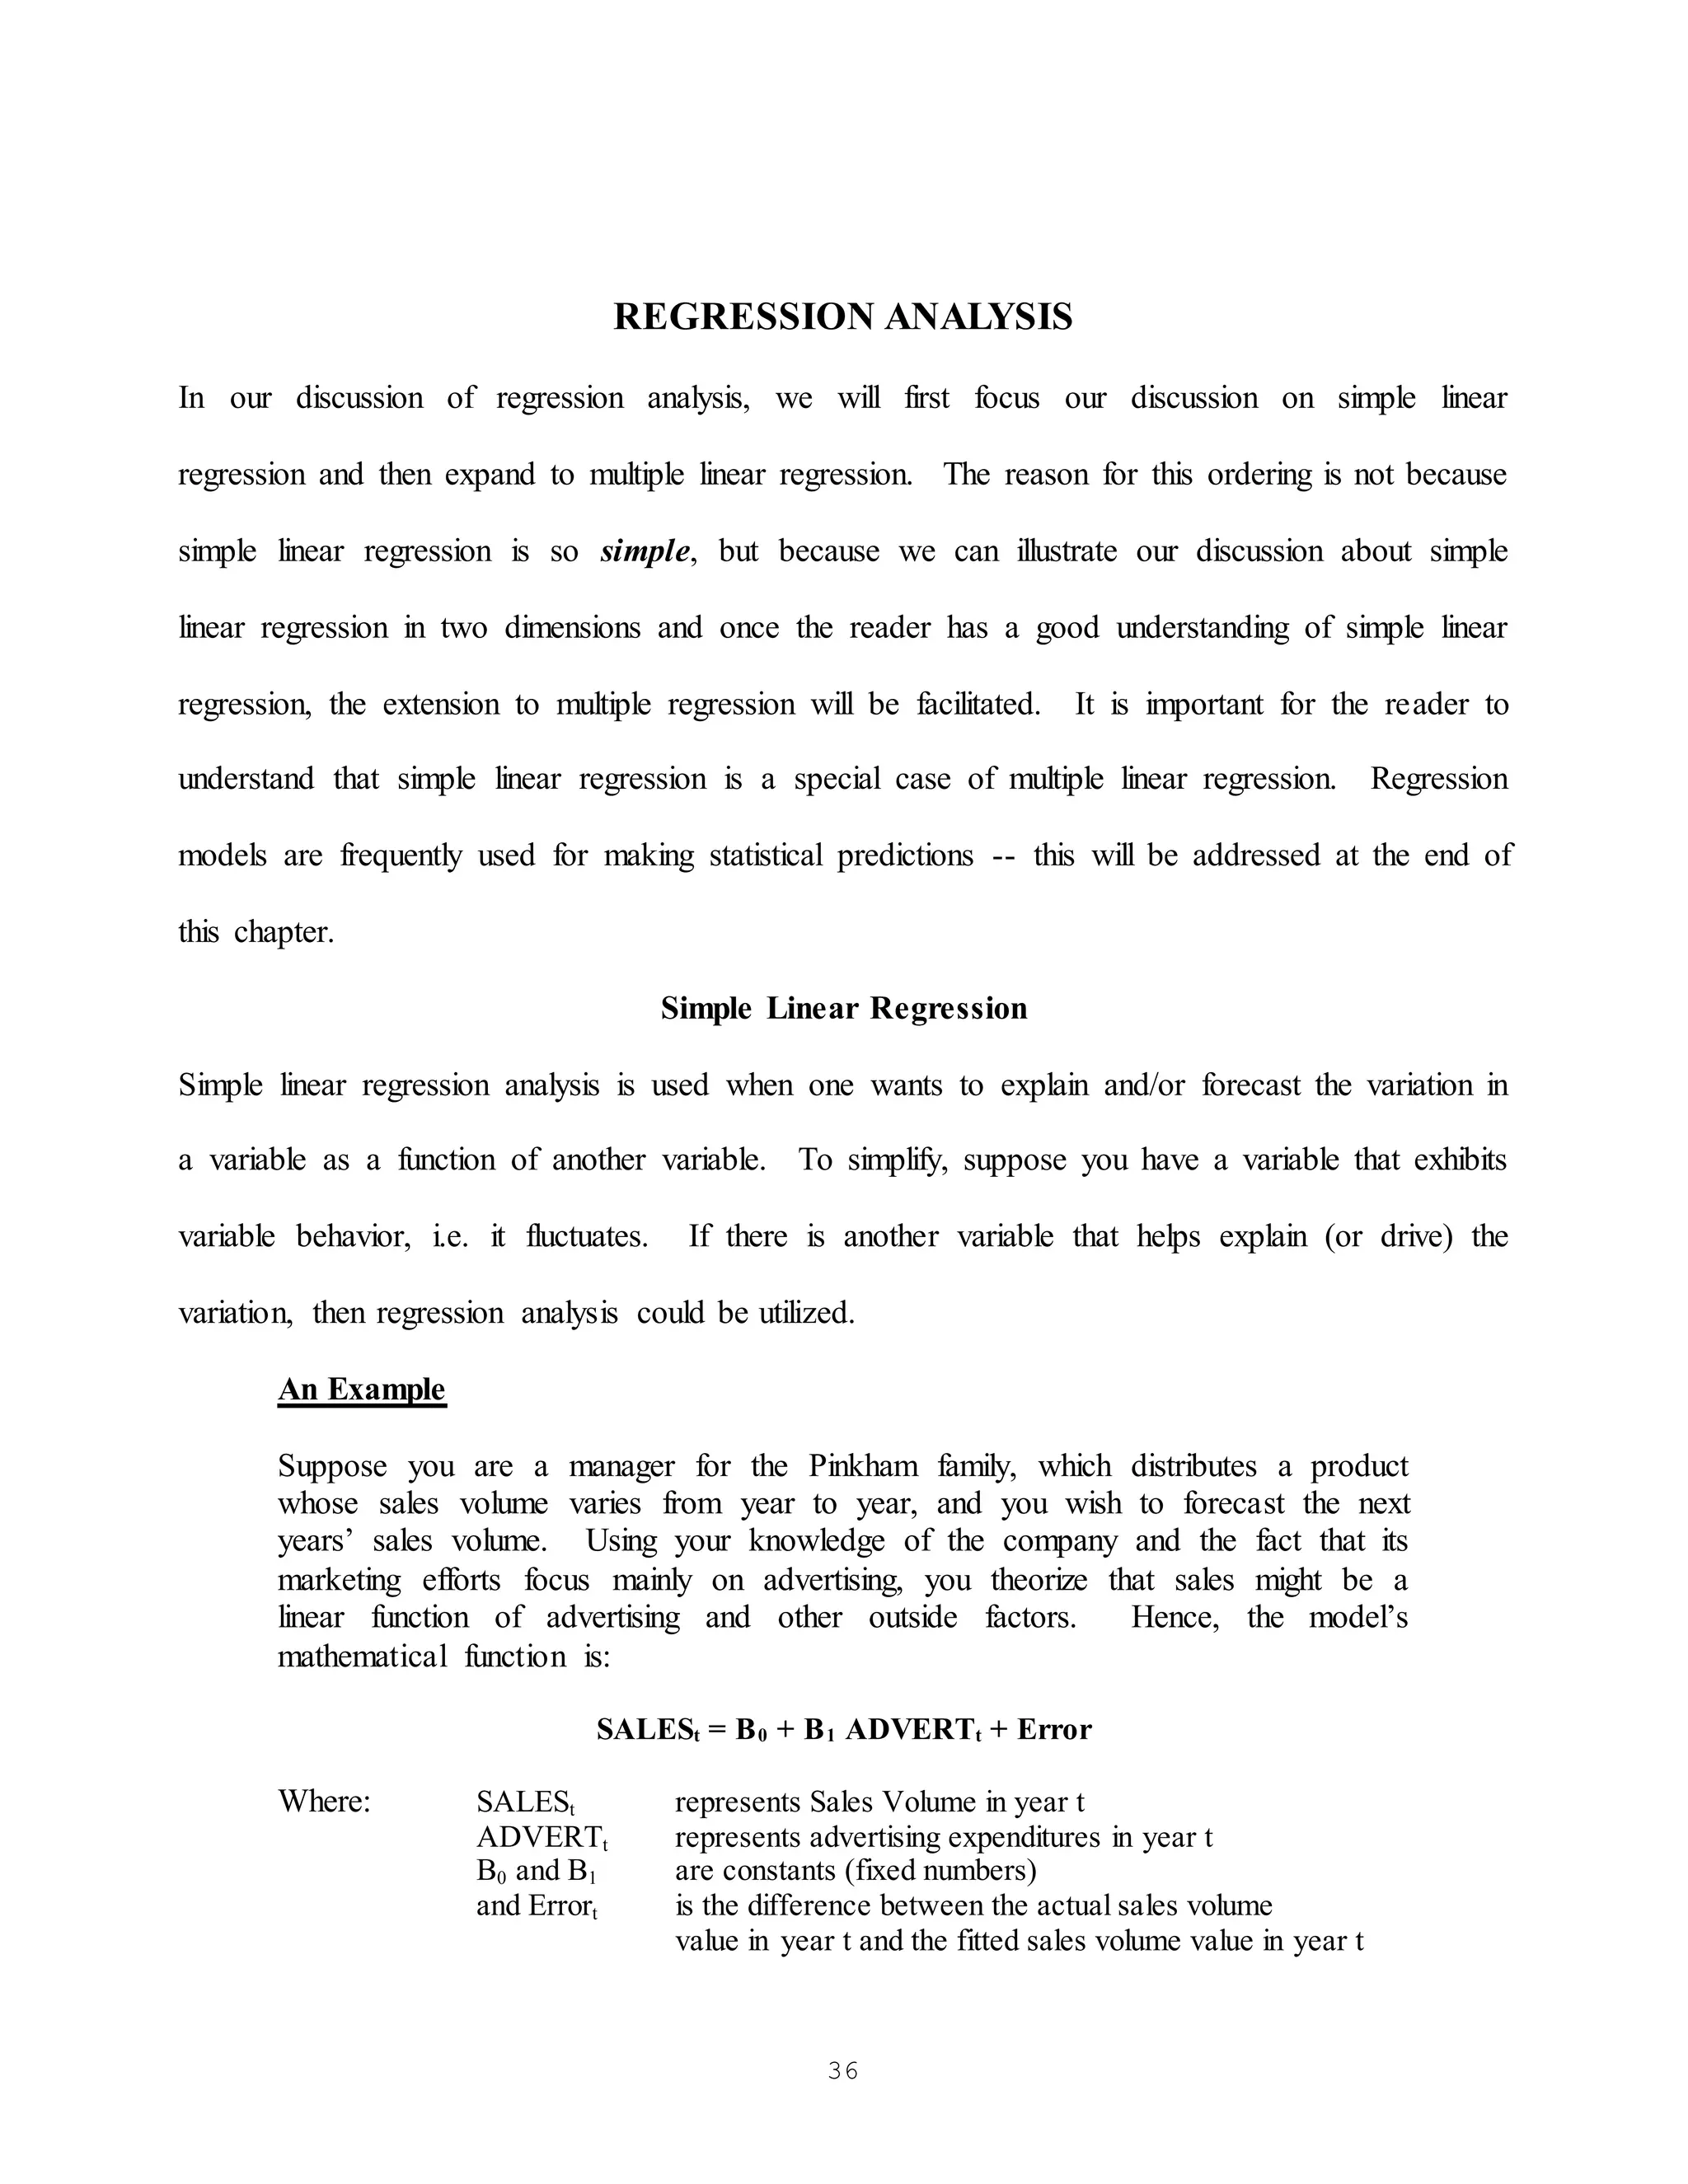
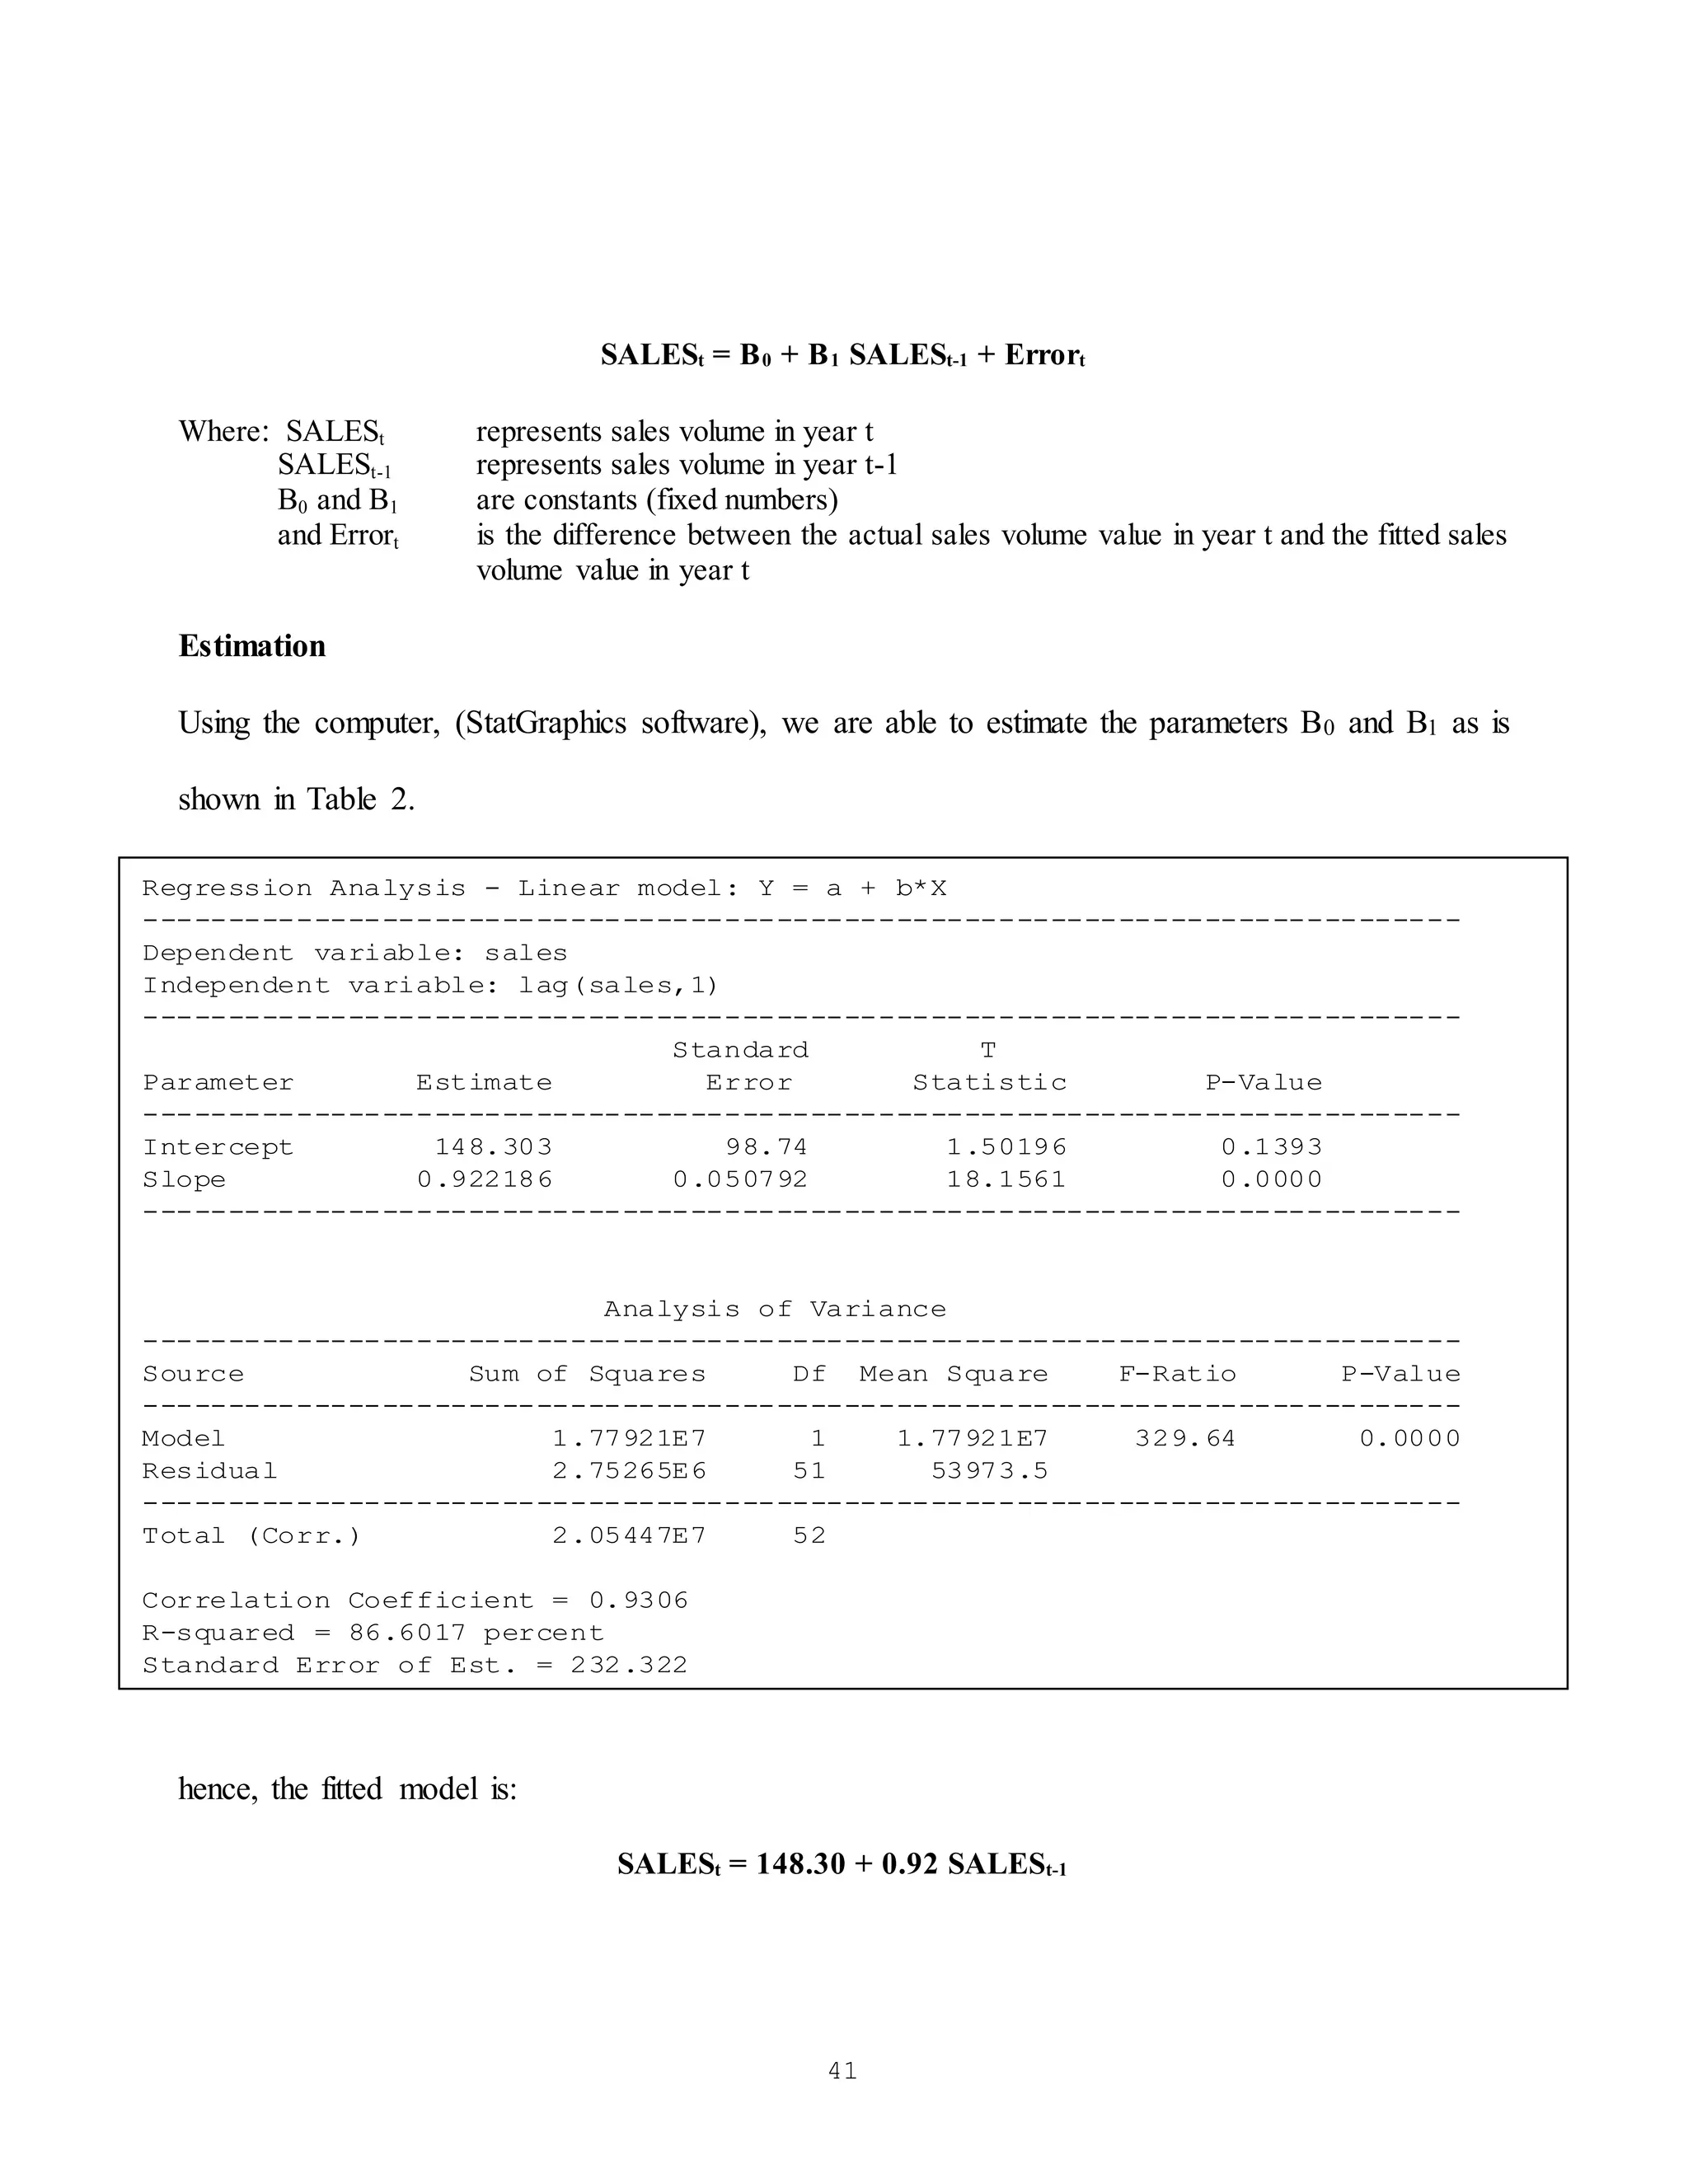
Multiple Linear Regression
Referring back to the Pinkham data, suppose you decided that ADVERTt contained information
about SALESt that lagged value of SALESt (i.e. SALESt-1) did not, and vice versa, and that you
wished to regress SALESt on both ADVERTt and SALESt-1; the solution would be to use a multiple
regression model. Hence, we need to generalize our discussion of simple linear regression models
by now allowing for more than one explanatory variable, hence the name multiple regression.
[Note: more than one explanatory variable, hence we are not limited to just two explanatory
variables.]
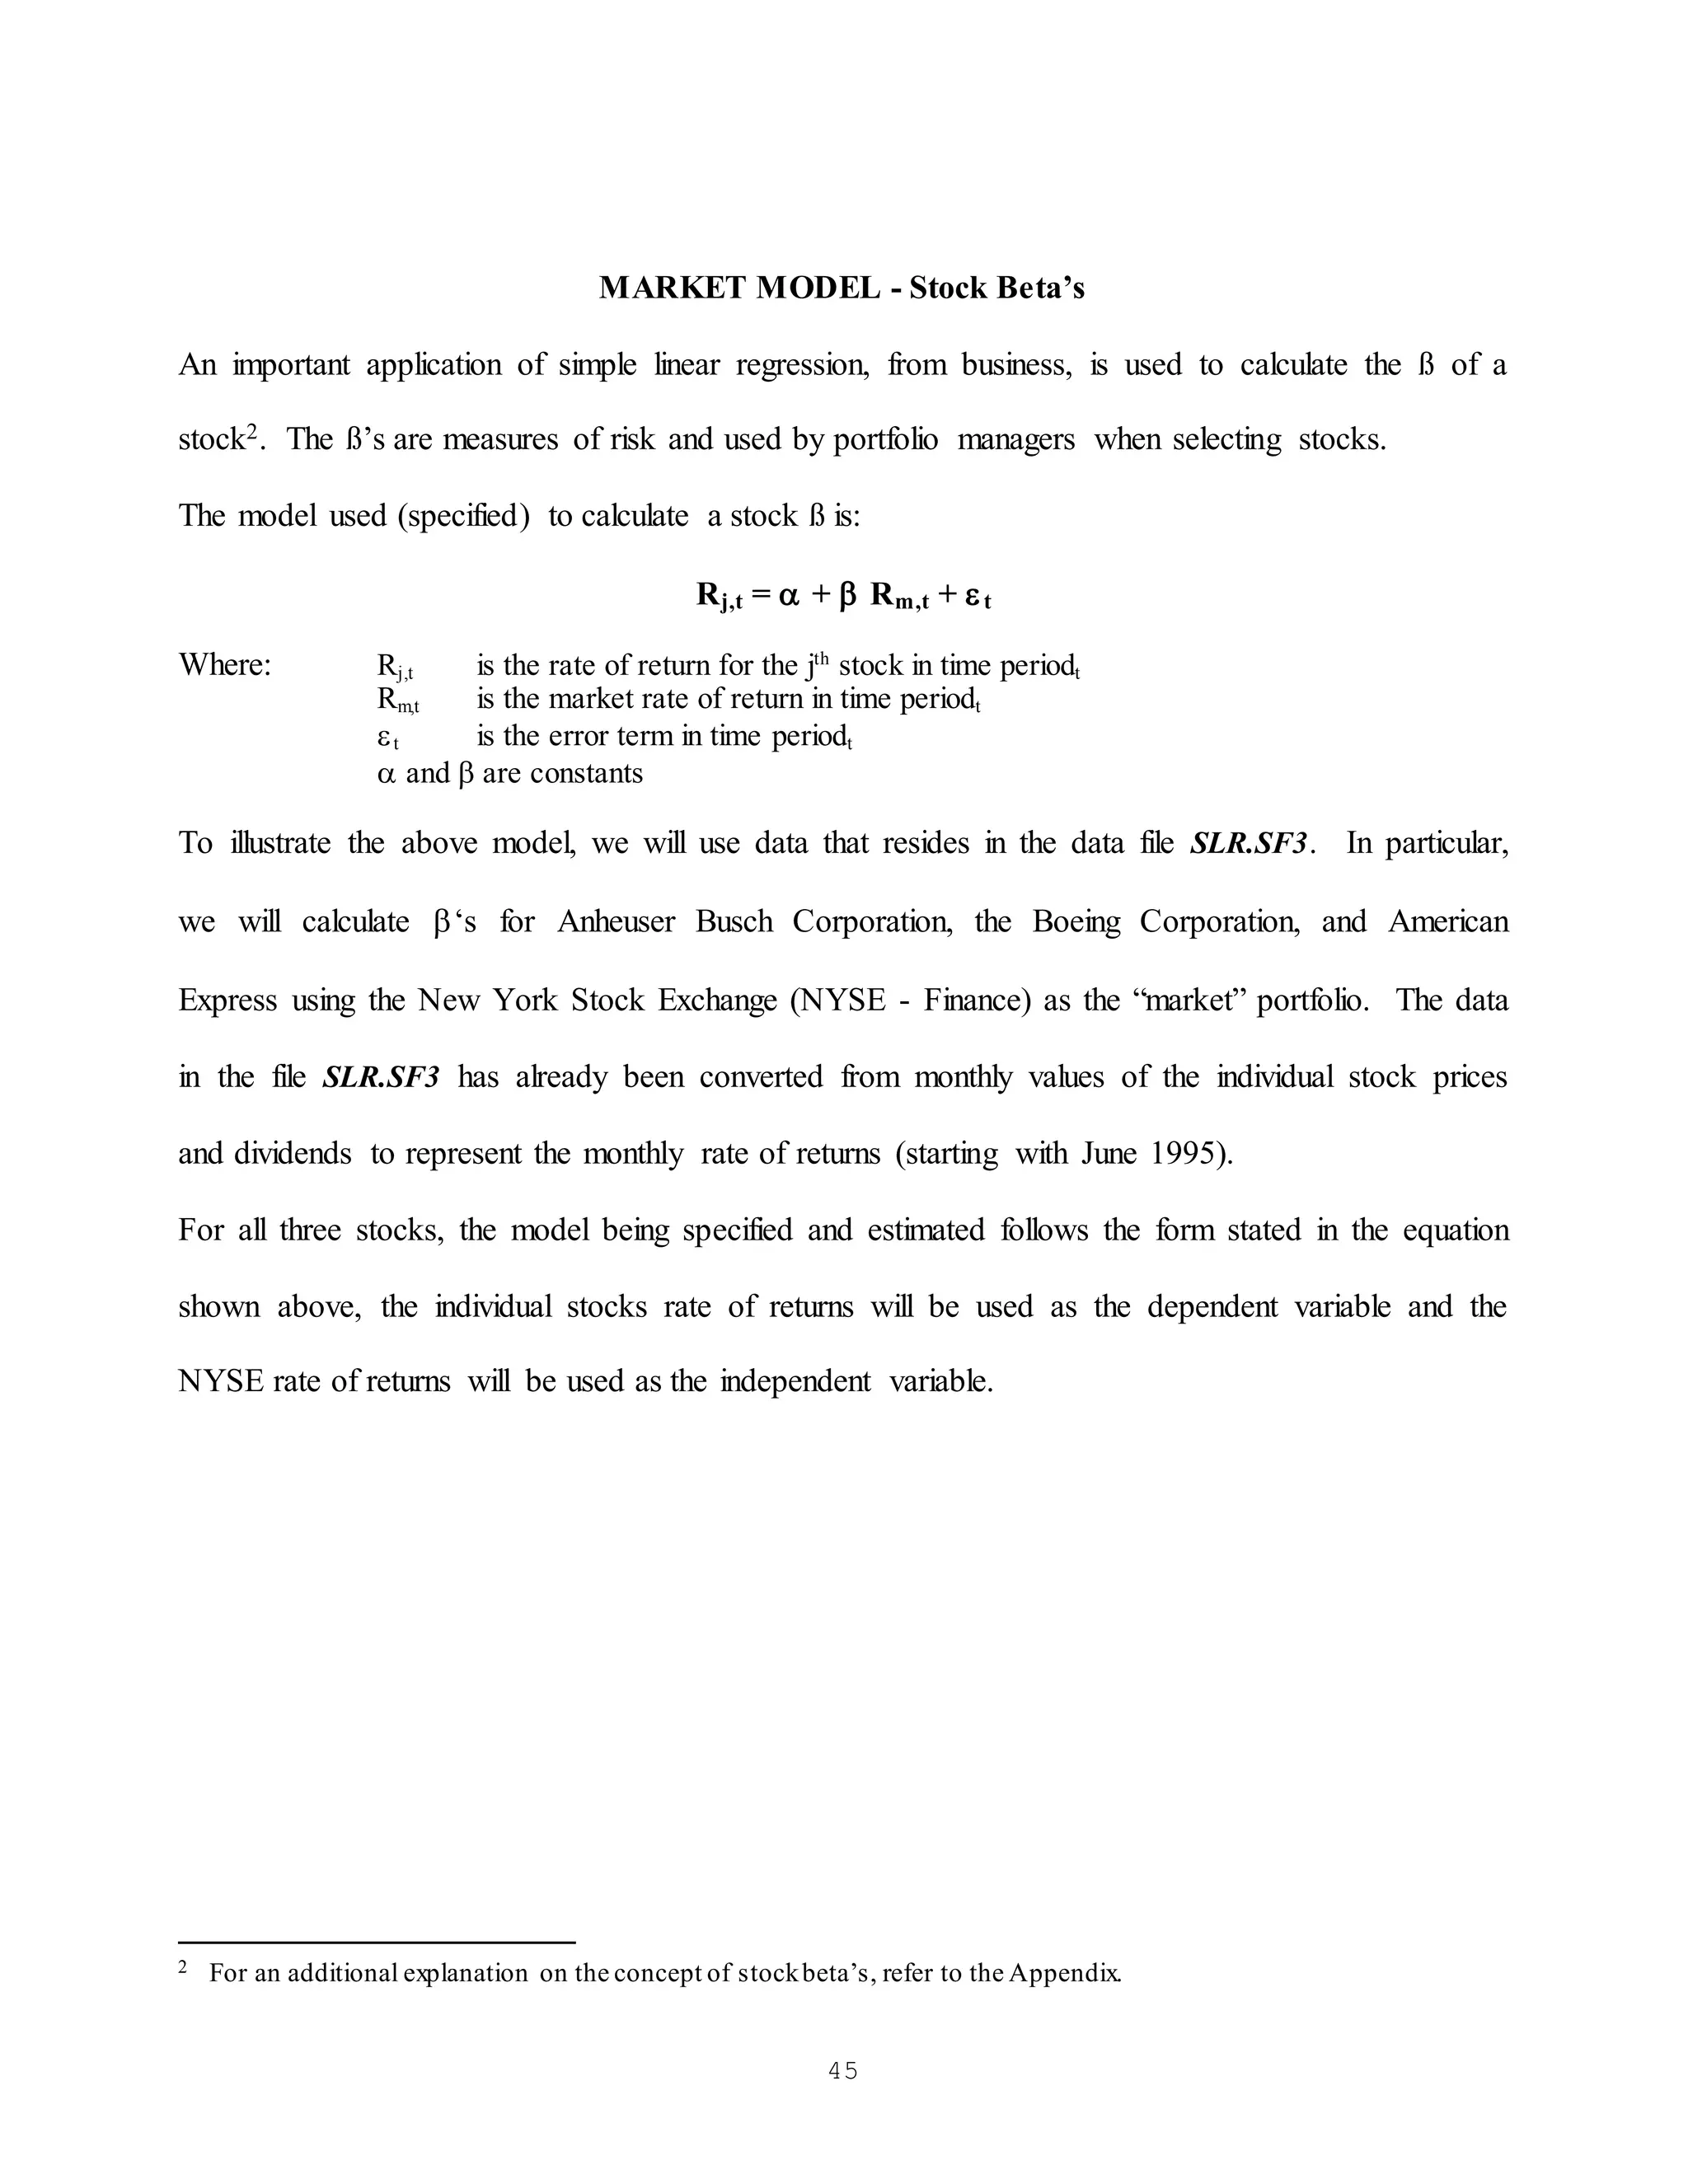
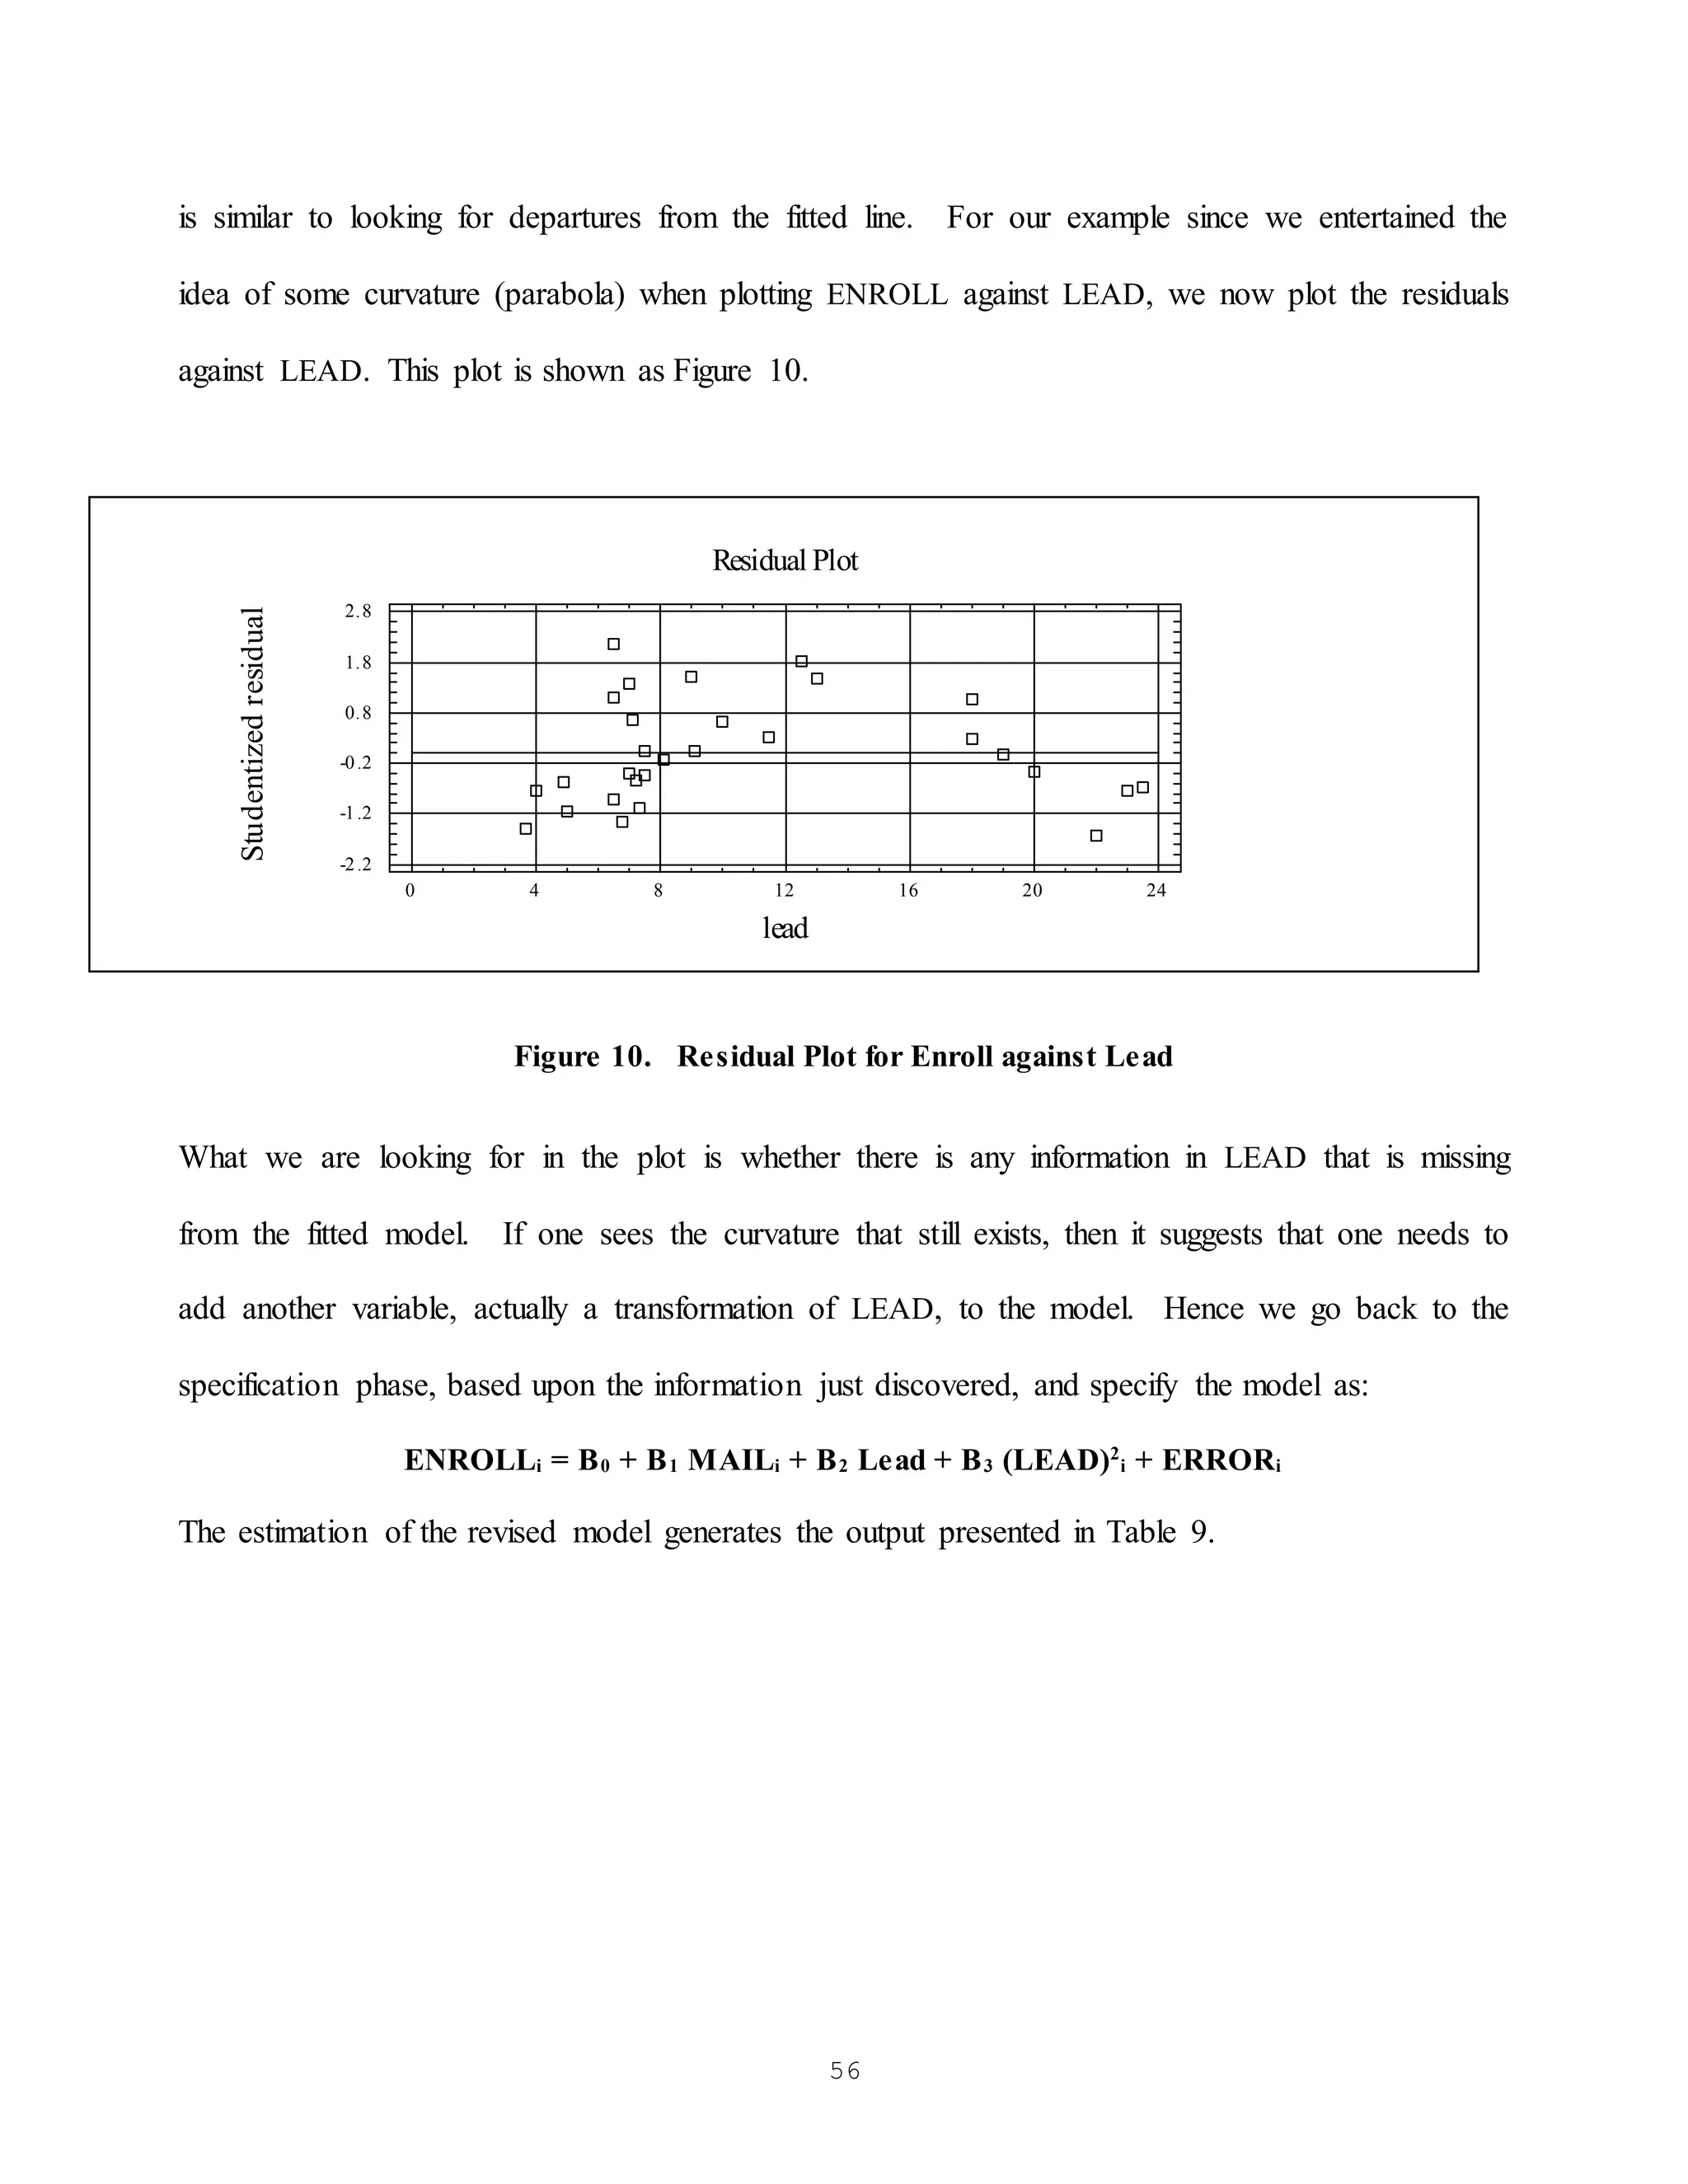
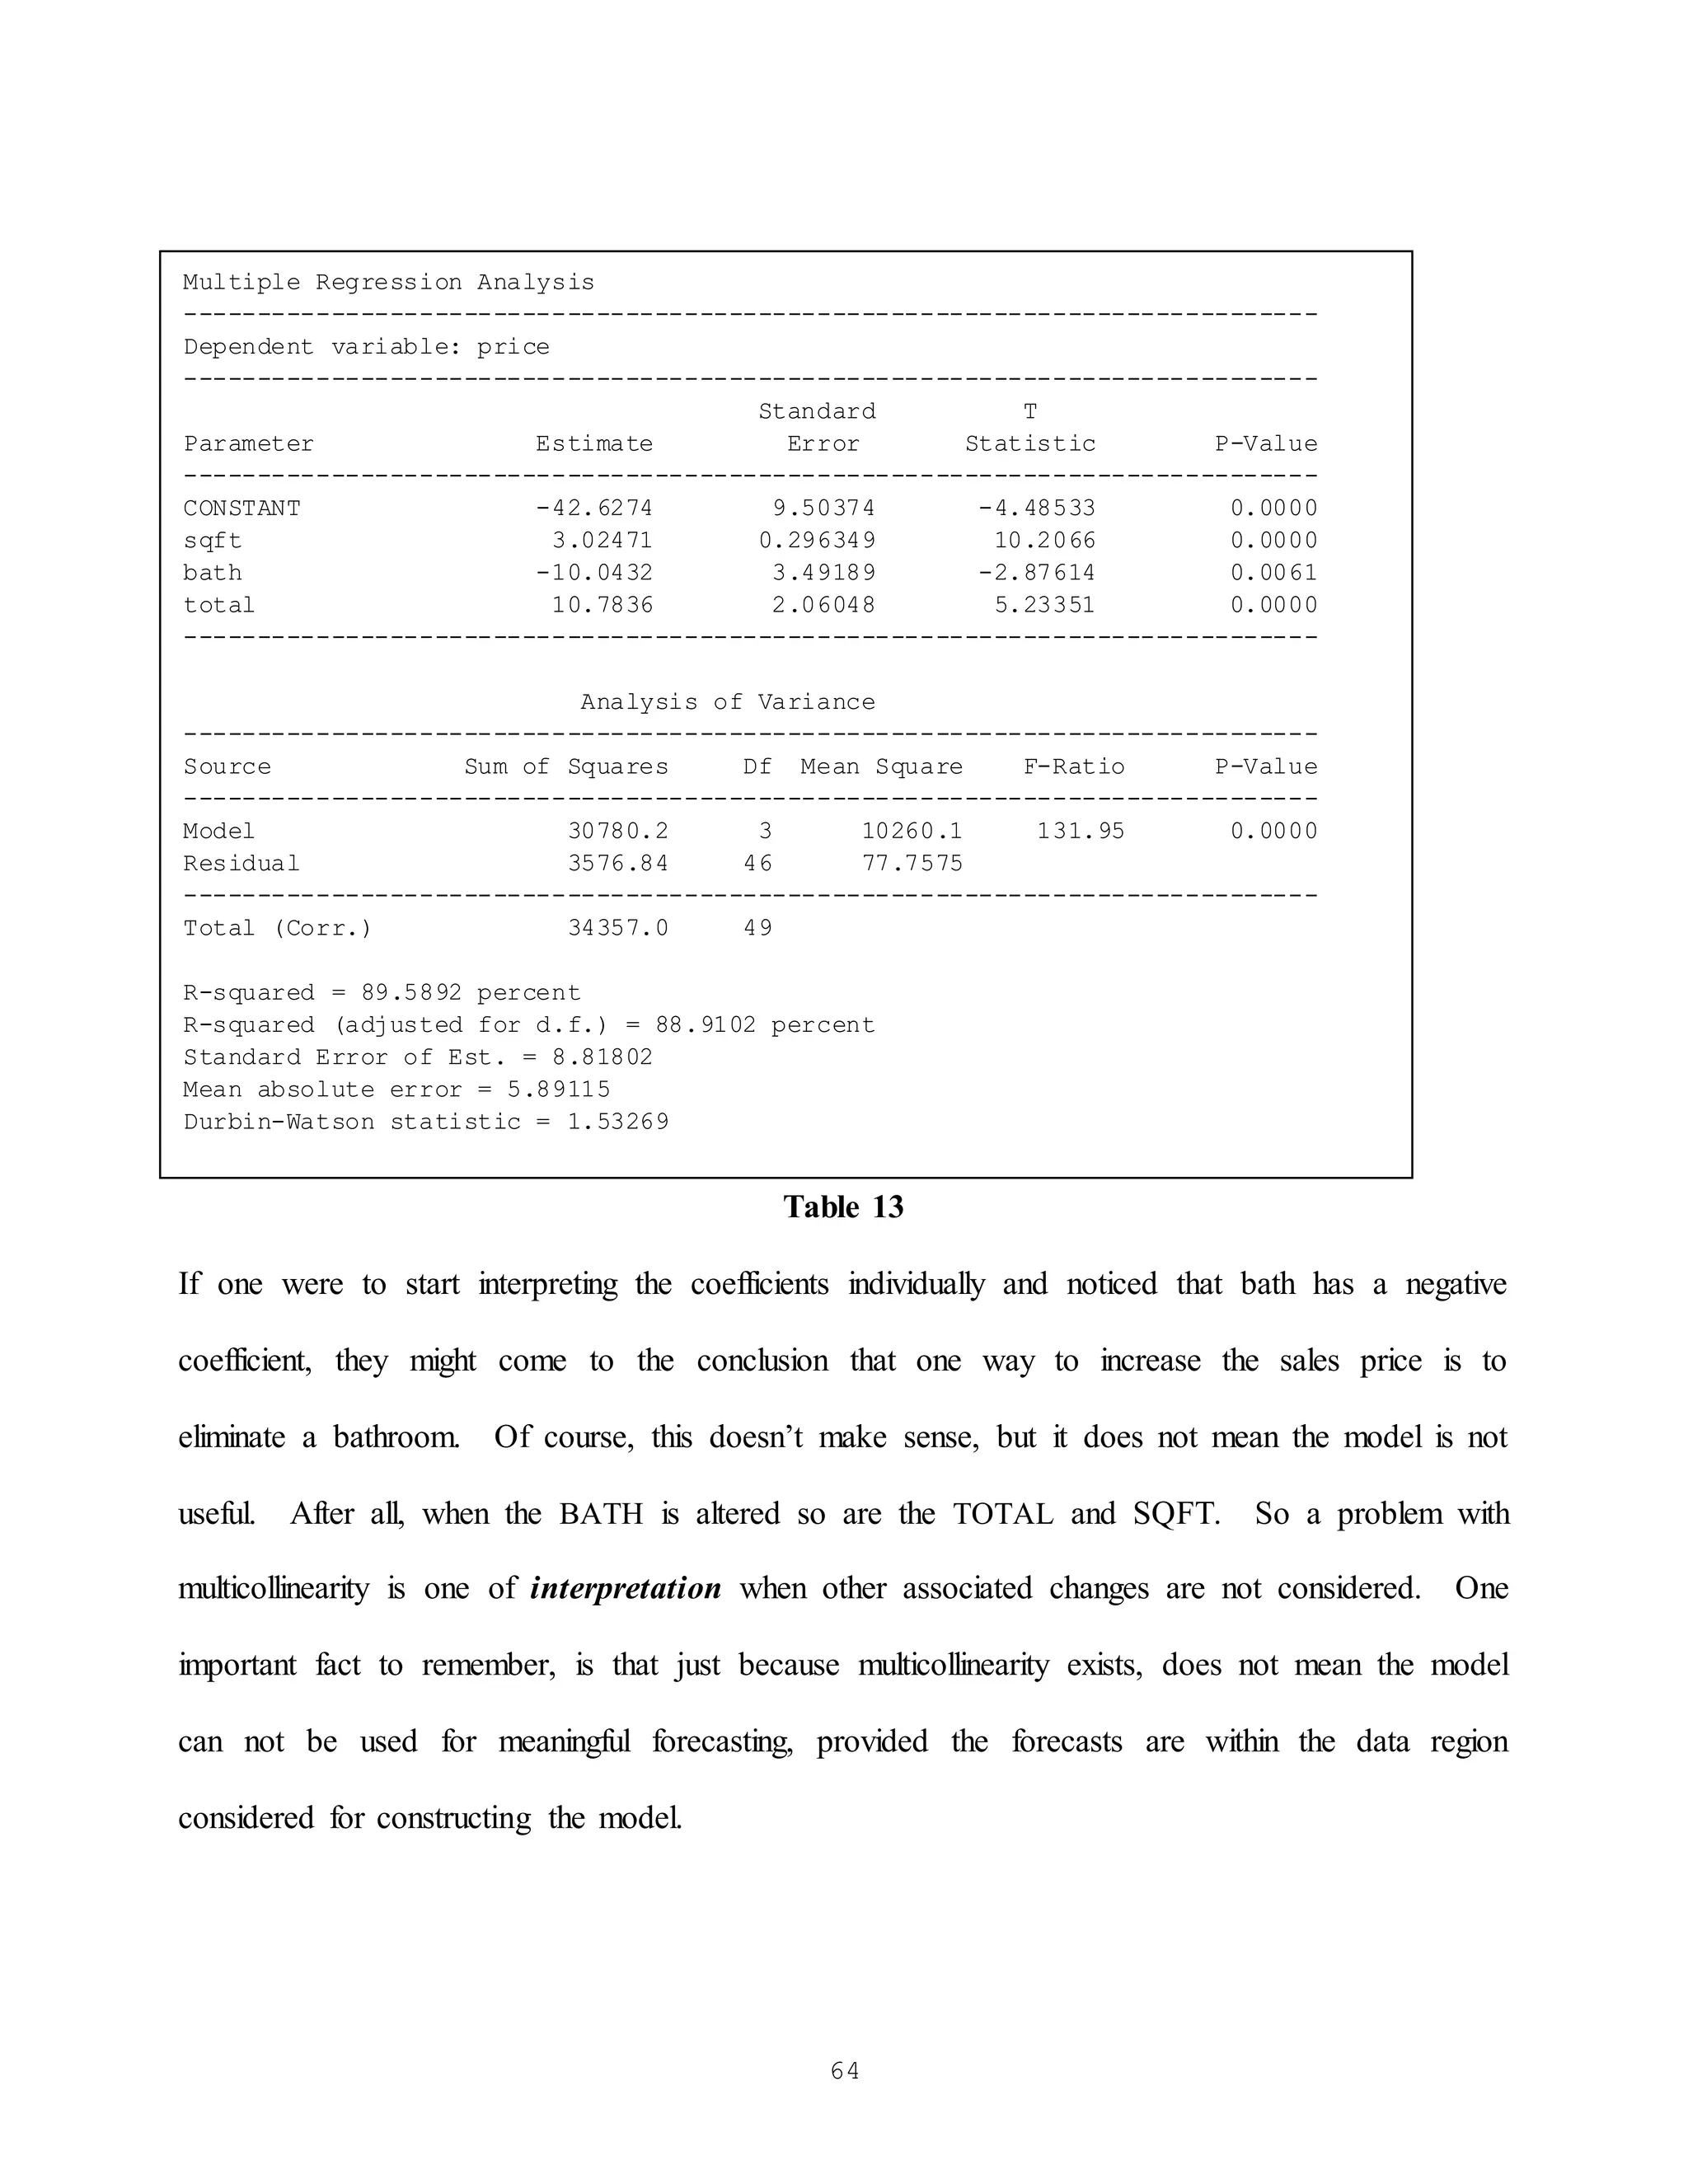
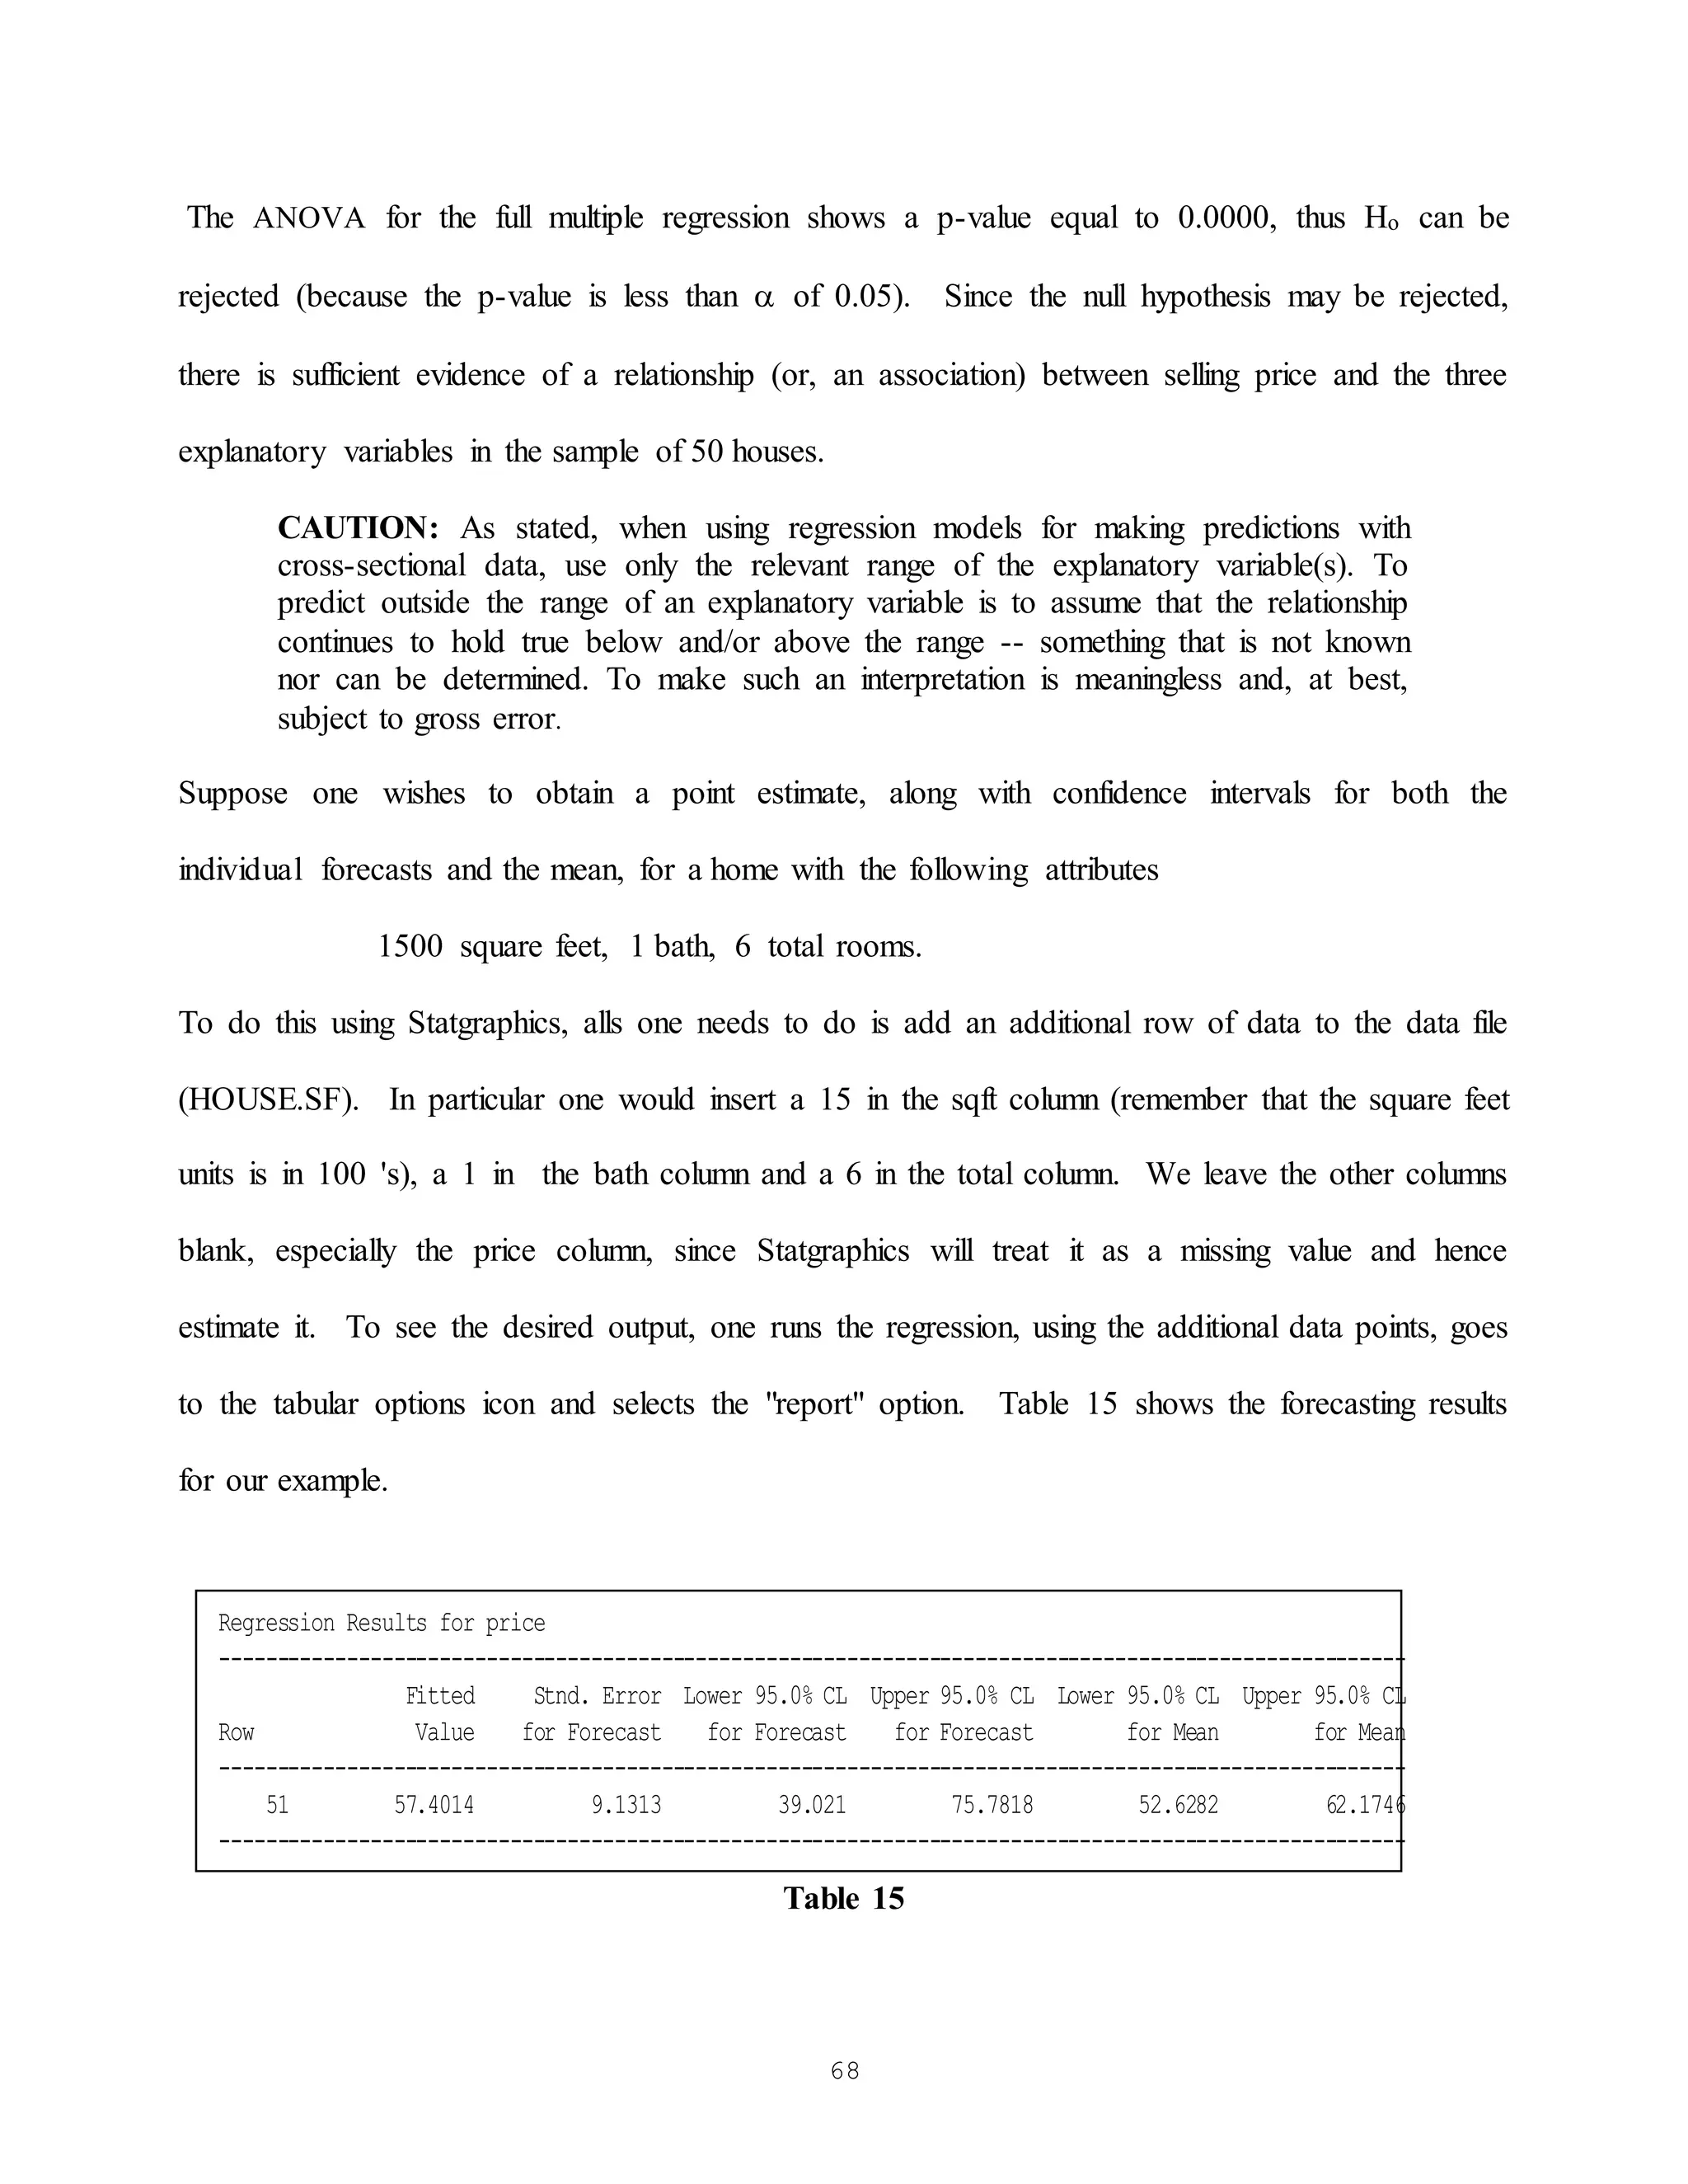
Specification: Going back to our example, if we specify a multiple linear regression model where
SALESt is again the dependent variable and ADVERTt and SALESt-1 are the explanatory variables,
then the model is:
SALESt = B0 + B1 ADVERTt + B2 SALESt-1 + ERRORt
where: B0, B1, and B2 are parameters (coefficients).
Estimation: To obtain estimates for B0, B1, and B2 via StatGraphics, the criterion of least squares
still applies, the mathematics employed involves using matrix algebra. It suffices for the student to
understand what the computer is doing on an intuitive level; i.e. the best fitting line is being
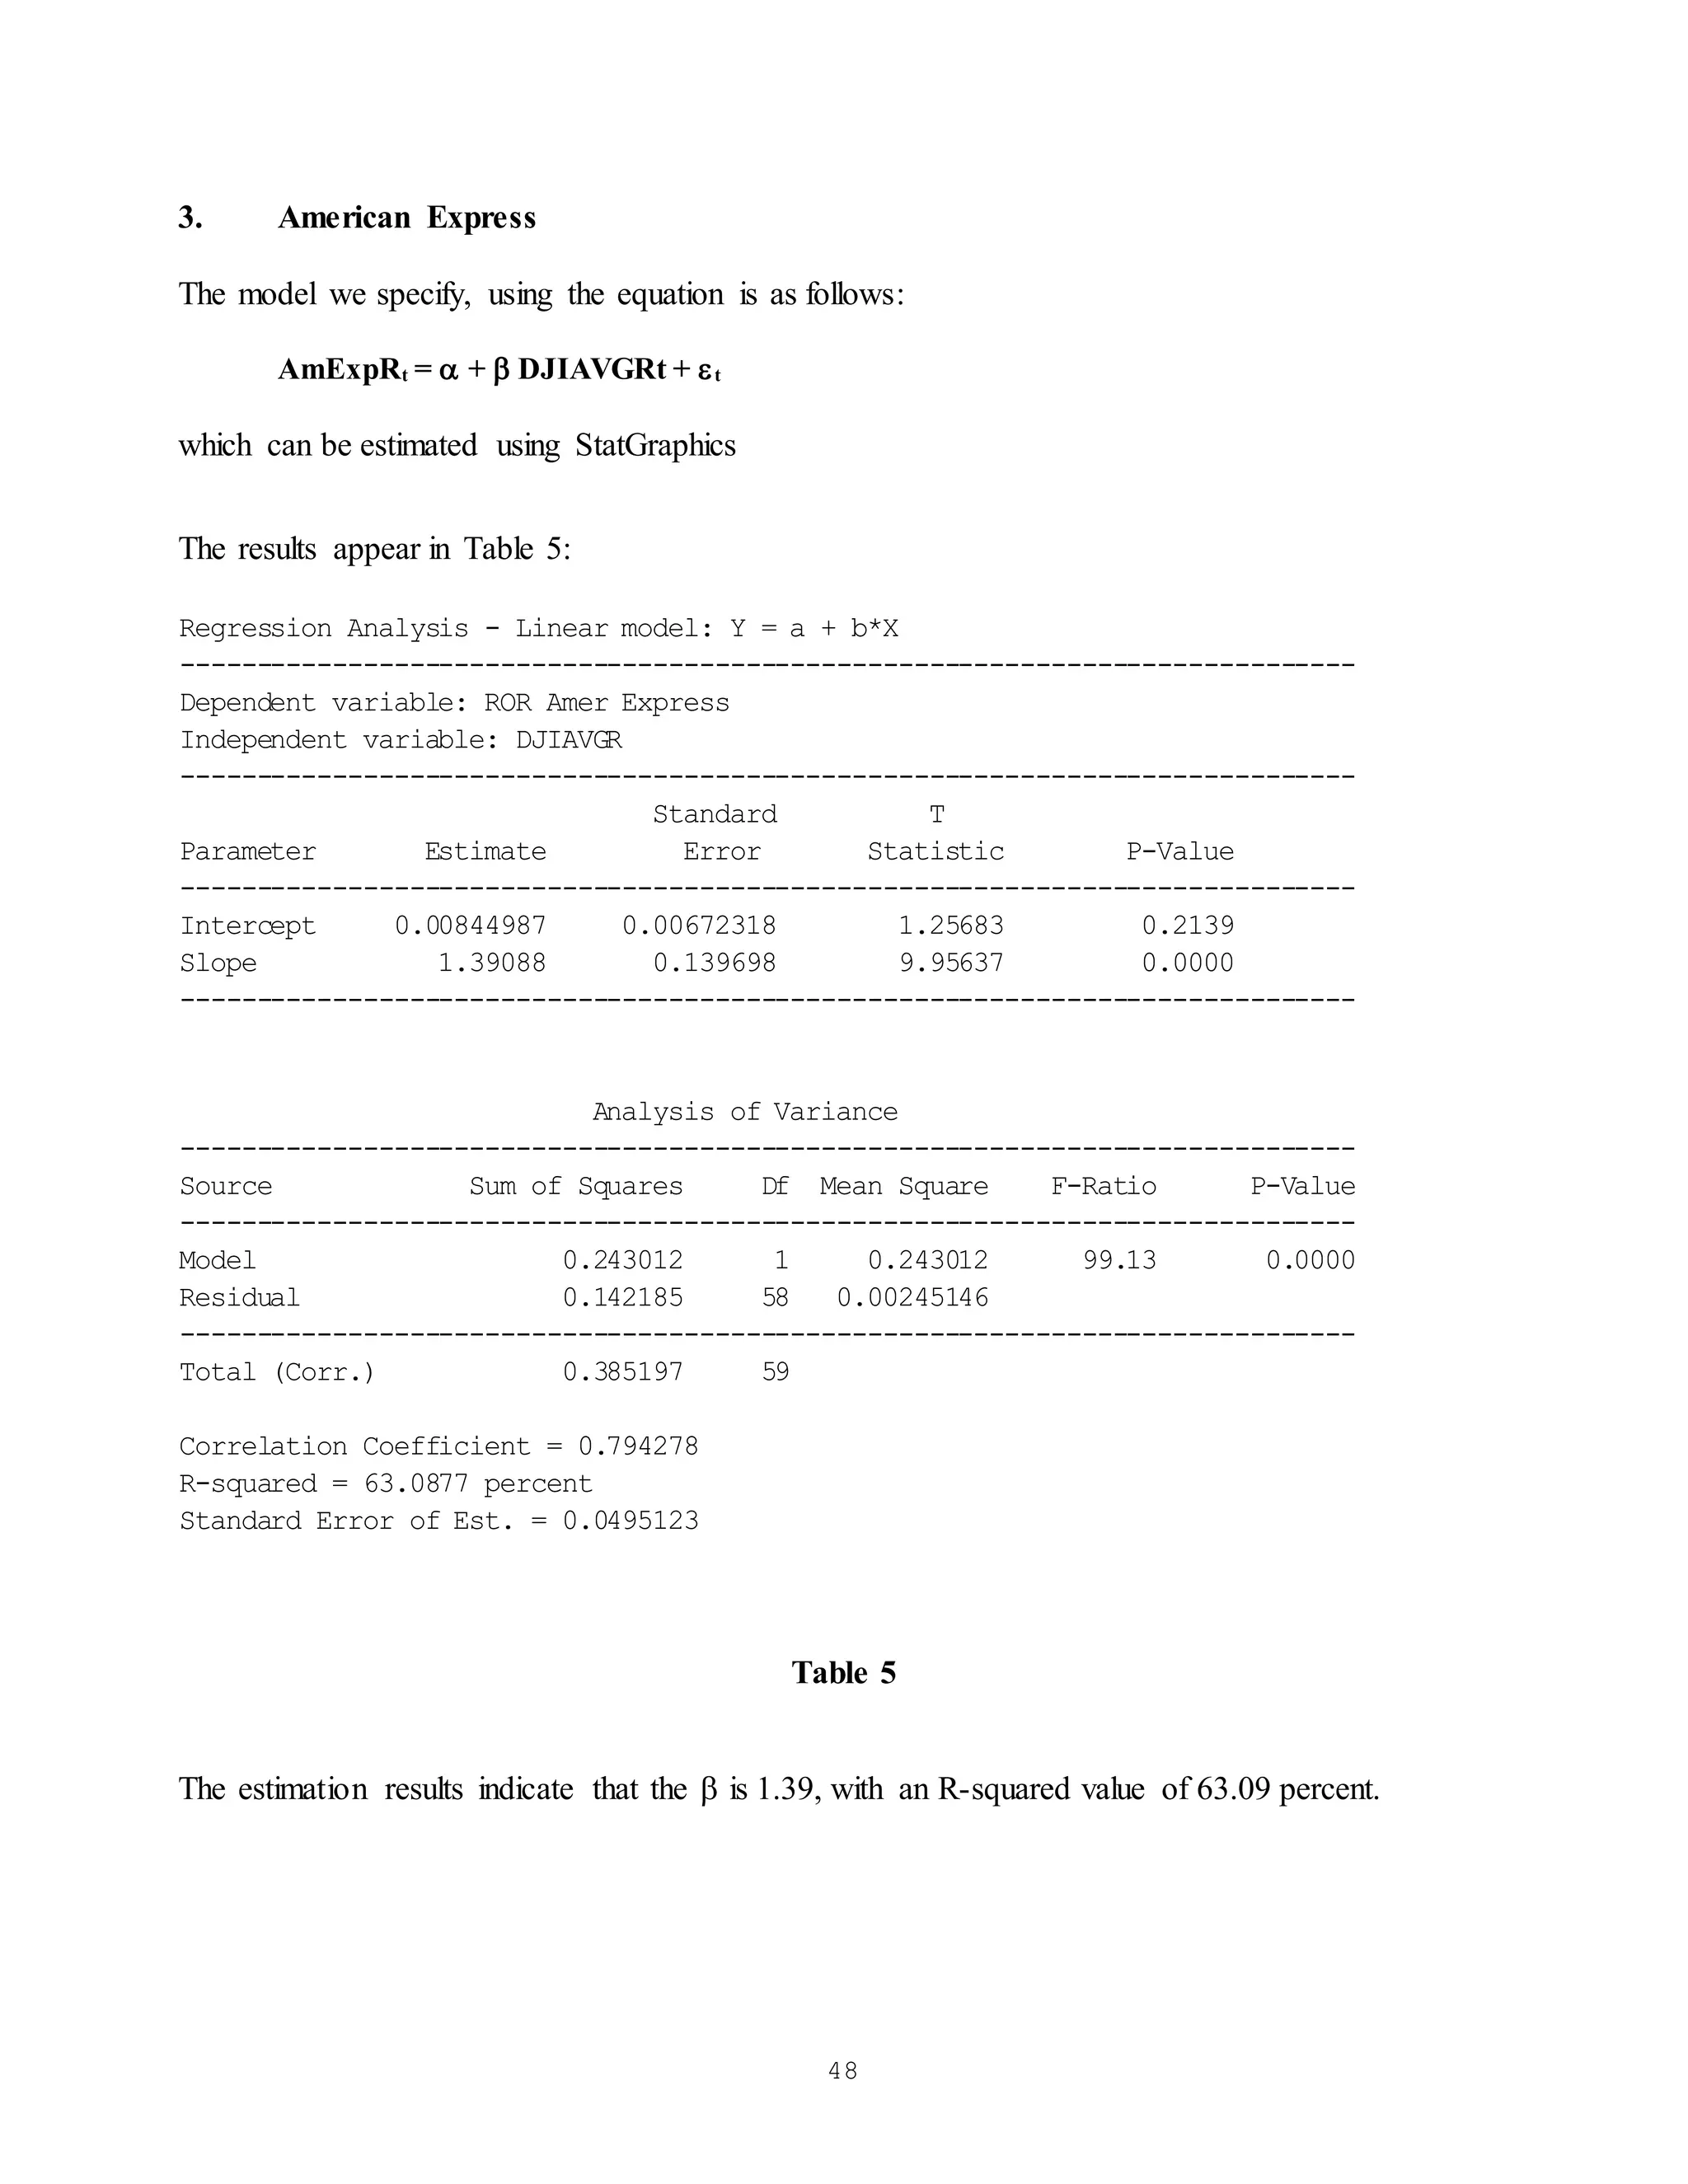
generated. The results from the estimation phase are shown in Table 7.](https://image.slidesharecdn.com/notes-partii-211004051244/75/Notes-part-ii-15-2048.jpg)
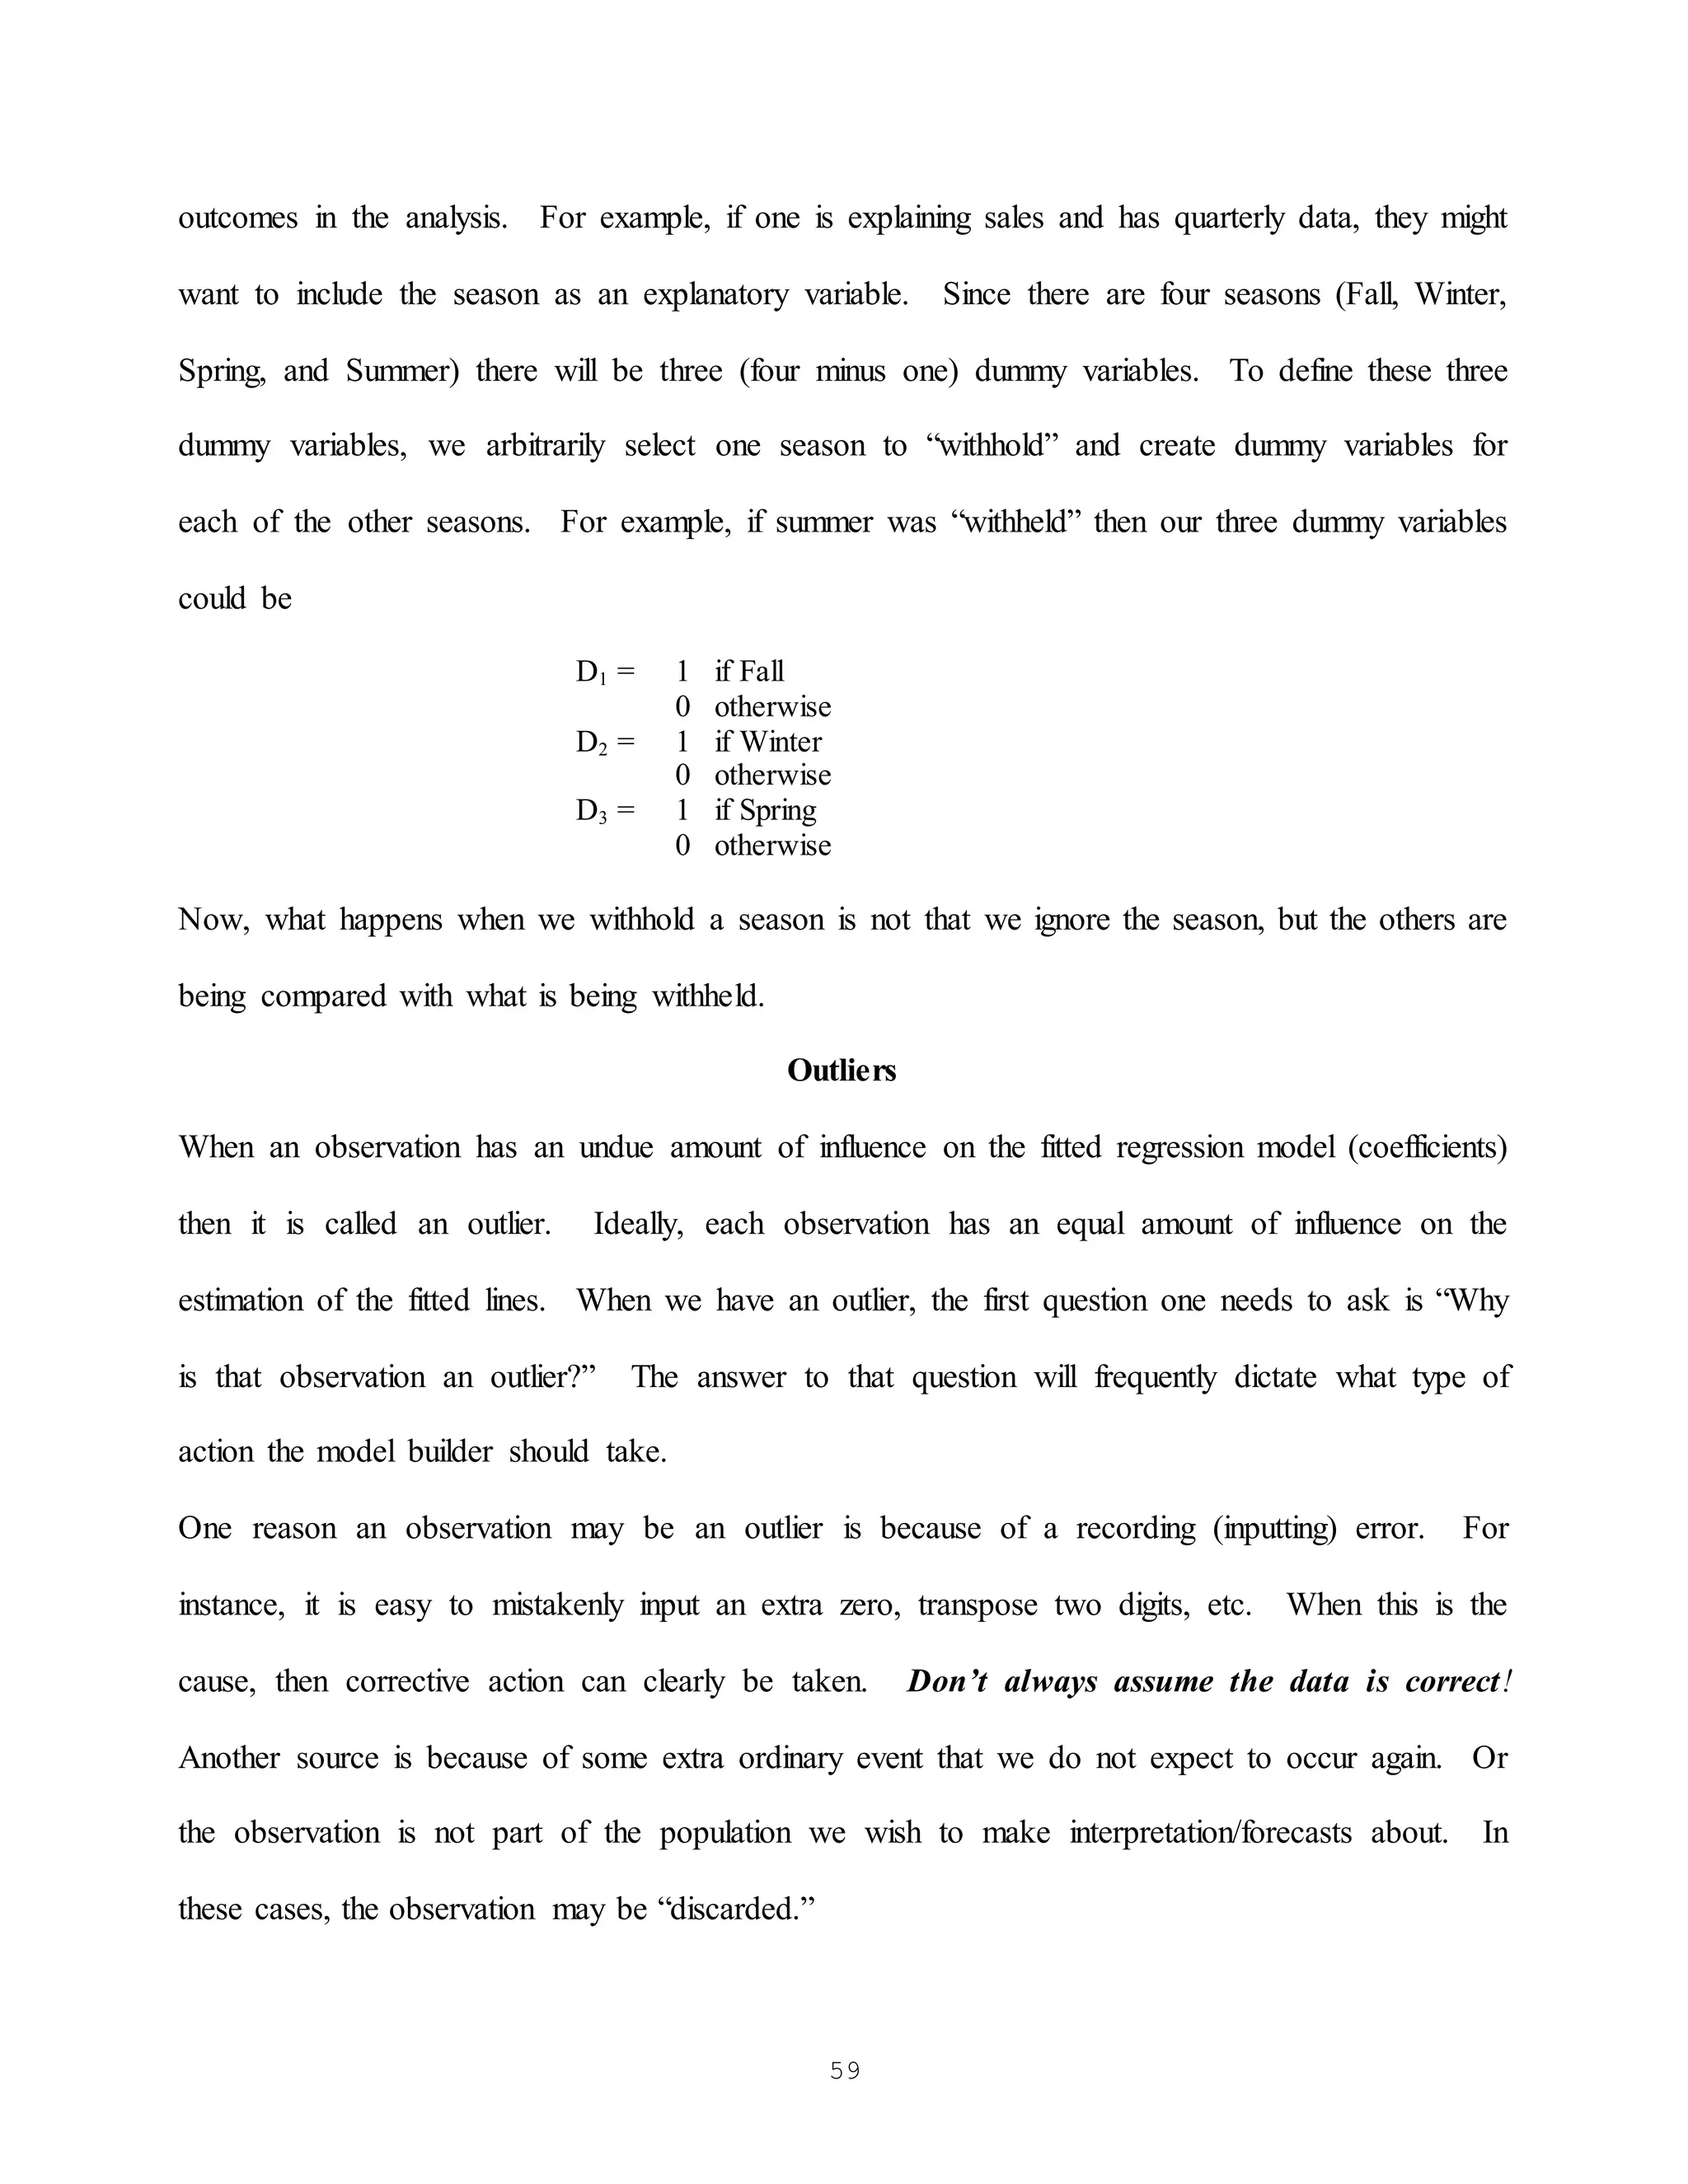
![51
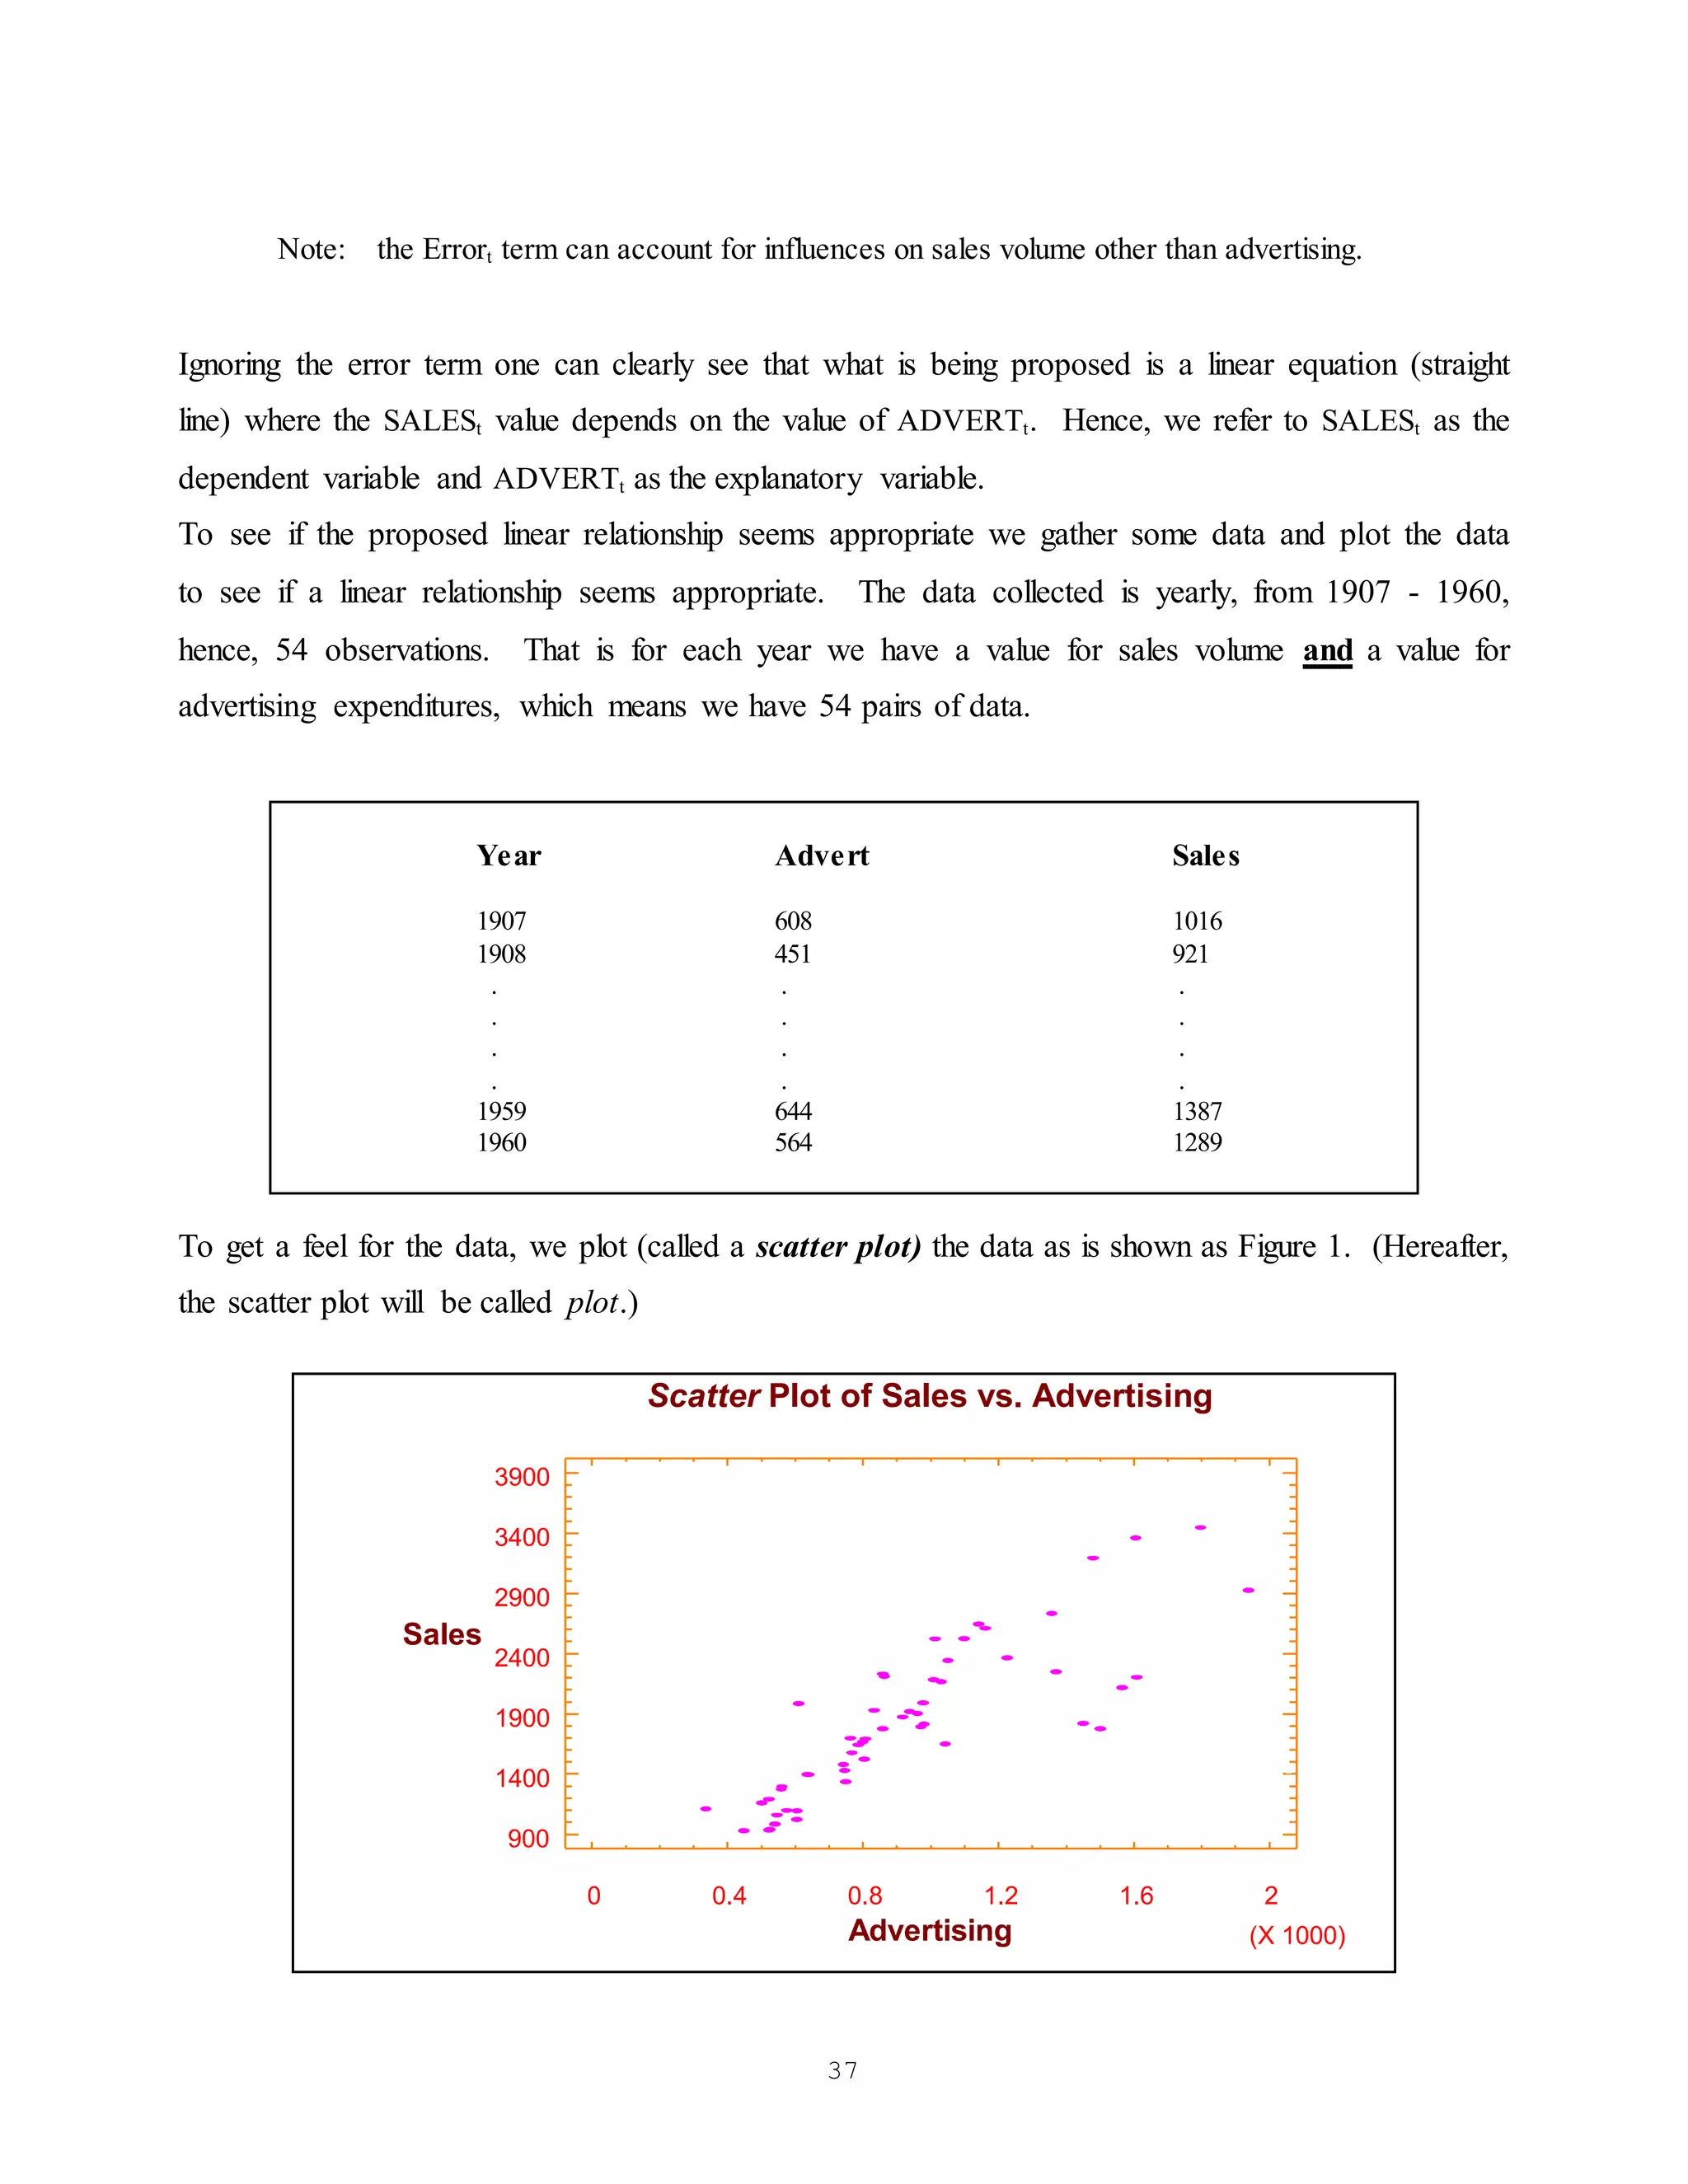
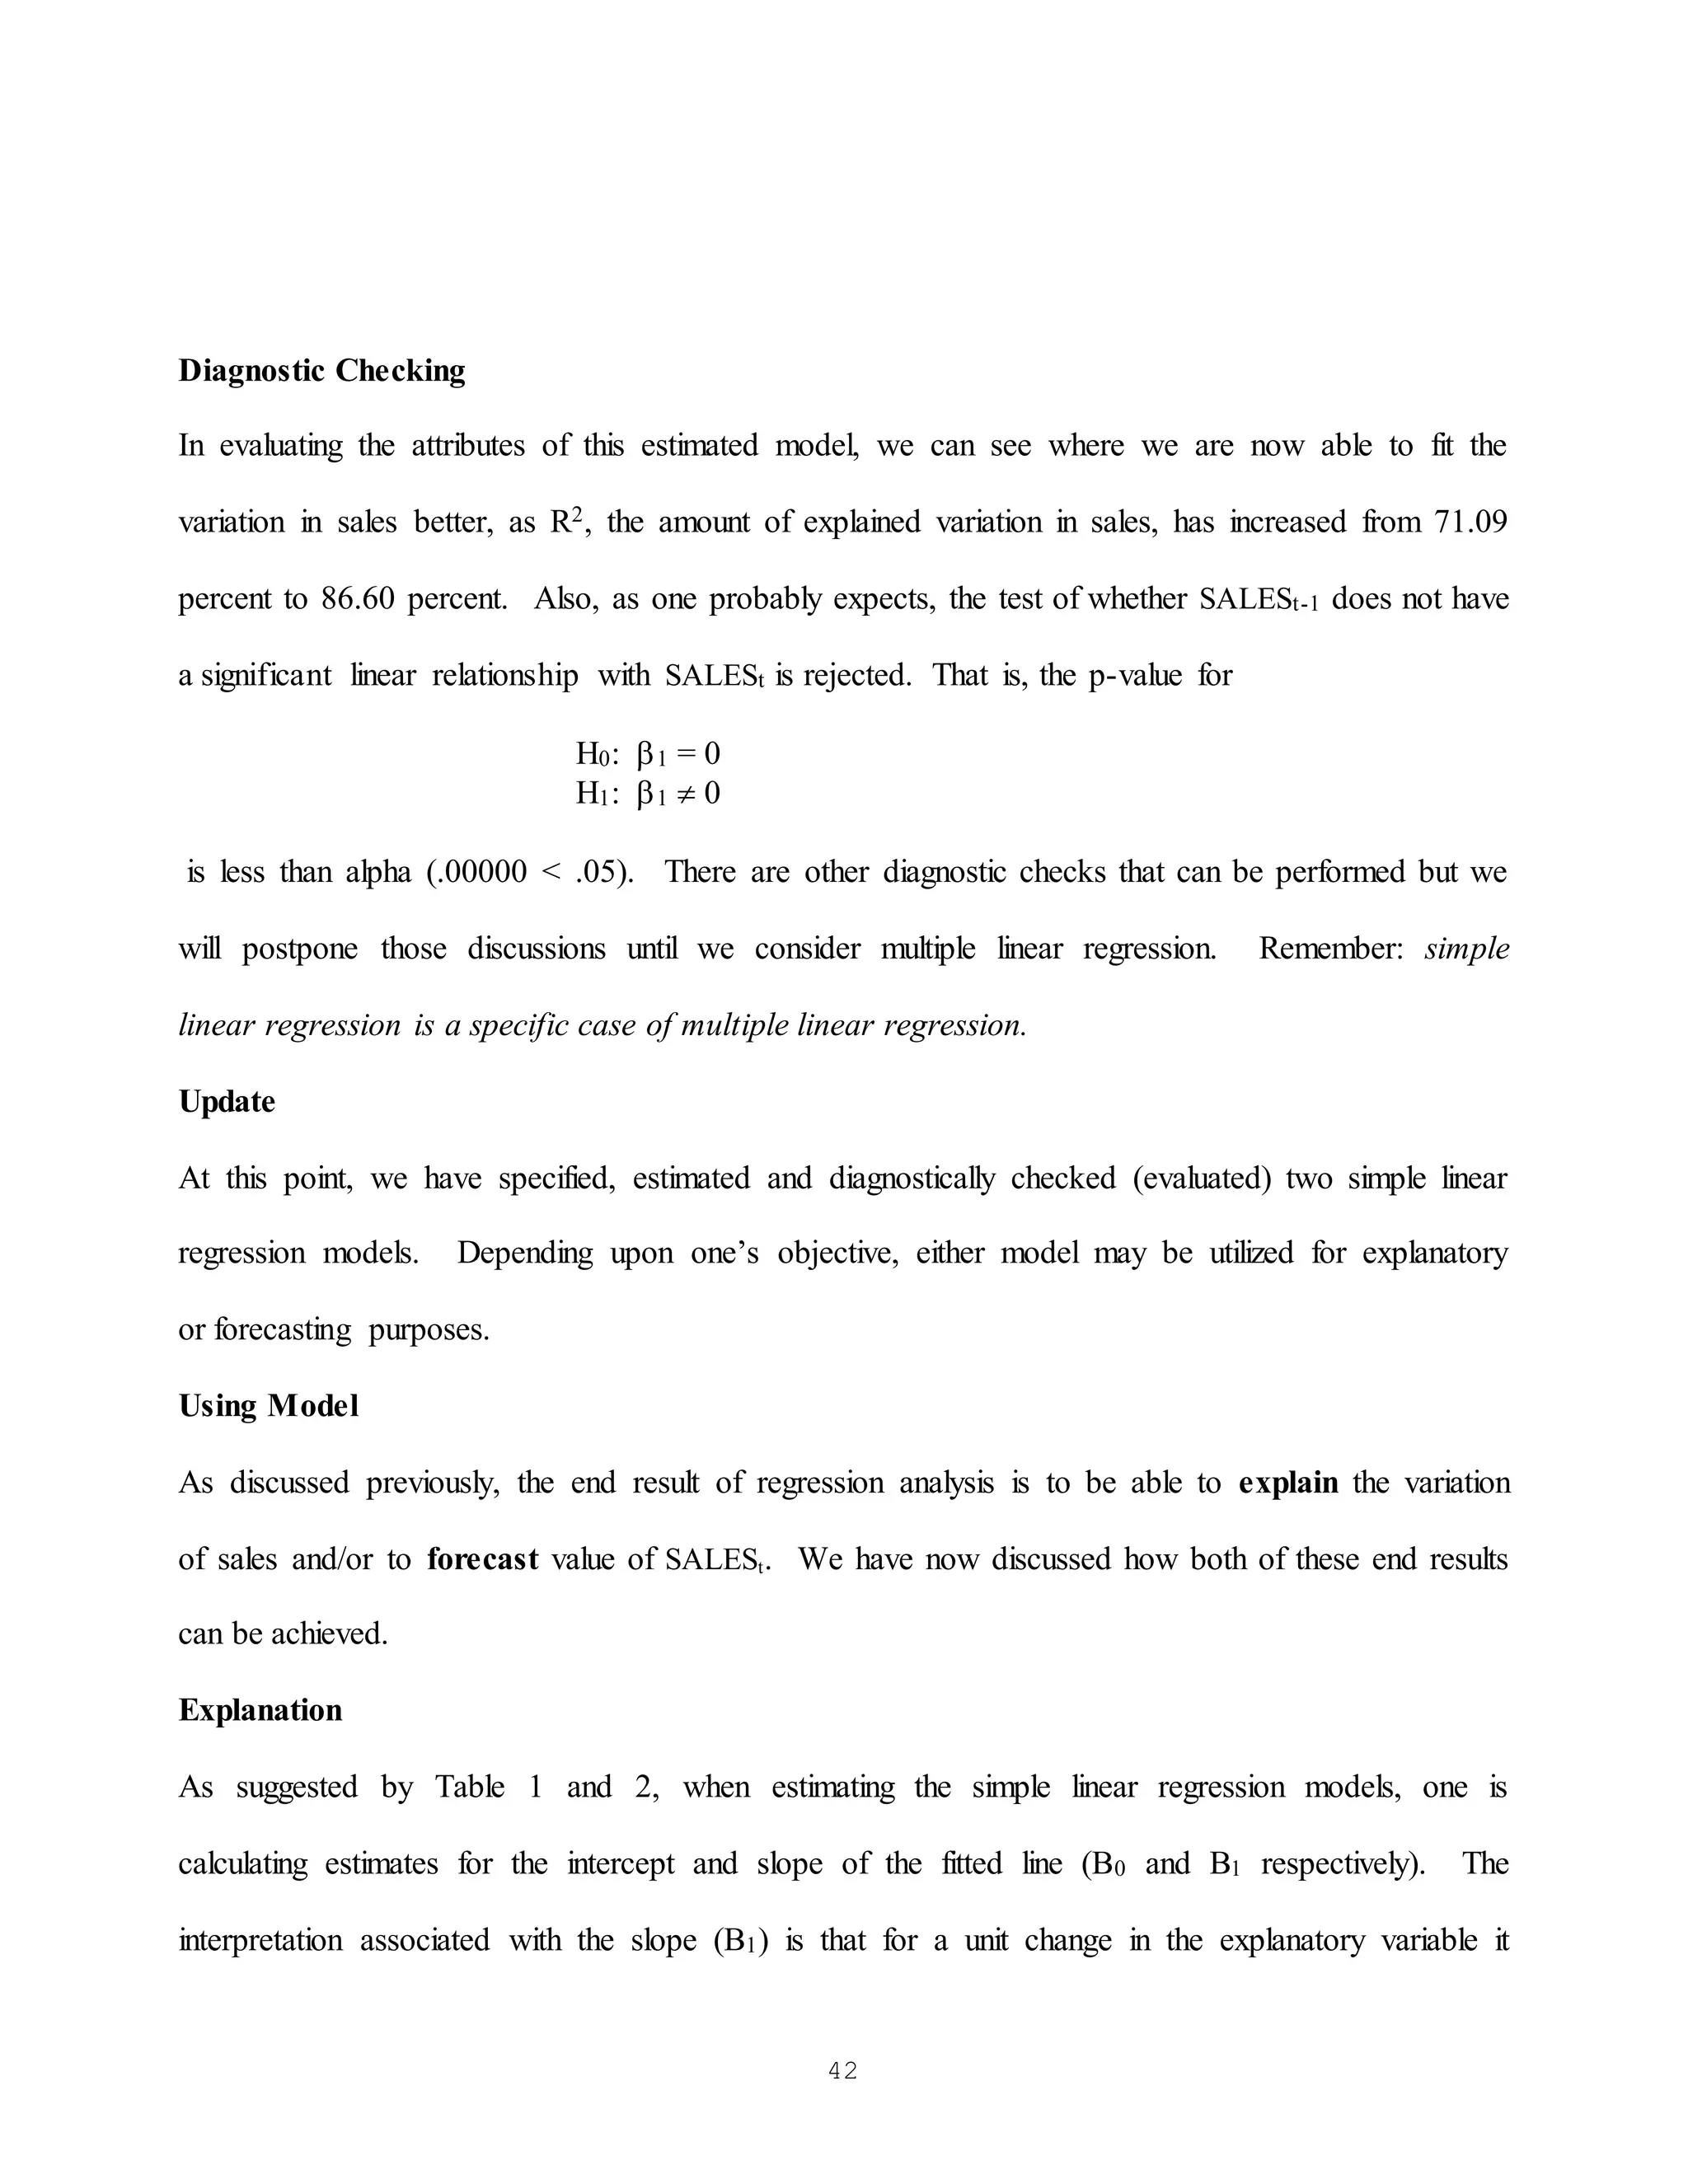
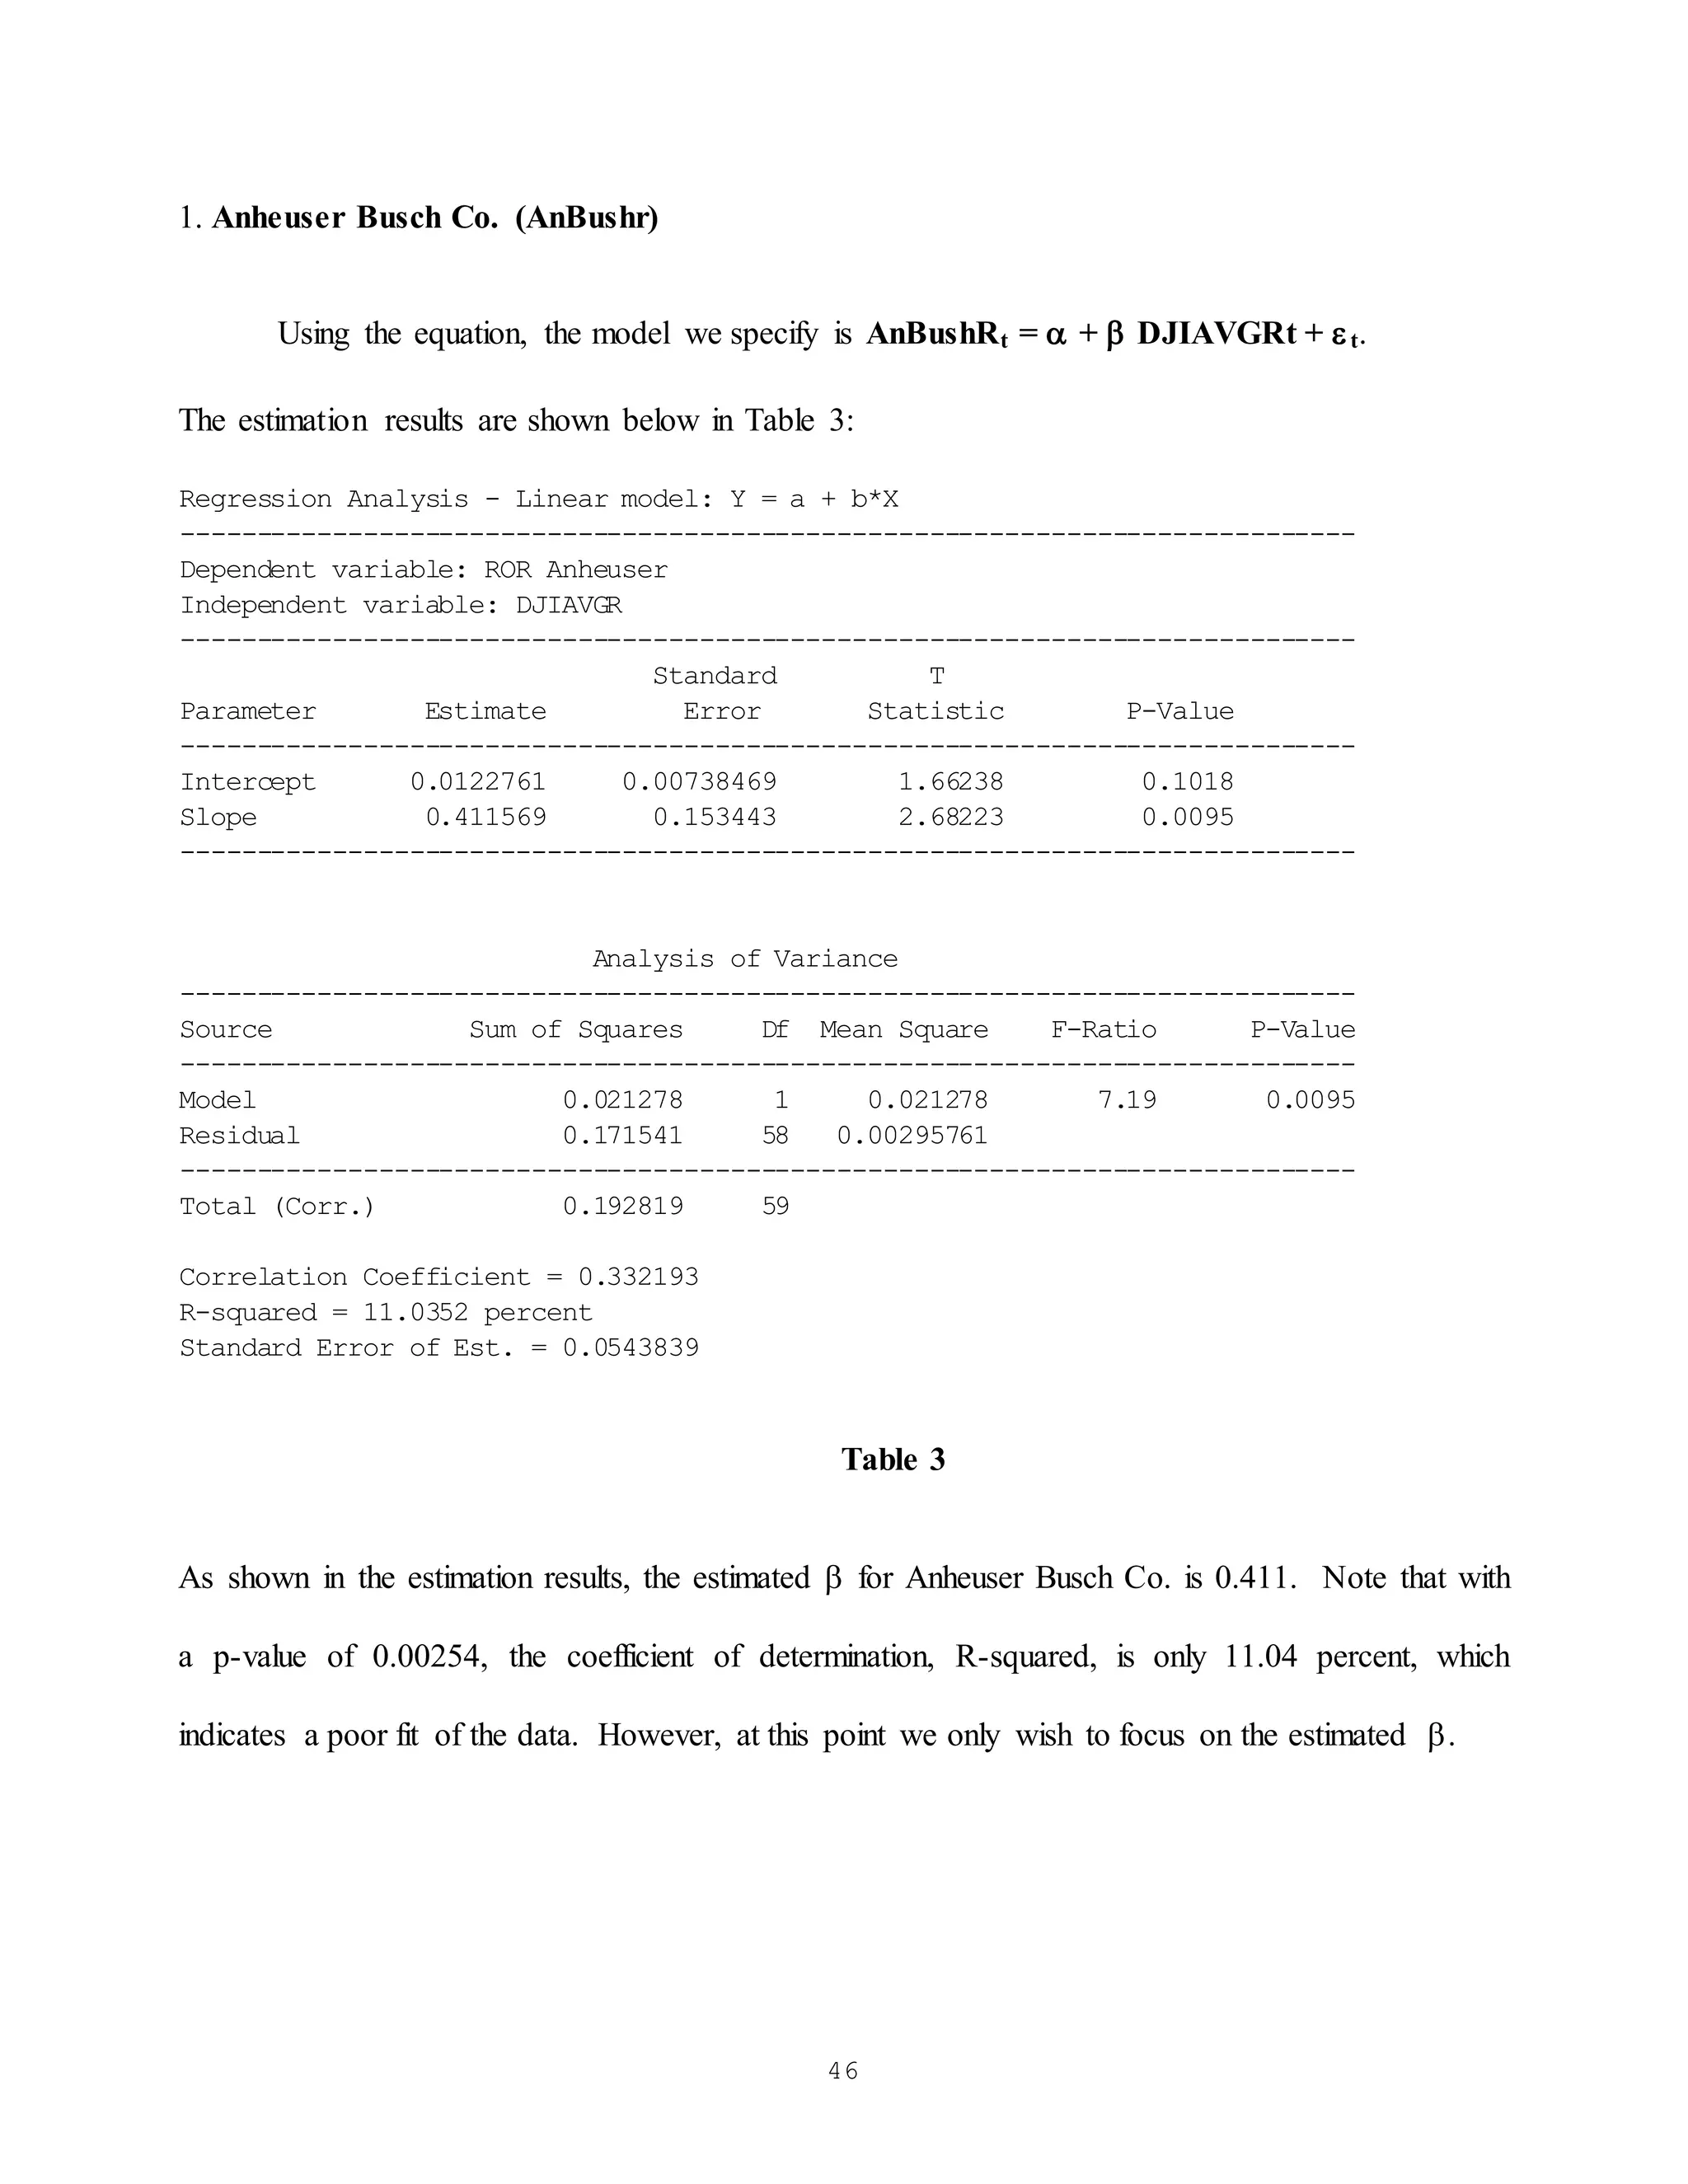
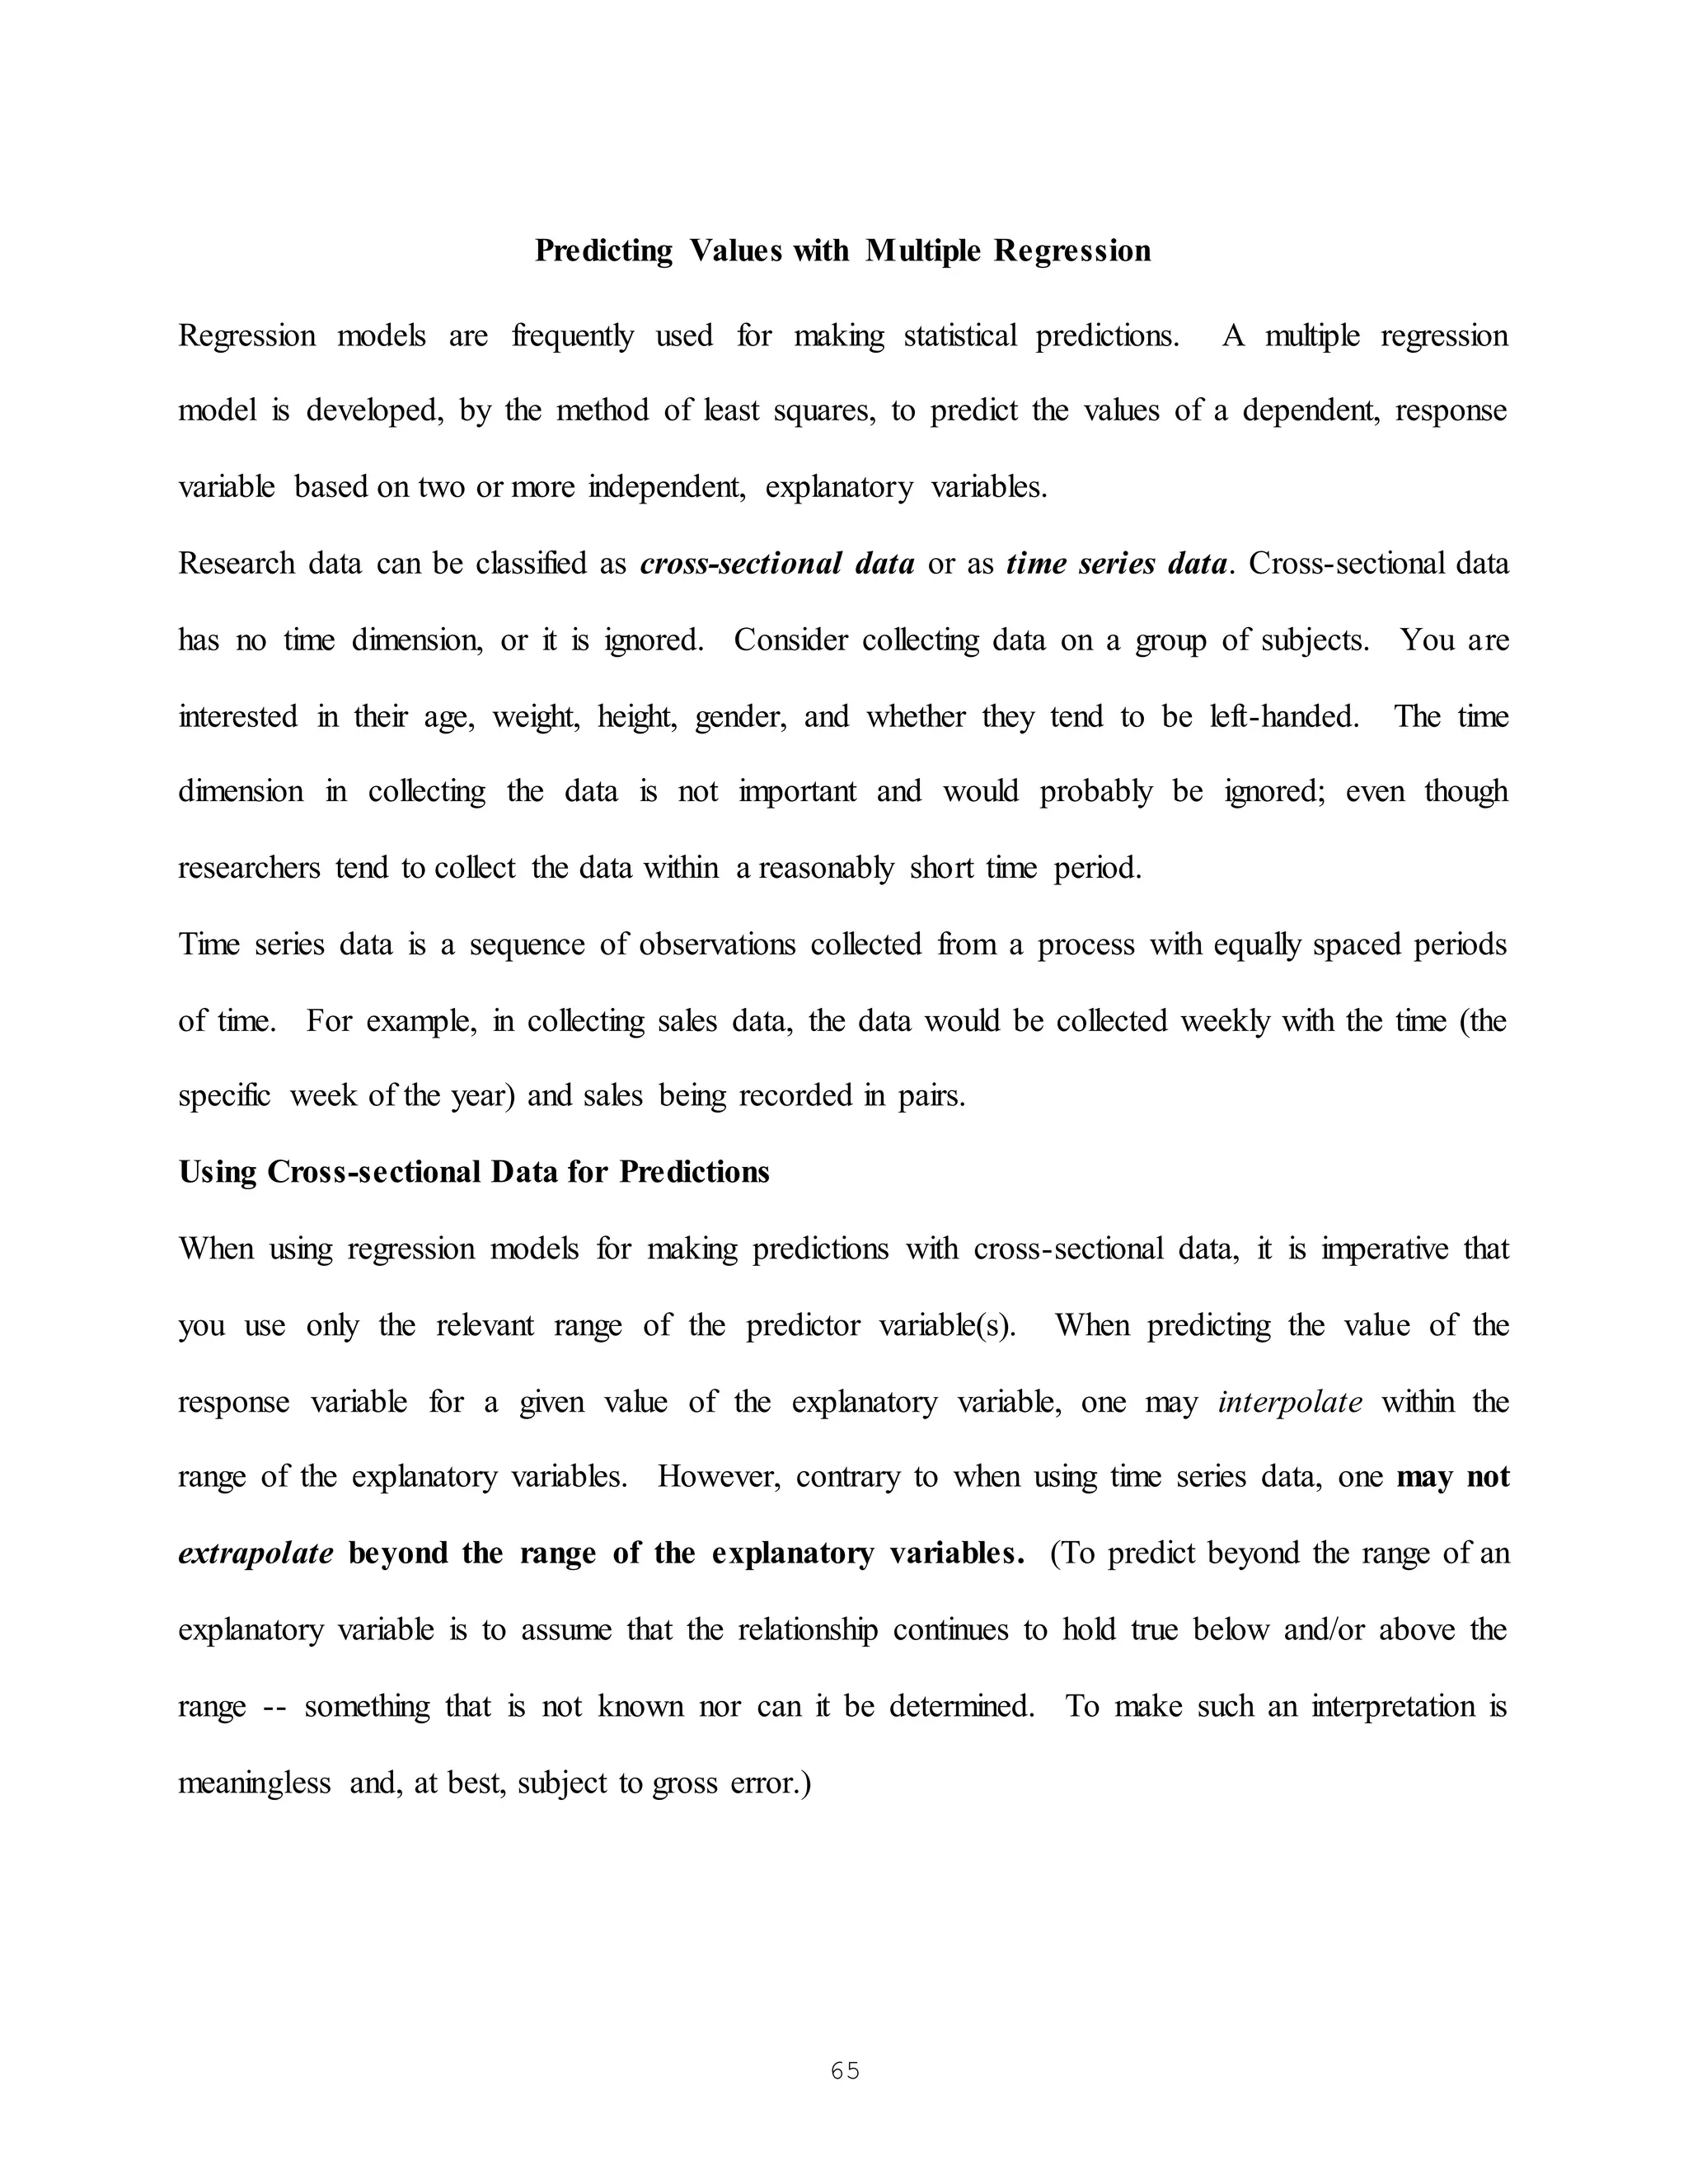
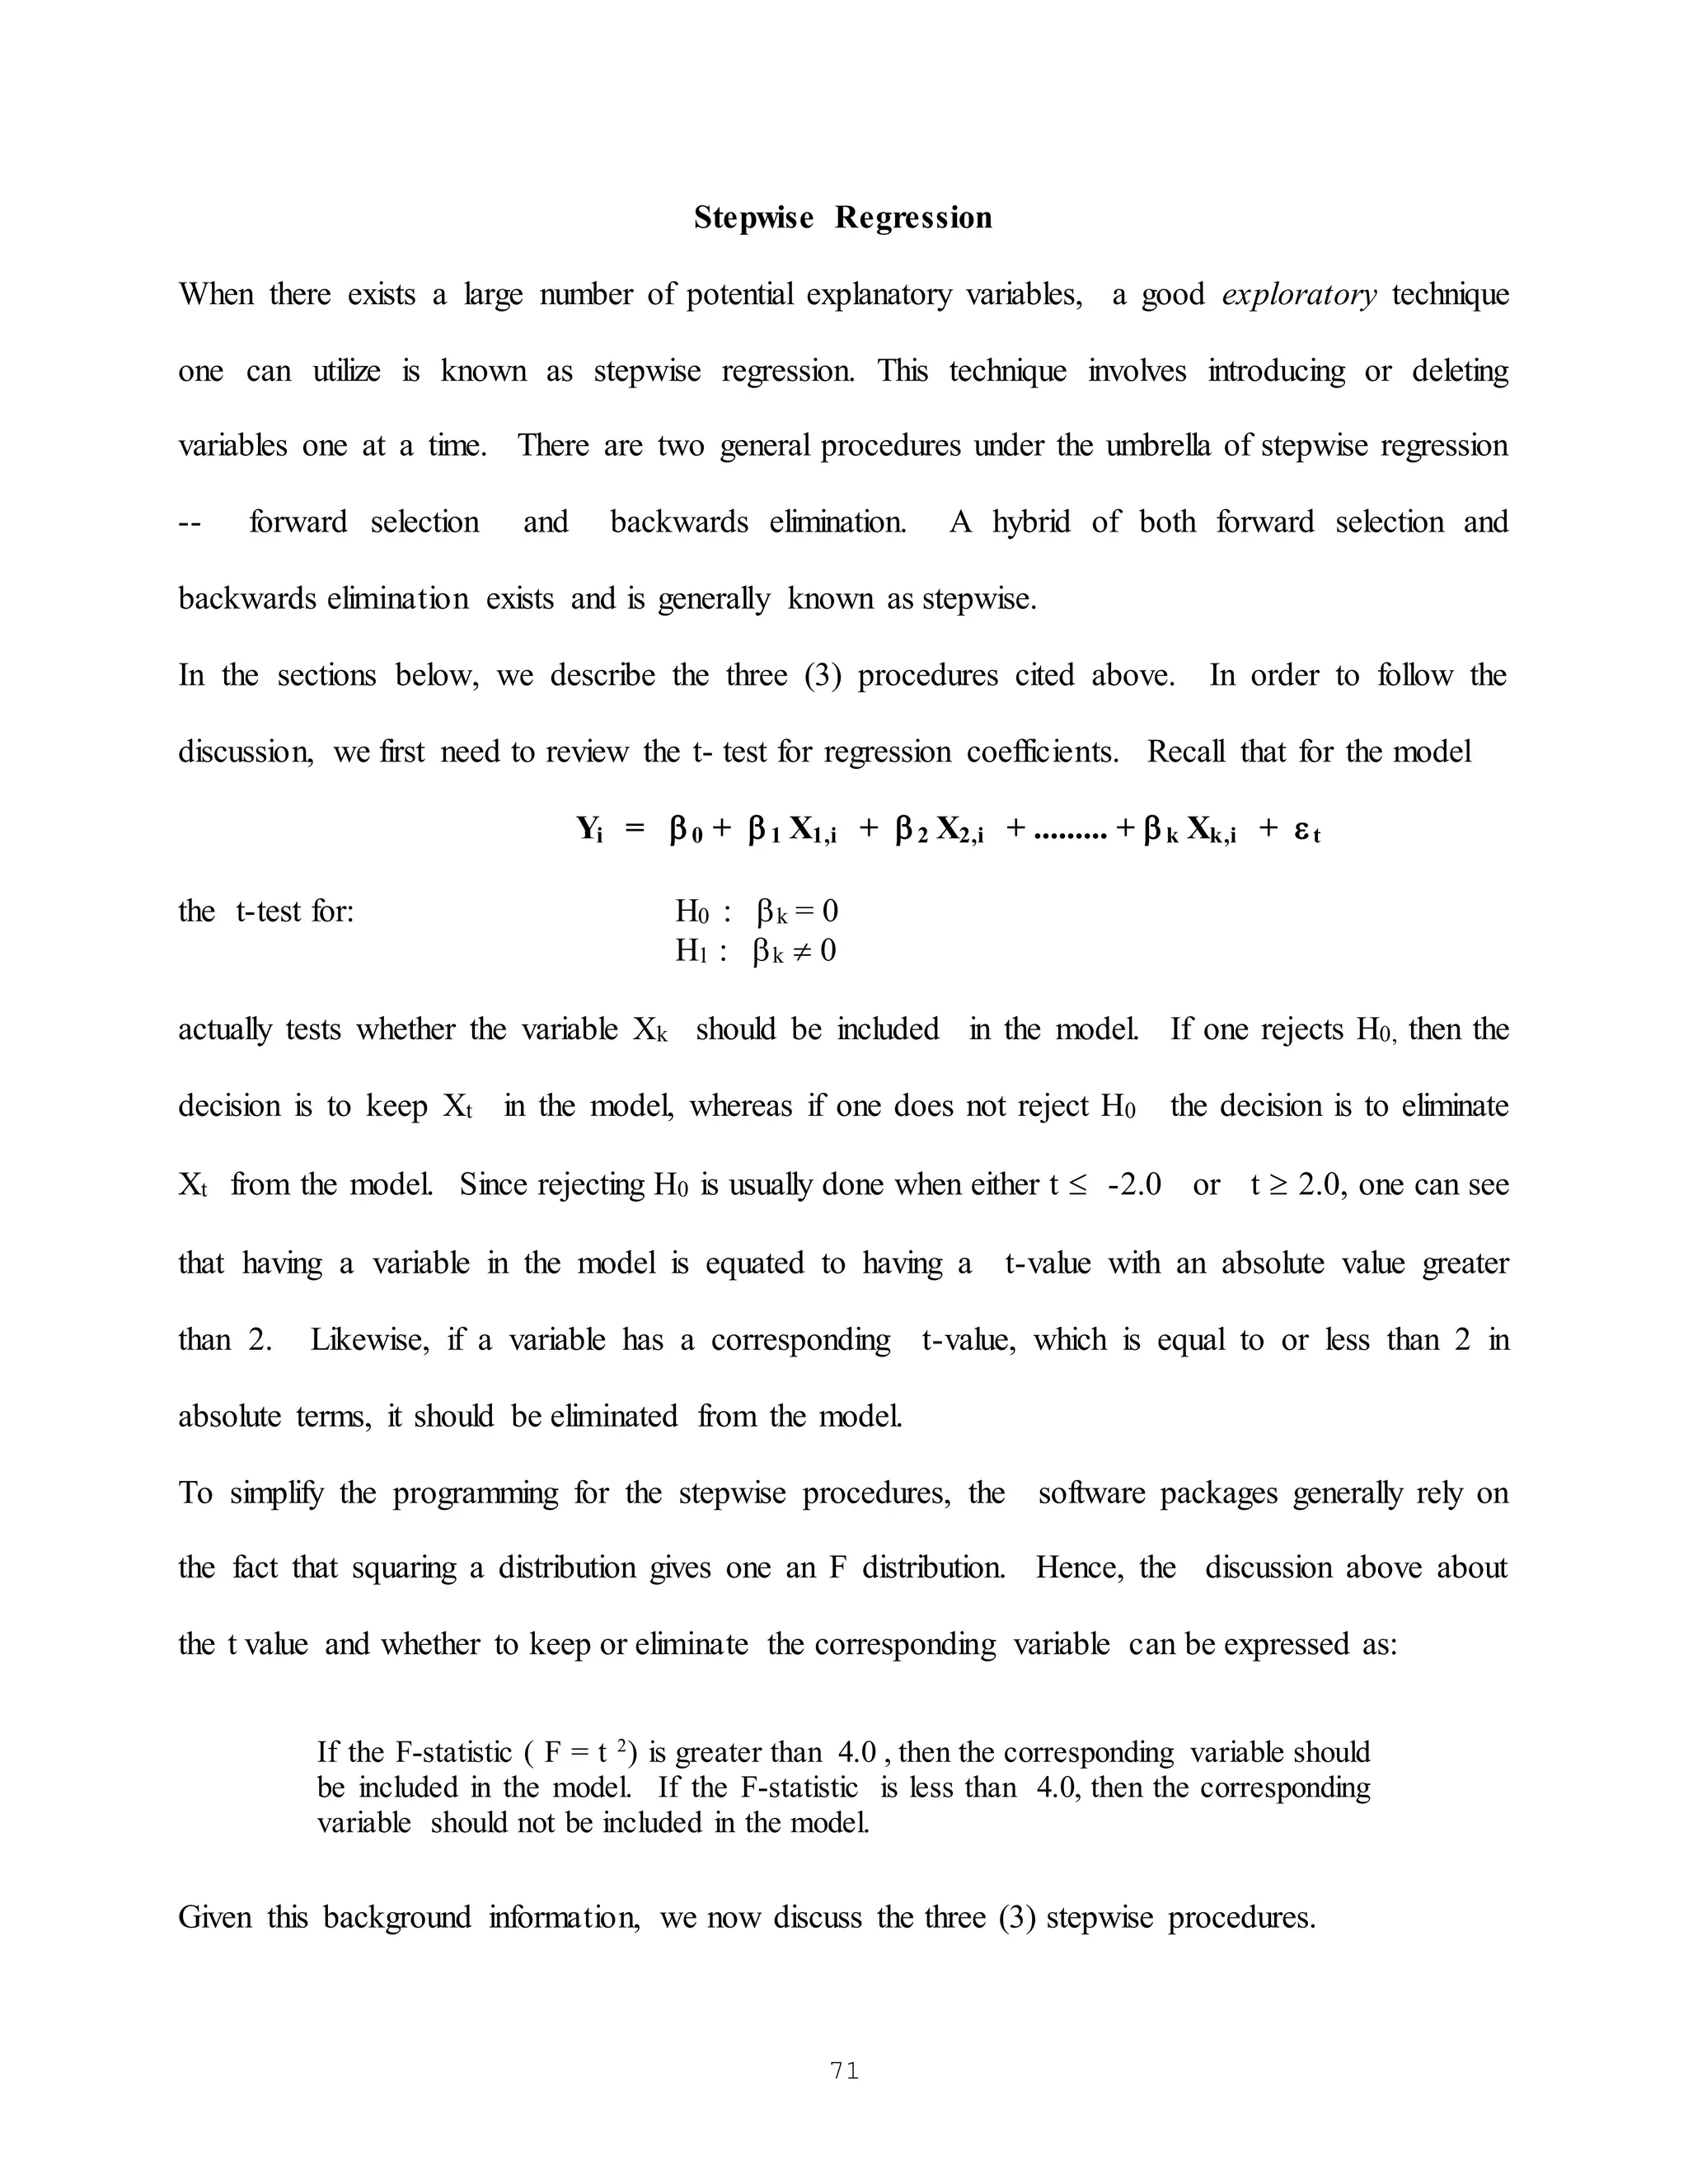
Table 7
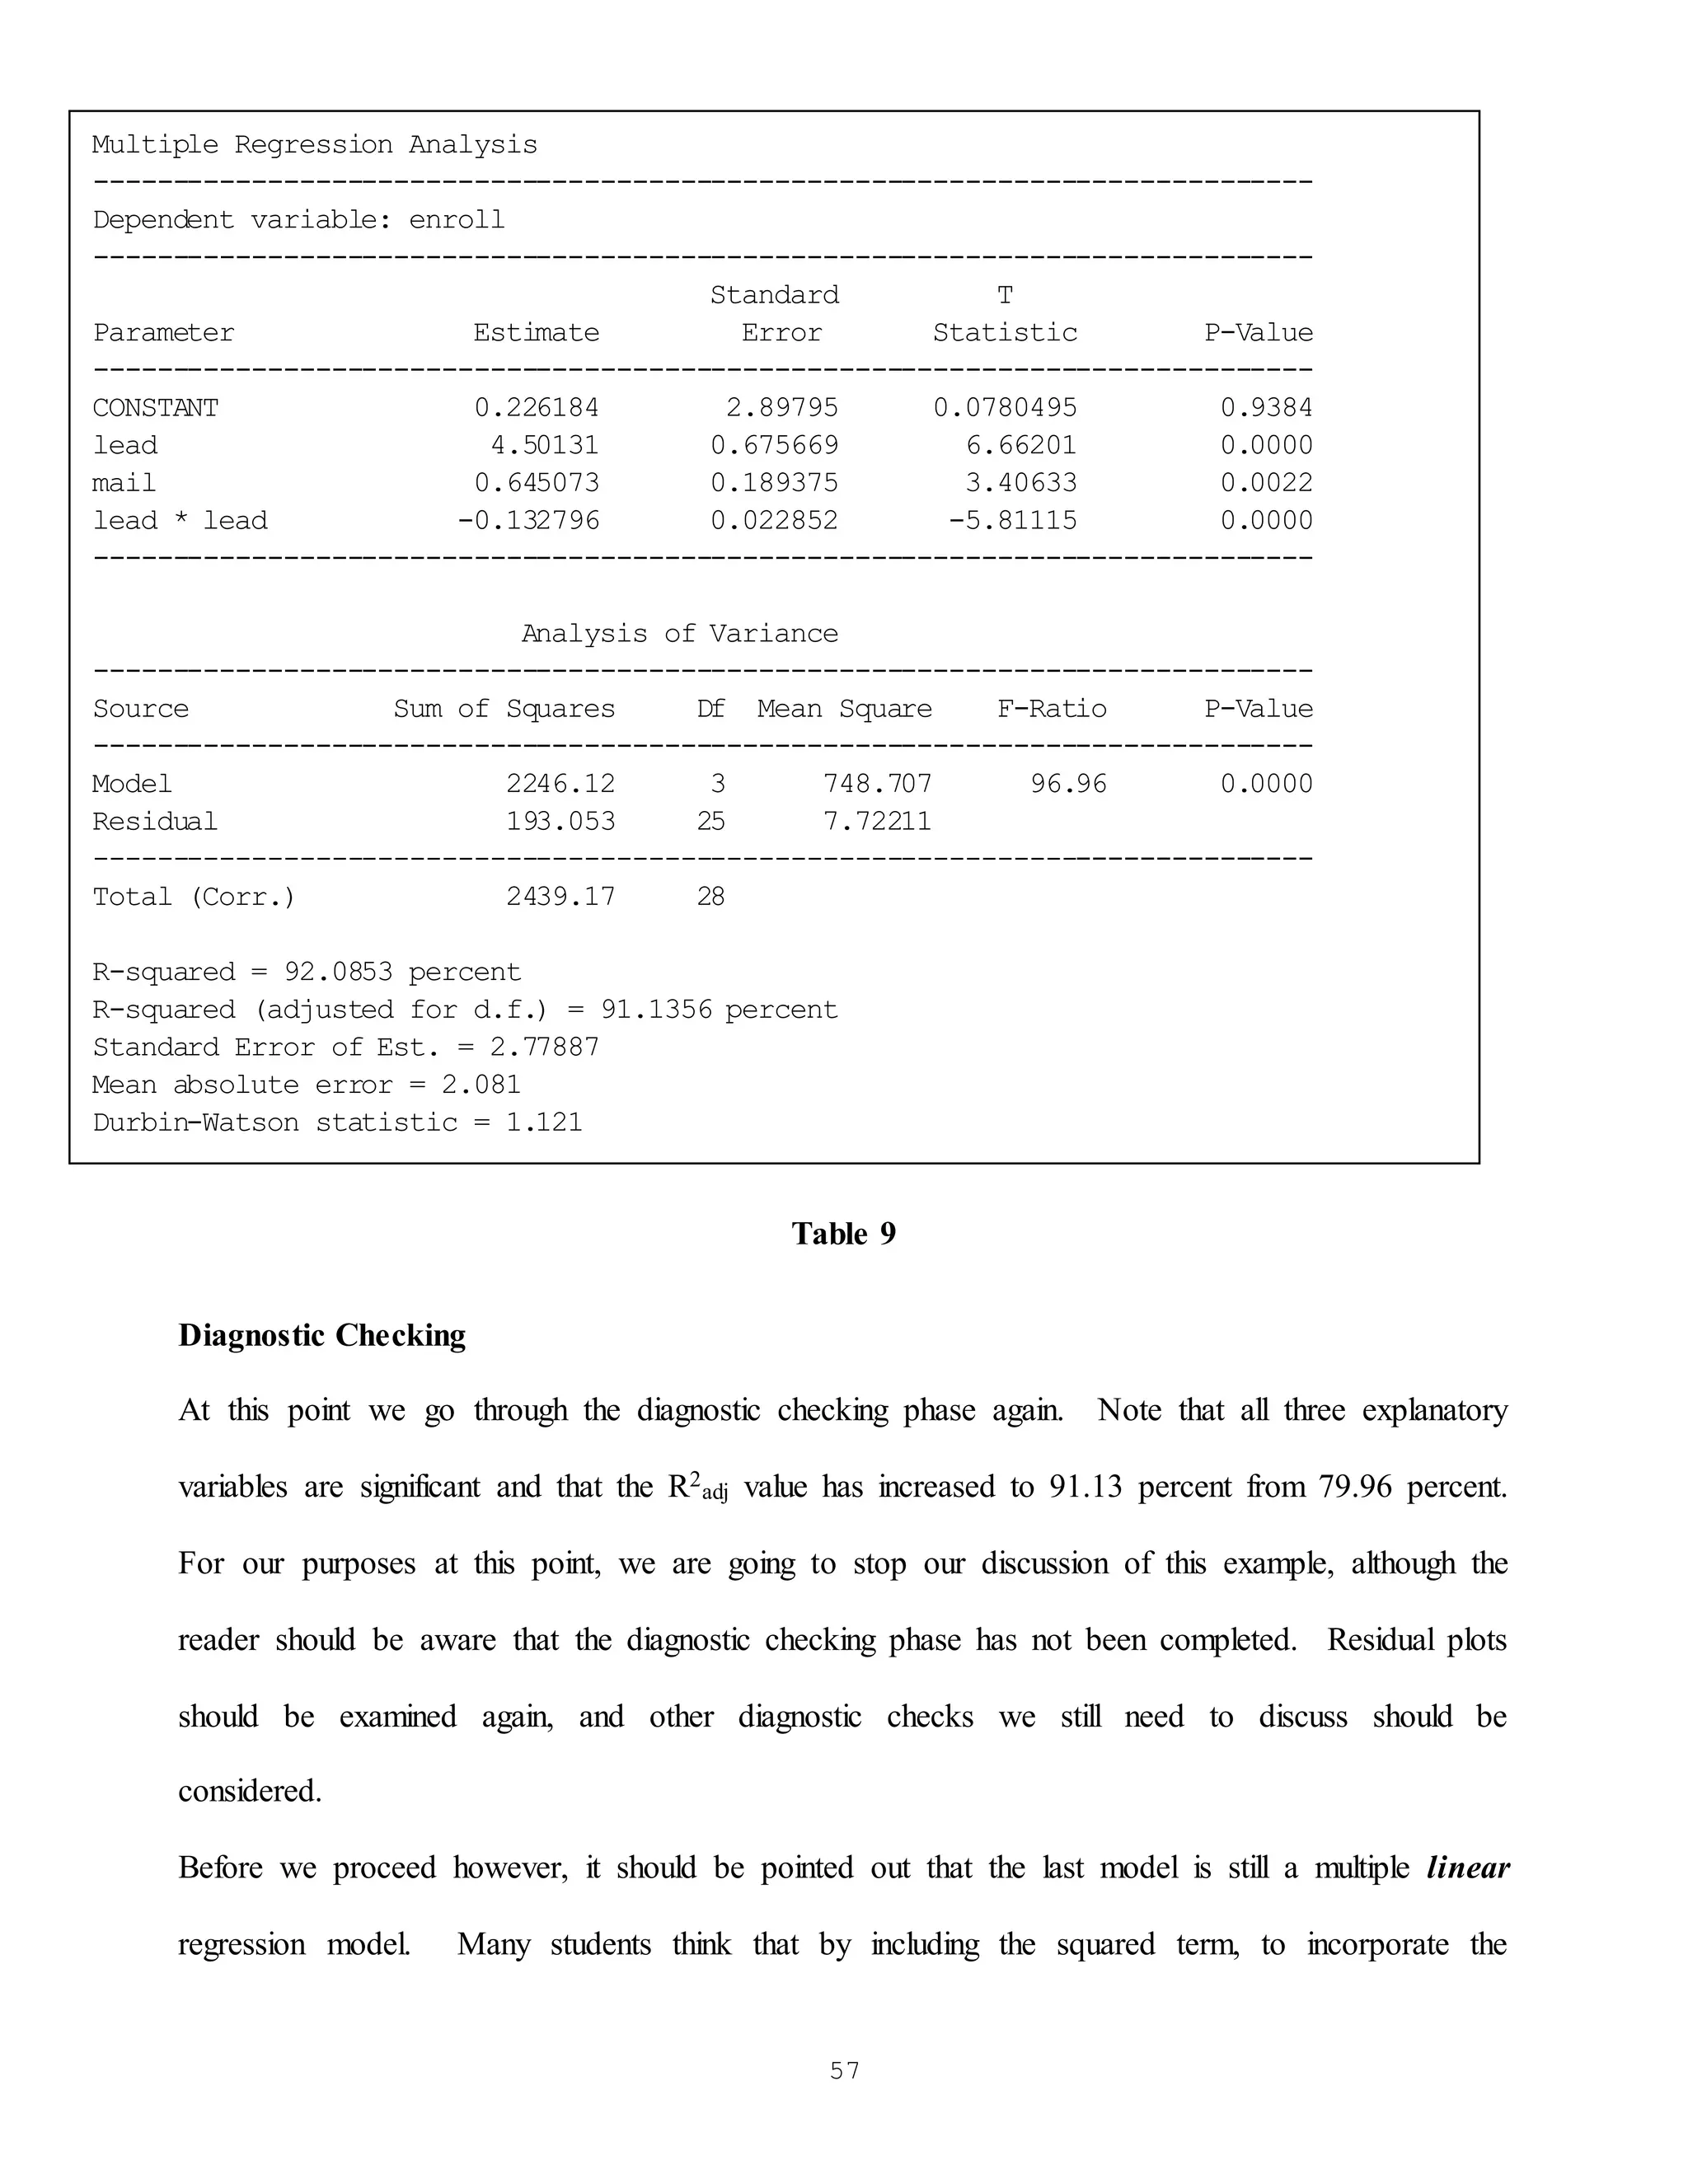
Diagnostic Checking
We still utilize the diagnostic checks we discussed for simple linear regression. We are now going
to expand that list and include additional diagnostic checks, some require more than one
explanatory variable but most also pertain to simple linear regression. We waited to introduce some
of the checks [that also pertain to simple linear regression] because we didn’t want to introduce too
much at one time and most of the corrective measures involve knowledge of multiple regression as
an alternative model.
The first diagnostic we consider involves focusing on whether any of the explanatory variables
should be removed from the model. To make these decision(s) we test whether the coefficient
associated with each variable is significantly different from zero, i.e. for the ith explanatory variable:
H0: i = 0
H1: i 0
Multiple Regression Analysis
-----------------------------------------------------------------------------
Dependent variable: sales
-----------------------------------------------------------------------------
Standard T
Parameter Estimate Error Statistic P-Value
-----------------------------------------------------------------------------
CONSTANT 138.691 95.6602 1.44982 0.1534
lag(sales,1) 0.759307 0.0914561 8.30242 0.0000
advert 0.328762 0.155672 2.11189 0.0397
-----------------------------------------------------------------------------
Analysis of Variance
-----------------------------------------------------------------------------
Source Sum of Squares Df Mean Square F-Ratio P-Value
-----------------------------------------------------------------------------
Model 1.80175E7 2 9.00875E6 178.23 0.0000
Residual 2.52722E6 50 50544.3
-----------------------------------------------------------------------------
Total (Corr.) 2.05447E7 52
R-squared = 87.699 percent
R-squared (adjusted for d.f.) = 87.2069 percent
Standard Error of Est. = 224.821
Mean absolute error = 173.307
Durbin-Watson statistic = 0.916542](https://image.slidesharecdn.com/notes-partii-211004051244/75/Notes-part-ii-16-2048.jpg)
![60
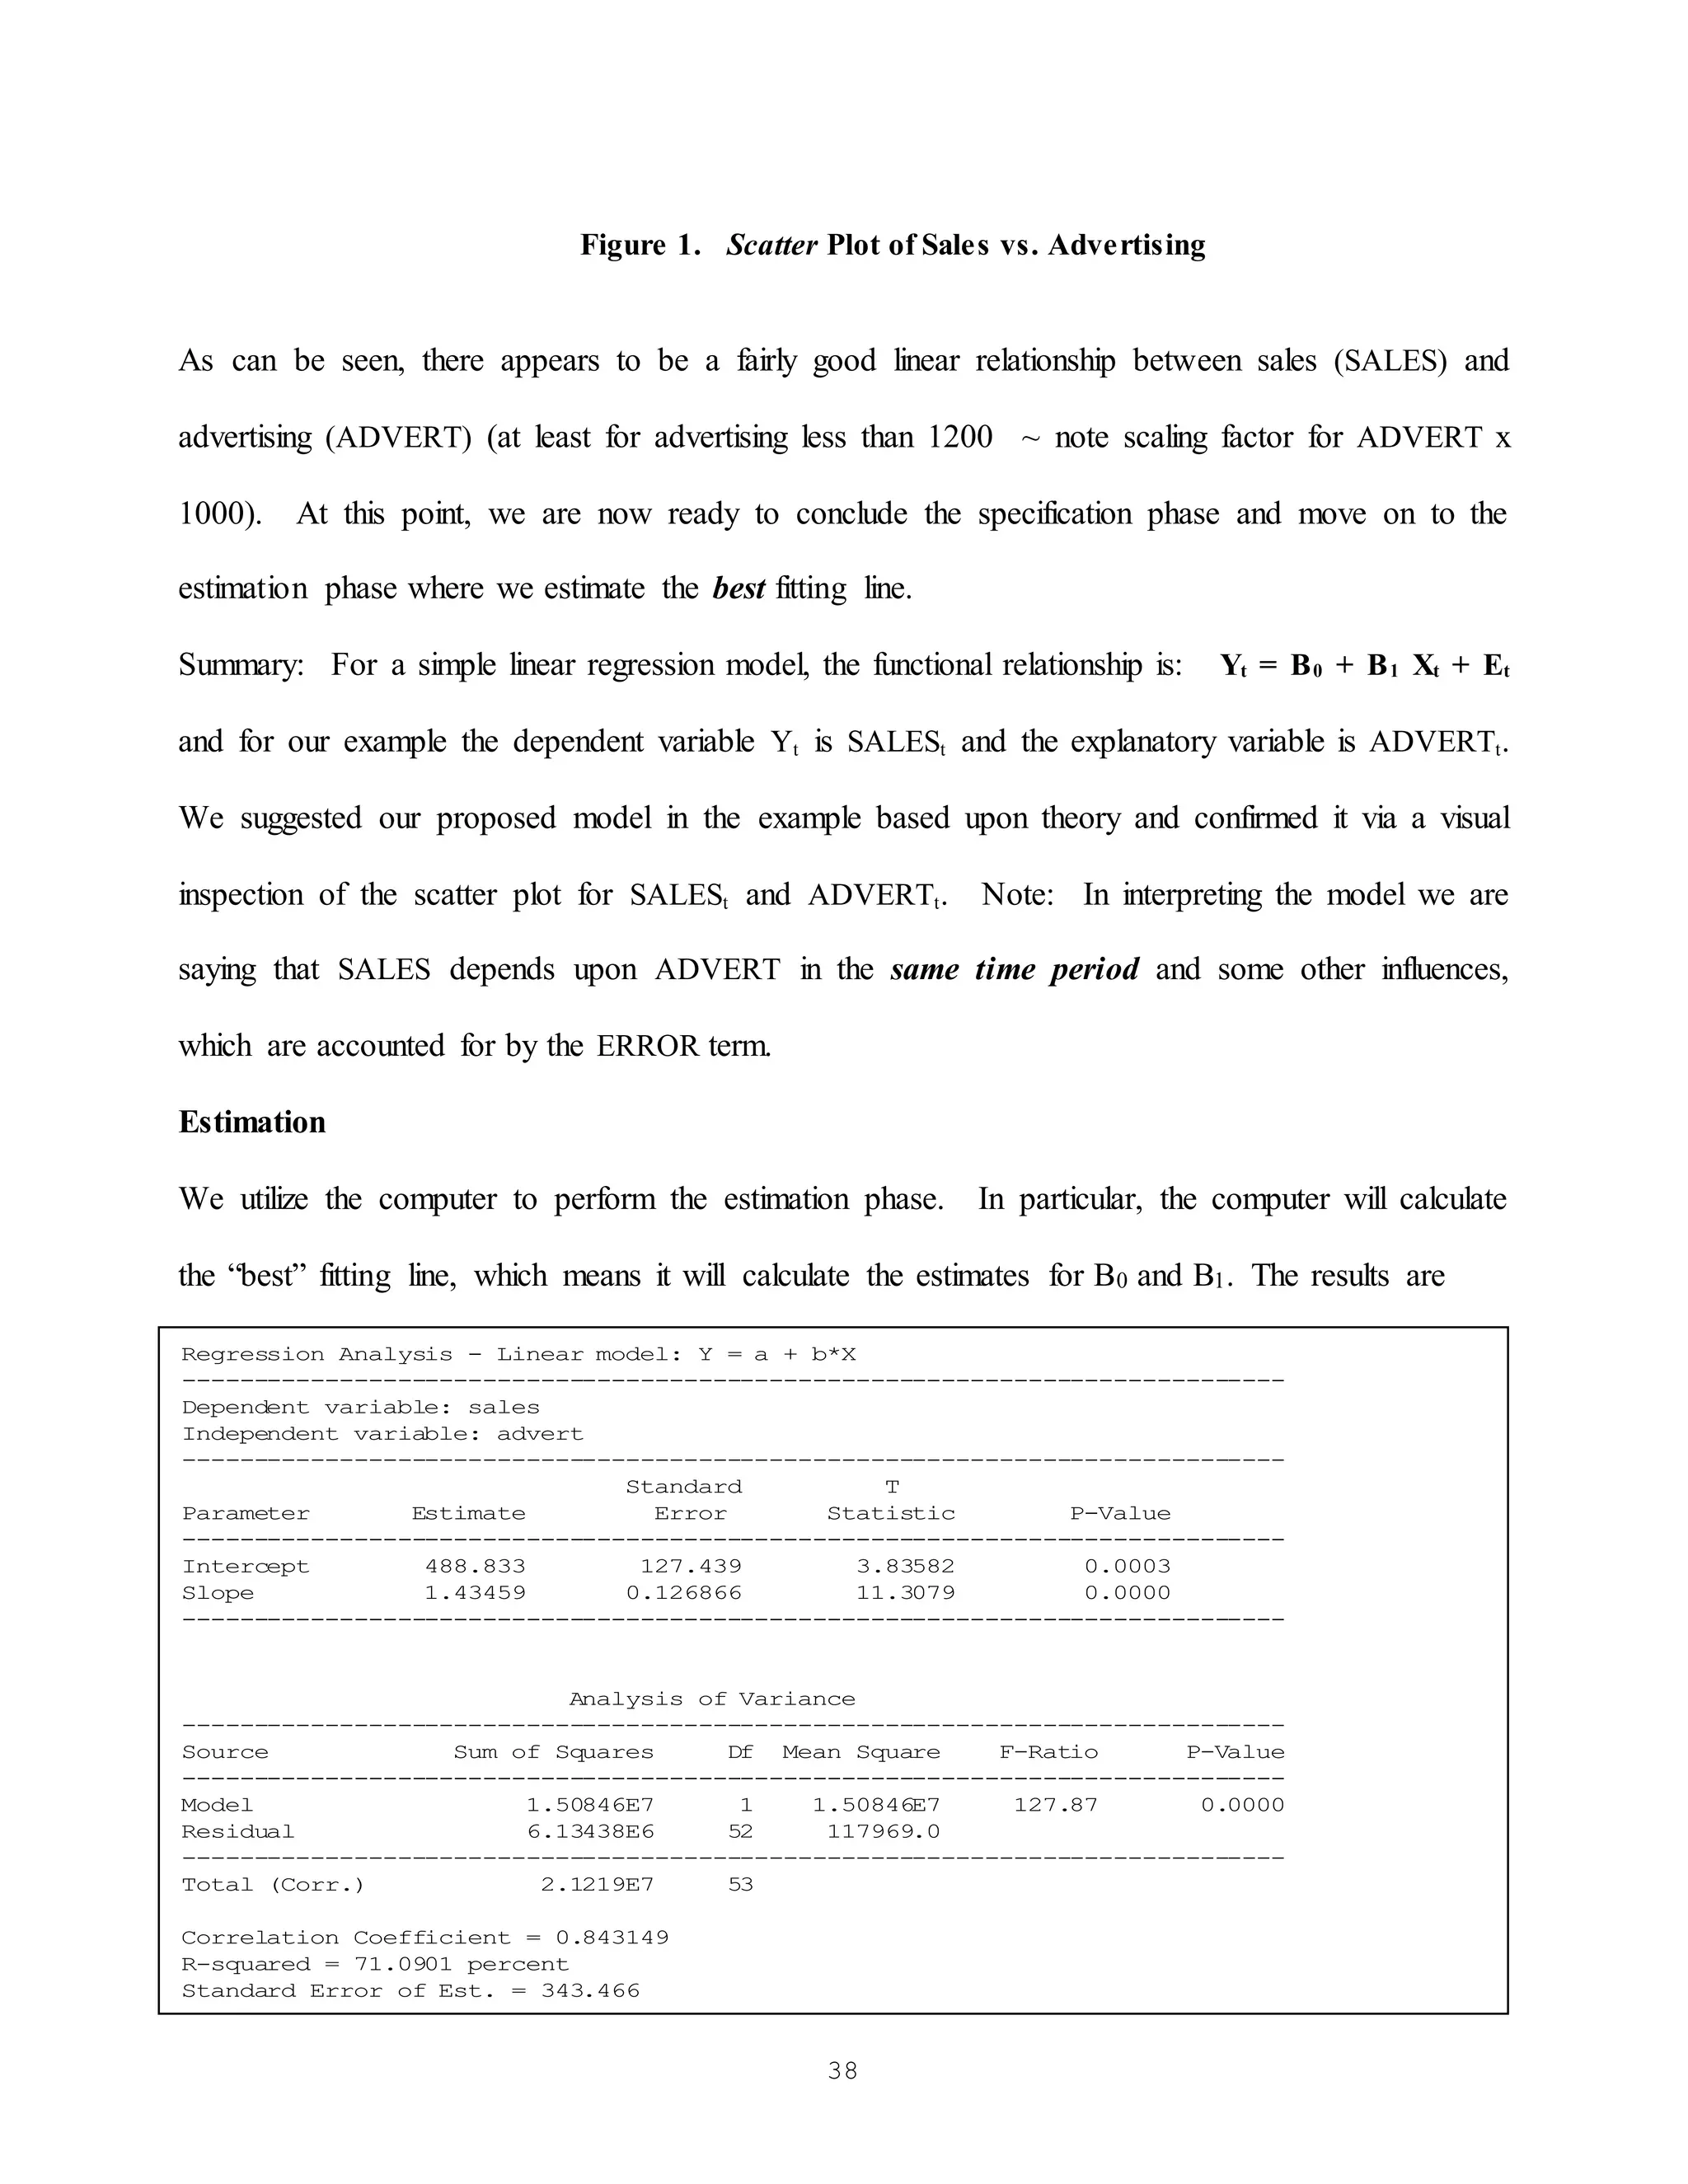
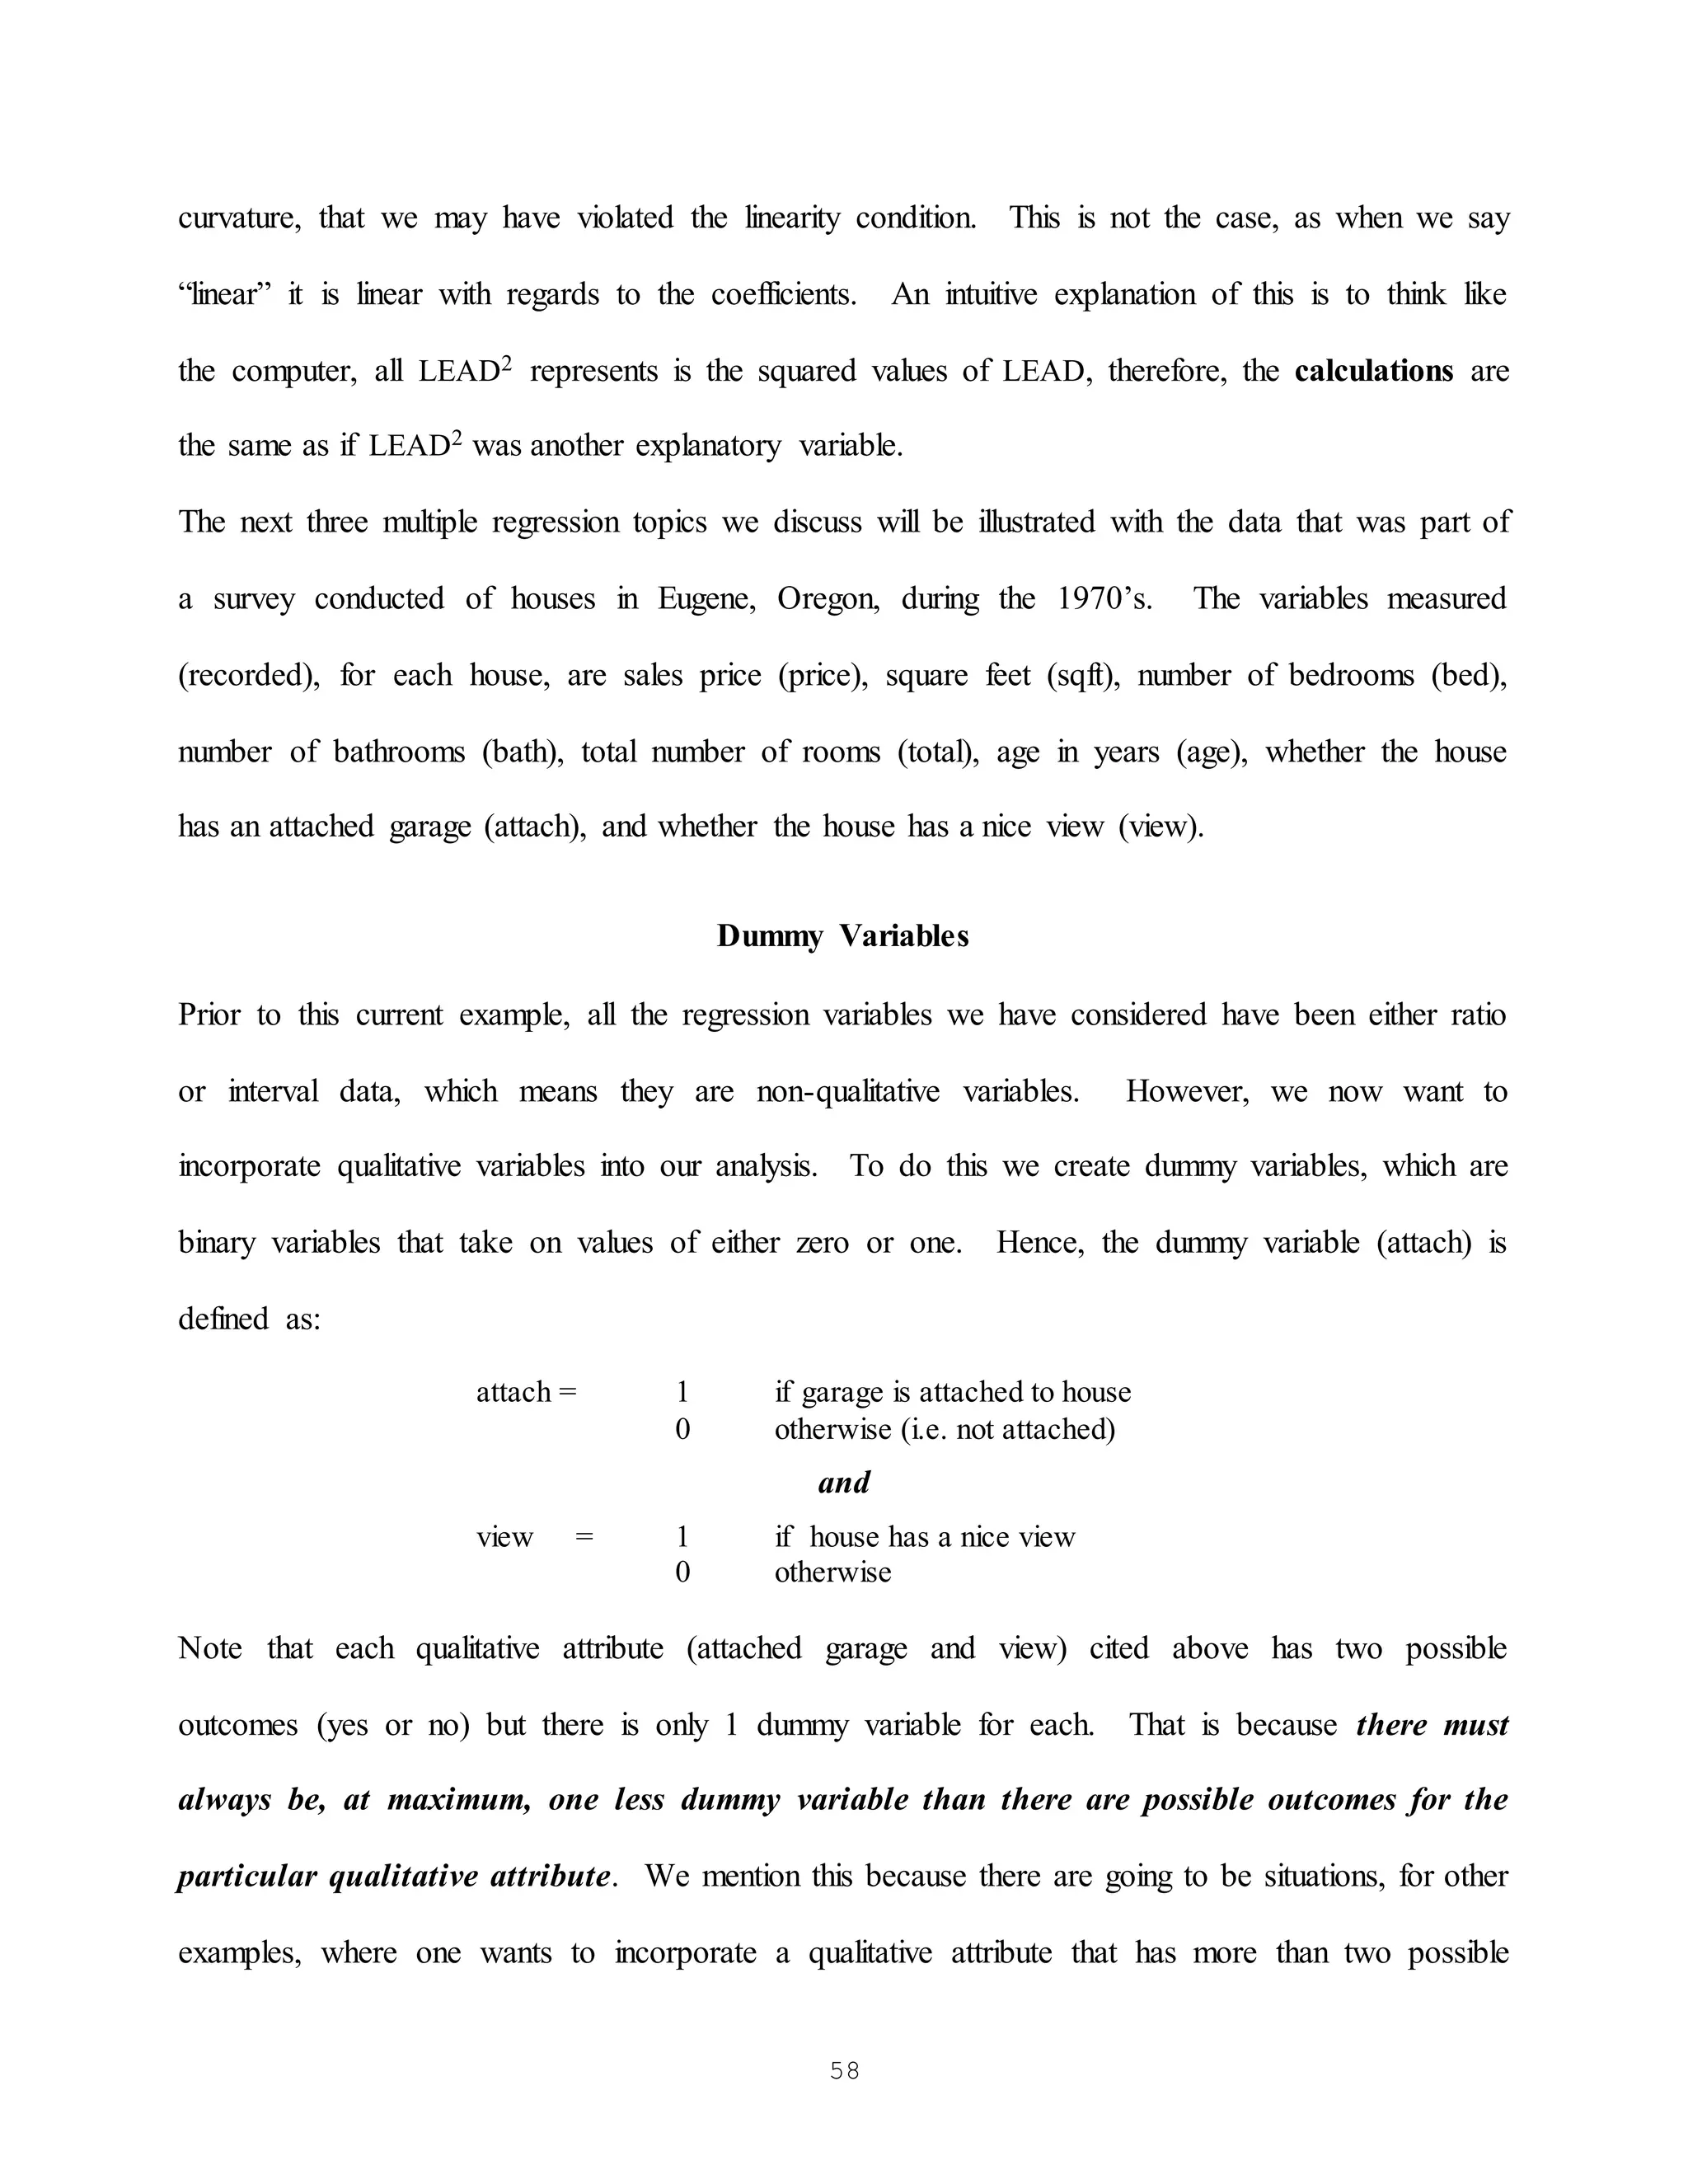
If the data is cross-sectional, then the observation may be eliminated, thereby decreasing the
number of observations by one. If the data is times series, by “discarding the impact” of the
observation one does not eliminate observations since doing so may effect lagging relationships,
however one can set the dummy variable equal to one (1) for that observation, zero (0) otherwise.
At other times, the outcome, which is classified as an outlier, is recorded correctly, may very well
occur again, and is indeed part of the concerned population. In this case, one would probably want
to leave the observation in the model construction process. In fact, if an outlier or set of outliers
represents a source of specific variation then one should incorporate that specific variation into the
model via an additional variable. Keep in mind, just because an observation is an outlier does not
mean that it should be discarded. These observations contain information that should not be
ignored just so “the model looks better.”
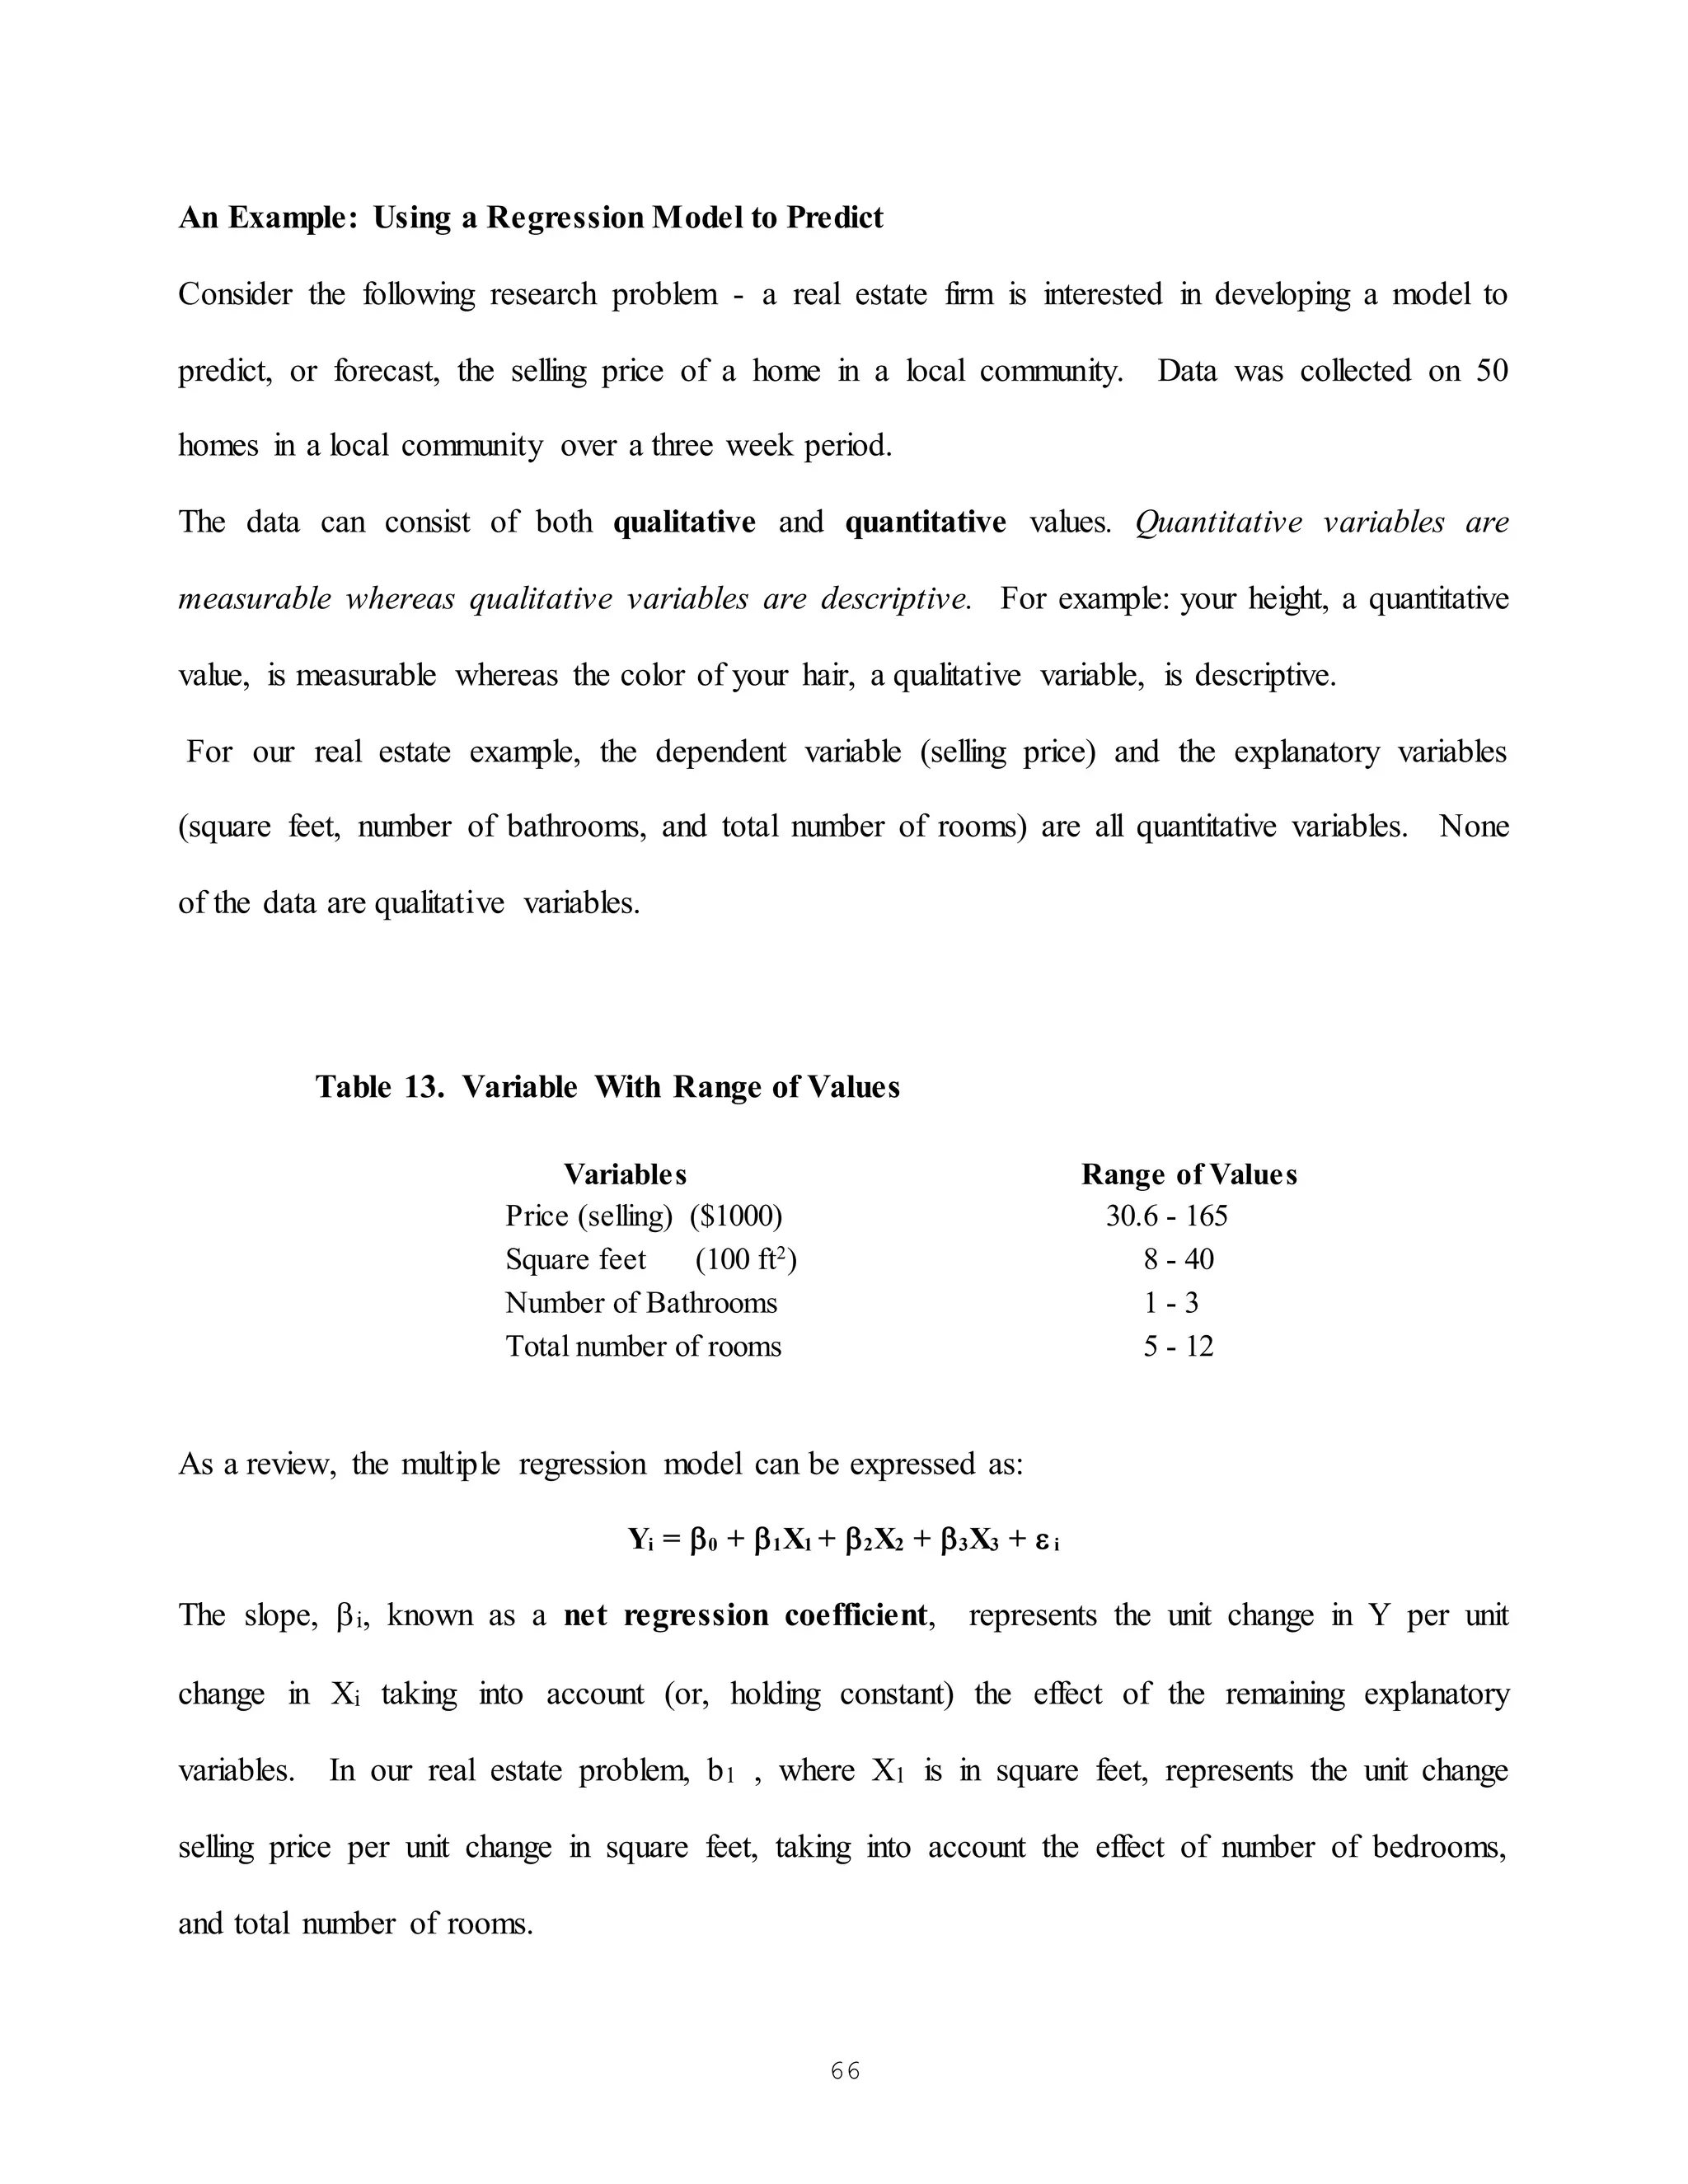
Now that we have defined what an outlier is and what action to take/not take for outlier, the next
step is to discuss how to determine what observations are outliers. Although a number of criteria
exist for classifying outliers, we limit our discussion to two specific criteria - standardized residuals
and leverage.
The theory behind using standardized residuals is that outliers are equated with observations which
have large residuals. To determine what is large, we standardize the residuals and then use the rule
that any standardized residual outside the bounds of -2 to 2 is considered an outlier. [Why do we
use -2 and 2? Could we use -3 and 3?]
The theory behind the leverage criteria is that a large residual may not necessarily equate with an
outlier. Hence, the leverage value measures the amount of influence that each observation has on
the set of estimates. It’s not intuitive, but can be shown mathematically, that the sum of the
leverage points is equal to the number of B coefficients in the model (P). Since there are N](https://image.slidesharecdn.com/notes-partii-211004051244/75/Notes-part-ii-25-2048.jpg)

![70
a. y
^ = _________________________________________________________
b. H0: ______________________ H1: _______________________
p-value: ___________________ Decision: __________________
c. In the final model, state the value and interpret for R2
adj. R2
adj:________ %
d. In the final model, state the value and interpret for b1 . b1 = ________
e. Predict the weekly salaries for the following employees:
Category Employee #1 Employee #2
Length of employment (in months) 10 125
Age (in years) 23 33
Gender female male
Job classification technical clerical
Employee 95% LCL y
^ 95% UCL
# 1
# 2
[Check documentation on file to ascertain gender coding for female and male. Also check for
proper coding for job classification.]](https://image.slidesharecdn.com/notes-partii-211004051244/75/Notes-part-ii-35-2048.jpg)
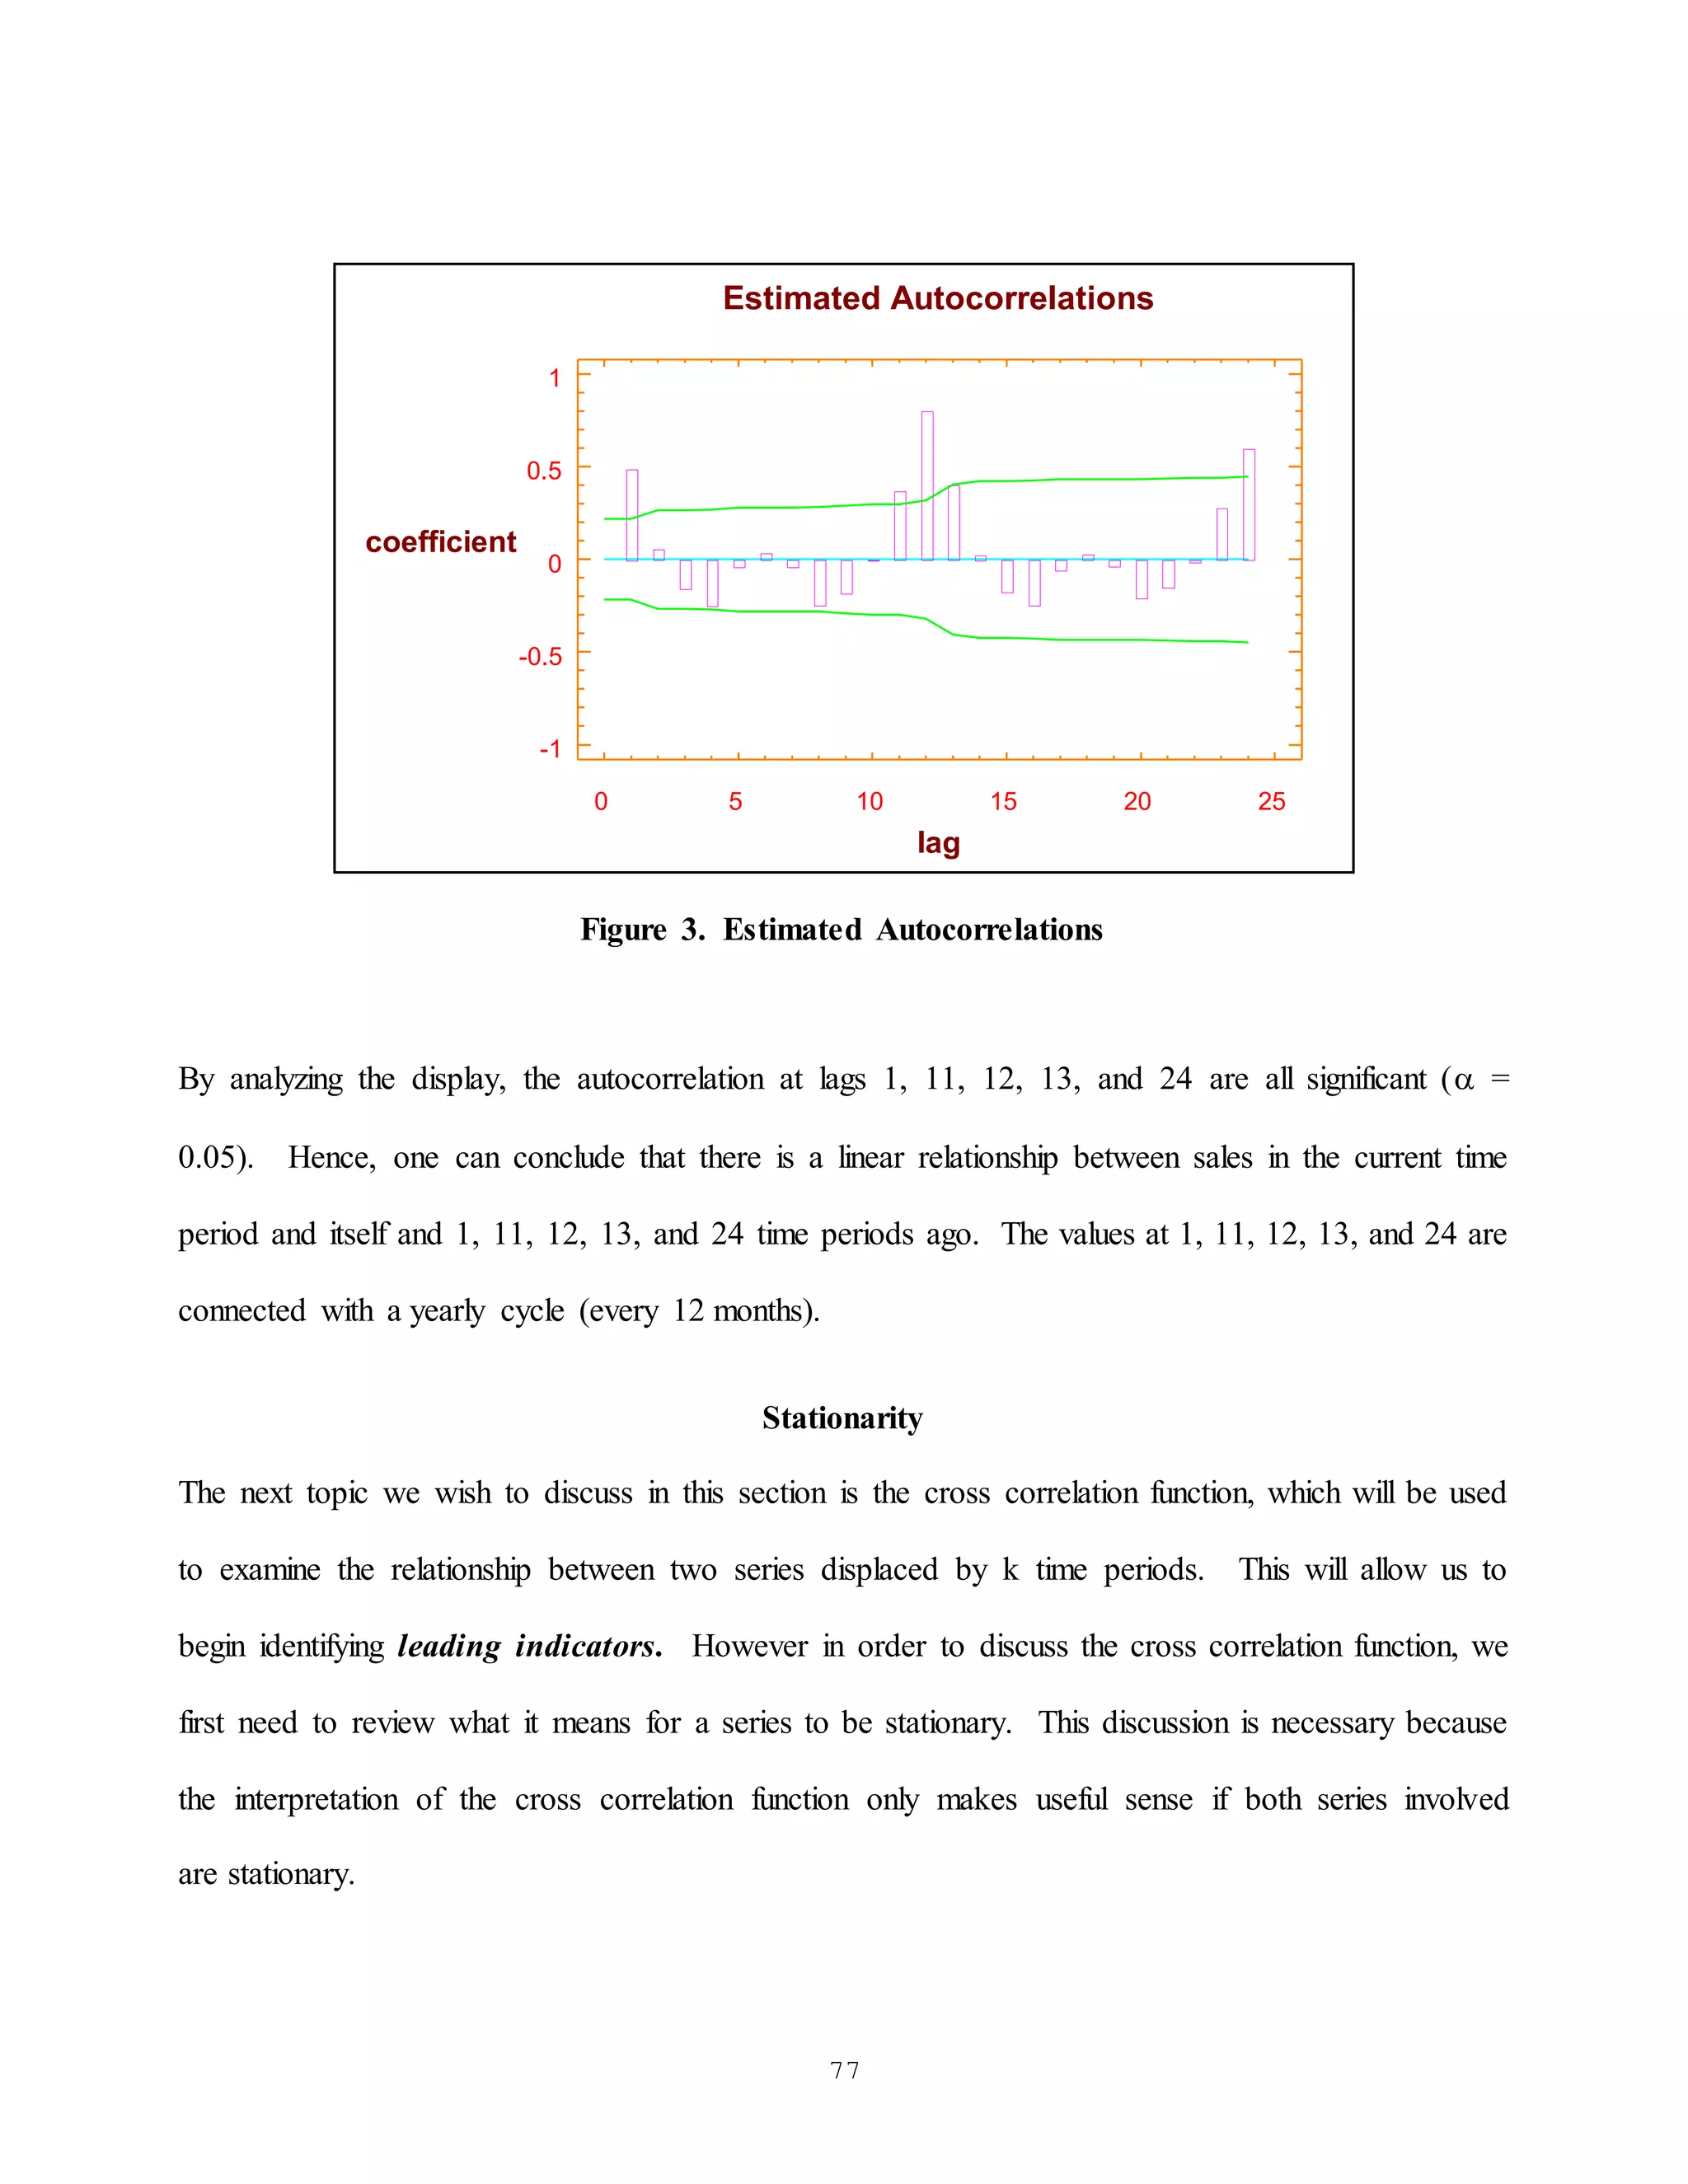
![78
Recall, a series is stationary if it has a constant mean and variance. Common departures from
stationarity (i.e. non-stationary series) are shown below:
When a series is nonstationary because of a changing variance, one can treat this problem by taking
logs of the data [logs in this course will be natural logs (Ln), not common logs (base 10)]. When a
series is nonstationary due to a changing mean then one can take differences to treat that problem.
If seasonality exists then one may in addition to taking differences of consecutive time periods, take
seasonal differences.
If a nonstationary series has a nonconstant mean and a nonconstant variance then differences and
logs may both be required to achieve a transformation to a stationary series. When taking both logs
and differences one must take the logs first (i.e. treat the nonconstant variance and the attack the
nonconstant mean). Why?
Cross Correlation
With the knowledge discussed in the autocorrelation section and the stationarity section, we are now
prepared to discuss the cross correlation function, which as we said before is designed to measure
the linear relationship between two series when they are displaced by k time periods. The cross
correlation function is shown below. (The formula is shown on extra large type to highlight the
components of the formula.)](https://image.slidesharecdn.com/notes-partii-211004051244/75/Notes-part-ii-43-2048.jpg)


The document discusses simple linear regression and multiple linear regression. It provides an example of using simple linear regression to model the relationship between sales (SALESt) and advertising (ADVERTt) using yearly data from 1907 to 1960. A scatter plot shows an apparent linear relationship between the variables. Estimation of the regression model finds the line of best fit to be SALESt = 488.8 + 1.4 ADVERTt. Diagnostic checks examine how well the model fits the data and whether advertising is a significant predictor of sales. A second model is discussed using lagged sales (SALESt-1) as the predictor, which is found to fit the data even better.