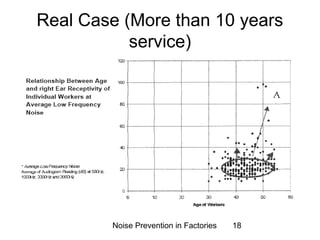
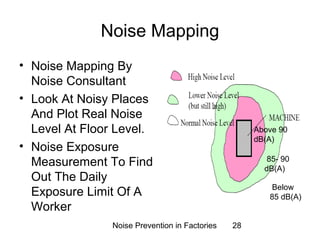
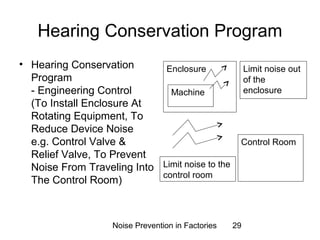
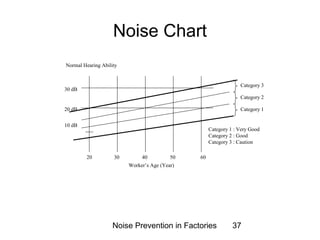
Noise Prevention in Factories 
Ir. Gan Chun Chet 
Aug 2009 
Noise Prevention in Factories 1
Introduction On Noise 
• Prevention Of Noise Problem In Factories 
• Reference Material : 
Factory And Machinery Act 1967, Noise 
Regulation 1989 
• Other Supporting Data : 
- Research Results From A Foreign 
Company 
- Noise Study In A Factory, With Data 
Based On Audiometric Test Results 
Noise Prevention in Factories 2
Introduction On Noise 
• Severity Of The Problem 
- Damage To Hearing Ability, Causing 
Hearing Impairment On The Ear 
• Cause Of Problem 
- Noise 
• Remedy 
- Noise Prevention 
Noise Prevention in Factories 3
Types of Noise 
• Noise Travel Into 
Our Ear 
- Propagation Of 
Sound Wave To 
The Ear Can 
Damage Our Ear 
- Long Exposure 
To Noise At Noisy 
Areas Effect Us 
Noise Prevention in Factories 4
Types of Noise 
• Type Of Noise 
Source (Point, Line, 
etc.) 
• Types Of Noise 
- Very Strong 
Pressure Fluctuation 
- Repetitive Or 
Cyclical Noise 
- Pulsation Noise 
Noise Prevention in Factories 5
Noise Measurement 
• Noise Unit Of Measurement Is In Decibel 
(dB) 
• The Weighted Sound Level Unit Is dB(A) 
• Sound Level Is The Noise Level 
• Noise Is Unwanted Sound 
• Equipment To Measure Noise Inside Plant 
– Noise Dosimeter 
• Audiometric Test (Using Tone) To Find 
Out A Person Hearing Level 
Noise Prevention in Factories 6
Research Findings (by a Foreign 
Company) 
• Following Are Some Research Finding 
From A Foreign Company 
• Normal Hearing Level With Age 
• Hearing Loss Due To Exposure With Age 
• Hearing Ability Of Maintenance Personnel 
Noise Prevention in Factories 7
Research Findings (by a Foreign 
Company) 
Noise Prevention in Factories 8
Research Findings (by a Foreign 
Company) 
Noise Prevention in Factories 9
A Real Case – A Factory in 
Malaysia 
• The Following Is A Real Case Of Workers 
Hearing Ability With Age 
• Different Graphs Plotted With Years Of 
Employment And Age 
Noise Prevention in Factories 10
Real Case (Main Data) 
Noise Prevention in Factories 11
Real Case (Main Data) 
Noise Prevention in Factories 12
Real Case (Main Data) 
• Cluster Of Dense Population Observed On 
Sample Group 
• Subject Age Group 
Densely Populated Area 36 To 50 
Second Dense Area 16 To 30 
• Audiogram Distribution Found That Most 
Of The Sample Workers Noise Receptivity 
Level Are The Region Of 5 To 34 dB 
Noise Prevention in Factories 13
Real Case (Less than 10 years 
service) 
• Sample Of Workers With Service 
Employment 10 Years Or Less Were 
Separated From The Main Sample Group. 
• Hearing Receptivity Was Plotted Against 
Age Of Sample Workers. Similar Pattern 
Corresponded To Main Sampling Group 
Was Observed 
(Sampled Of Production Workers At Floor 
Level) 
Noise Prevention in Factories 14
Real Case (Less than 10 years 
service) 
Noise Prevention in Factories 15
Real Case (Less than 10 years 
service) 
• Two Cluster Group Were Observed On 
The Chart. However, The Size Of The 
Cluster Group Is As Follow. 
• Subject Age Group 
Cluster 1 16 To 30 
Cluster 2 36 To 50 
• Results 
- Below 20 dB (Cluster 1) 
- Below 30 dB (Cluster 2) 
Noise Prevention in Factories 16
Real Case (More than 10 years 
service) 
• Analyzing Chart For Employment With 
Greater Than 10 Years, It Was Found One 
Cluster. 
• These Spread Over Between Age Group 
Of 36 To 55 Years Old. 
• The Receptivity Level Of The Cluster Is 
Higher When Compare To Age Group 
Between 16 To 30 Years Of Age. 
Noise Prevention in Factories 17
Real Case (More than 10 years 
service) 
Noise Prevention in Factories 18
Real Case (More than 10 years 
service) 
• One Group 
Subject Age Group 
Cluster 1 35 To 55 
• Results 
- Below 30 Db 
• Cases Of Individual Hearing Receptivity 
Leaving The Cluster Group Is Also 
Noticed Shown In Line “A” 
Noise Prevention in Factories 19
Real Case – Statistics 
(Summary of Finding) 
• Employment Less Than 10 Years 
• (16 – 35 Years Old) 
60 – 100 dB 3 Person 
40 – 60 dB 4 Person 
30 – 40 dB 11 Person 
Total = 18 Person 
• (36 – 60 Years Old) 
60 – 100 dB 4 Person 
40 – 60 dB 5 Person 
30 – 40 dB 12 Person 
Total = 21 Person 
Noise Prevention in Factories 20
Real Case – Statistics 
(Summary of Finding) 
• Employment More Than Or Equal To 10 
Years 
• (30 – 55 Years Old) 
60 – 100 Db 4 Person 
40 – 60 Db 13 Person 
30 – 40 Db 18 Person 
Total = 35 Person 
Noise Prevention in Factories 21
Factories and Machinery Act 1967 
(FMA) 
• A Standard Threshold Shift – Average Shift Of 10 dB At 
Frequencies 2000 Hz, 3000hz And 4000 Hz Relative To 
The Baseline Audiogram 
• A Hearing Impairment – An Impair In The Ability In 
Hearing (Ask An Ear Specialist) 
• Permanent Disability – Permanent Damage (Very 
Serious!) 
• (Consult Doctors Or Specialist! Hearing Problem Must 
Not Be Taken Lightly) 
• Also Refer To FMA Available In Bookstores 
Noise Prevention in Factories 22
Factories and Machinery Act 1967 
(FMA) 
• Factories And Machinery, Noise Exposure 
Regulations, 1989 
• Employees Need To Check For A Baseline Reading 
(Required By Law) 
• Noise Level Collected And Recorded At 500, 1000, 
2000, 3000 & 4000Hz 
• Required By Law Of Malaysia That The Permissible 
Exposure Limit Is (Refer To Schedule) 
- 85 dB(A) For 16 Hours Duration Per Day, 
- 90 dB(A) For 8 Hours Duration Per Day, etc. Per 
Schedule 
- Nobody Shall Be Exposed To Noise Level Exceeding 
115 dB(A) At Any Time 
Noise Prevention in Factories 23
Factories and Machinery Act 1967 
(Noise Regulation) 
• Some Examples 
e.g. The Sum Of Hearing Threshold Levels 
Shows An Increase Of 30 dB Compared To 
Preceding Level. Very Serious Shift! 
• Case : Less Than 10 Yrs Employment, 1st 
Cluster 20 dB And Below. 2nd Cluster 30 dB And 
Below 
: More Than 10yrs Employment, Cluster 30 
Noise Prevention in Factories 24 
dB and Below 
: Some Able To Hear Only At 90 dB! 
Damaged 
• Less Than 85 dB(A) Exposure Limit A Day
Factories and Machinery Act 1967 
• Take Note Of Threshold Shift! DO NOT 
Play With This! 
• Reduce Noise Level (Engineering 
Measures) 
• Avoid Noisy Area (Admistrative Control) 
• Consult Noise Consultant Or Ear 
Specialist! 
Noise Prevention in Factories 25
Noise Consultant and Audiometric 
Test 
• Noise Consultant Report On Condition Of 
The Plant 
• Report Will Identify Noisy Areas 
• Recommends Remedies 
Noise Prevention in Factories 26
Noise Consultant and Audiometric 
Test 
• Test To Find Out The Hearing Ability Of A 
Person 
• Audiometric Test Result Indicates Noise 
Receptivity Of A Person 
• Low Frequencies Or High Frequencies 
Noise That A Person’s Is Able To Hear 
Are Tested 
Noise Prevention in Factories 27
Noise Mapping 
• Noise Mapping By 
Noise Consultant 
• Look At Noisy Places 
And Plot Real Noise 
Level At Floor Level. 
• Noise Exposure 
Measurement To Find 
Out The Daily 
Exposure Limit Of A 
Worker 
Noise Prevention in Factories 28 
Above 90 
dB(A) 
85- 90 
dB(A) 
Below 
85 dB(A)
Hearing Conservation Program 
• Hearing Conservation 
Program 
- Engineering Control 
(To Install Enclosure At 
Rotating Equipment, To 
Reduce Device Noise 
e.g. Control Valve & 
Relief Valve, To Prevent 
Noise From Traveling Into 
The Control Room) 
Enclosure 
Machine 
Noise Prevention in Factories 29 
Limit noise out 
of the 
enclosure 
Control Room 
Limit noise to the 
control room
Adminstration 
• - Administrative 
Control 
(To Move Workers In 
And Out Of Noisy 
Area (Take Note Of 
Threshold Shift, Very 
Dangerous 
• So FMA Mentioned 
To Limit Daily 
Exposure To Noise 
By Control Of Work 
Schedule, Very 
Difficult To Practice), 
Constant Monitoring, 
Do Not Allow People 
To Enter Noisy Areas, 
Sign Board Of High 
Noise Areas, etc.) 
HIGH NOISE 
AREA 
- WEAR EAR 
MUFFLE 
Noise Prevention in Factories 30
Cases of Over Exposure 
• Limits of Audibility 
• Also consult a ear 
specialist 
Noise Prevention in Factories 31
Cases of Over Exposure 
Noise Prevention in Factories 32
Noise Prevention 
• Prevent Exposure to Unwanted Noise 
- Avoid Going Into Noisy Area 
- Do Not Allow Unwanted Noise To Enter The 
Ear 
- Reduce Noise Source To The Acceptable 
Level 
- Do a noise mapping to understand the areas of 
noise source and the allowable area of work 
- Check you ear condition by audiometric test 
Noise Prevention in Factories 33
Remedy 
• Remedy 
- Limit the noise source 
- Enclosure the noisy source 
- Wear Protective Ear Plugs or Muffles 
- Prevent workers from going into noisy area 
- Sign boards to inform workers of noisy area 
Noise Prevention in Factories 34
Conclusion 
• FMA 1967 – Get it from bookstore (MPH, 
Popular, etc.) 
• Slides, Noise Chart and Excel File, if 
required – Get it from Zul. 
Noise Prevention in Factories 35
Noise Chart 
• Chart 
• Identify a factory worker’s hearing ability 
whether it is healthy (within the limit) 
• Please also refer to test result report from 
a qualify doctor 
Noise Prevention in Factories 36
40 50 
Noise Prevention in Factories 37 
30 dB 
20 dB 
20 60 
10 dB 
30 
Worker’s Age (Year) 
Normal Hearing Ability 
Category 3 
Category 2 
Category 1 
Category 1 : Very Good 
Category 2 : Good 
Category 3 : Caution 
Noise Chart
Noise Records - Excel File 
• Excel File 
• Measure the audiometric test result and 
record. 
• Warning Limit (Standard Threshold Shift) 
Noise Prevention in Factories 38
Noise Records - Excel File 
Noise Prevention in Factories 39
Noise Records - Excel File 
Noise Prevention in Factories 40
Noise Records - Excel File 
Noise Prevention in Factories 41
Noise Prevention 
(Own Notes) 
• Introduction On Noise 
• Type of Noise 
• Types of Noise Measurement 
• Research Findings From a Foreign Company 
• A Real Case on Audiometric Test Result on Factory Workers 
• The Law of Malaysia, FMA 1967 (Noise Regulation 1989) 
• Noise Consultants and Audiometric Test 
• Noise Mapping 
• Engineering and Administration Control 
• Cases of Over Exposure – See a Ear Specialist 
• Noise Prevention 
• Remedy 
• Conclusion 
• Noise Chart 
• A Excel File 
• An Article on A Real Case 
Noise Prevention in Factories 42

Noise Prevention In Factories-Approved

  • 1.
    Noise Prevention inFactories Ir. Gan Chun Chet Aug 2009 Noise Prevention in Factories 1
  • 2.
    Introduction On Noise • Prevention Of Noise Problem In Factories • Reference Material : Factory And Machinery Act 1967, Noise Regulation 1989 • Other Supporting Data : - Research Results From A Foreign Company - Noise Study In A Factory, With Data Based On Audiometric Test Results Noise Prevention in Factories 2
  • 3.
    Introduction On Noise • Severity Of The Problem - Damage To Hearing Ability, Causing Hearing Impairment On The Ear • Cause Of Problem - Noise • Remedy - Noise Prevention Noise Prevention in Factories 3
  • 4.
    Types of Noise • Noise Travel Into Our Ear - Propagation Of Sound Wave To The Ear Can Damage Our Ear - Long Exposure To Noise At Noisy Areas Effect Us Noise Prevention in Factories 4
  • 5.
    Types of Noise • Type Of Noise Source (Point, Line, etc.) • Types Of Noise - Very Strong Pressure Fluctuation - Repetitive Or Cyclical Noise - Pulsation Noise Noise Prevention in Factories 5
  • 6.
    Noise Measurement •Noise Unit Of Measurement Is In Decibel (dB) • The Weighted Sound Level Unit Is dB(A) • Sound Level Is The Noise Level • Noise Is Unwanted Sound • Equipment To Measure Noise Inside Plant – Noise Dosimeter • Audiometric Test (Using Tone) To Find Out A Person Hearing Level Noise Prevention in Factories 6
  • 7.
    Research Findings (bya Foreign Company) • Following Are Some Research Finding From A Foreign Company • Normal Hearing Level With Age • Hearing Loss Due To Exposure With Age • Hearing Ability Of Maintenance Personnel Noise Prevention in Factories 7
  • 8.
    Research Findings (bya Foreign Company) Noise Prevention in Factories 8
  • 9.
    Research Findings (bya Foreign Company) Noise Prevention in Factories 9
  • 10.
    A Real Case– A Factory in Malaysia • The Following Is A Real Case Of Workers Hearing Ability With Age • Different Graphs Plotted With Years Of Employment And Age Noise Prevention in Factories 10
  • 11.
    Real Case (MainData) Noise Prevention in Factories 11
  • 12.
    Real Case (MainData) Noise Prevention in Factories 12
  • 13.
    Real Case (MainData) • Cluster Of Dense Population Observed On Sample Group • Subject Age Group Densely Populated Area 36 To 50 Second Dense Area 16 To 30 • Audiogram Distribution Found That Most Of The Sample Workers Noise Receptivity Level Are The Region Of 5 To 34 dB Noise Prevention in Factories 13
  • 14.
    Real Case (Lessthan 10 years service) • Sample Of Workers With Service Employment 10 Years Or Less Were Separated From The Main Sample Group. • Hearing Receptivity Was Plotted Against Age Of Sample Workers. Similar Pattern Corresponded To Main Sampling Group Was Observed (Sampled Of Production Workers At Floor Level) Noise Prevention in Factories 14
  • 15.
    Real Case (Lessthan 10 years service) Noise Prevention in Factories 15
  • 16.
    Real Case (Lessthan 10 years service) • Two Cluster Group Were Observed On The Chart. However, The Size Of The Cluster Group Is As Follow. • Subject Age Group Cluster 1 16 To 30 Cluster 2 36 To 50 • Results - Below 20 dB (Cluster 1) - Below 30 dB (Cluster 2) Noise Prevention in Factories 16
  • 17.
    Real Case (Morethan 10 years service) • Analyzing Chart For Employment With Greater Than 10 Years, It Was Found One Cluster. • These Spread Over Between Age Group Of 36 To 55 Years Old. • The Receptivity Level Of The Cluster Is Higher When Compare To Age Group Between 16 To 30 Years Of Age. Noise Prevention in Factories 17
  • 18.
    Real Case (Morethan 10 years service) Noise Prevention in Factories 18
  • 19.
    Real Case (Morethan 10 years service) • One Group Subject Age Group Cluster 1 35 To 55 • Results - Below 30 Db • Cases Of Individual Hearing Receptivity Leaving The Cluster Group Is Also Noticed Shown In Line “A” Noise Prevention in Factories 19
  • 20.
    Real Case –Statistics (Summary of Finding) • Employment Less Than 10 Years • (16 – 35 Years Old) 60 – 100 dB 3 Person 40 – 60 dB 4 Person 30 – 40 dB 11 Person Total = 18 Person • (36 – 60 Years Old) 60 – 100 dB 4 Person 40 – 60 dB 5 Person 30 – 40 dB 12 Person Total = 21 Person Noise Prevention in Factories 20
  • 21.
    Real Case –Statistics (Summary of Finding) • Employment More Than Or Equal To 10 Years • (30 – 55 Years Old) 60 – 100 Db 4 Person 40 – 60 Db 13 Person 30 – 40 Db 18 Person Total = 35 Person Noise Prevention in Factories 21
  • 22.
    Factories and MachineryAct 1967 (FMA) • A Standard Threshold Shift – Average Shift Of 10 dB At Frequencies 2000 Hz, 3000hz And 4000 Hz Relative To The Baseline Audiogram • A Hearing Impairment – An Impair In The Ability In Hearing (Ask An Ear Specialist) • Permanent Disability – Permanent Damage (Very Serious!) • (Consult Doctors Or Specialist! Hearing Problem Must Not Be Taken Lightly) • Also Refer To FMA Available In Bookstores Noise Prevention in Factories 22
  • 23.
    Factories and MachineryAct 1967 (FMA) • Factories And Machinery, Noise Exposure Regulations, 1989 • Employees Need To Check For A Baseline Reading (Required By Law) • Noise Level Collected And Recorded At 500, 1000, 2000, 3000 & 4000Hz • Required By Law Of Malaysia That The Permissible Exposure Limit Is (Refer To Schedule) - 85 dB(A) For 16 Hours Duration Per Day, - 90 dB(A) For 8 Hours Duration Per Day, etc. Per Schedule - Nobody Shall Be Exposed To Noise Level Exceeding 115 dB(A) At Any Time Noise Prevention in Factories 23
  • 24.
    Factories and MachineryAct 1967 (Noise Regulation) • Some Examples e.g. The Sum Of Hearing Threshold Levels Shows An Increase Of 30 dB Compared To Preceding Level. Very Serious Shift! • Case : Less Than 10 Yrs Employment, 1st Cluster 20 dB And Below. 2nd Cluster 30 dB And Below : More Than 10yrs Employment, Cluster 30 Noise Prevention in Factories 24 dB and Below : Some Able To Hear Only At 90 dB! Damaged • Less Than 85 dB(A) Exposure Limit A Day
  • 25.
    Factories and MachineryAct 1967 • Take Note Of Threshold Shift! DO NOT Play With This! • Reduce Noise Level (Engineering Measures) • Avoid Noisy Area (Admistrative Control) • Consult Noise Consultant Or Ear Specialist! Noise Prevention in Factories 25
  • 26.
    Noise Consultant andAudiometric Test • Noise Consultant Report On Condition Of The Plant • Report Will Identify Noisy Areas • Recommends Remedies Noise Prevention in Factories 26
  • 27.
    Noise Consultant andAudiometric Test • Test To Find Out The Hearing Ability Of A Person • Audiometric Test Result Indicates Noise Receptivity Of A Person • Low Frequencies Or High Frequencies Noise That A Person’s Is Able To Hear Are Tested Noise Prevention in Factories 27
  • 28.
    Noise Mapping •Noise Mapping By Noise Consultant • Look At Noisy Places And Plot Real Noise Level At Floor Level. • Noise Exposure Measurement To Find Out The Daily Exposure Limit Of A Worker Noise Prevention in Factories 28 Above 90 dB(A) 85- 90 dB(A) Below 85 dB(A)
  • 29.
    Hearing Conservation Program • Hearing Conservation Program - Engineering Control (To Install Enclosure At Rotating Equipment, To Reduce Device Noise e.g. Control Valve & Relief Valve, To Prevent Noise From Traveling Into The Control Room) Enclosure Machine Noise Prevention in Factories 29 Limit noise out of the enclosure Control Room Limit noise to the control room
  • 30.
    Adminstration • -Administrative Control (To Move Workers In And Out Of Noisy Area (Take Note Of Threshold Shift, Very Dangerous • So FMA Mentioned To Limit Daily Exposure To Noise By Control Of Work Schedule, Very Difficult To Practice), Constant Monitoring, Do Not Allow People To Enter Noisy Areas, Sign Board Of High Noise Areas, etc.) HIGH NOISE AREA - WEAR EAR MUFFLE Noise Prevention in Factories 30
  • 31.
    Cases of OverExposure • Limits of Audibility • Also consult a ear specialist Noise Prevention in Factories 31
  • 32.
    Cases of OverExposure Noise Prevention in Factories 32
  • 33.
    Noise Prevention •Prevent Exposure to Unwanted Noise - Avoid Going Into Noisy Area - Do Not Allow Unwanted Noise To Enter The Ear - Reduce Noise Source To The Acceptable Level - Do a noise mapping to understand the areas of noise source and the allowable area of work - Check you ear condition by audiometric test Noise Prevention in Factories 33
  • 34.
    Remedy • Remedy - Limit the noise source - Enclosure the noisy source - Wear Protective Ear Plugs or Muffles - Prevent workers from going into noisy area - Sign boards to inform workers of noisy area Noise Prevention in Factories 34
  • 35.
    Conclusion • FMA1967 – Get it from bookstore (MPH, Popular, etc.) • Slides, Noise Chart and Excel File, if required – Get it from Zul. Noise Prevention in Factories 35
  • 36.
    Noise Chart •Chart • Identify a factory worker’s hearing ability whether it is healthy (within the limit) • Please also refer to test result report from a qualify doctor Noise Prevention in Factories 36
  • 37.
    40 50 NoisePrevention in Factories 37 30 dB 20 dB 20 60 10 dB 30 Worker’s Age (Year) Normal Hearing Ability Category 3 Category 2 Category 1 Category 1 : Very Good Category 2 : Good Category 3 : Caution Noise Chart
  • 38.
    Noise Records -Excel File • Excel File • Measure the audiometric test result and record. • Warning Limit (Standard Threshold Shift) Noise Prevention in Factories 38
  • 39.
    Noise Records -Excel File Noise Prevention in Factories 39
  • 40.
    Noise Records -Excel File Noise Prevention in Factories 40
  • 41.
    Noise Records -Excel File Noise Prevention in Factories 41
  • 42.
    Noise Prevention (OwnNotes) • Introduction On Noise • Type of Noise • Types of Noise Measurement • Research Findings From a Foreign Company • A Real Case on Audiometric Test Result on Factory Workers • The Law of Malaysia, FMA 1967 (Noise Regulation 1989) • Noise Consultants and Audiometric Test • Noise Mapping • Engineering and Administration Control • Cases of Over Exposure – See a Ear Specialist • Noise Prevention • Remedy • Conclusion • Noise Chart • A Excel File • An Article on A Real Case Noise Prevention in Factories 42