Download as PPS, PPTX
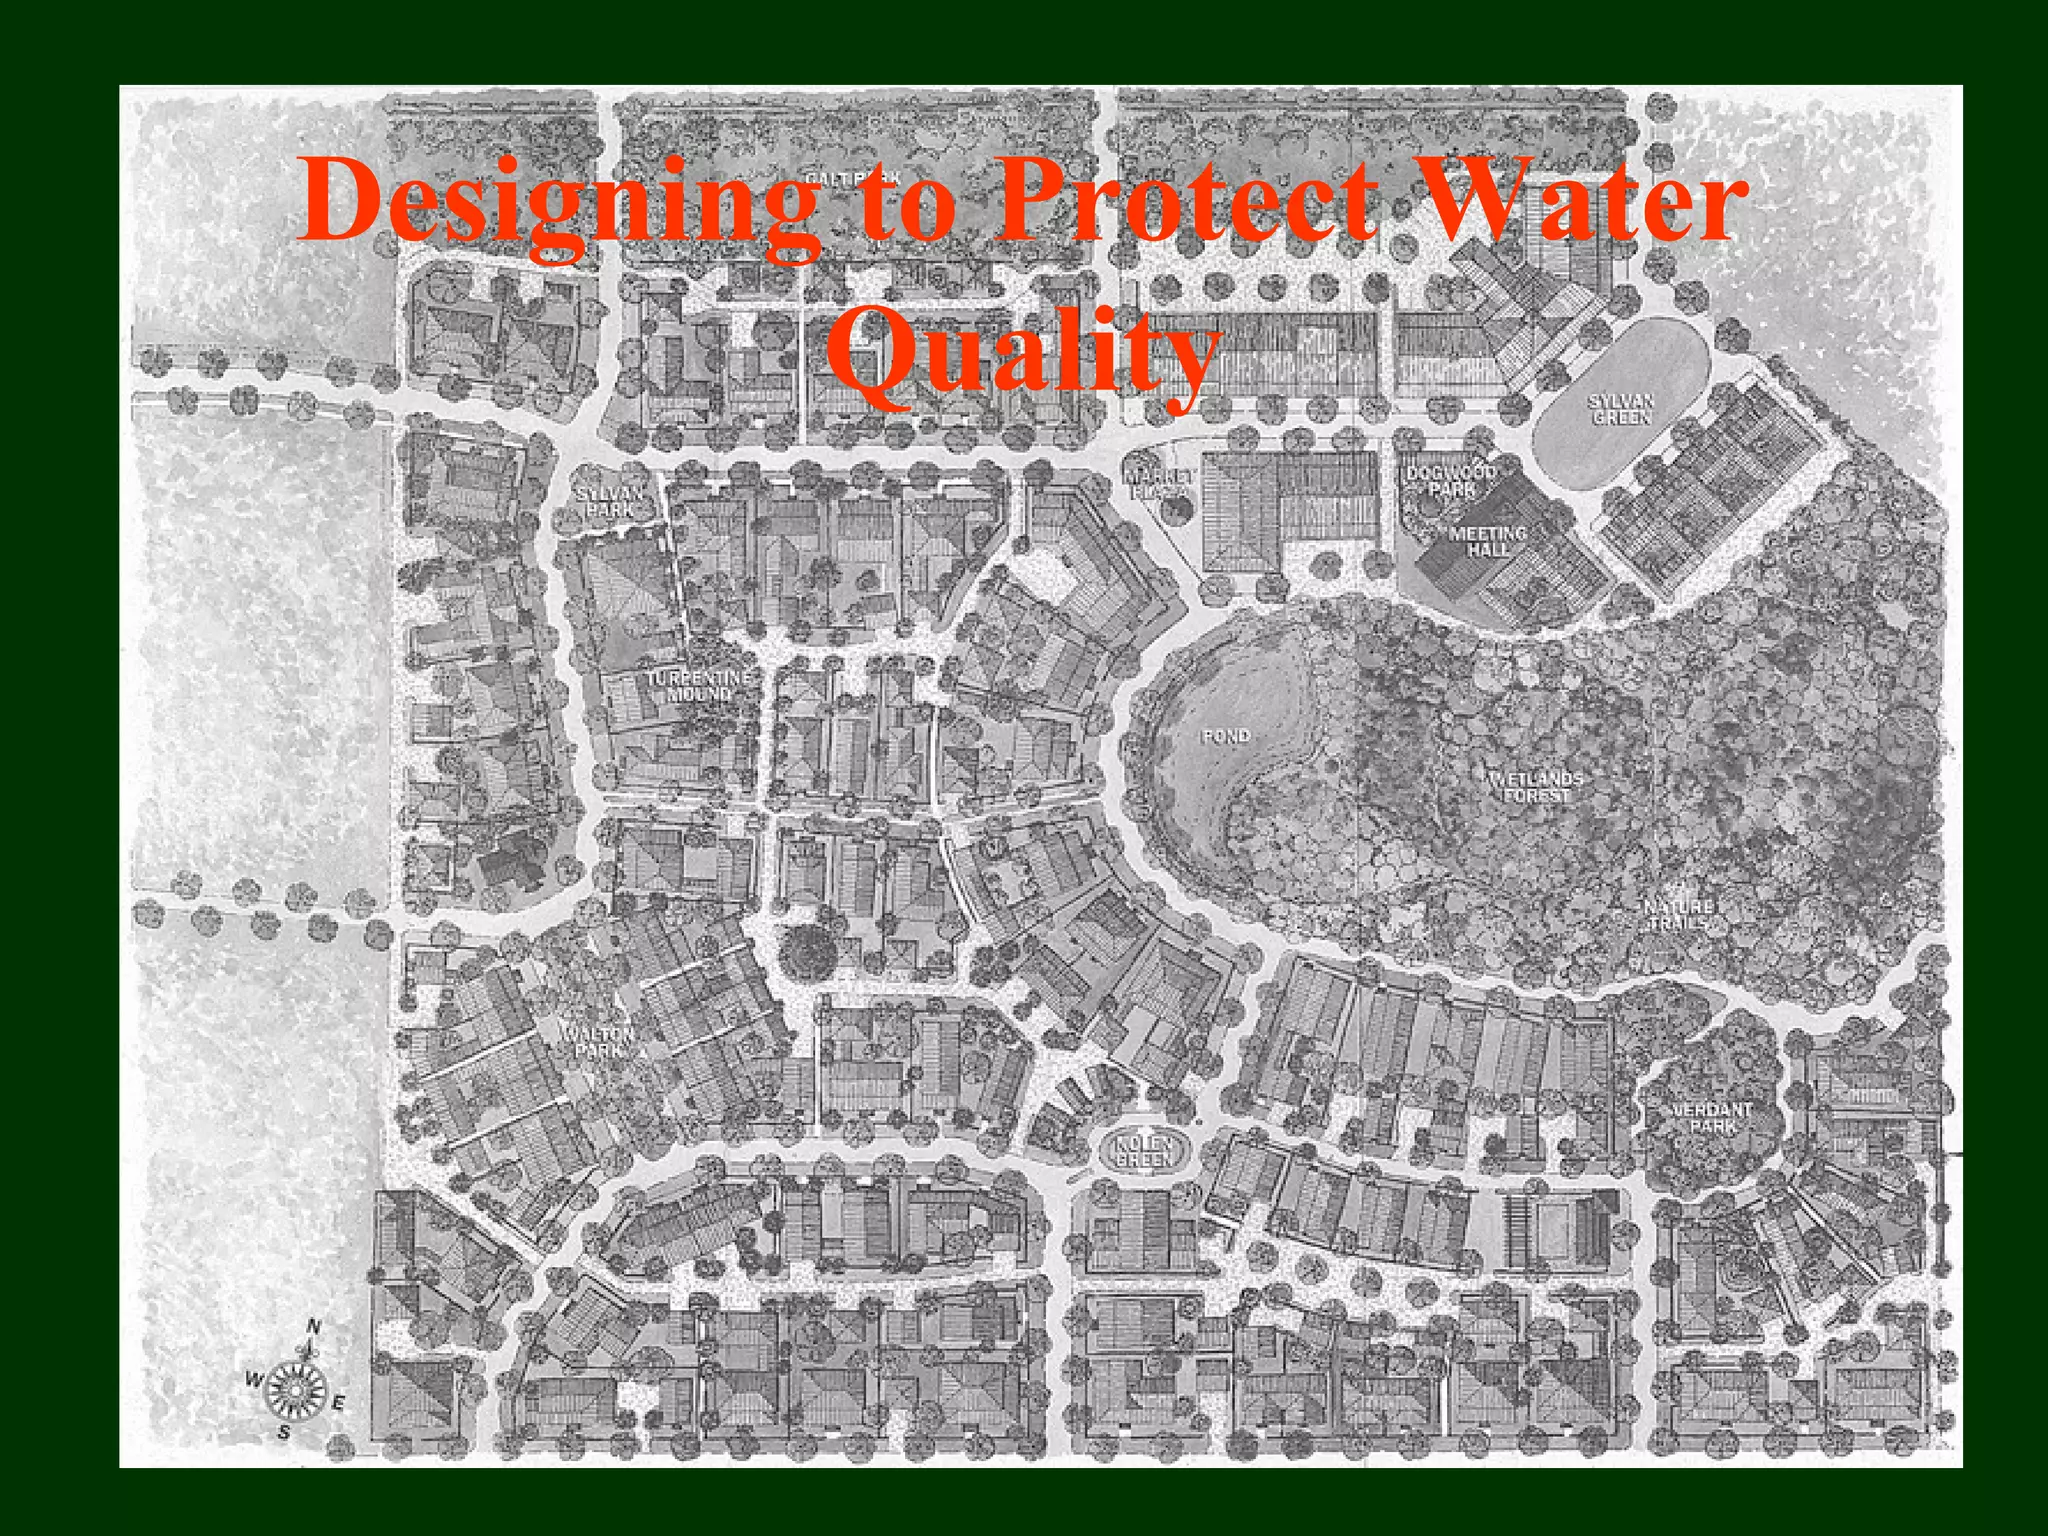
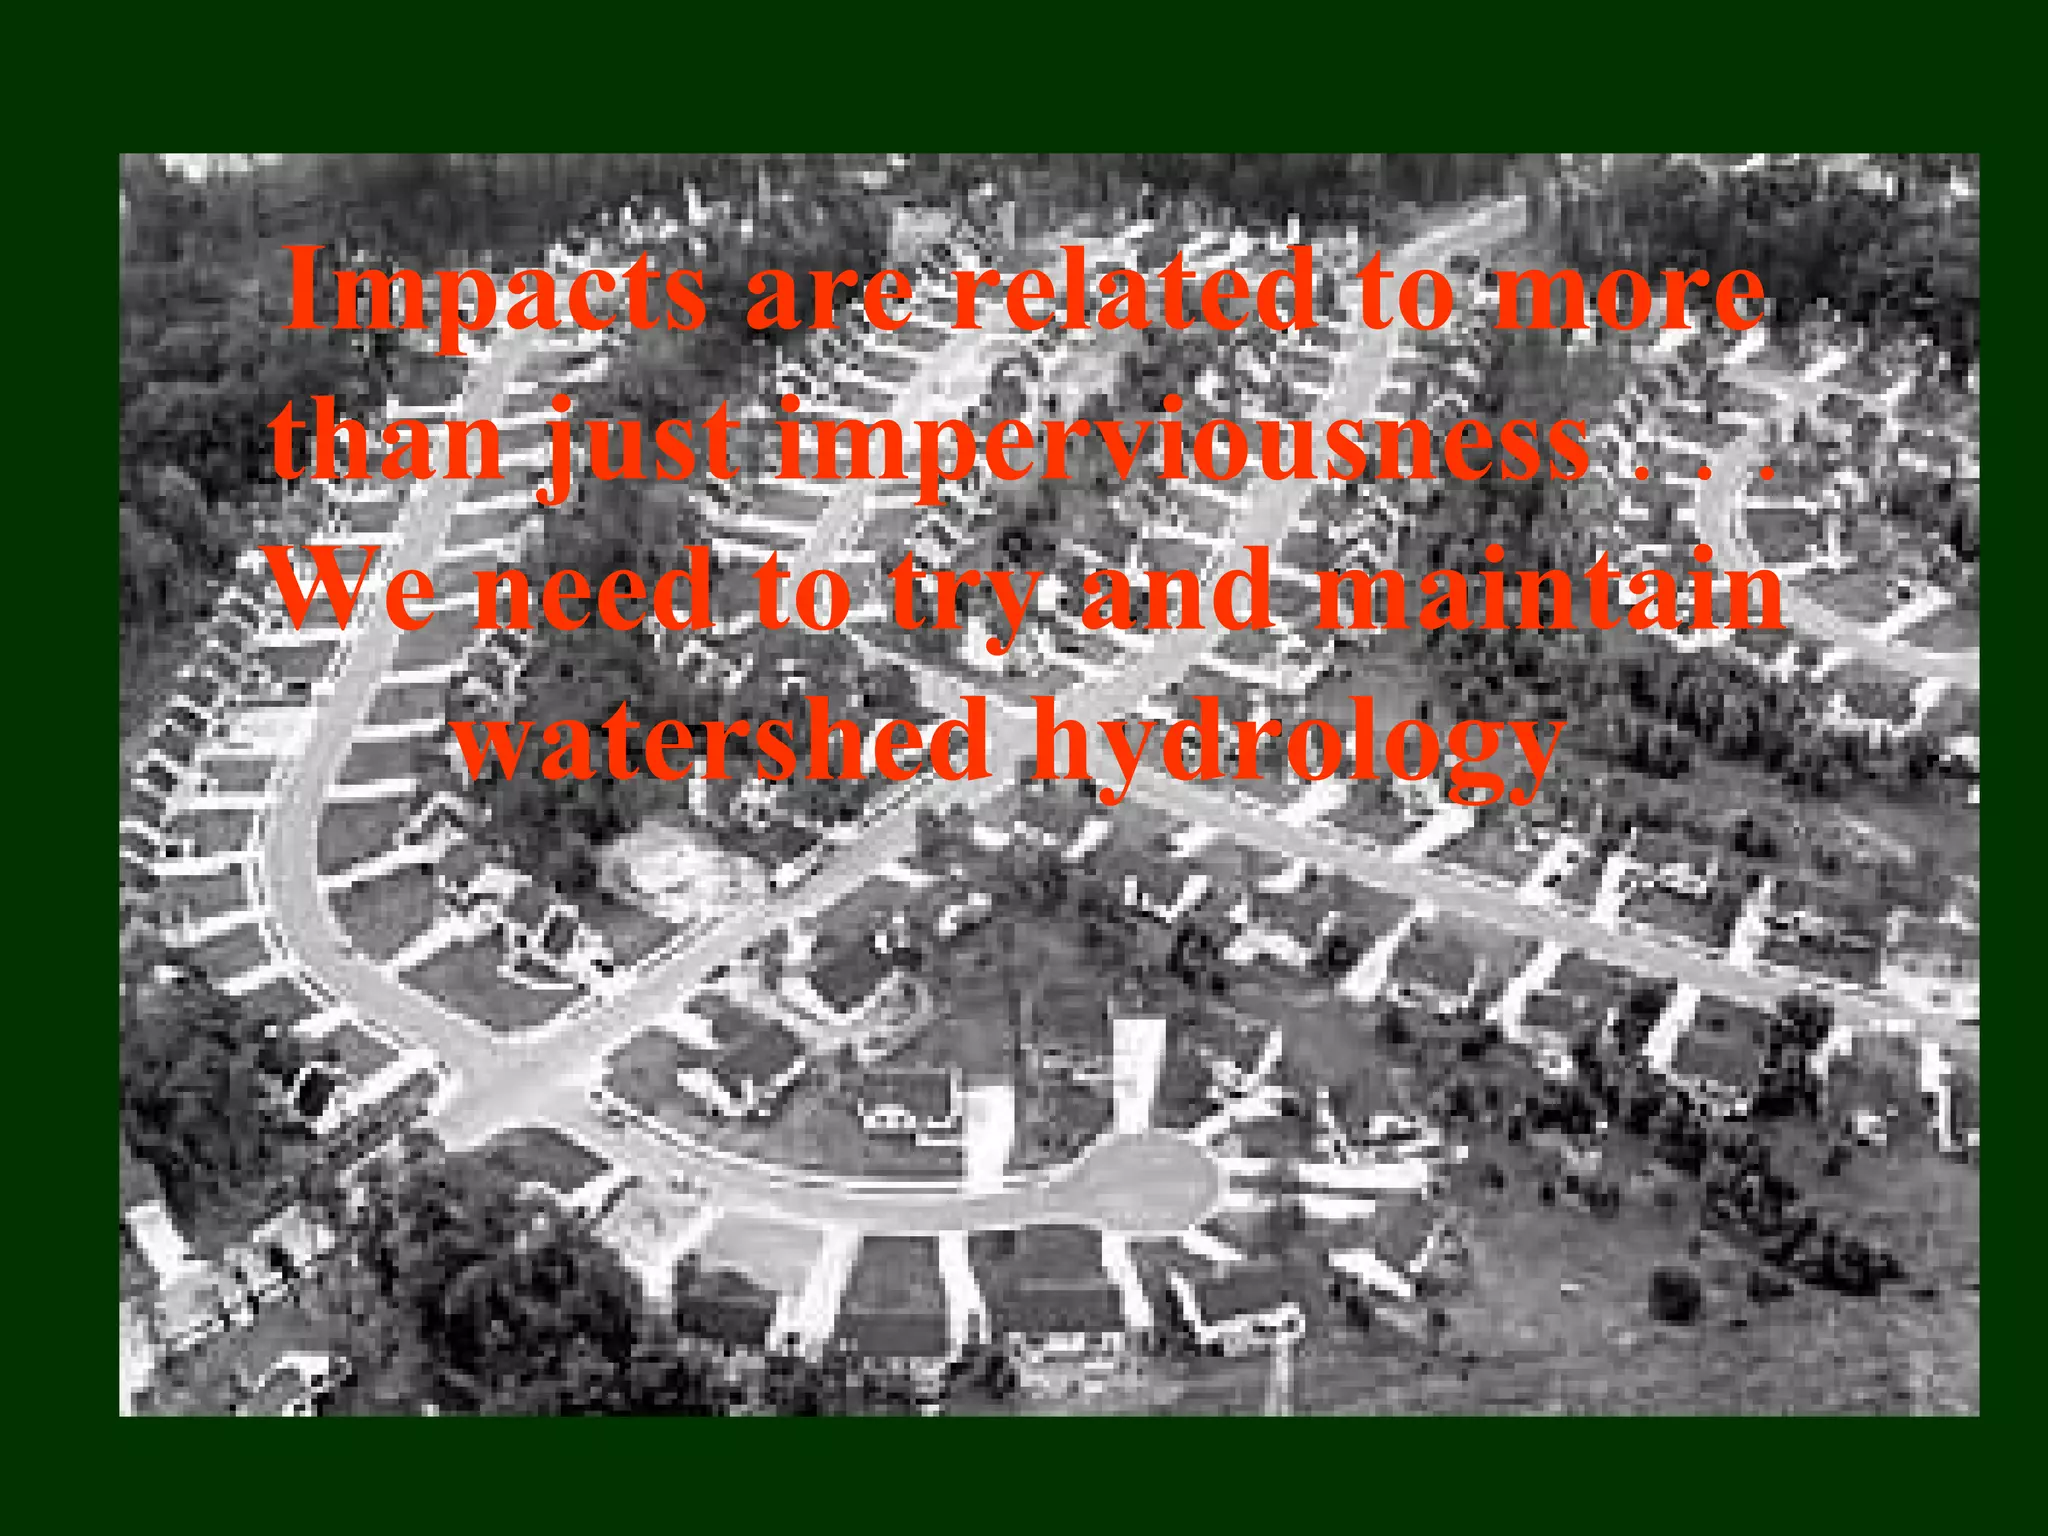
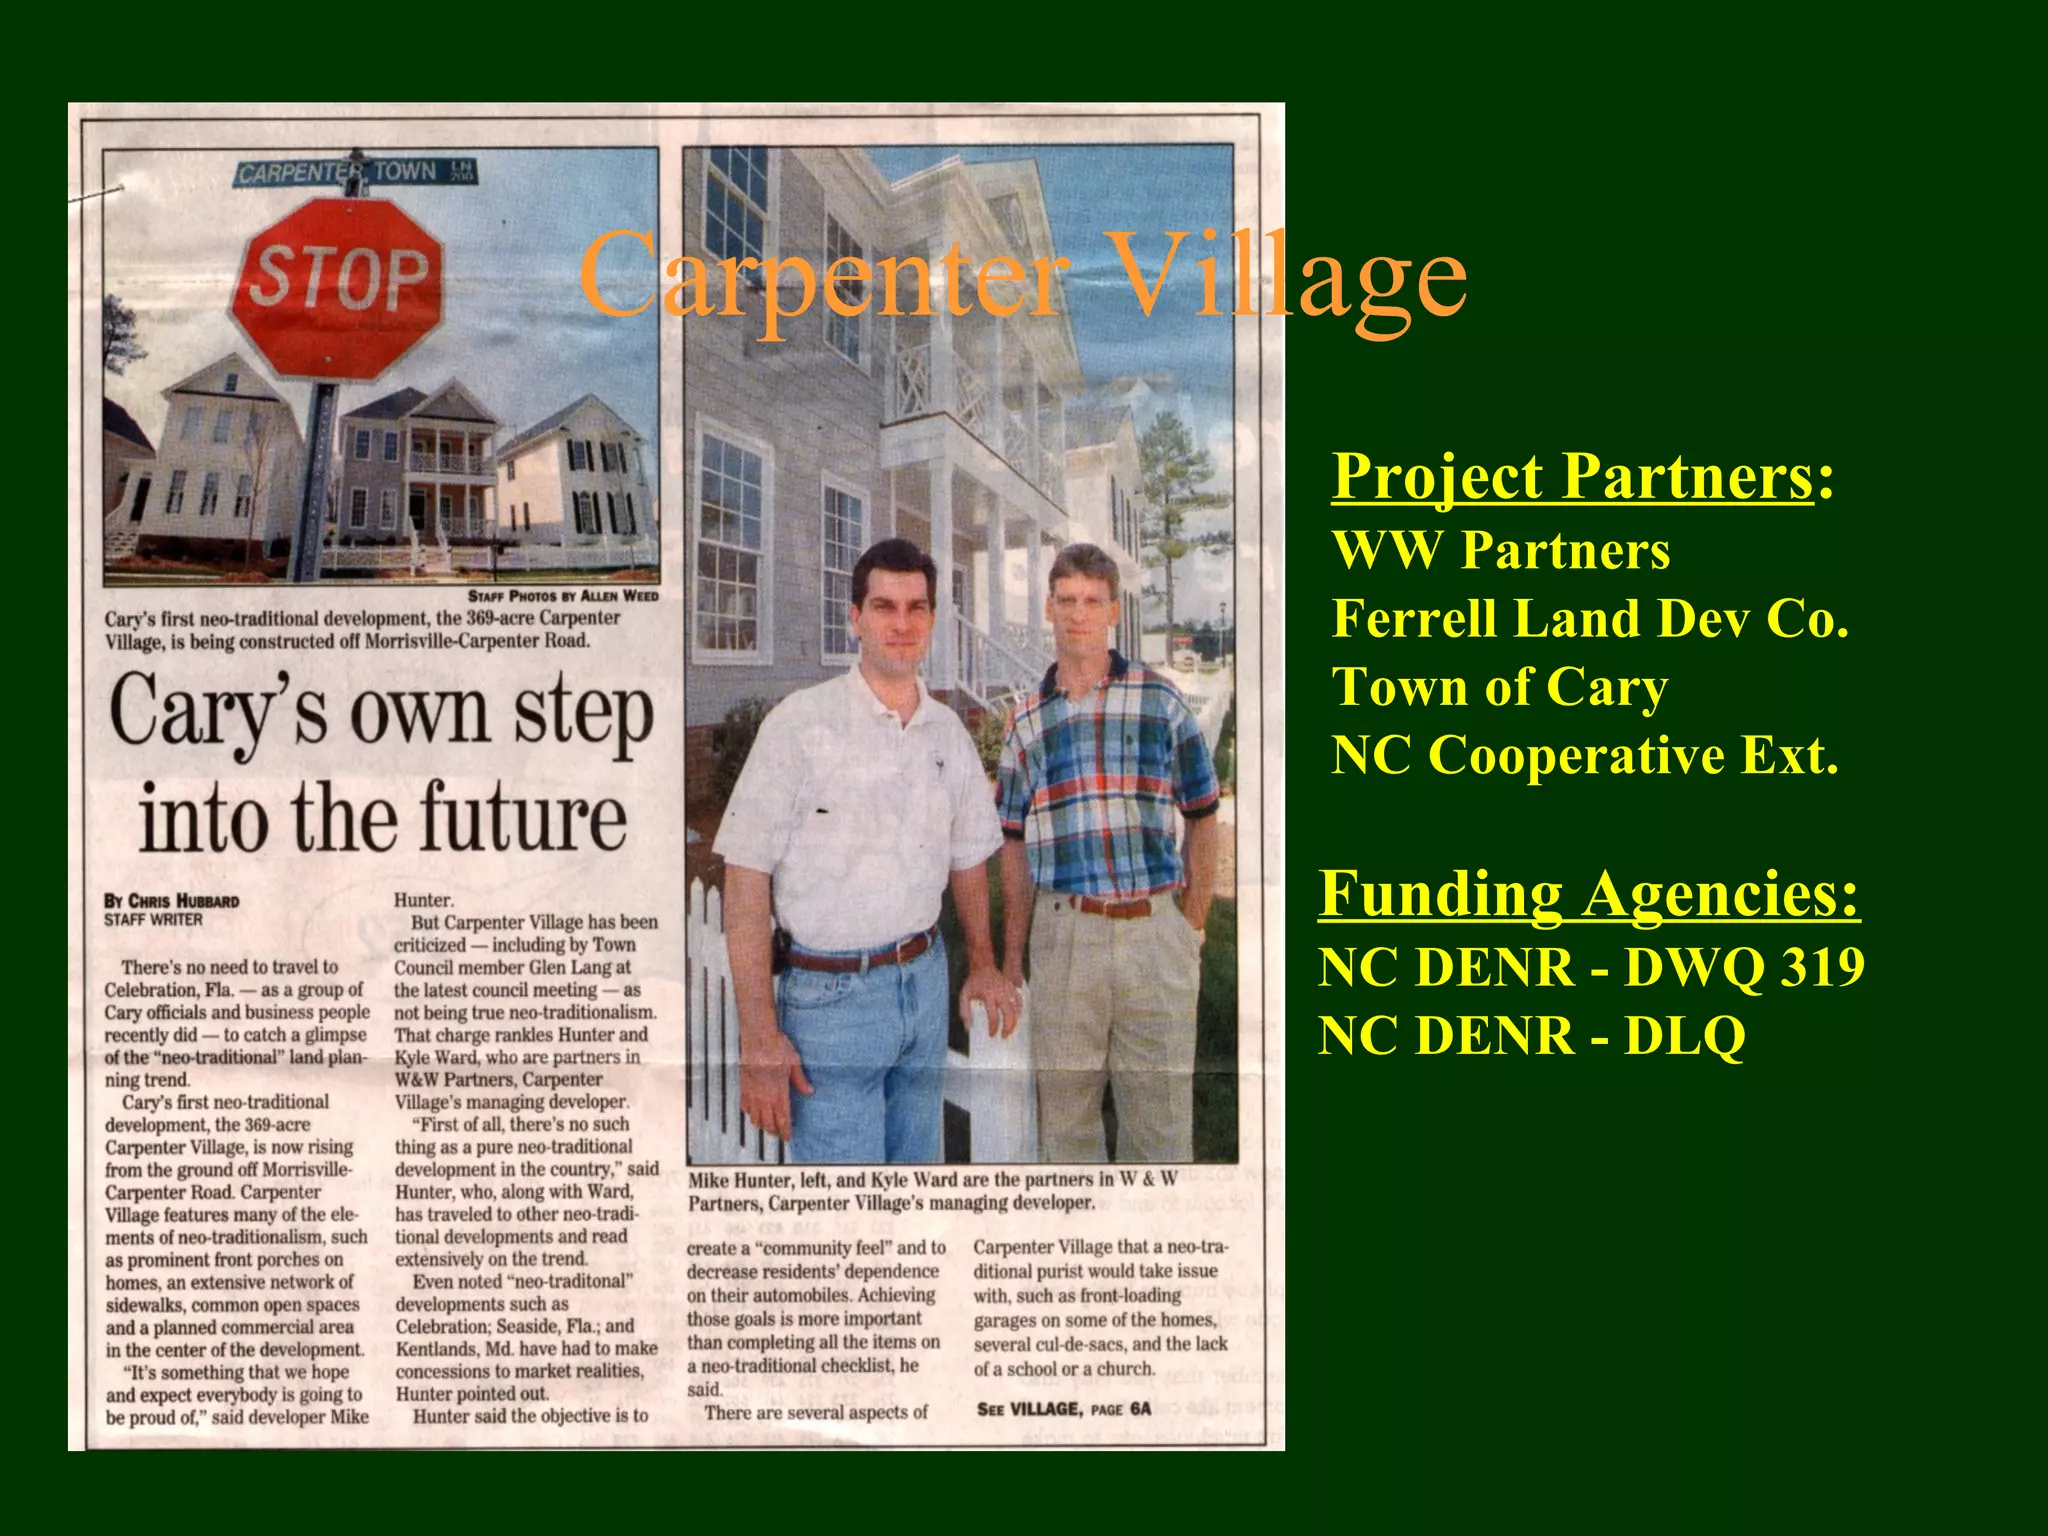
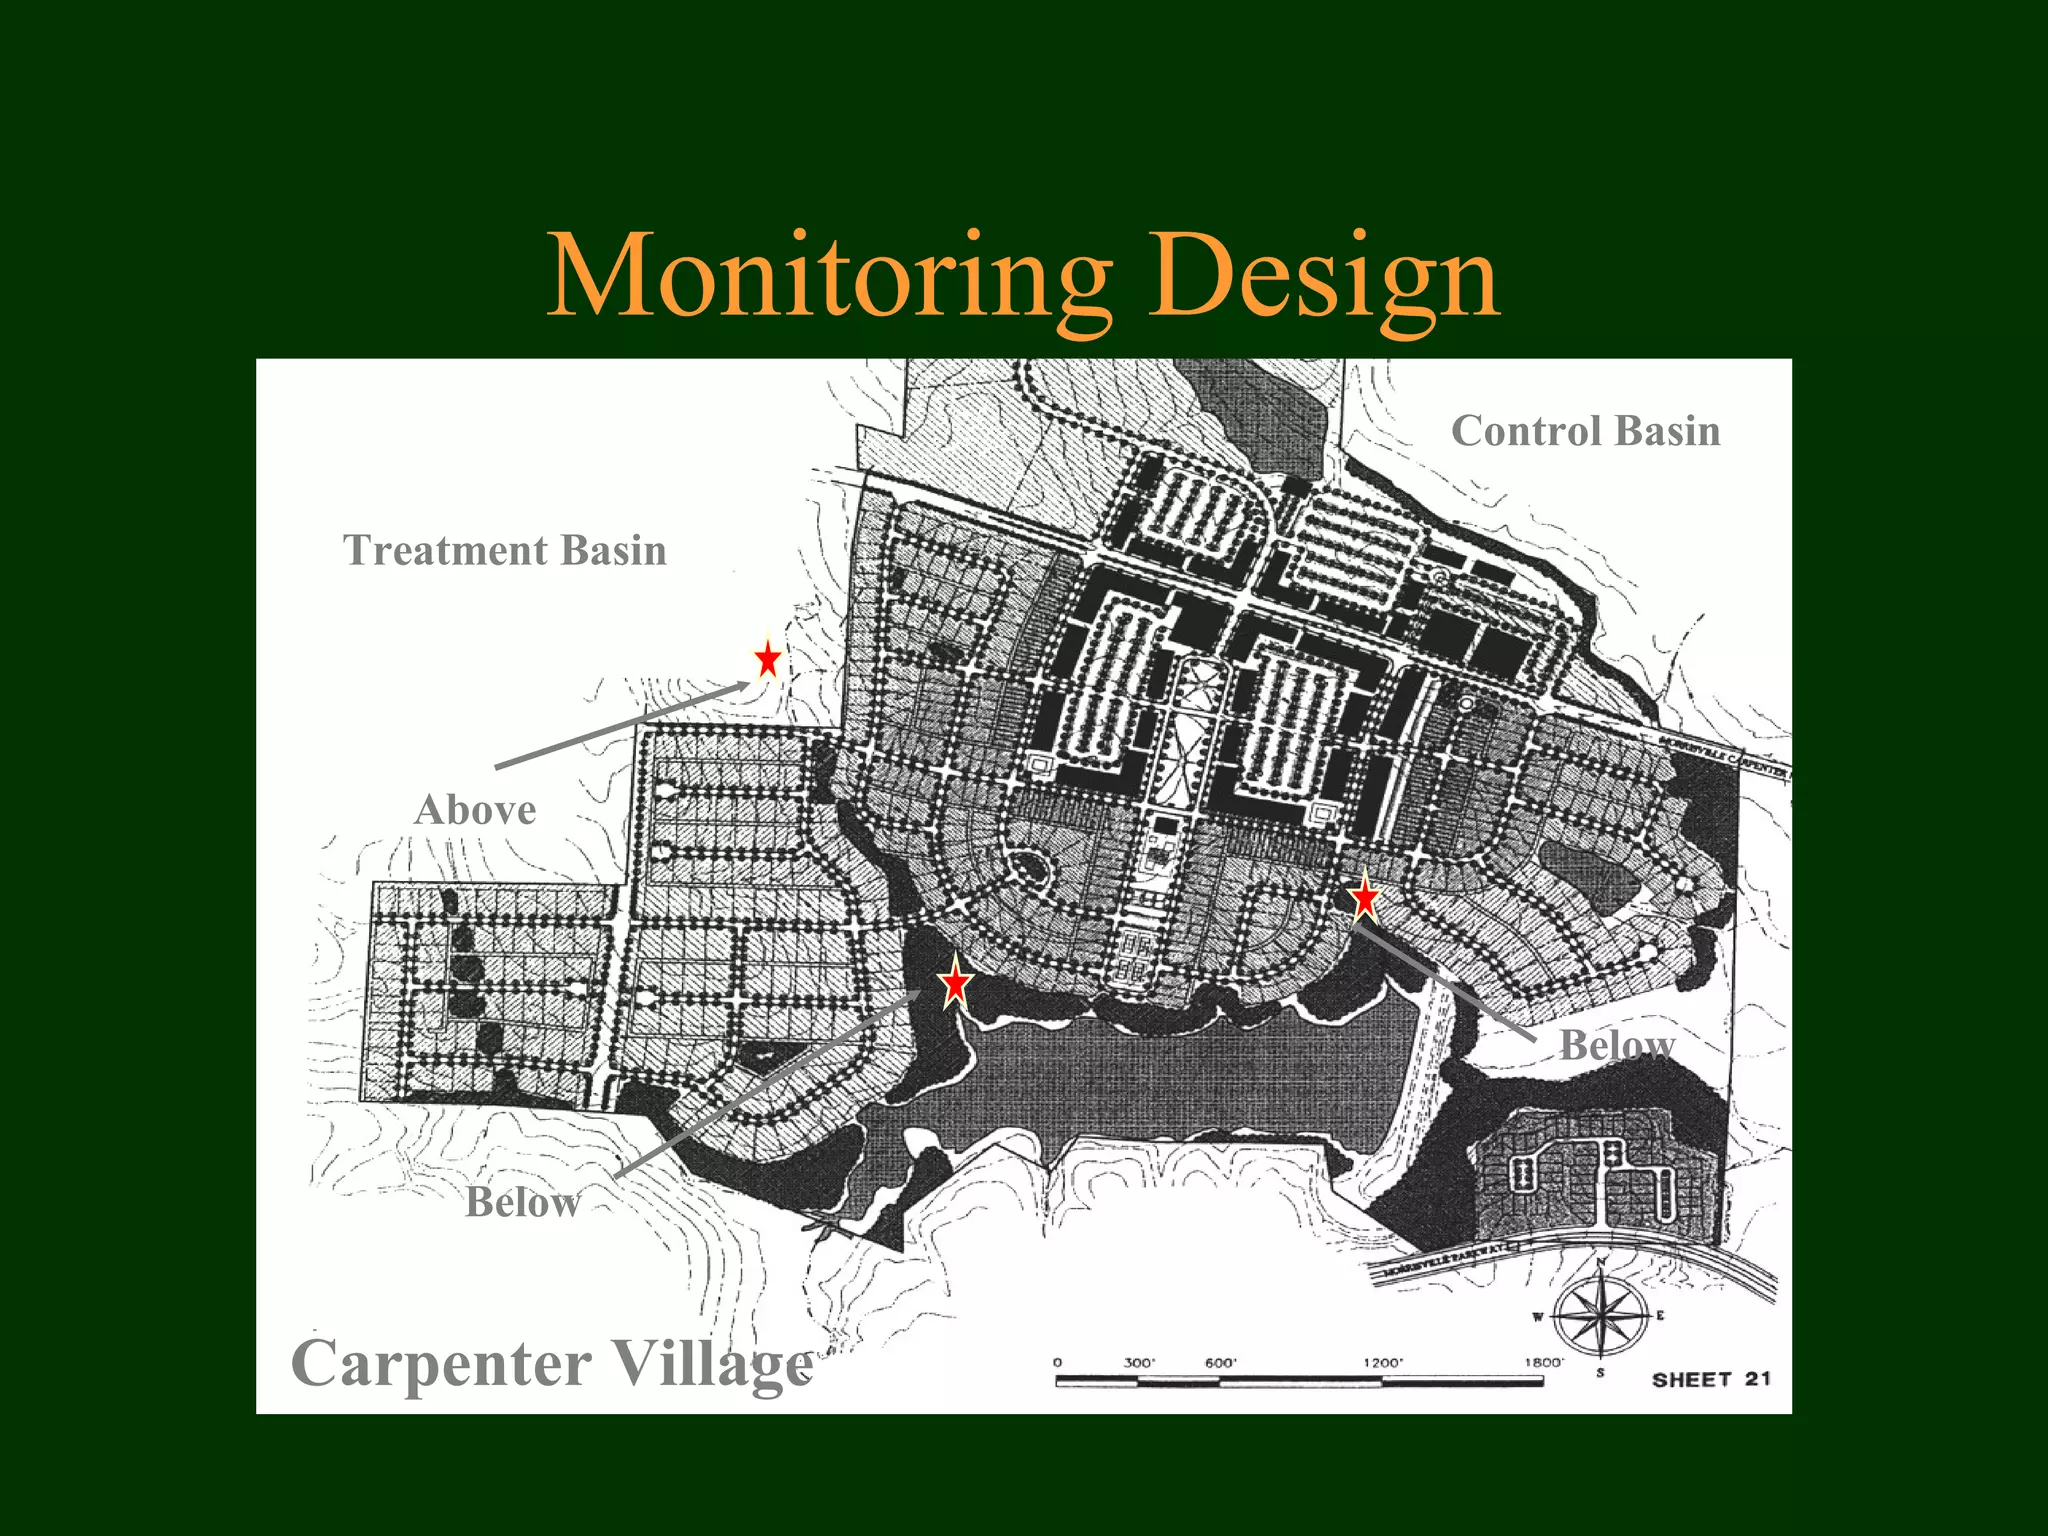
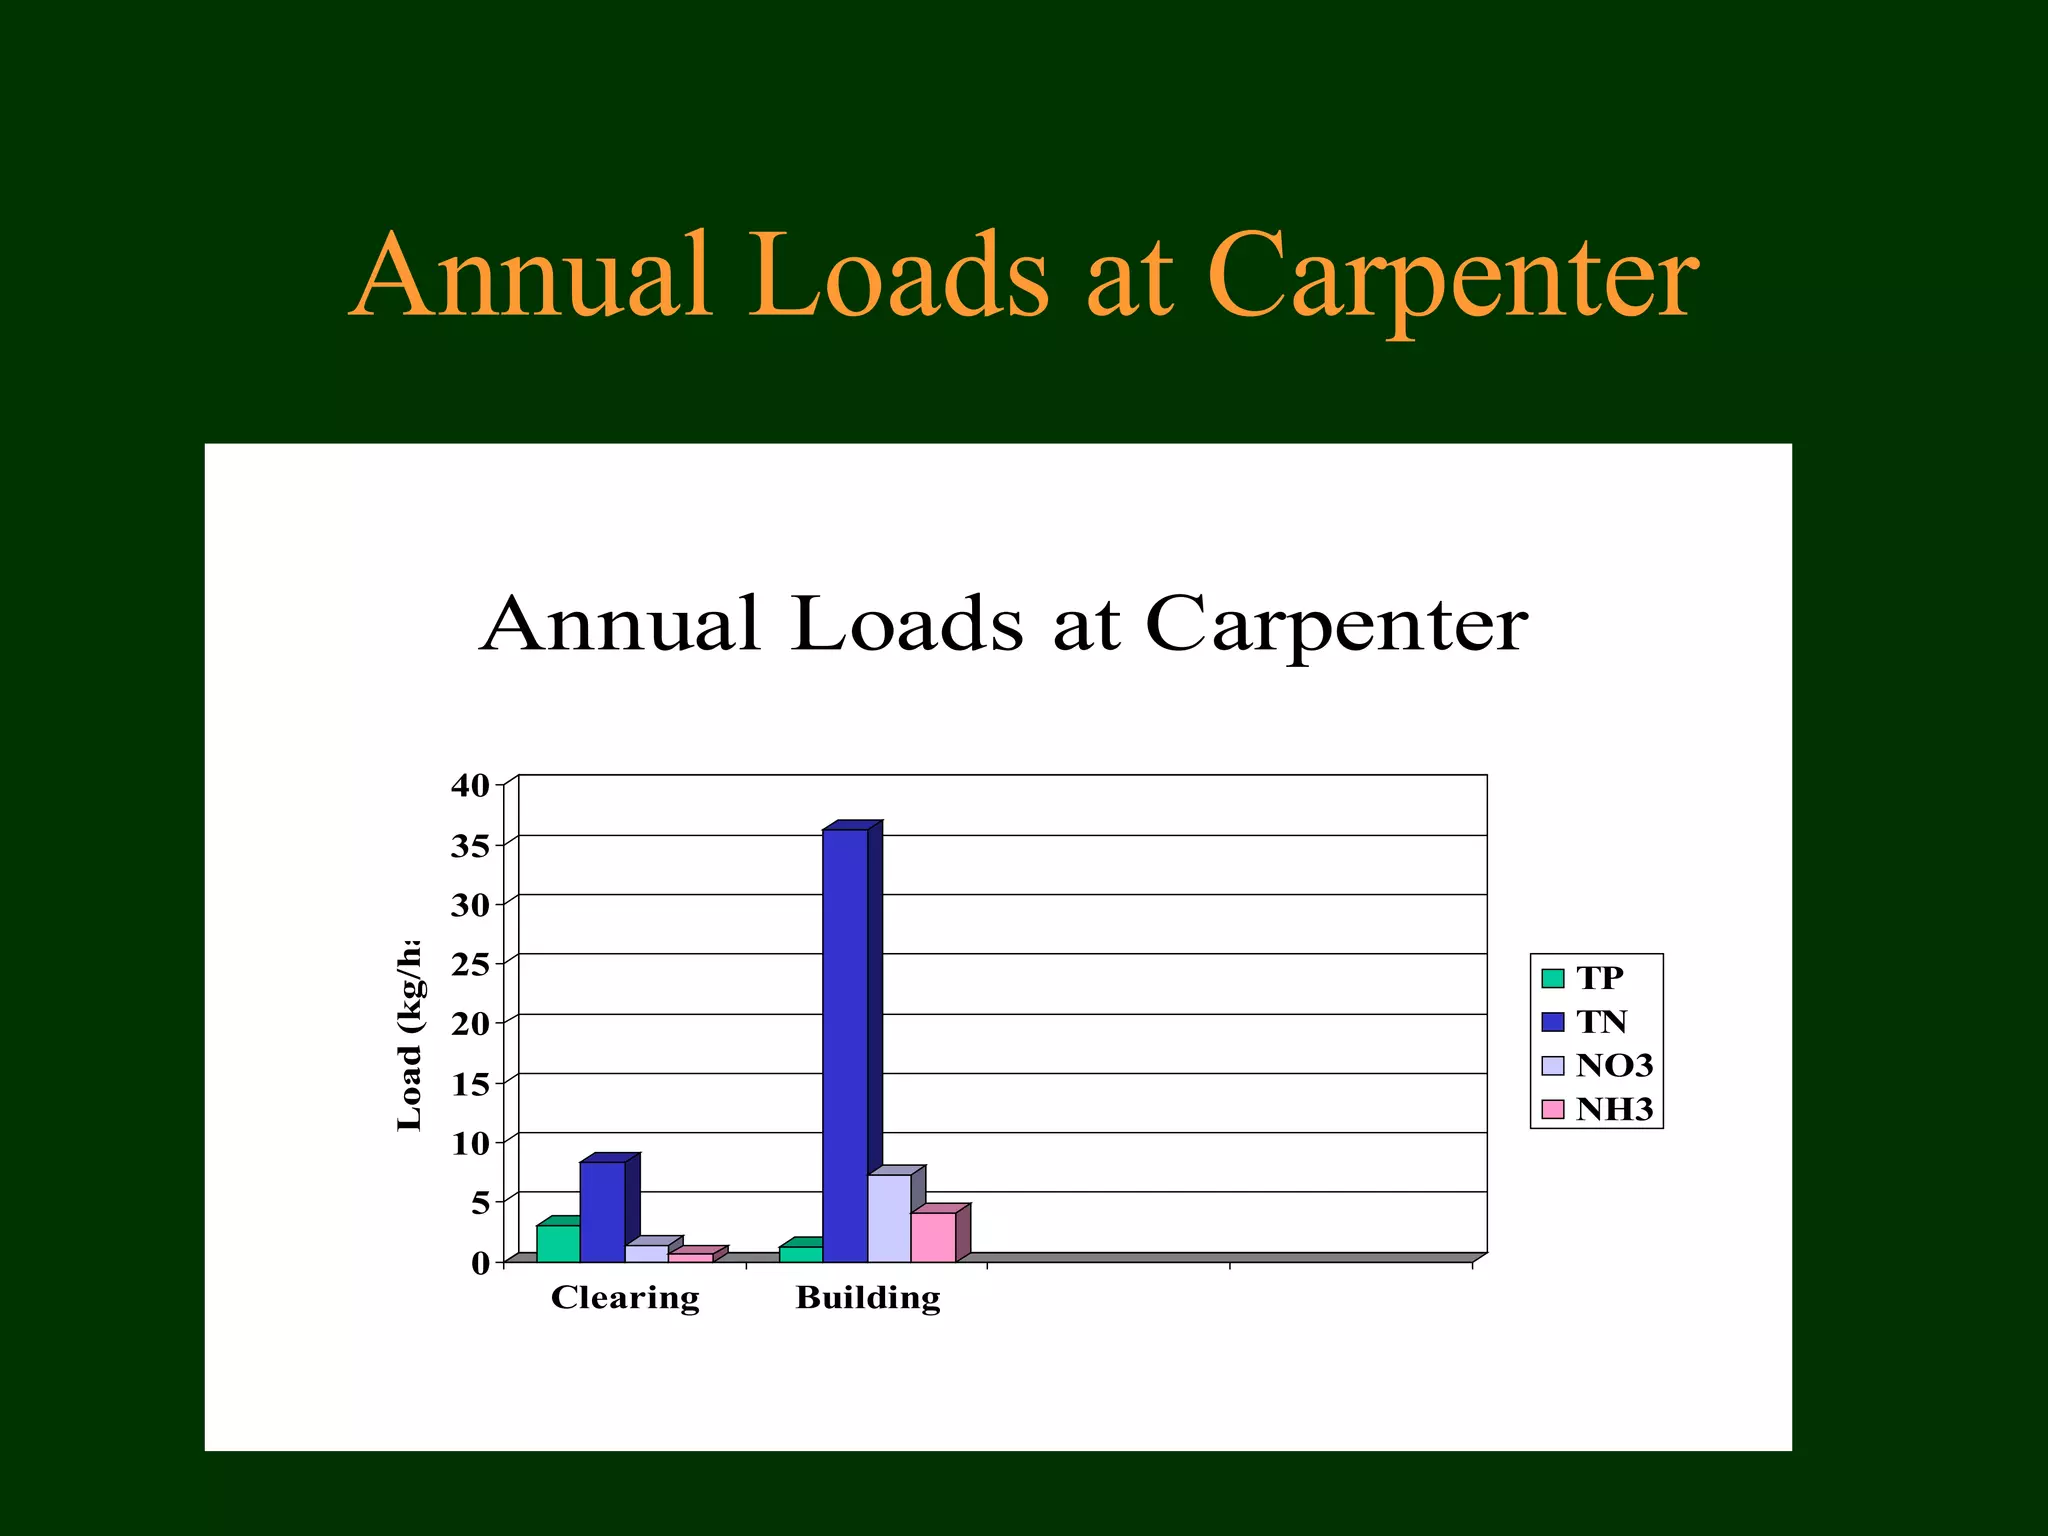

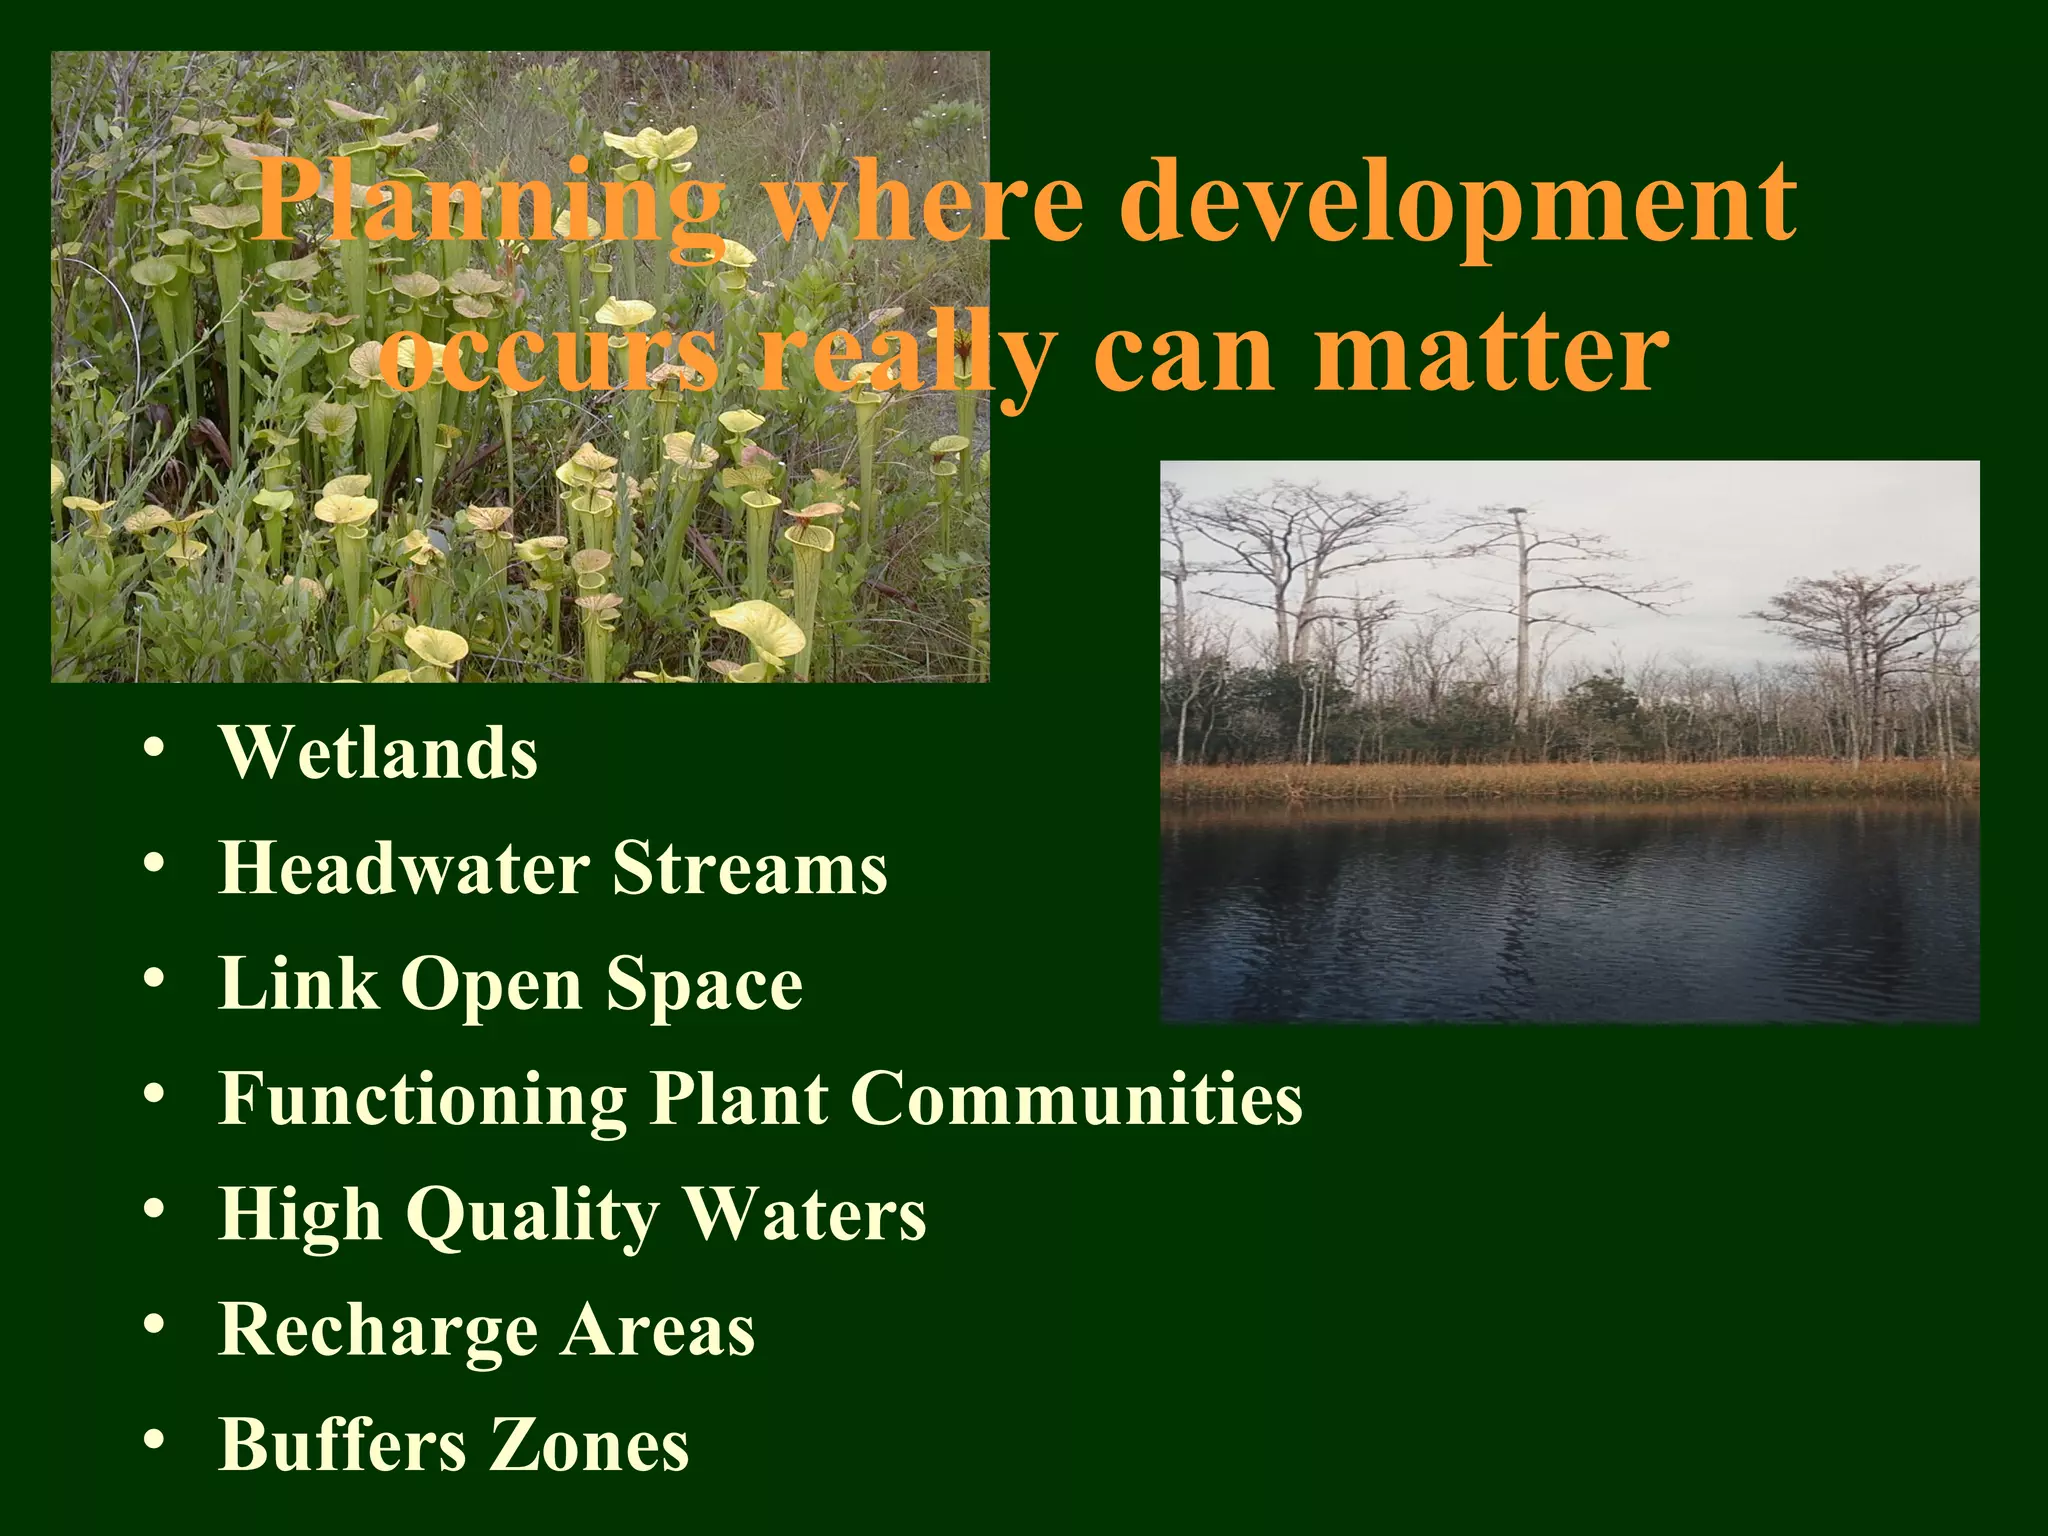
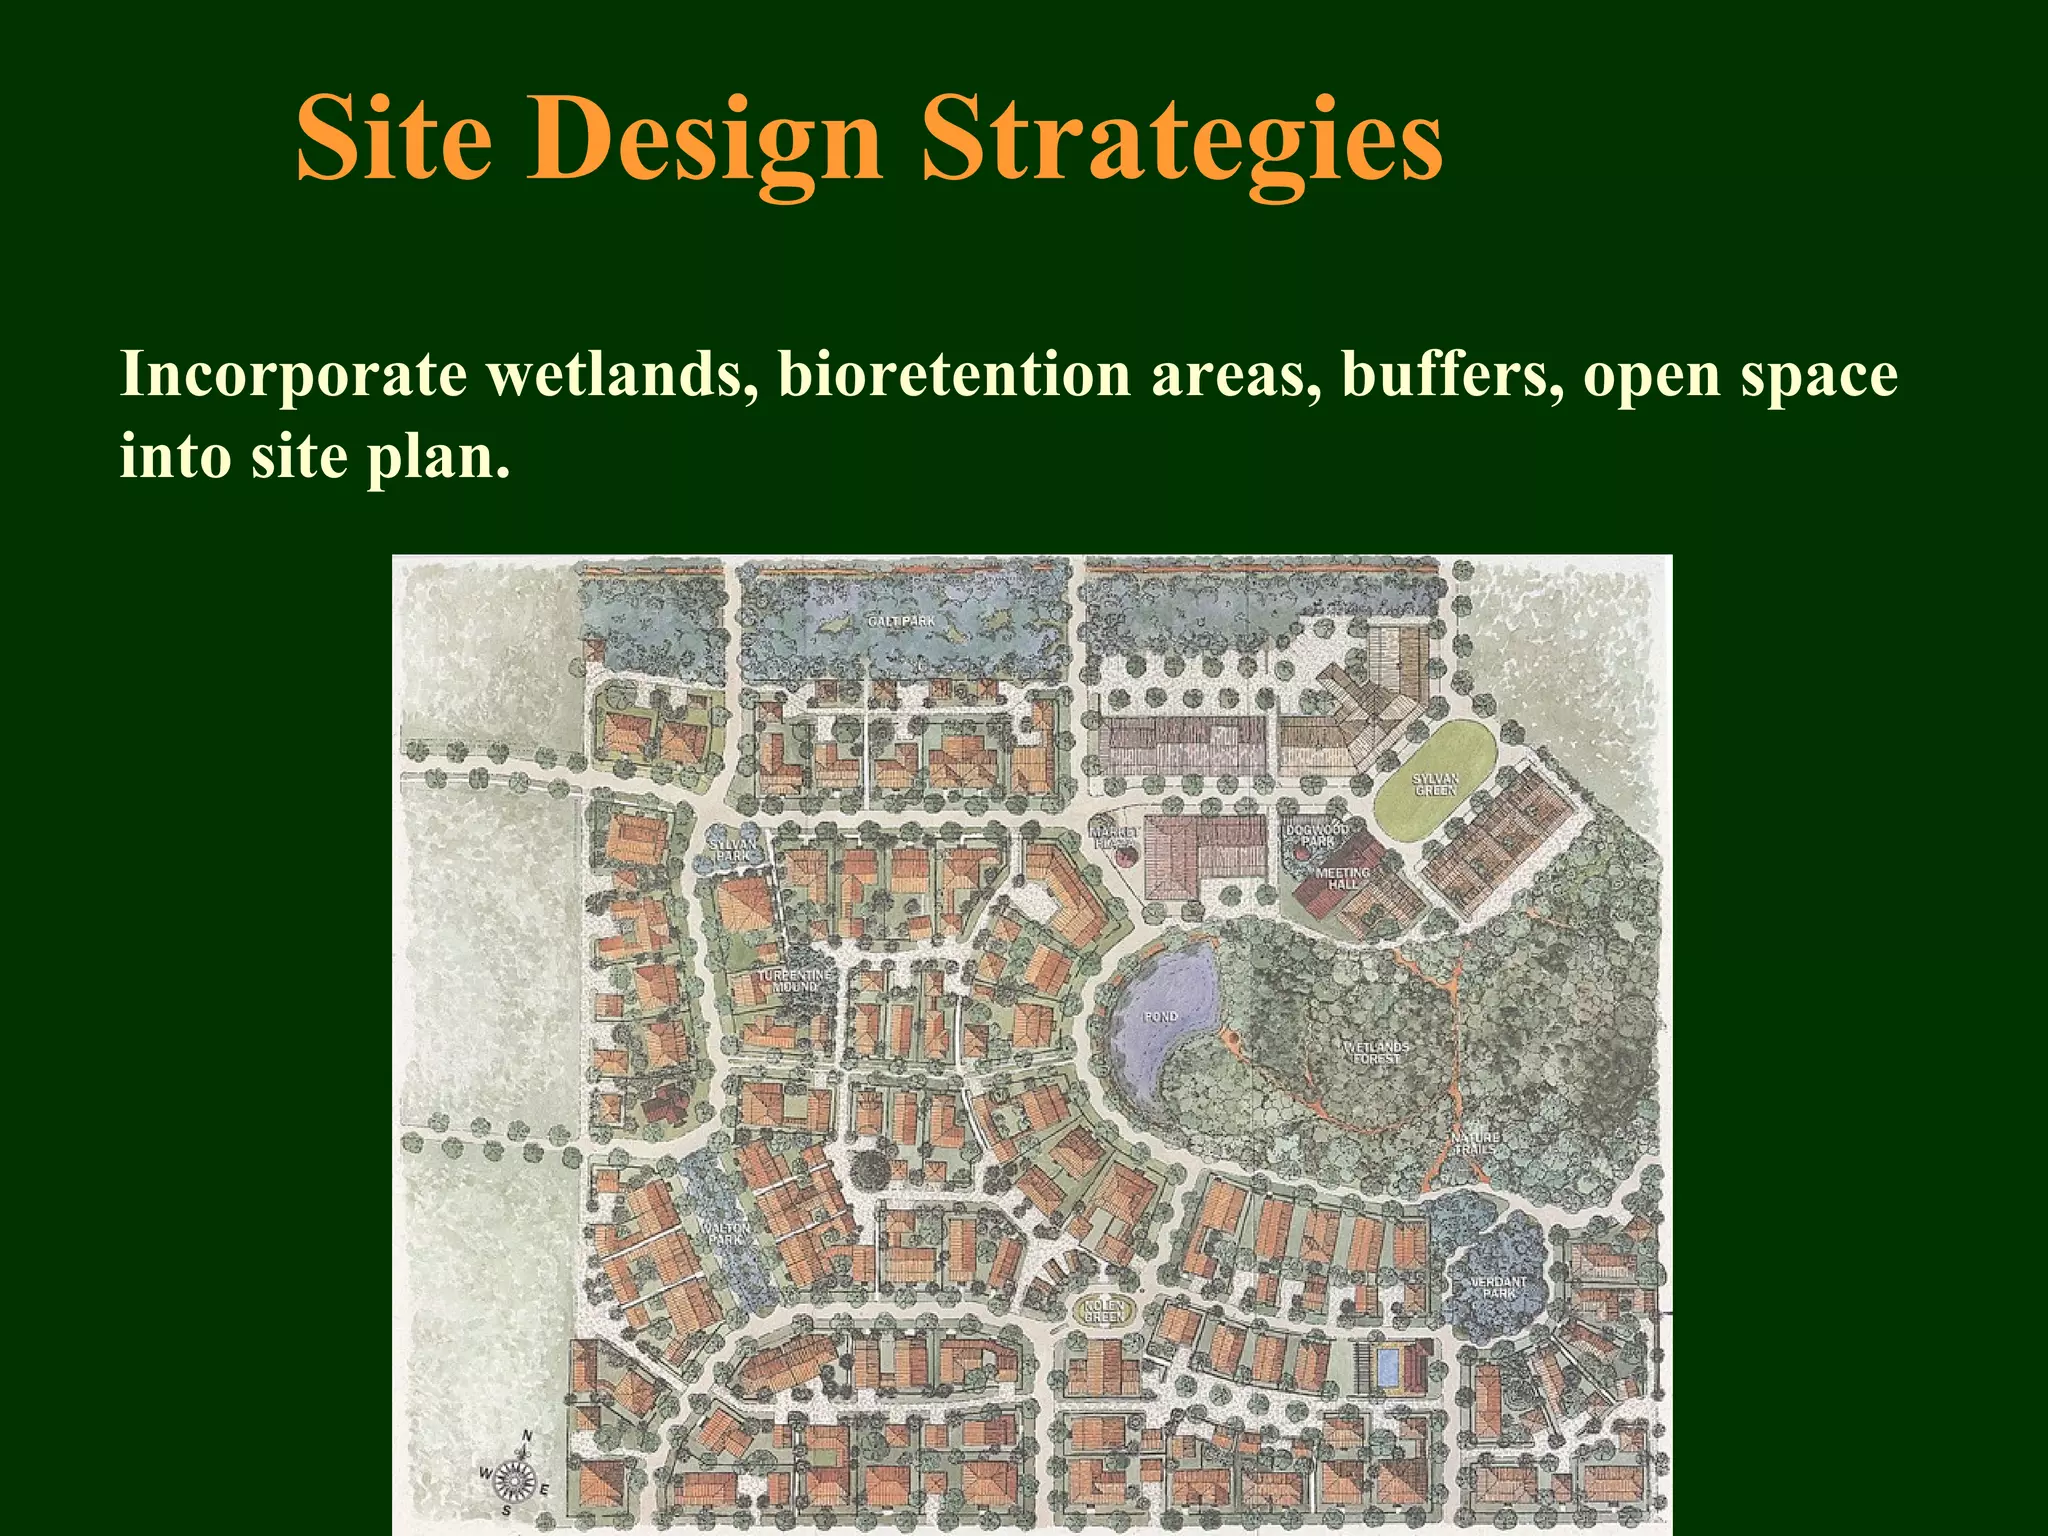

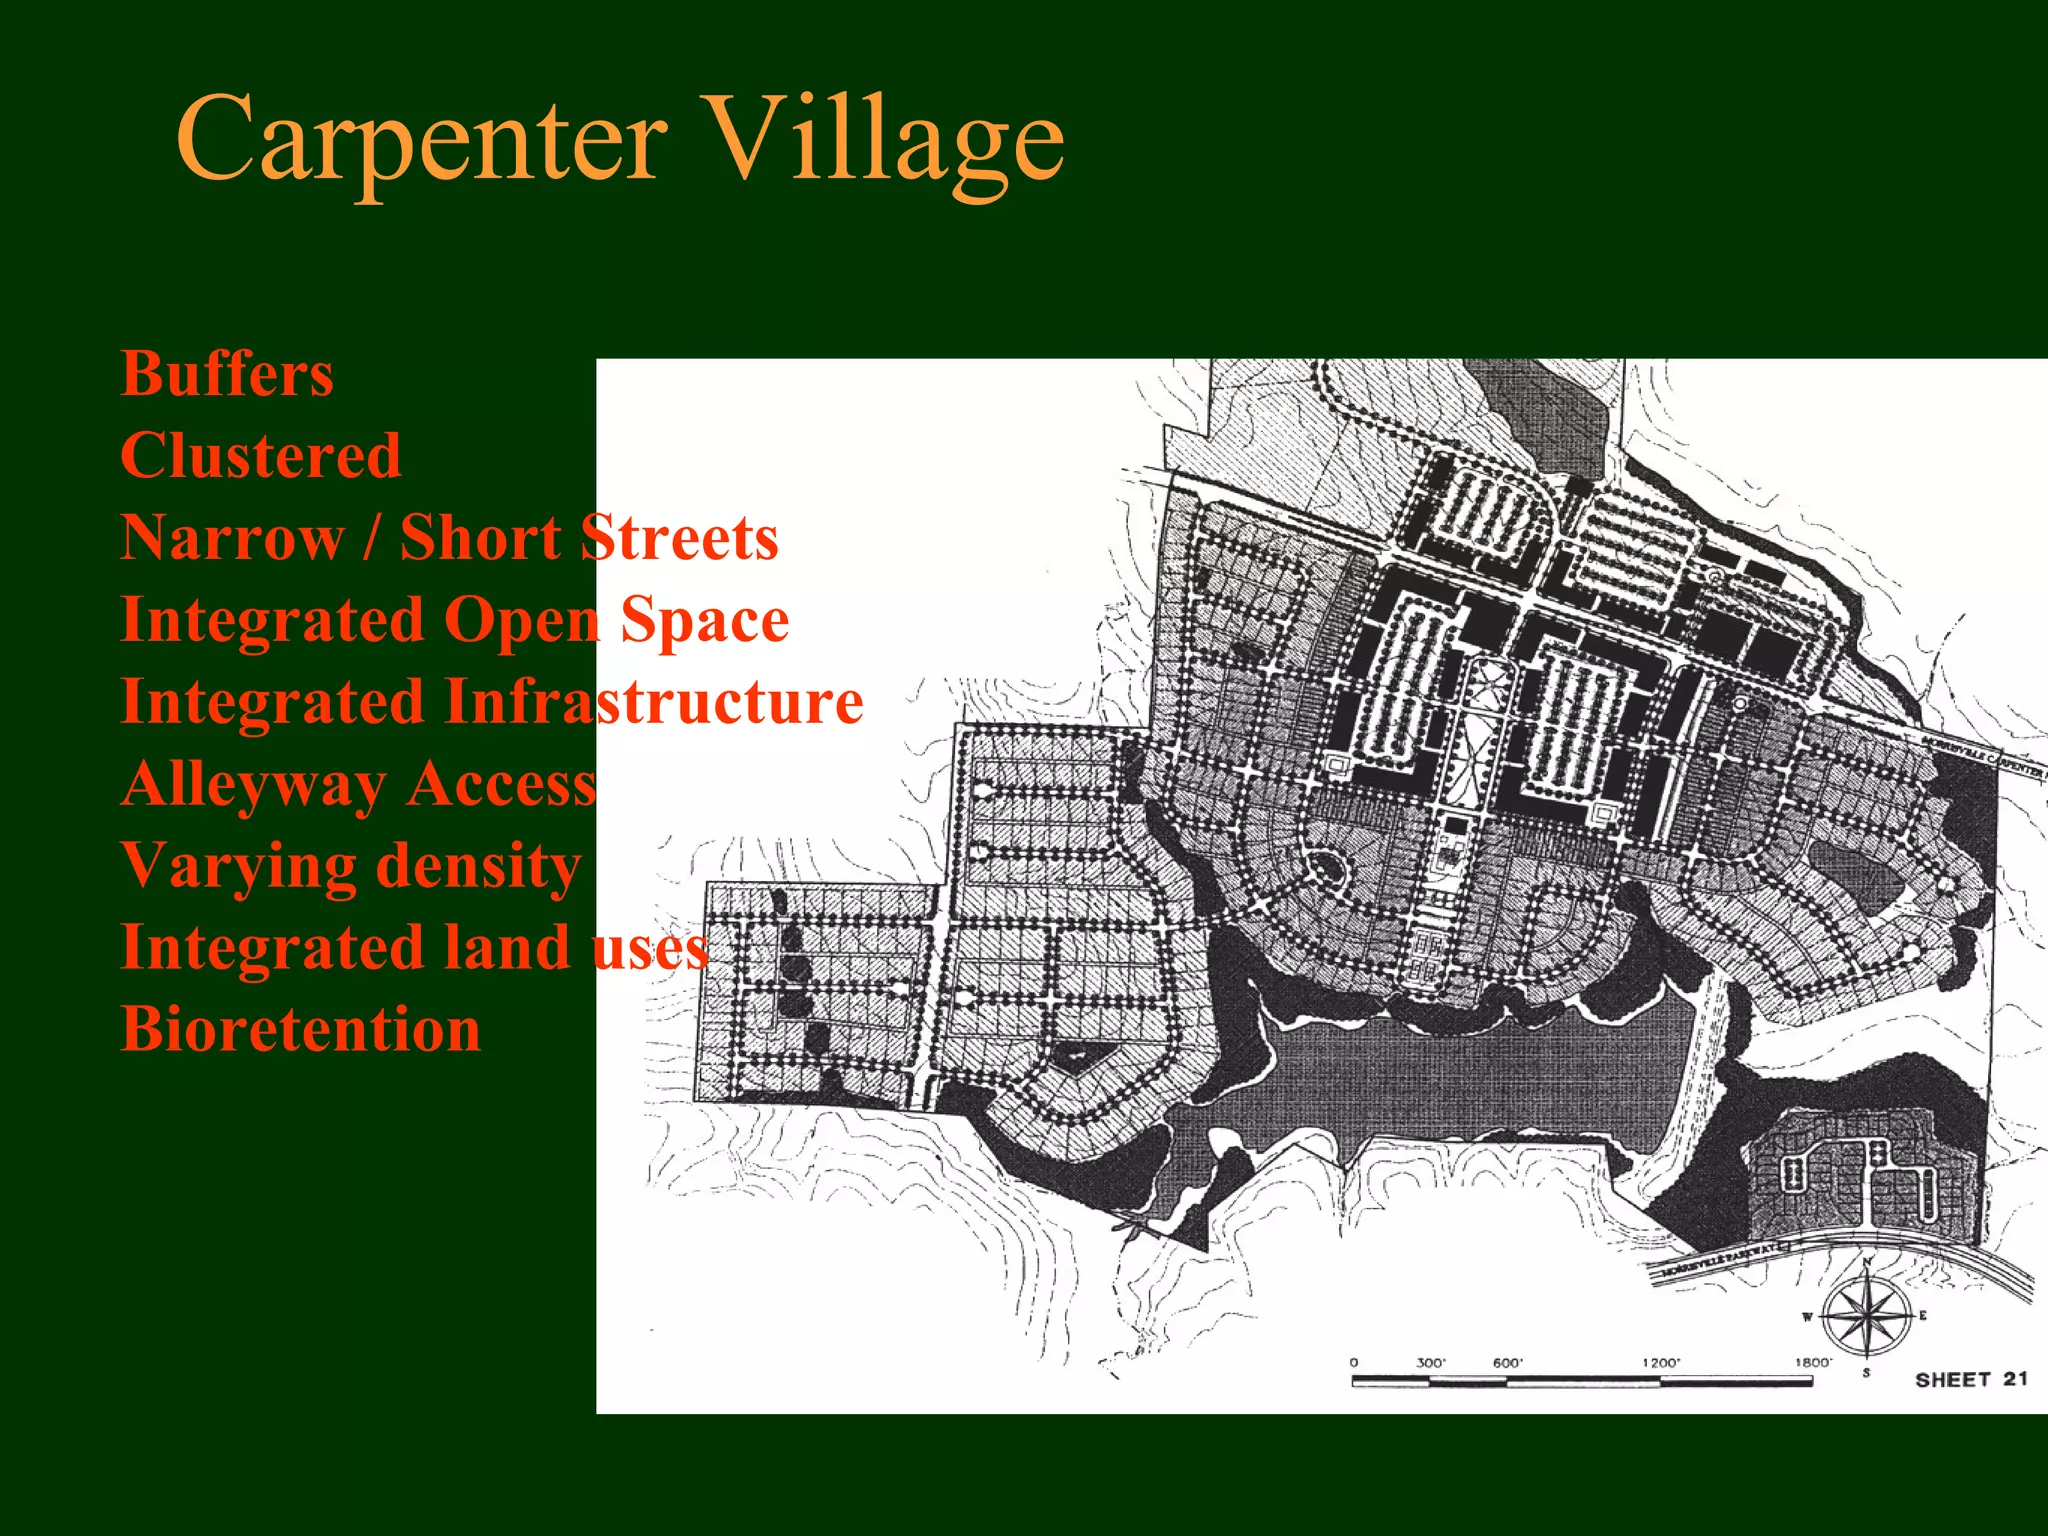
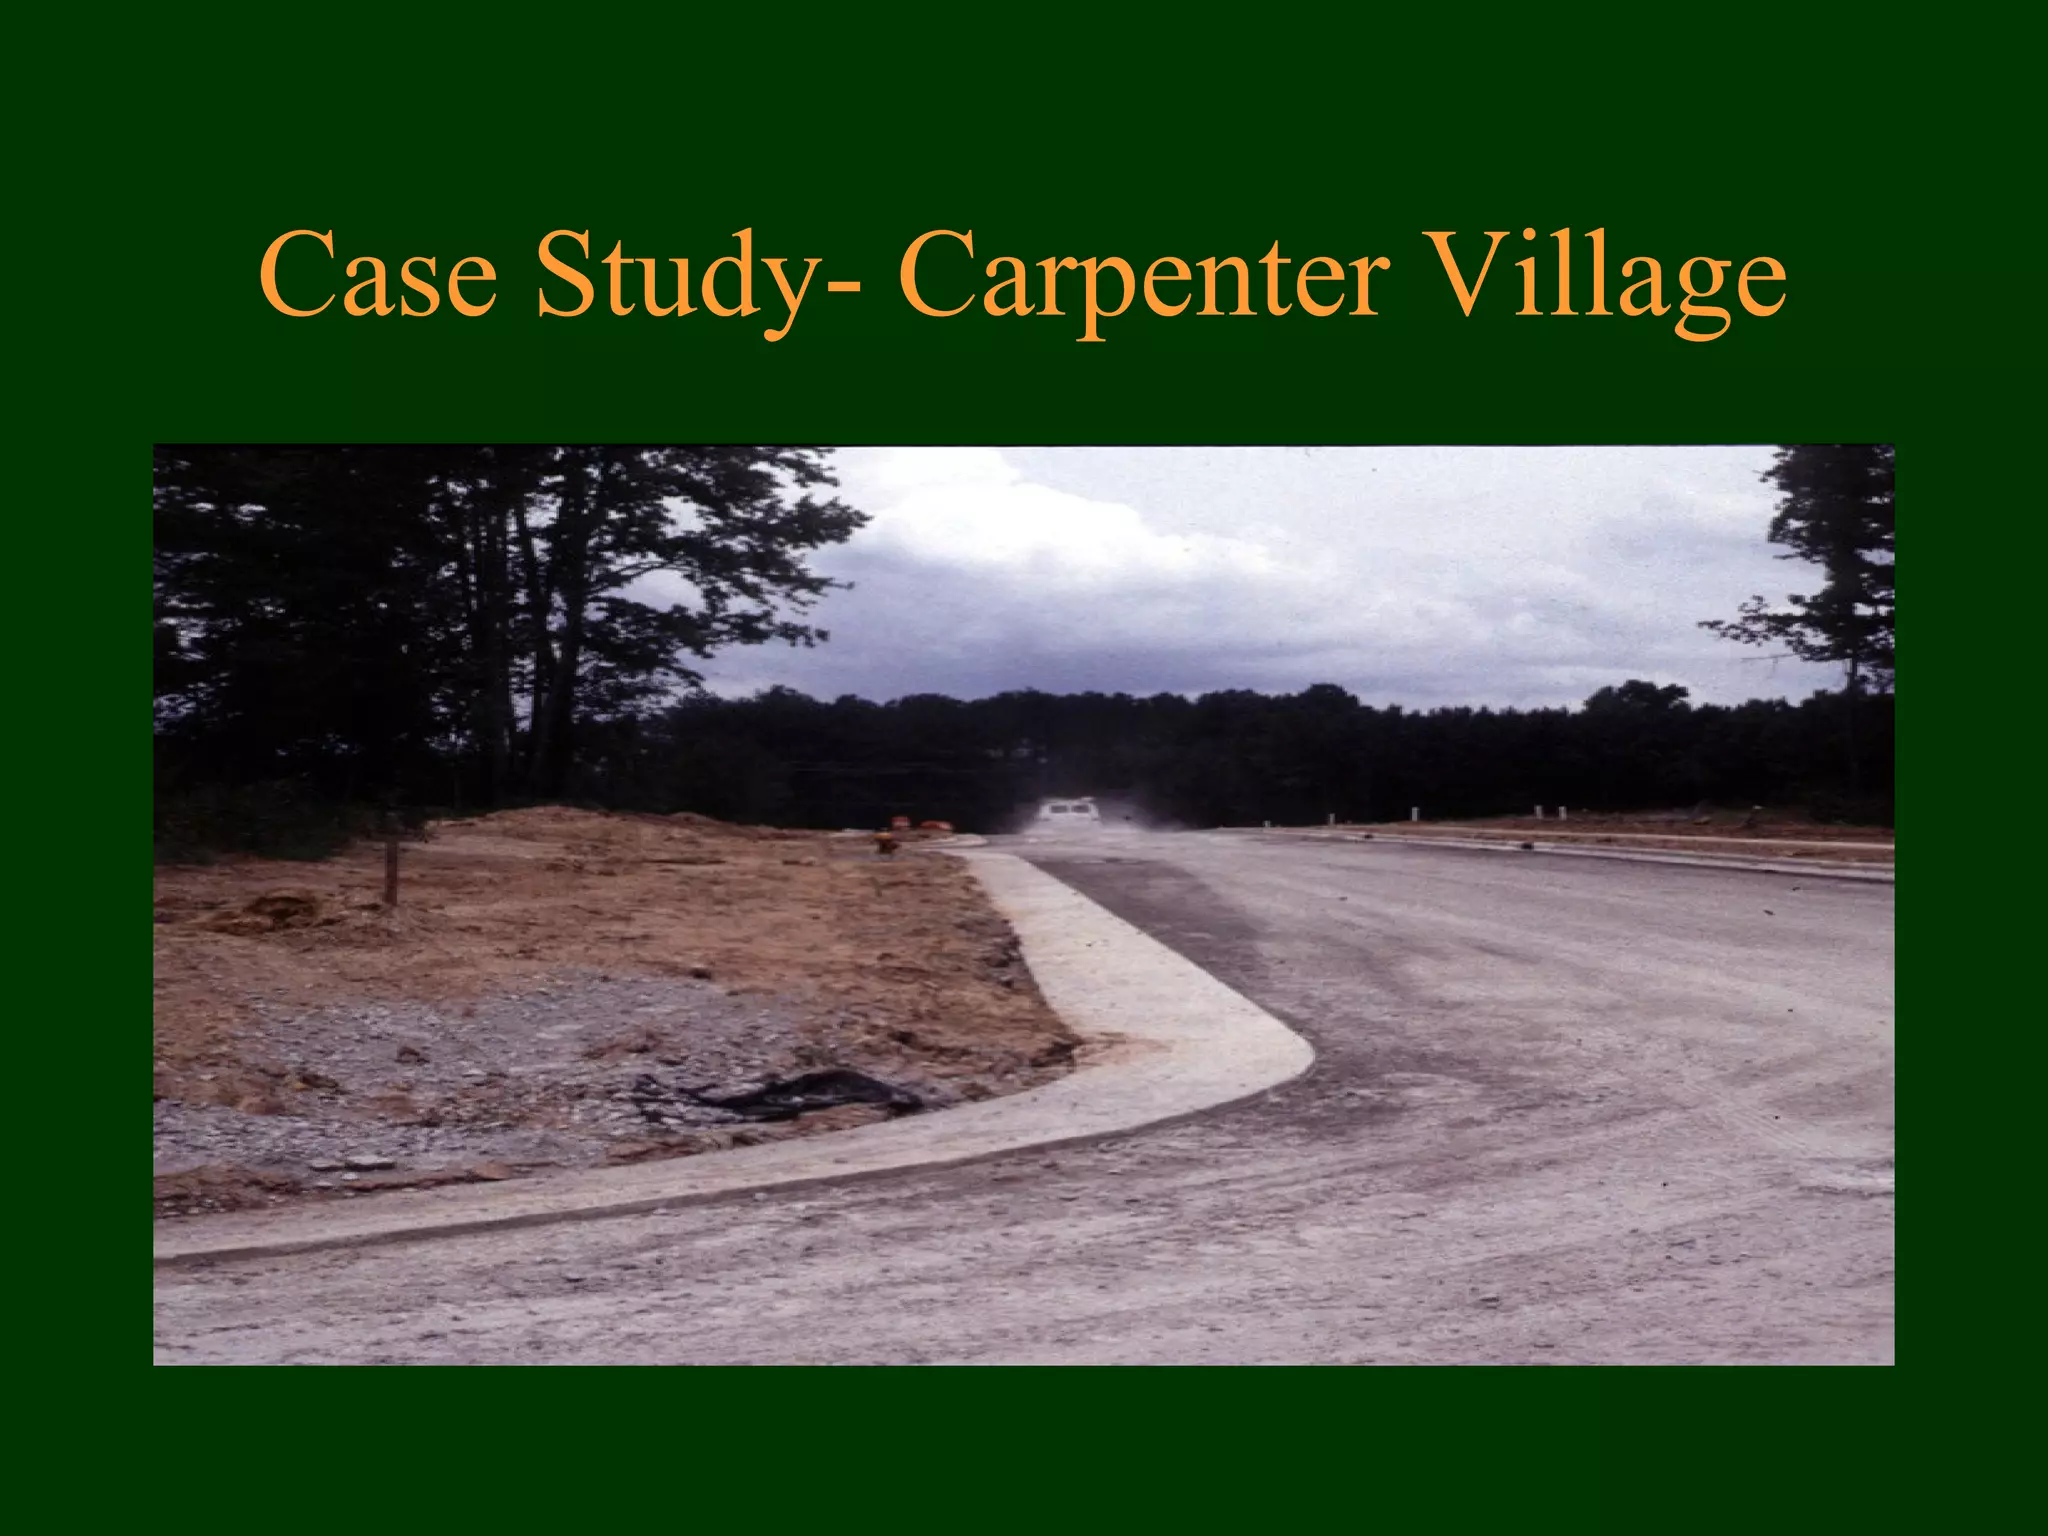
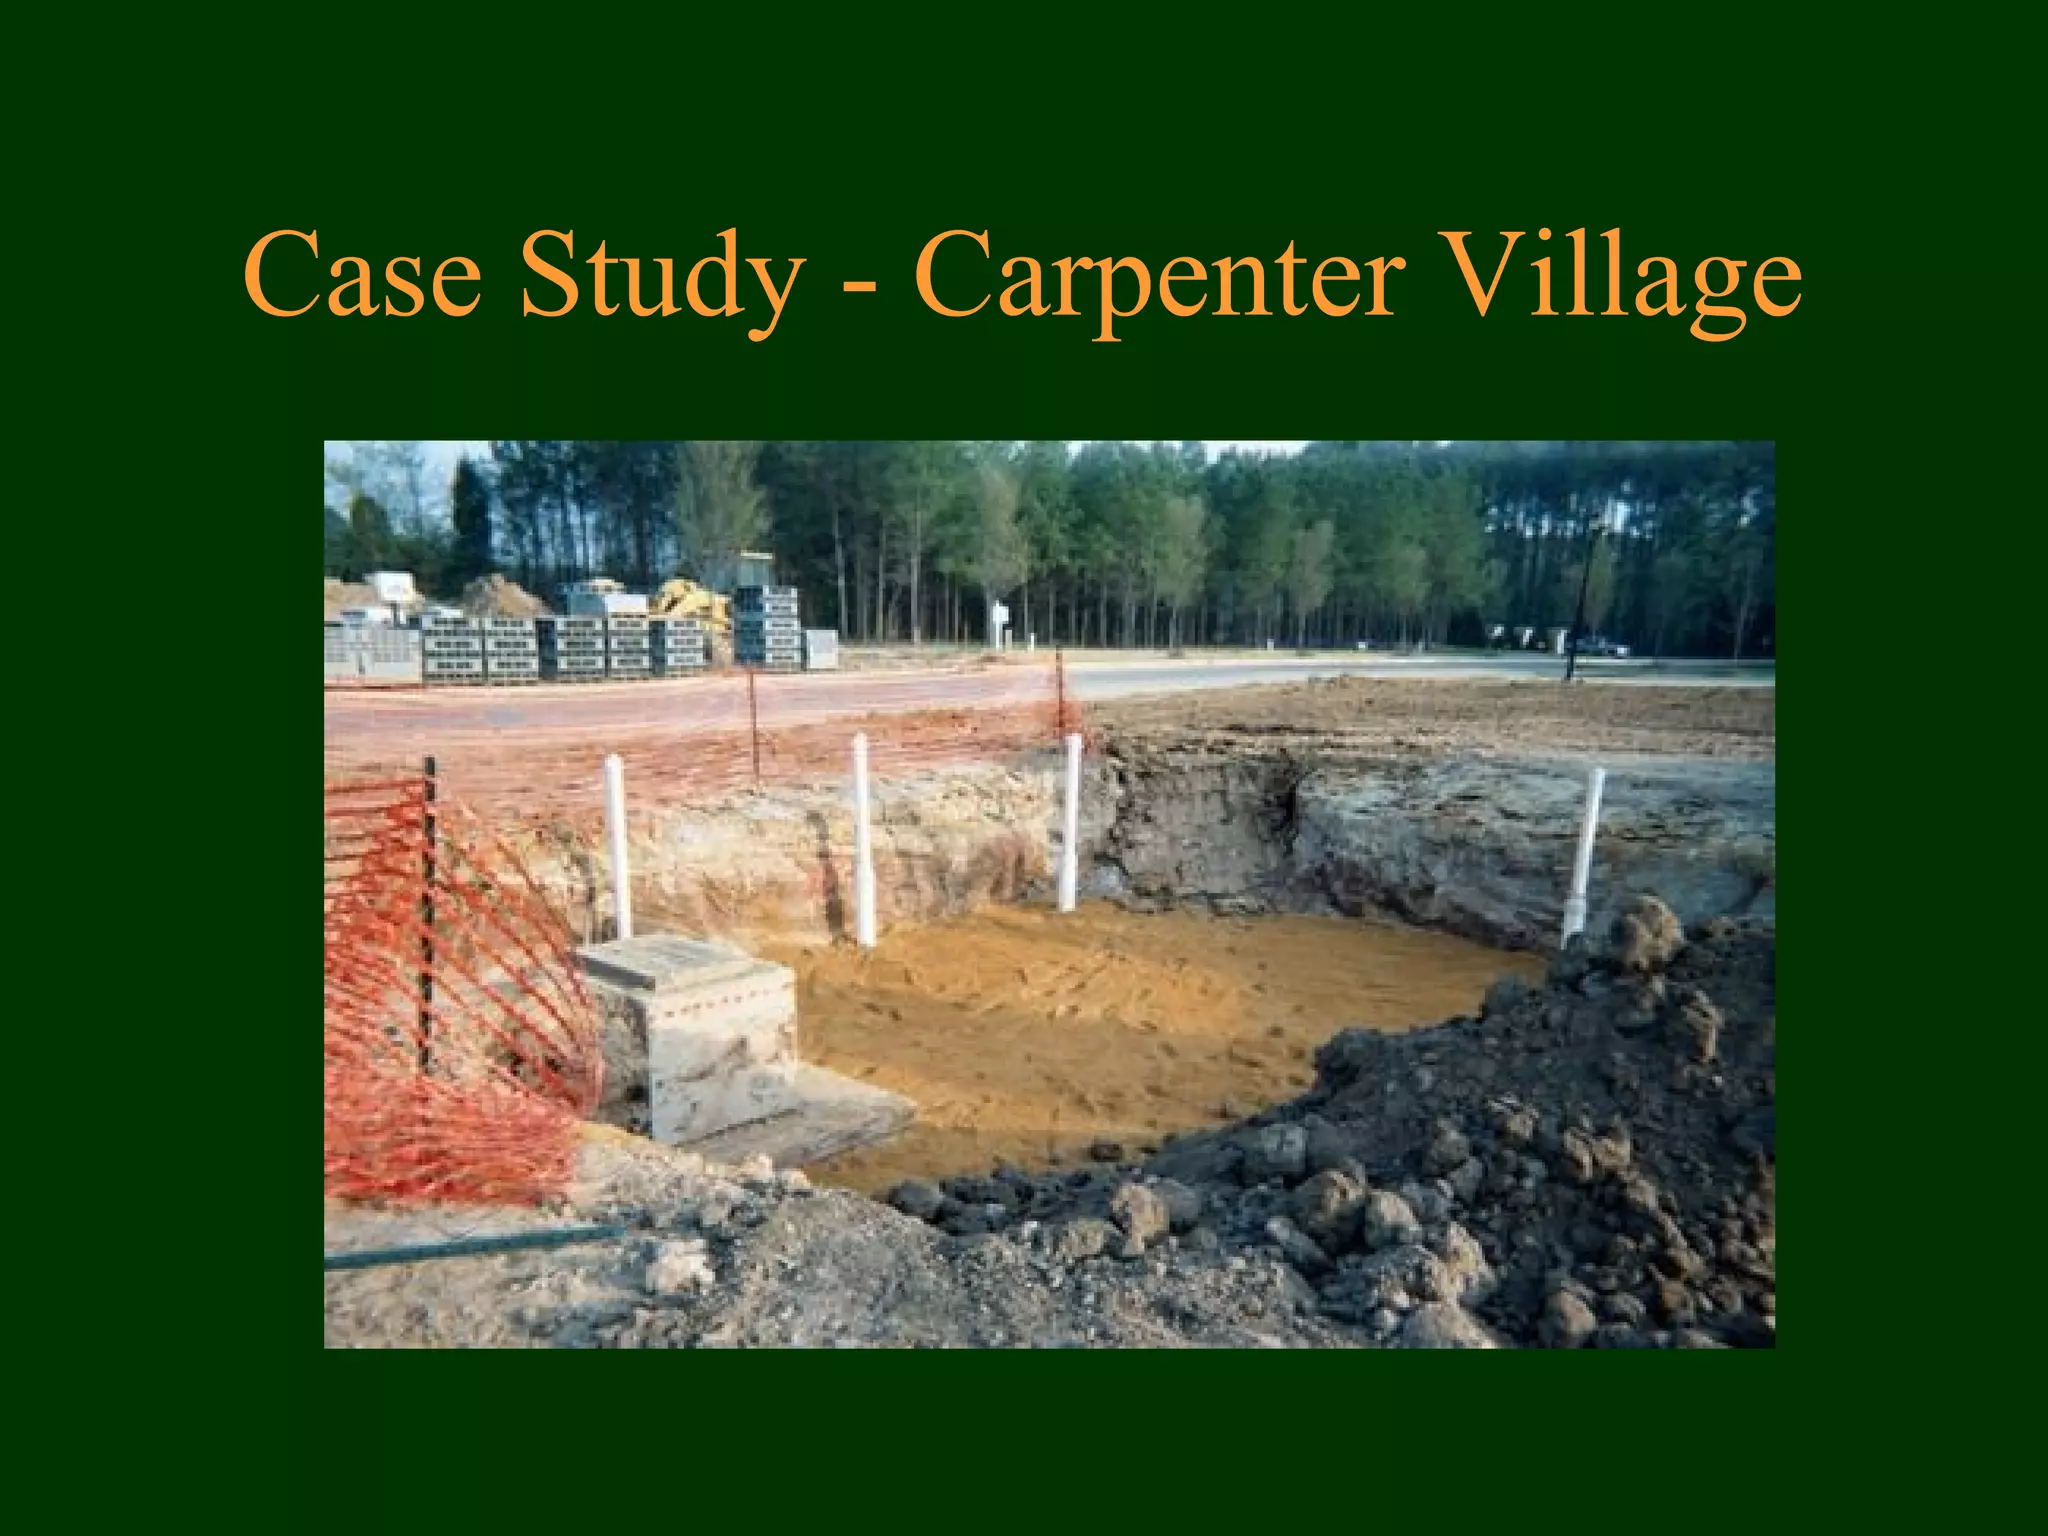
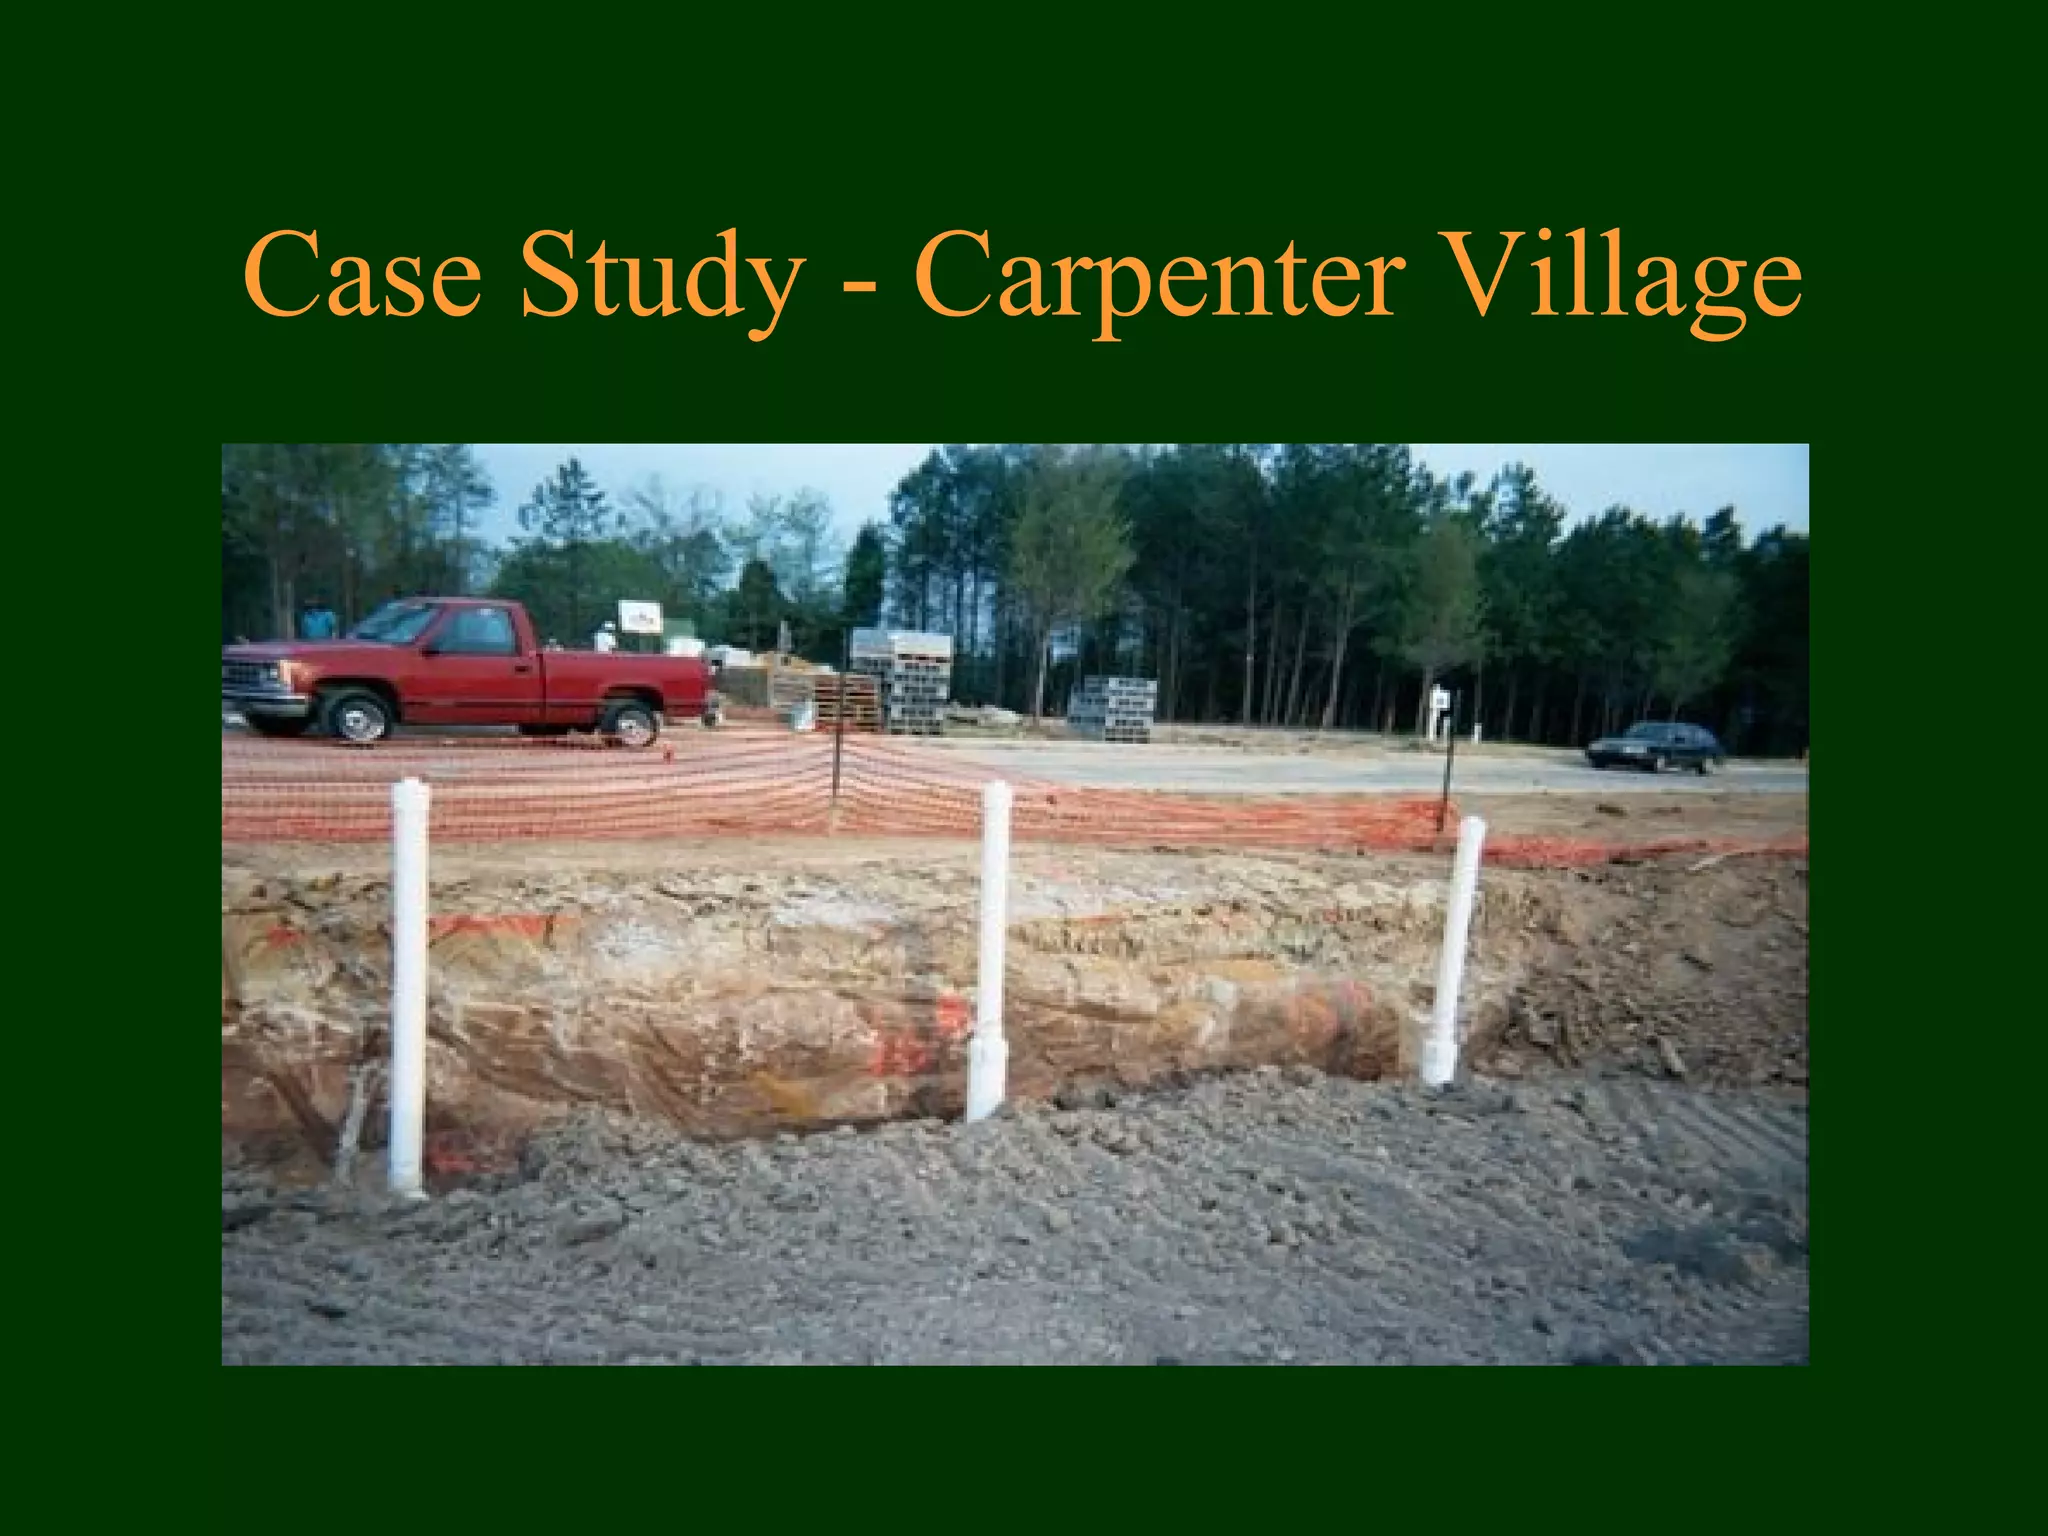
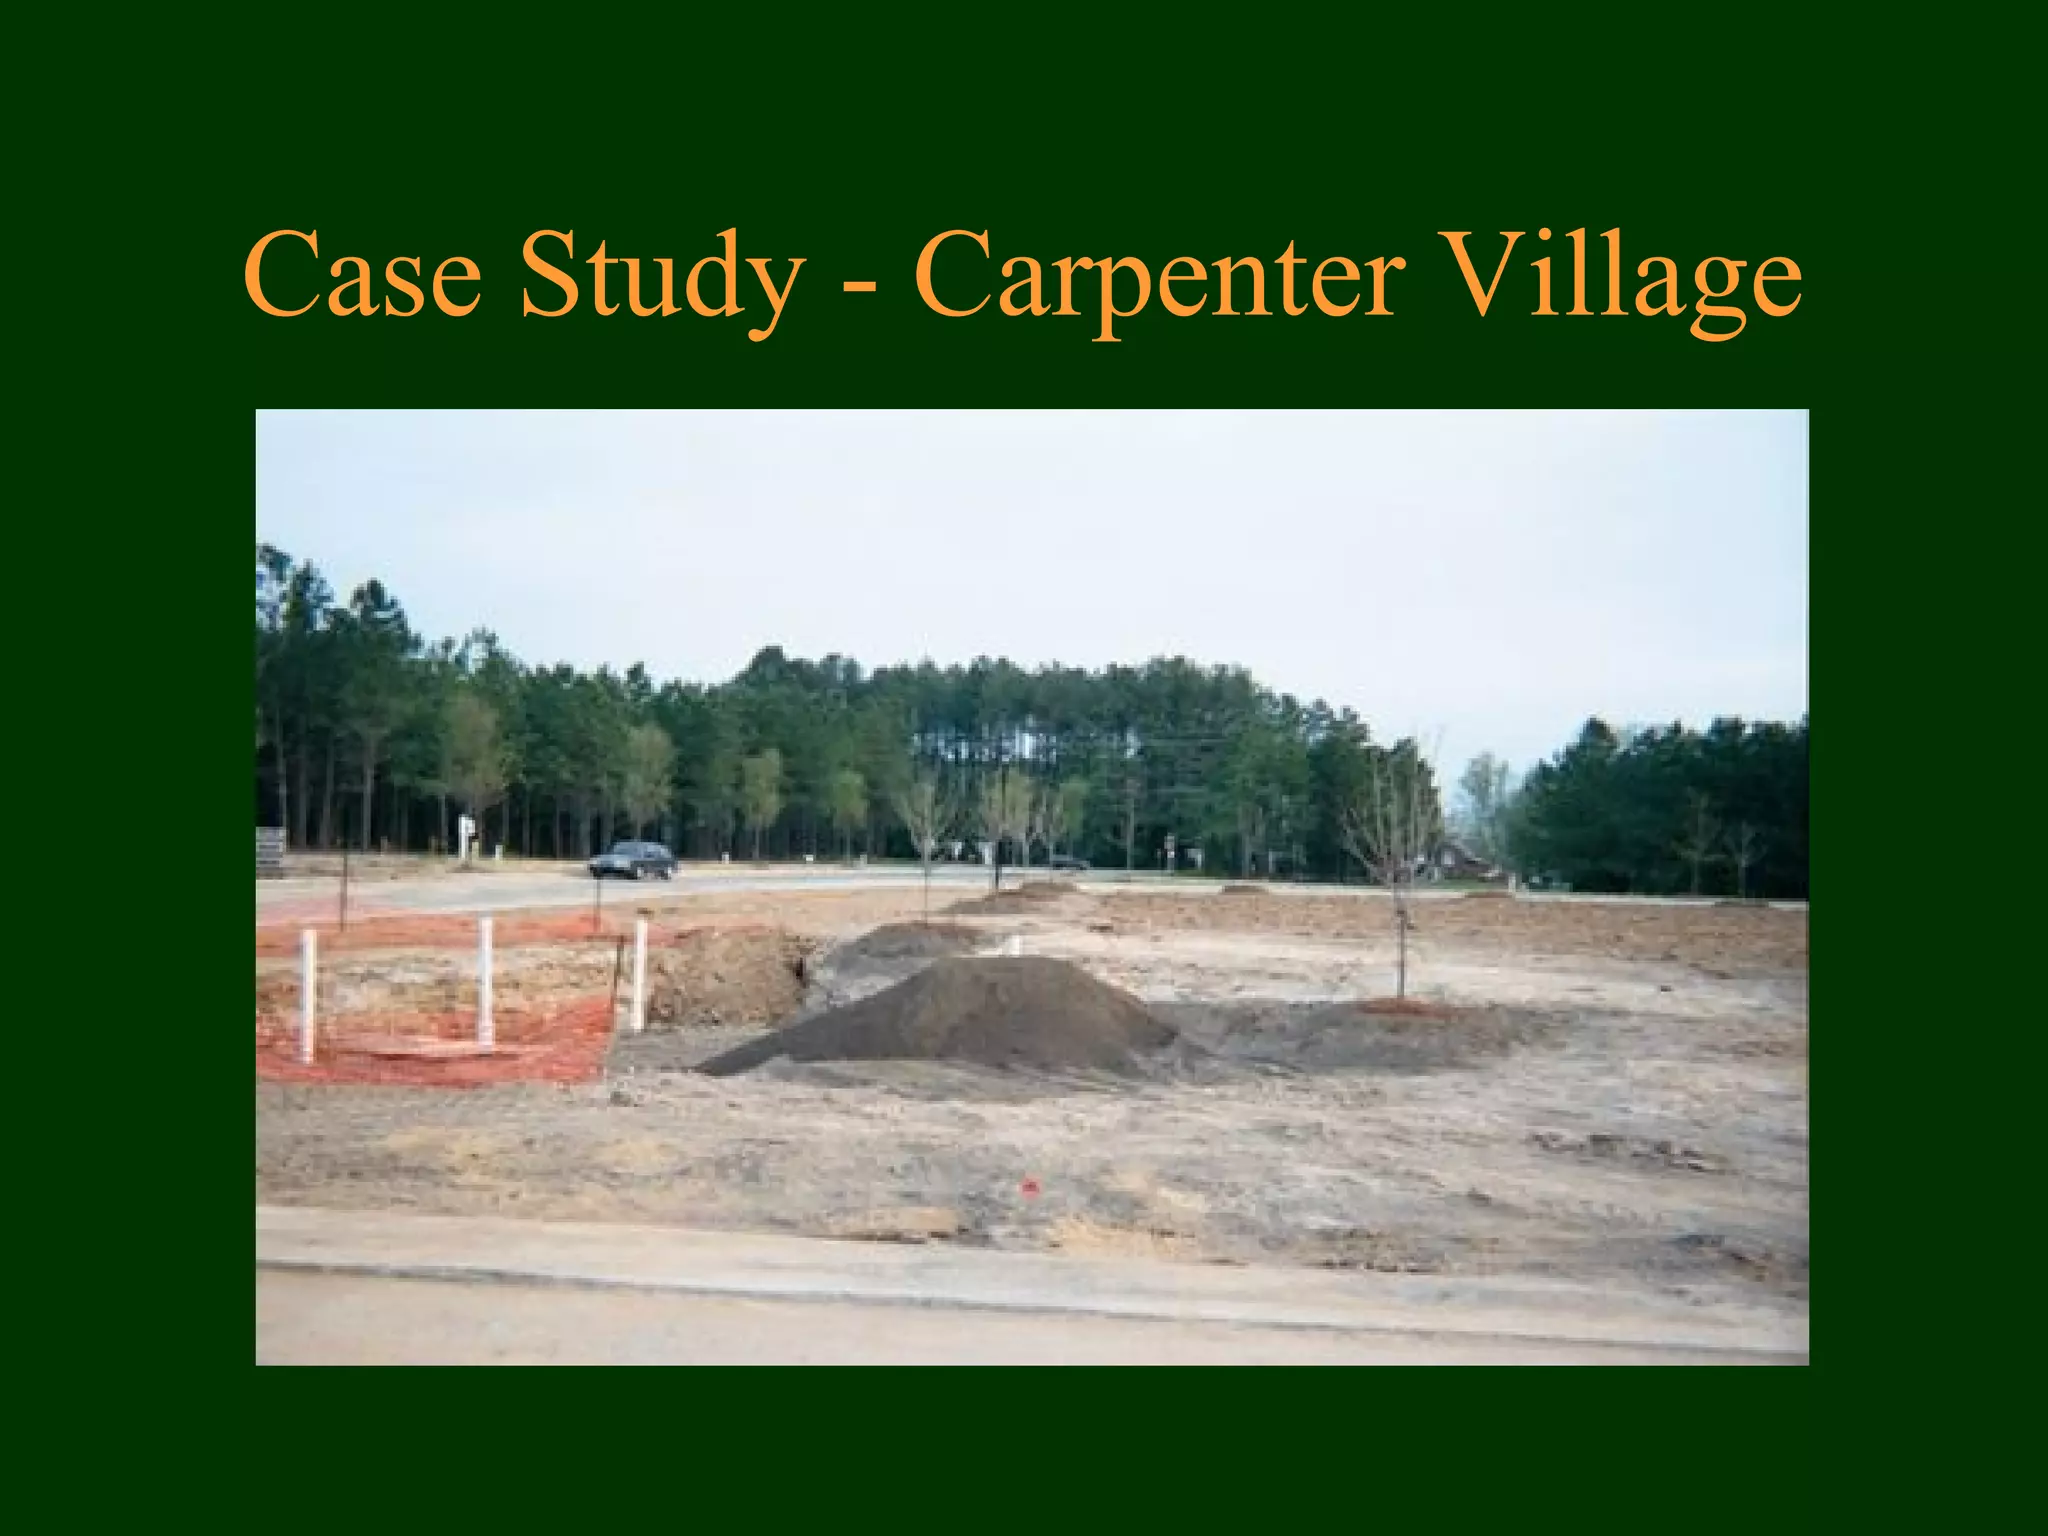
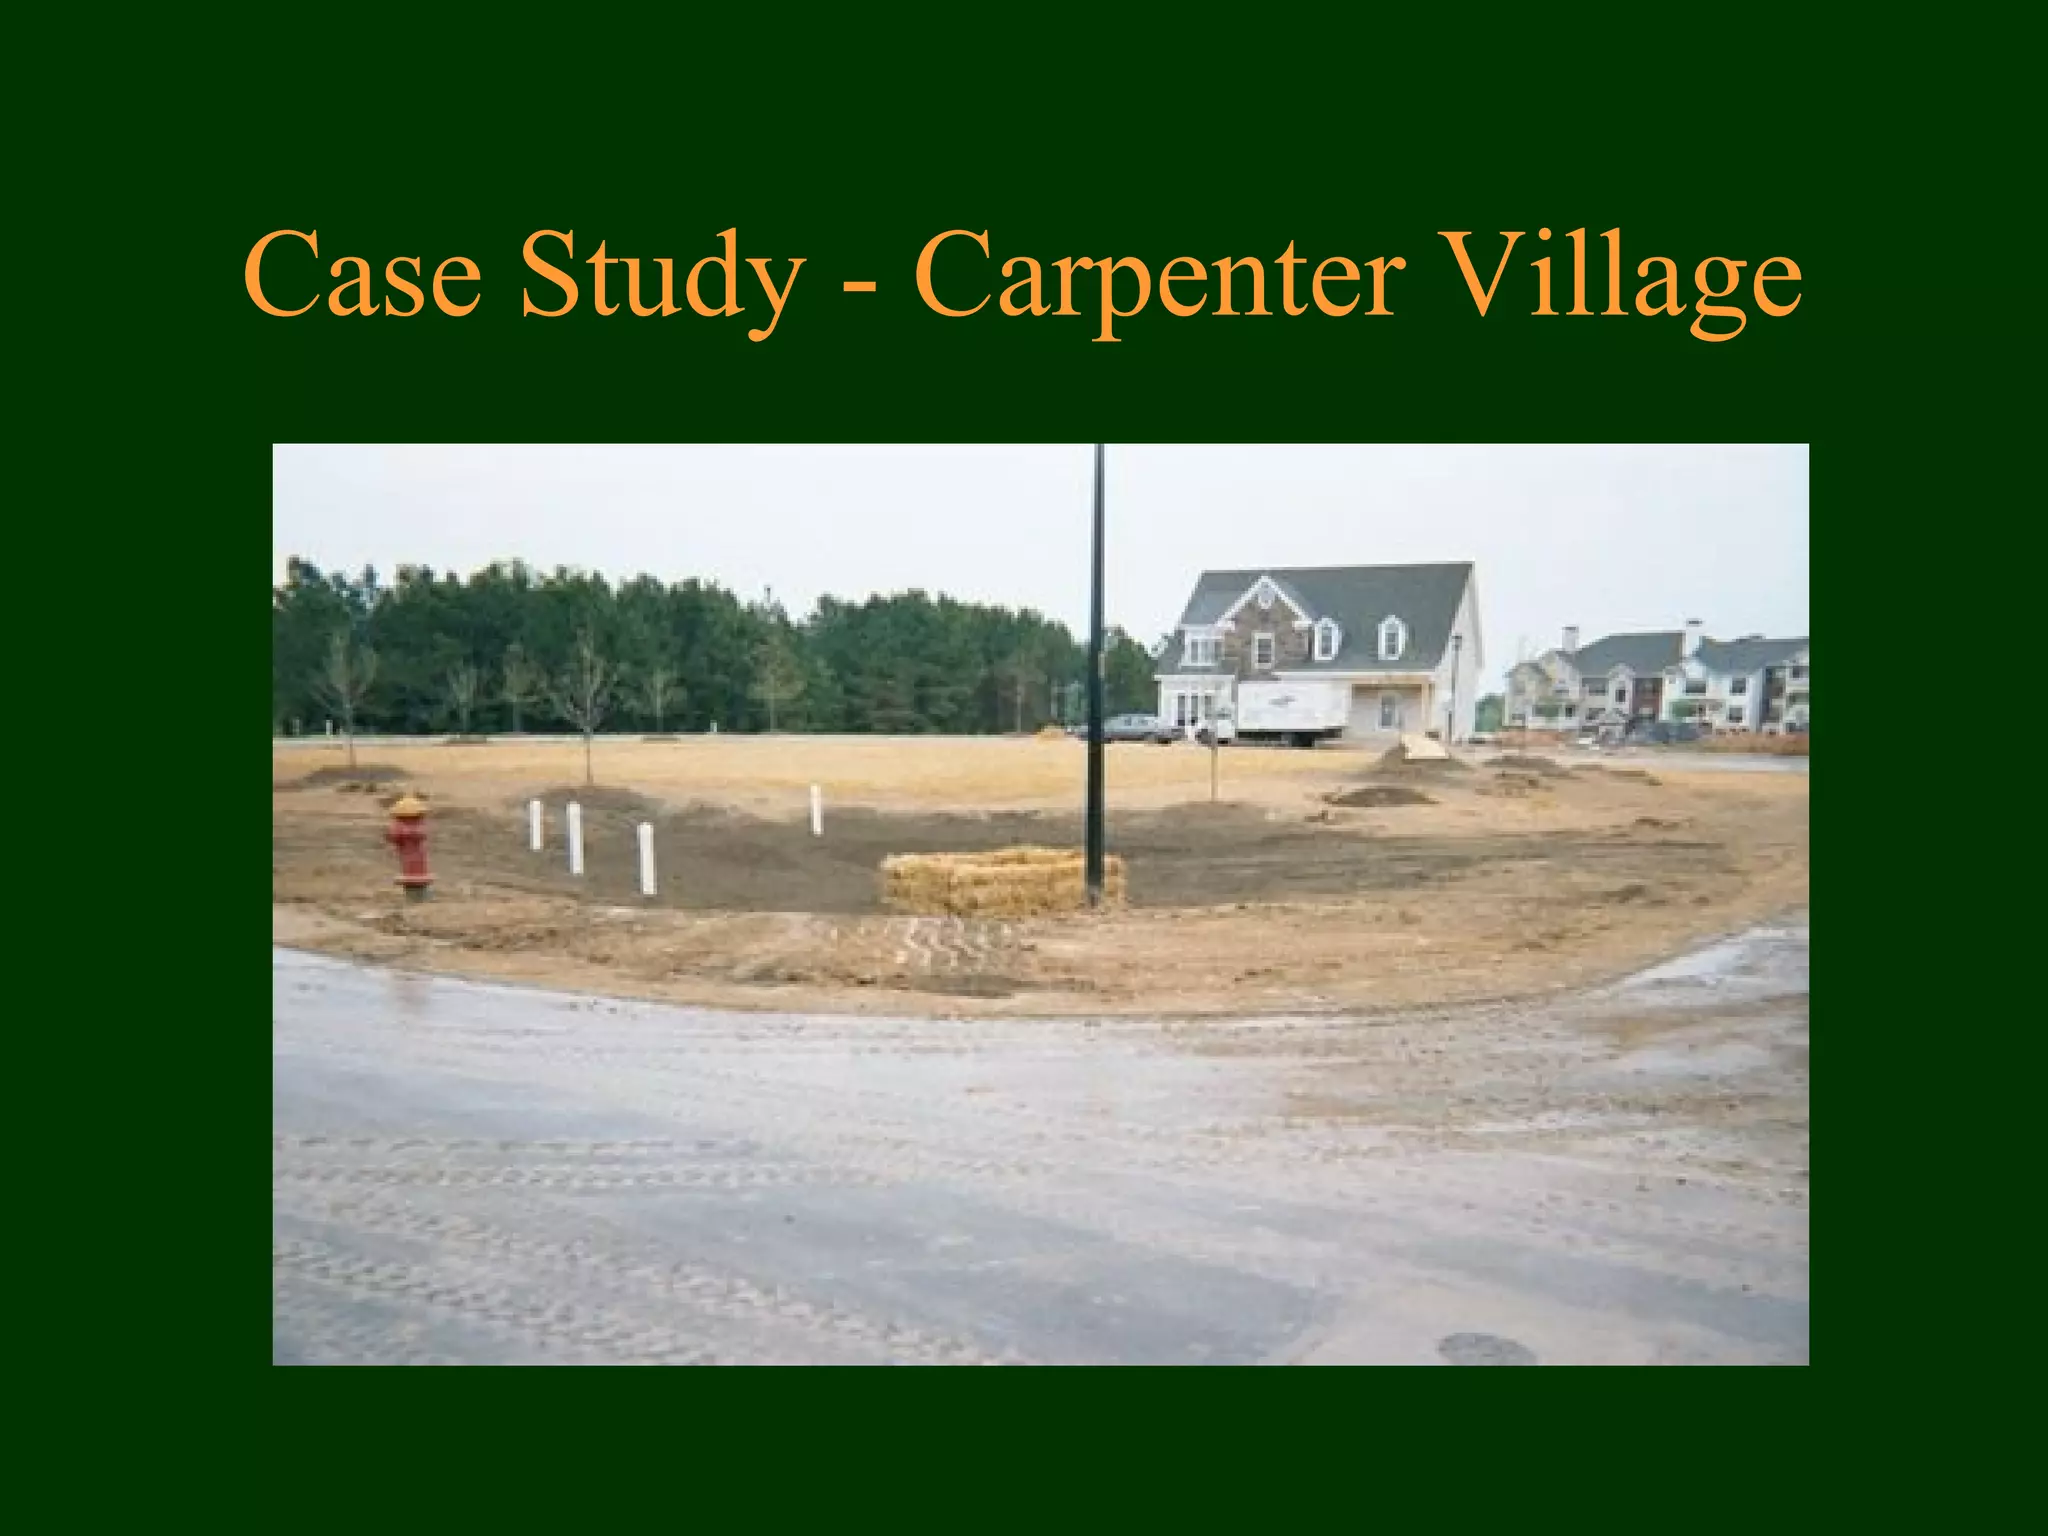

This document discusses various studies and case studies related to the impacts of development on water quality. It summarizes that effective solutions require maintaining watershed hydrology through low impact development techniques like reducing impervious surfaces, incorporating bioretention areas, and maintaining wetlands and riparian buffers. A case study of the Carpenter Village development showed positive results from using clustered housing, narrow streets, integrated open space and bioretention to minimize impacts on water quality.


![APR 23 10 LIVING WITH LID [Compatibility Mode]](https://cdn.slidesharecdn.com/ss_thumbnails/cfdcf478-6a89-479c-adea-209acd3d86ae-150406172555-conversion-gate01-thumbnail.jpg?width=640&height=640&fit=bounds)