Download to read offline


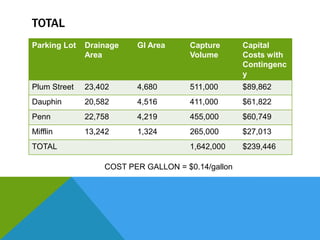


This document summarizes impervious surface area and green infrastructure opportunities in the City of Lancaster. It finds that roads make up 25% of impervious area, buildings 41%, and parking lots 32%. It then outlines potential green infrastructure projects for parking lots, alleys, parks, and schools that could capture over 1 million gallons of annual runoff. Finally, it estimates that targeting 50-85% of impervious area from various sources could reduce runoff through practices like green streets, porous pavement, tree planting, and ordinances.


