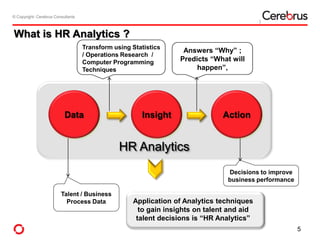
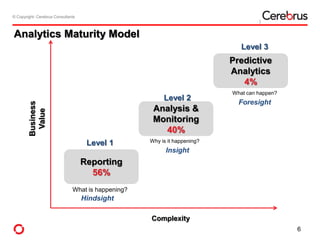
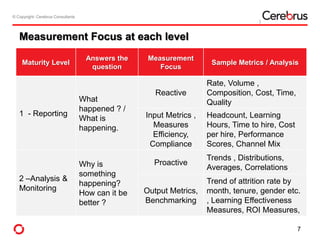
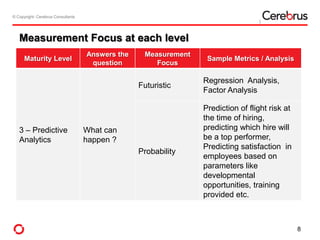
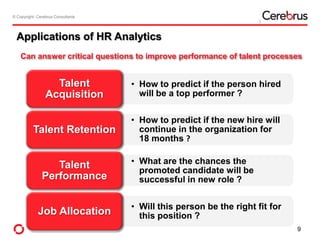
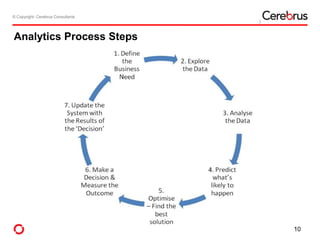
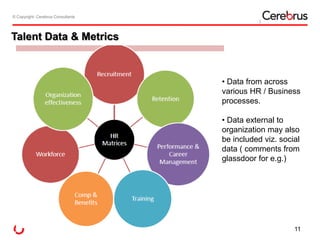
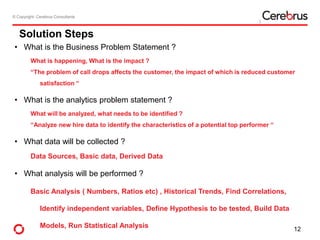
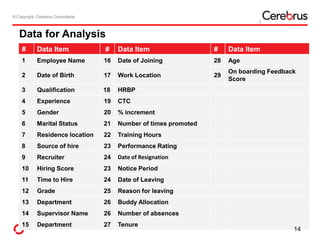
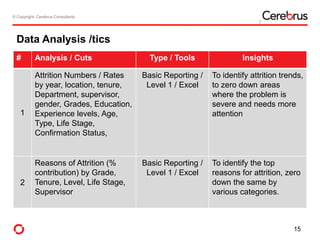
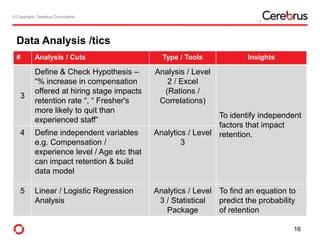
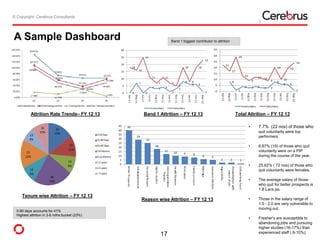
SlideShare a Scribd company logo
1 of 18
Download to read offline
HR Analytics Workshop
NHRD , Sept 2015
© Copyright- Cerebrus Consultants© Copyright- Cerebrus Consultants
Contents
• Session Objectives
• What is HR Analytics ?
• Analytics Maturity Model
• Measurement Focus at each level
• Applications of HR Analytics
• Analytics Process Steps
• Talent Data & Metrics
• Solution Steps
• Case Study
• Data Collection
• Analytics
• A Sample Dashboard
2
© Copyright- Cerebrus Consultants© Copyright- Cerebrus Consultants
Session Objectives
• What is HR analytics ?
• What can HR Analytics do ?
• What are the different types of analytics ?
• How to solve a business problem using analytics ?
• How to present analysis findings ?
3
To trigger thoughts around the potential of Talent Analytics for solving business
problems by understanding…
© Copyright- Cerebrus Consultants© Copyright- Cerebrus Consultants
What is HR Analytics ?
Which of these words best describes HR Analytics ?
4
© Copyright- Cerebrus Consultants© Copyright- Cerebrus Consultants
HR Analytics
Data Insight Action
Talent / Business
Process Data
Transform using Statistics
/ Operations Research /
Computer Programming
Techniques
Application of Analytics techniques
to gain insights on talent and aid
talent decisions is “HR Analytics”
Answers “Why” ;
Predicts “What will
happen”,
Decisions to improve
business performance
What is HR Analytics ?
5
© Copyright- Cerebrus Consultants© Copyright- Cerebrus Consultants
Analytics Maturity Model
Reporting
56%
Business
Value
Complexity
Analysis &
Monitoring
40%
Predictive
Analytics
4%
What is happening?
Why is it happening?
What can happen?
Hindsight
Insight
Foresight
Level 1
Level 2
Level 3
6
© Copyright- Cerebrus Consultants© Copyright- Cerebrus Consultants
Measurement Focus at each level
Maturity Level
Answers the
question
Measurement
Focus
Sample Metrics / Analysis
1 - Reporting
What
happened ? /
What is
happening.
Reactive
Rate, Volume ,
Composition, Cost, Time,
Quality
Input Metrics ,
Measures
Efficiency,
Compliance
Headcount, Learning
Hours, Time to hire, Cost
per hire, Performance
Scores, Channel Mix
2 –Analysis &
Monitoring
Why is
something
happening?
How can it be
better ?
Proactive
Trends , Distributions,
Averages, Correlations
Output Metrics,
Benchmarking
Trend of attrition rate by
month, tenure, gender etc.
, Learning Effectiveness
Measures, ROI Measures,
7
© Copyright- Cerebrus Consultants© Copyright- Cerebrus Consultants
8
Maturity Level
Answers the
question
Measurement
Focus
Sample Metrics / Analysis
3 – Predictive
Analytics
What can
happen ?
Futuristic
Regression Analysis,
Factor Analysis
Probability
Prediction of flight risk at
the time of hiring,
predicting which hire will
be a top performer,
Predicting satisfaction in
employees based on
parameters like
developmental
opportunities, training
provided etc.
Measurement Focus at each level
© Copyright- Cerebrus Consultants© Copyright- Cerebrus Consultants
Applications of HR Analytics
• How to predict if the person hired
will be a top performer ?
Talent
Acquisition
• How to predict if the new hire will
continue in the organization for
18 months ?
Talent Retention
• What are the chances the
promoted candidate will be
successful in new role ?
Talent
Performance
• Will this person be the right fit for
this position ?Job Allocation
Can answer critical questions to improve performance of talent processes
9
© Copyright- Cerebrus Consultants© Copyright- Cerebrus Consultants
Analytics Process Steps
10
© Copyright- Cerebrus Consultants© Copyright- Cerebrus Consultants
Talent Data & Metrics
11
• Data from across
various HR / Business
processes.
• Data external to
organization may also
be included viz. social
data ( comments from
glassdoor for e.g.)
© Copyright- Cerebrus Consultants© Copyright- Cerebrus Consultants
Solution Steps
• What is the Business Problem Statement ?
What is happening, What is the impact ?
“The problem of call drops affects the customer, the impact of which is reduced customer
satisfaction “
• What is the analytics problem statement ?
What will be analyzed, what needs to be identified ?
“Analyze new hire data to identify the characteristics of a potential top performer “
• What data will be collected ?
Data Sources, Basic data, Derived Data
• What analysis will be performed ?
Basic Analysis ( Numbers, Ratios etc) , Historical Trends, Find Correlations,
Identify independent variables, Define Hypothesis to be tested, Build Data
Models, Run Statistical Analysis 12
© Copyright- Cerebrus Consultants© Copyright- Cerebrus Consultants
Case Study
You are the HR Manager for Hero Global Services Ltd, a provider of business
and knowledge processing services to global clients. It operates out of two
locations in India and has an employee headcount of 8000. The Insurance
business vertical is facing the problem of high levels of attrition amongst its
staff. Annualized attrition rates stand at 40%. This is heavily impacting
business, existing staff is highly stretched at work and morale is low. There is
talk of high stress levels, inflexible HR policies and engagement amongst staff.
Many employees have joined competitors with good salary hikes.
The business hires employees who are graduates. About 50-75 employees are
hired every month. They may be hired right after college or with 2-3 years
experience in similar profile. They are then trained for 4 weeks (class room)
and then provided on the job training ( 4-6 weeks) and then moved to various
processes. There are ten levels within the organization, the front line
employees accounting for about 70% of the overall population.
13
© Copyright- Cerebrus Consultants© Copyright- Cerebrus Consultants
Data for Analysis
# Data Item # Data Item # Data Item
1 Employee Name 16 Date of Joining 28 Age
2 Date of Birth 17 Work Location 29
On boarding Feedback
Score
3 Qualification 18 HRBP
4 Experience 19 CTC
5 Gender 20 % increment
6 Marital Status 21 Number of times promoted
7 Residence location 22 Training Hours
8 Source of hire 23 Performance Rating
9 Recruiter 24 Date of Resignation
10 Hiring Score 23 Notice Period
11 Time to Hire 24 Date of Leaving
12 Grade 25 Reason for leaving
13 Department 26 Buddy Allocation
14 Supervisor Name 26 Number of absences
15 Department 27 Tenure
14
© Copyright- Cerebrus Consultants© Copyright- Cerebrus Consultants
Data Analysis /tics
# Analysis / Cuts Type / Tools Insights
1
Attrition Numbers / Rates
by year, location, tenure,
Department, supervisor,
gender, Grades, Education,
Experience levels, Age,
Type, Life Stage,
Confirmation Status,
Basic Reporting /
Level 1 / Excel
To identify attrition trends,
to zero down areas
where the problem is
severe and needs more
attention
2
Reasons of Attrition (%
contribution) by Grade,
Tenure, Level, Life Stage,
Supervisor
Basic Reporting /
Level 1 / Excel
To identify the top
reasons for attrition, zero
down the same by
various categories.
15
© Copyright- Cerebrus Consultants© Copyright- Cerebrus Consultants
16
# Analysis / Cuts Type / Tools Insights
3
Define & Check Hypothesis –
“% increase in compensation
offered at hiring stage impacts
retention rate “, “ Fresher's
more likely to quit than
experienced staff”
Analysis / Level
2 / Excel
(Rations /
Correlations)
To identify independent
factors that impact
retention.4 Define independent variables
e.g. Compensation /
experience level / Age etc that
can impact retention & build
data model
Analytics / Level
3
5 Linear / Logistic Regression
Analysis
Analytics / Level
3 / Statistical
Package
To find an equation to
predict the probability
of retention
Data Analysis /tics
© Copyright- Cerebrus Consultants© Copyright- Cerebrus Consultants
A Sample Dashboard
17
0-90 days accounts for 41%
Highest attrition in 3-6 mths bucket (23%)
Band 1 biggest contributor to attrition
Total Attrition – FY 12 13Band 1 Attrition – FY 12 13Attrition Rate Trends– FY 12 13
Tenure wise Attrition – FY 12 13
Reason wise Attrition – FY 12 13
• 7.7% (22 nos) of those who
quit voluntarily were top
performers
• 6.67% (19) of those who quit
voluntarily were on a PIP
during the course of the year.
• 25.62% ( 72 nos) of those who
quit voluntarily were females.
• The average salary of those
who quit for better prospects is
1.8 Lacs pa.
• Those in the salary range of
1.5 - 2.0 are very vulnerable to
moving out.
• Fresher's are susceptible to
abandoning jobs and pursuing
higher studies (16-17%) than
experienced staff ( 6-10%)
Thank You
For further details, contact
supriyat@cerebrus-consultants.com
Tel: +91-7838871701

More Related Content

What's hot

What's hot (20)

HR ANALYTICS
HR ANALYTICS HR ANALYTICS
HR ANALYTICS
 
HR Analytics & HR Tools
HR Analytics & HR ToolsHR Analytics & HR Tools
HR Analytics & HR Tools
 
Hr Analytics
Hr AnalyticsHr Analytics
Hr Analytics
 
HR Scorecard
HR ScorecardHR Scorecard
HR Scorecard
 
Hr analytics
Hr analyticsHr analytics
Hr analytics
 
Future of HR 2022 Slides
Future of HR 2022 SlidesFuture of HR 2022 Slides
Future of HR 2022 Slides
 
What is HR analytics? An Introduction
What is HR analytics? An IntroductionWhat is HR analytics? An Introduction
What is HR analytics? An Introduction
 
Artificial Intelligence: threat or opportunity for HR?
Artificial Intelligence: threat or opportunity for HR? Artificial Intelligence: threat or opportunity for HR?
Artificial Intelligence: threat or opportunity for HR?
 
AI in HR -
AI in HR - AI in HR -
AI in HR -
 
Hr Analytics
Hr AnalyticsHr Analytics
Hr Analytics
 
Introduction to hr metrics and workforce Analytics
Introduction to hr metrics and workforce AnalyticsIntroduction to hr metrics and workforce Analytics
Introduction to hr metrics and workforce Analytics
 
AI on HR
AI on HRAI on HR
AI on HR
 
HR Scorecard
HR Scorecard HR Scorecard
HR Scorecard
 
The Power of HR Analytics
The Power of HR AnalyticsThe Power of HR Analytics
The Power of HR Analytics
 
HR Strategic Planning
HR Strategic Planning HR Strategic Planning
HR Strategic Planning
 
HR Metrics
HR MetricsHR Metrics
HR Metrics
 
Driving the Future of HR with Analytics and Bots
Driving the Future of HR with Analytics and Bots Driving the Future of HR with Analytics and Bots
Driving the Future of HR with Analytics and Bots
 
HR Analytics
HR AnalyticsHR Analytics
HR Analytics
 
Hrp
HrpHrp
Hrp
 
Talent Acquisition in Human Resource Management Practices
Talent Acquisition in Human Resource Management Practices  Talent Acquisition in Human Resource Management Practices
Talent Acquisition in Human Resource Management Practices
 

Viewers also liked (8)

Symposium 2016 analytics on hr strategy using evidence
Symposium 2016 analytics on hr strategy using evidence Symposium 2016 analytics on hr strategy using evidence
Symposium 2016 analytics on hr strategy using evidence
 
Predictive HR Analytics report 2016
Predictive HR Analytics report 2016Predictive HR Analytics report 2016
Predictive HR Analytics report 2016
 
Hr analytics 2
Hr analytics 2Hr analytics 2
Hr analytics 2
 
PwC Trends in the workforce
PwC Trends in the workforcePwC Trends in the workforce
PwC Trends in the workforce
 
GAMING LUMAscape
GAMING LUMAscape GAMING LUMAscape
GAMING LUMAscape
 
People Analytics is the New HR
People Analytics is the New HRPeople Analytics is the New HR
People Analytics is the New HR
 
5 Hot Trends for Data Analytics in 2017
5 Hot Trends for Data Analytics in 20175 Hot Trends for Data Analytics in 2017
5 Hot Trends for Data Analytics in 2017
 
attrition analysis
attrition analysisattrition analysis
attrition analysis
 

Similar to NHRD HR Analytics Presentation

HR Metrics - BLR Webinar - Rick Buchman - 4-7-2015
HR Metrics -  BLR Webinar - Rick Buchman - 4-7-2015HR Metrics -  BLR Webinar - Rick Buchman - 4-7-2015
HR Metrics - BLR Webinar - Rick Buchman - 4-7-2015
Frederick 'Rick' Buchman
 
HR analytics mmmmmmmmmmmmmmmmmmmmmmmmmmmmmmmmmmmmmmmmmmmmmmmm
HR analytics mmmmmmmmmmmmmmmmmmmmmmmmmmmmmmmmmmmmmmmmmmmmmmmmHR analytics mmmmmmmmmmmmmmmmmmmmmmmmmmmmmmmmmmmmmmmmmmmmmmmm
HR analytics mmmmmmmmmmmmmmmmmmmmmmmmmmmmmmmmmmmmmmmmmmmmmmmm
onalijayathilaka
 
INFORMATION SYSTEMS CASE STUDYBrainstorm ideas for a new informa.docx
INFORMATION SYSTEMS CASE STUDYBrainstorm ideas for a new informa.docxINFORMATION SYSTEMS CASE STUDYBrainstorm ideas for a new informa.docx
INFORMATION SYSTEMS CASE STUDYBrainstorm ideas for a new informa.docx
jaggernaoma
 
7 Steps to Attract, Motivate & Retain Top Talent
7 Steps to Attract, Motivate & Retain Top Talent7 Steps to Attract, Motivate & Retain Top Talent
7 Steps to Attract, Motivate & Retain Top Talent
nyreport.com
 
Chapter 7 - Human Resource Management
Chapter 7 - Human Resource ManagementChapter 7 - Human Resource Management
Chapter 7 - Human Resource Management
dpd
 

Similar to NHRD HR Analytics Presentation (20)

HRAnalyticsstarting2october262021.pptx
HRAnalyticsstarting2october262021.pptxHRAnalyticsstarting2october262021.pptx
HRAnalyticsstarting2october262021.pptx
 
Making Workforce Analytics Stick
Making Workforce Analytics Stick Making Workforce Analytics Stick
Making Workforce Analytics Stick
 
Making Workforce Analytics Stick
Making Workforce Analytics Stick Making Workforce Analytics Stick
Making Workforce Analytics Stick
 
Strategic Hiring = Job Match
Strategic Hiring = Job MatchStrategic Hiring = Job Match
Strategic Hiring = Job Match
 
Future-of-HR-Metrics.ppt
Future-of-HR-Metrics.pptFuture-of-HR-Metrics.ppt
Future-of-HR-Metrics.ppt
 
HR Metrics - BLR Webinar - Rick Buchman - 4-7-2015
HR Metrics -  BLR Webinar - Rick Buchman - 4-7-2015HR Metrics -  BLR Webinar - Rick Buchman - 4-7-2015
HR Metrics - BLR Webinar - Rick Buchman - 4-7-2015
 
HR analytics mmmmmmmmmmmmmmmmmmmmmmmmmmmmmmmmmmmmmmmmmmmmmmmm
HR analytics mmmmmmmmmmmmmmmmmmmmmmmmmmmmmmmmmmmmmmmmmmmmmmmmHR analytics mmmmmmmmmmmmmmmmmmmmmmmmmmmmmmmmmmmmmmmmmmmmmmmm
HR analytics mmmmmmmmmmmmmmmmmmmmmmmmmmmmmmmmmmmmmmmmmmmmmmmm
 
HR analytics
HR analyticsHR analytics
HR analytics
 
INFORMATION SYSTEMS CASE STUDYBrainstorm ideas for a new informa.docx
INFORMATION SYSTEMS CASE STUDYBrainstorm ideas for a new informa.docxINFORMATION SYSTEMS CASE STUDYBrainstorm ideas for a new informa.docx
INFORMATION SYSTEMS CASE STUDYBrainstorm ideas for a new informa.docx
 
7 Steps to Attract, Motivate & Retain Top Talent
7 Steps to Attract, Motivate & Retain Top Talent7 Steps to Attract, Motivate & Retain Top Talent
7 Steps to Attract, Motivate & Retain Top Talent
 
Synopsis of abhishek
Synopsis of abhishekSynopsis of abhishek
Synopsis of abhishek
 
Synopsis of abhishek
Synopsis of abhishekSynopsis of abhishek
Synopsis of abhishek
 
Synopsis of abhishek
Synopsis of abhishekSynopsis of abhishek
Synopsis of abhishek
 
Chapter 7 - Human Resource Management
Chapter 7 - Human Resource ManagementChapter 7 - Human Resource Management
Chapter 7 - Human Resource Management
 
HR Metrics_Chapter 1A.pptx
HR Metrics_Chapter 1A.pptxHR Metrics_Chapter 1A.pptx
HR Metrics_Chapter 1A.pptx
 
Human Capital Analytics 2.2016
Human Capital Analytics 2.2016Human Capital Analytics 2.2016
Human Capital Analytics 2.2016
 
Hr metrics blr webinar - rick buchman - 4-7-2015
Hr metrics    blr webinar - rick buchman - 4-7-2015Hr metrics    blr webinar - rick buchman - 4-7-2015
Hr metrics blr webinar - rick buchman - 4-7-2015
 
Analytics Driving Action - Building a Data-Driven HR Function
Analytics Driving Action - Building a Data-Driven HR FunctionAnalytics Driving Action - Building a Data-Driven HR Function
Analytics Driving Action - Building a Data-Driven HR Function
 
HREX Surviving to Thriving Growing on a Budget 091510
HREX Surviving to Thriving Growing on a Budget 091510HREX Surviving to Thriving Growing on a Budget 091510
HREX Surviving to Thriving Growing on a Budget 091510
 
Fundamentals of Recruitment Analytics Outline
Fundamentals of Recruitment Analytics OutlineFundamentals of Recruitment Analytics Outline
Fundamentals of Recruitment Analytics Outline
 

NHRD HR Analytics Presentation

  • 2. © Copyright- Cerebrus Consultants© Copyright- Cerebrus Consultants Contents • Session Objectives • What is HR Analytics ? • Analytics Maturity Model • Measurement Focus at each level • Applications of HR Analytics • Analytics Process Steps • Talent Data & Metrics • Solution Steps • Case Study • Data Collection • Analytics • A Sample Dashboard 2
  • 3. © Copyright- Cerebrus Consultants© Copyright- Cerebrus Consultants Session Objectives • What is HR analytics ? • What can HR Analytics do ? • What are the different types of analytics ? • How to solve a business problem using analytics ? • How to present analysis findings ? 3 To trigger thoughts around the potential of Talent Analytics for solving business problems by understanding…
  • 4. © Copyright- Cerebrus Consultants© Copyright- Cerebrus Consultants What is HR Analytics ? Which of these words best describes HR Analytics ? 4
  • 5. © Copyright- Cerebrus Consultants© Copyright- Cerebrus Consultants HR Analytics Data Insight Action Talent / Business Process Data Transform using Statistics / Operations Research / Computer Programming Techniques Application of Analytics techniques to gain insights on talent and aid talent decisions is “HR Analytics” Answers “Why” ; Predicts “What will happen”, Decisions to improve business performance What is HR Analytics ? 5
  • 6. © Copyright- Cerebrus Consultants© Copyright- Cerebrus Consultants Analytics Maturity Model Reporting 56% Business Value Complexity Analysis & Monitoring 40% Predictive Analytics 4% What is happening? Why is it happening? What can happen? Hindsight Insight Foresight Level 1 Level 2 Level 3 6
  • 7. © Copyright- Cerebrus Consultants© Copyright- Cerebrus Consultants Measurement Focus at each level Maturity Level Answers the question Measurement Focus Sample Metrics / Analysis 1 - Reporting What happened ? / What is happening. Reactive Rate, Volume , Composition, Cost, Time, Quality Input Metrics , Measures Efficiency, Compliance Headcount, Learning Hours, Time to hire, Cost per hire, Performance Scores, Channel Mix 2 –Analysis & Monitoring Why is something happening? How can it be better ? Proactive Trends , Distributions, Averages, Correlations Output Metrics, Benchmarking Trend of attrition rate by month, tenure, gender etc. , Learning Effectiveness Measures, ROI Measures, 7
  • 8. © Copyright- Cerebrus Consultants© Copyright- Cerebrus Consultants 8 Maturity Level Answers the question Measurement Focus Sample Metrics / Analysis 3 – Predictive Analytics What can happen ? Futuristic Regression Analysis, Factor Analysis Probability Prediction of flight risk at the time of hiring, predicting which hire will be a top performer, Predicting satisfaction in employees based on parameters like developmental opportunities, training provided etc. Measurement Focus at each level
  • 9. © Copyright- Cerebrus Consultants© Copyright- Cerebrus Consultants Applications of HR Analytics • How to predict if the person hired will be a top performer ? Talent Acquisition • How to predict if the new hire will continue in the organization for 18 months ? Talent Retention • What are the chances the promoted candidate will be successful in new role ? Talent Performance • Will this person be the right fit for this position ?Job Allocation Can answer critical questions to improve performance of talent processes 9
  • 10. © Copyright- Cerebrus Consultants© Copyright- Cerebrus Consultants Analytics Process Steps 10
  • 11. © Copyright- Cerebrus Consultants© Copyright- Cerebrus Consultants Talent Data & Metrics 11 • Data from across various HR / Business processes. • Data external to organization may also be included viz. social data ( comments from glassdoor for e.g.)
  • 12. © Copyright- Cerebrus Consultants© Copyright- Cerebrus Consultants Solution Steps • What is the Business Problem Statement ? What is happening, What is the impact ? “The problem of call drops affects the customer, the impact of which is reduced customer satisfaction “ • What is the analytics problem statement ? What will be analyzed, what needs to be identified ? “Analyze new hire data to identify the characteristics of a potential top performer “ • What data will be collected ? Data Sources, Basic data, Derived Data • What analysis will be performed ? Basic Analysis ( Numbers, Ratios etc) , Historical Trends, Find Correlations, Identify independent variables, Define Hypothesis to be tested, Build Data Models, Run Statistical Analysis 12
  • 13. © Copyright- Cerebrus Consultants© Copyright- Cerebrus Consultants Case Study You are the HR Manager for Hero Global Services Ltd, a provider of business and knowledge processing services to global clients. It operates out of two locations in India and has an employee headcount of 8000. The Insurance business vertical is facing the problem of high levels of attrition amongst its staff. Annualized attrition rates stand at 40%. This is heavily impacting business, existing staff is highly stretched at work and morale is low. There is talk of high stress levels, inflexible HR policies and engagement amongst staff. Many employees have joined competitors with good salary hikes. The business hires employees who are graduates. About 50-75 employees are hired every month. They may be hired right after college or with 2-3 years experience in similar profile. They are then trained for 4 weeks (class room) and then provided on the job training ( 4-6 weeks) and then moved to various processes. There are ten levels within the organization, the front line employees accounting for about 70% of the overall population. 13
  • 14. © Copyright- Cerebrus Consultants© Copyright- Cerebrus Consultants Data for Analysis # Data Item # Data Item # Data Item 1 Employee Name 16 Date of Joining 28 Age 2 Date of Birth 17 Work Location 29 On boarding Feedback Score 3 Qualification 18 HRBP 4 Experience 19 CTC 5 Gender 20 % increment 6 Marital Status 21 Number of times promoted 7 Residence location 22 Training Hours 8 Source of hire 23 Performance Rating 9 Recruiter 24 Date of Resignation 10 Hiring Score 23 Notice Period 11 Time to Hire 24 Date of Leaving 12 Grade 25 Reason for leaving 13 Department 26 Buddy Allocation 14 Supervisor Name 26 Number of absences 15 Department 27 Tenure 14
  • 15. © Copyright- Cerebrus Consultants© Copyright- Cerebrus Consultants Data Analysis /tics # Analysis / Cuts Type / Tools Insights 1 Attrition Numbers / Rates by year, location, tenure, Department, supervisor, gender, Grades, Education, Experience levels, Age, Type, Life Stage, Confirmation Status, Basic Reporting / Level 1 / Excel To identify attrition trends, to zero down areas where the problem is severe and needs more attention 2 Reasons of Attrition (% contribution) by Grade, Tenure, Level, Life Stage, Supervisor Basic Reporting / Level 1 / Excel To identify the top reasons for attrition, zero down the same by various categories. 15
  • 16. © Copyright- Cerebrus Consultants© Copyright- Cerebrus Consultants 16 # Analysis / Cuts Type / Tools Insights 3 Define & Check Hypothesis – “% increase in compensation offered at hiring stage impacts retention rate “, “ Fresher's more likely to quit than experienced staff” Analysis / Level 2 / Excel (Rations / Correlations) To identify independent factors that impact retention.4 Define independent variables e.g. Compensation / experience level / Age etc that can impact retention & build data model Analytics / Level 3 5 Linear / Logistic Regression Analysis Analytics / Level 3 / Statistical Package To find an equation to predict the probability of retention Data Analysis /tics
  • 17. © Copyright- Cerebrus Consultants© Copyright- Cerebrus Consultants A Sample Dashboard 17 0-90 days accounts for 41% Highest attrition in 3-6 mths bucket (23%) Band 1 biggest contributor to attrition Total Attrition – FY 12 13Band 1 Attrition – FY 12 13Attrition Rate Trends– FY 12 13 Tenure wise Attrition – FY 12 13 Reason wise Attrition – FY 12 13 • 7.7% (22 nos) of those who quit voluntarily were top performers • 6.67% (19) of those who quit voluntarily were on a PIP during the course of the year. • 25.62% ( 72 nos) of those who quit voluntarily were females. • The average salary of those who quit for better prospects is 1.8 Lacs pa. • Those in the salary range of 1.5 - 2.0 are very vulnerable to moving out. • Fresher's are susceptible to abandoning jobs and pursuing higher studies (16-17%) than experienced staff ( 6-10%)
  • 18. Thank You For further details, contact supriyat@cerebrus-consultants.com Tel: +91-7838871701