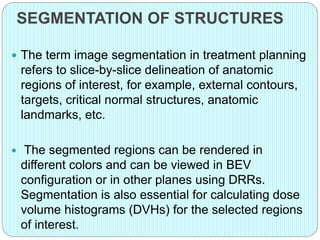
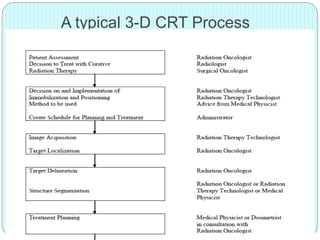
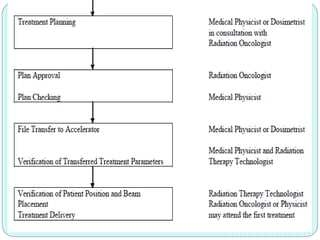
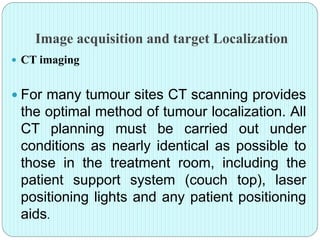
THREE-DIMENSIONAL CONFORMAL 
RADIATION THERAPY 
P Sathish Kumar 
RNT MEDICAL COLLEGE 
UDAIPUR
INTRODUCTION 
 The aims of 3-D CRT are to achieve conformity of the 
high dose region to the target volume and consequently to 
reduce the dose to the surrounding normal tissues. 
 3-D conformal radiotherapy (3-D CRT) is the term used to 
describe the design and delivery of radiotherapy treatment 
plans based on 3-D image data with treatment fields 
individually shaped to treat only the target tissue.
A typical 3-D CRT Process
CLINICAL IMPLEMENTATION OF 3-D 
CONFORMAL RADIOTHERAPY 
 PATIENT ASSESSMENT AND DECISION TO TREAT 
WITH RADIATION. 
 IMMOBILIZATION AND PATIENT POSITIONING. 
 IMAGE ACQUISITION AND TARGET 
LOCALIZATION. 
CT imaging 
MRI and other imaging modalities 
• SEGMENTATION OF STRUCTURES. 
• TREATMENT PLANNING FOR 3-D CONFORMAL 
RADIOTHERAPY.
PATIENT ASSESSMENT AND DECISION TO 
TREAT WITH RADIATION 
 The first step in the process is patient assessment and 
deciding how the patient should be treated. During 
assessment various diagnostic and investigative 
procedures are undertaken to define the state of the 
disease. 
 This involves imaging, biochemical testing and review 
of pathologic information to identify the type, stage and 
grade of the cancer. The decision to treat the patient with 
radiation should be made by a team of clinicians
IMMOBILIZATION AND PATIENT 
POSITIONING 
Ra.diation treatment accuracy can be divided into two 
separate but highly interrelated issues: 
Dosimetric accuracy- deal with issues such as radiation 
beam calibration and dose calculations. 
Geometric accuracy- It covers issues related to patient 
positioning and immobilization that have a strong effect on 
how well we can accurately cover a specified anatomic 
volume with a desired radiation dose
 An accurately set up laser alignment system 
is an essential requirement for accurate 
radiotherapy. 
 This should consist of at least three lasers 
to provide two lateral crosses and a sagittal 
line which can be used in conjunction with 
appropriately placed tattoos to ensure the 
patient is not rotated. 
 Special immobilization systems are 
available for immobilizing different parts of 
the body
For example, knee supports and ankle 
stocks are used for pelvic and abdominal 
immobilization, adjustable breast boards 
are used for breast and vacuum 
immobilization bags or alpha cradles are 
used for chest, thermoplastic masks are 
used for head and neck treatment, and 
relocatable stereotactic frames are used for 
brain tumours.
Head Rest 
head rest- transparent headrest 
Polyurethane
H &N Molds 
FLATTENED AT 70° C IN WATER 
HARDENS IN FEW MINUTES 
USED FOR HEAD & NECK AND PELVIS CASES 
EASILY FIXED TO THE COUCH 
REUSABLE 
CAN BE CUT AT STRATEGIC PLACES FOR 
BEAM ENTRANCE 
LASTS LONG WITHOUT DETERIORATION
Patient is placed on the couch in the same position as 
was during simulation using the same immobilization 
devices
Image acquisition and target Localization 
 CT imaging 
 For many tumour sites CT scanning provides 
the optimal method of tumour localization. All 
CT planning must be carried out under 
conditions as nearly identical as possible to 
those in the treatment room, including the 
patient support system (couch top), laser 
positioning lights and any patient positioning 
aids.
LASER CROSS HAIR SYSTEM
 For conformal therapy a slice separation and 
thickness of between 3 mm and 5 mm is 
recommended for CT scanning. 
 For head and neck and Central Nervous 
System (CNS) planning this may be reduced 
to between 2 mm and 3 mm. 
 The CT scanner couch top must be flat, 
securely fitted and compatible with the 
therapy machine couch. Transverse and 
longitudinal lasers with additional laser 
positioning lights are needed in the CT room 
identical to those in the treatment room to 
ensure exact positioning of the patient.
Digitally reconstructed radiographs 
 One of the important features of 3-D treatment planning is 
the ability to reconstruct images in planes other than that of 
the original transverse image. These are called the digitally 
reconstructed radiographs (DRRs). 
 DRRs are produced by tracing ray lines from a virtual 
source position through the CT data of the patient to a 
virtual film plane. The sum of the attenuation coefficients 
along any one ray line gives a quantity analogous to optical 
density (OD) on a radiographic film.
Digitally reconstructed 
radiographs
 In treatment planning, MRI images may be used 
alone or in conjunction with CT images. In general, 
MRI is considered superior to CT in soft-tissue 
discrimination such as central nervous system 
tumors and abnormalities in the brain. 
 Also, MRI is well suited to imaging head and neck 
cancers, sarcomas, the prostate gland, and lymph 
nodes. On the other hand, it is insensitive to 
calcification and bony structures, which are best 
imaged with CT. 
 Although important differences exist between CT and 
MRI image characteristics, the two are considered 
complementary in their roles in treatment planning.
 The most basic difference between CT and MRI is 
that the former is related to electron density and 
atomic number (actually representing x-ray linear 
attenuation coefficients), while the latter shows 
proton density distribution. 
 One of the most important requirements in 
treatment planning is the geometric accuracy. Of 
all the imaging modalities, CT provides the best 
geometric accuracy and, therefore, CT images are 
considered a reference for anatomic landmarks, 
when compared with the other modality images.
SEGMENTATION OF STRUCTURES 
 The term image segmentation in treatment planning 
refers to slice-by-slice delineation of anatomic 
regions of interest, for example, external contours, 
targets, critical normal structures, anatomic 
landmarks, etc. 
 The segmented regions can be rendered in 
different colors and can be viewed in BEV 
configuration or in other planes using DRRs. 
Segmentation is also essential for calculating dose 
volume histograms (DVHs) for the selected regions 
of interest.
 Image segmentation is one of the most laborious but 
important processes in treatment planning. 
 Although the process can be aided for automatic 
delineation based on image contrast near the 
boundaries of structures, target delineation requires 
clinical judgment, which cannot be automated or 
completely image based.
TREATMENT PLANNING FOR 3-D CONFORMAL RADIOTHERAPY 
 CT: attenuation coefficients (m), can be converted to 
electron density, 
 used for treatment planning/dose calculation. 
 Spatial resolution ~1mm in X/Y directions, 
 variable (1-10 mm) in Z-direction, which affects the 
quality of DRR 
 MRI: proton density, better soft tissue delineation 
(brain, head/neck, prostate), but insensitive to 
calcification and bony structures. 
 Spatial resolution ~1mm in all directions. 
 PET: functional image
DEFINITION OF VOLUMES 
 Volume definition is a prerequisite for meaningful 3-D 
treatment planning and for accurate dose reporting. 
ICRU Reports 62 and 83 define and describe several 
target and critical structure volumes that aid in the 
treatment planning process and provide a basis for 
comparison of treatment outcomes 
 Gross tumor volume or GTV 
 Clinical target volume or CTV 
 Planning target volume or PTV 
 Organ at risk or OAR 
 Planning organ-at-risk volume or PRV 
 Internal target volume or ITV 
 Treated volume or TV 
 Remaining volume at risk or RVR
 The Gross Tumor Volume (GTV) is the 
gross palpable or visible/ demonstrable 
extent and location of malignant growth. 
 The GTV is usually based on information 
obtained from a combination of imaging 
modalities (computed tomography (CT), 
magnetic resonance imaging (MRI), 
ultrasound, etc.), diagnostic modalities 
(pathology and histological reports, etc.) 
and clinical examination.
 Clinical target volume. 
 The clinical target volume (CTV) is the tissue volume that 
contains a demonstrable GTV and/or sub-clinical 
microscopic malignant disease, which has to be 
eliminated. This volume thus has to be treated 
adequately in order to achieve the aim of therapy, cure or 
palliation. 
 The CTV often includes the area directly surrounding the 
GTV, which may contain microscopic disease and other 
areas considered to be at risk and requiring treatment 
(e.g. positive lymph nodes). 
 The CTV is usually stated as a fixed or variable margin 
around the GTV (e.g. CTV = GTV + 1 cm margin), but in 
some cases it is the same as the GTV (e.g. prostate
Internal target volume 
 The ITV consists of the CTV plus an internal margin. 
The internal margin is designed to take into account 
the variations in the size and position of the CTV 
relative to the patient’s reference frame (usually 
defined by the bony anatomy); that is, variations due 
to organ motions such as breathing and bladder or 
rectal contents.
Planning target volume 
 The planning target volume (PTV) is a 
geometrical concept, and it is defined to select 
appropriate beam arrangements, taking into 
consideration the net effect of all possible 
geometrical variations, in order to ensure that the 
prescribed dose is actually absorbed in the CTV. 
 The PTV includes the internal target margin 
(ICRU Report No. 62) and an additional margin 
for set-up uncertainties, machine tolerances and 
intratreatment variations. The PTV is linked to the 
reference frame of the treatment machine and is 
often described as the CTV plus a fixed or 
variable margin (e.g. PTV = CTV + 1 cm).
 The PTV depends on the precision of such tools 
as immobilization devices and lasers, but does 
not include a margin for the dosimetric 
characteristics of the radiation beam (i.e. 
penumbral areas and buildup region), as these 
will require an additional margin during treatment 
planning and shielding design.
Organ at risk 
 The organ at risk is an organ whose sensitivity to 
radiation is such that the dose received from a 
treatment plan may be significant compared with its 
tolerance, possibly requiring a change in the beam 
arrangement or a change in the dose. 
 Specific attention should be paid to organs that, 
although not immediately adjacent to the CTV, have a 
very low tolerance dose (e.g. the eye lens during 
nasopharyngeal or brain tumor treatments). 
 Organs with a radiation tolerance that depends on the 
fractionation scheme should be outlined completely to 
prevent biasing during treatment plan evaluation.
Planning Organ at Risk Volume 
 As is the case with the PTV, uncertainties and 
variations in the position of the OAR during 
treatment must be considered to avoid serious 
complications. For this reason, margins have to be 
added to the OARs to compensate for these 
uncertainties and variations, using similar principles 
as for the PTV. 
 A margin around an OAR with a serial-like structure 
(e.g., spinal cord) is more clinically relevant than that 
around an OAR with a parallel-like structure (e.g., 
liver, lung, parotid).
Treated Volume 
 Because of the limitations of irradiation 
techniques, the volume receiving the prescribed 
absorbed dose might be different than the PTV; it 
might be larger (sometimes much larger) or 
smaller, and in general more simply shaped (less 
so with IMRT than with conventional or three 
dimensional radiation therapy).
The treatment planning process 
 Once the target volume, organs at risk, and 
the required doses have been defined, the 
treatment plan will be produced by a person 
trained in 3-D planning. 
 The aim of the treatment planning process is 
to achieve the dose objectives to the target 
and critical structures and to produce a dose 
distribution that is “optimal”.
 The beam angles can be chosen using standard 
templates such as a six field prostate plan or by 
using a beam’s-eye-view display to maximize PTV 
coverage and to minimize irradiation of critical 
structures. 
 When a beam aperture is defined, an additional 
margin of about 7 to 8 mm needs to be added 
beyond the PTV in all directions in the transverse 
plane to obtain the desired dose coverage to the 
PTV.
 In the superior inferior directions one needs to add 
about 12 to 15 mm margin because of beam 
divergence effects. 
 In its most basic implementation conformal 
radiotherapy may consist of coplanar static beams in 
a standard geometric configuration with MLCs or 
conformal blocks used to achieve the required 
conformal shape.
Dose-volume Histograms 
 Display of dose distribution in the form of isodose 
curves or surfaces is useful because it shows not only 
regions of uniform dose, high dose, or low dose, but 
also their anatomic location and extent. 
 In 3-D treatment planning, this information is essential 
but should be supplemented by DVHs for the 
segmented structures, for example, targets, critical 
structures, etc. 
 A DVH not only provides quantitative information with 
regard to how much dose is absorbed in how much 
volume, but also summarizes the entire dose 
distribution into a single curve for each anatomic 
structure of interest. It is, therefore, a great tool for 
evaluating a given plan or comparing competing plans
 The DVH may be represented in two forms: 
the cumulative integral DVH and the 
differential DVH. 
 The cumulative DVH is a plot of the volume 
of a given structure receiving a certain dose 
or higher as a function of dose . 
 Any point on the cumulative DVH curve 
shows the volume that receives the 
indicated dose or higher. The differential 
DVH is a plot of volume receiving a dose 
within a specified dose interval (or dose 
bin) as a function of dose
100 
75 
50 
25 
0 
Volume (%) 
target 
bladder 
rectum 
0 25 50 75 100 
Dose (Gy) 
femurs 
D=77Gy 
V=90% 
D=75Gy 
V=30% 
D=72Gy 
DVH for a prostate plan
Dose Computation Algorithms 
 Dose calculation algorithms for computerized 
treatment planning have been evolving since the 
middle of the 1950s. In broad terms the algorithms 
fall into three categories. 
 a) correction based, 
 (b) model based, 
 (c) direct Monte Carlo 
 Either one of the methods can be used for 3-D 
treatment planning, although with a varying degree of 
accuracy and speed. However, the model-based 
algorithms and the direct Monte Carlo are becoming 
more and more the algorithms of the future.
Correction-based Algorithms 
 These algorithms are semiempirical. They are based 
primarily on measured data (e.g., percent depth doses 
and cross-beam profiles, etc.) obtained in a cubic water 
phantom. 
 The corrections typically consist of 
 (a) attenuation corrections for contour irregularity; 
 (b) scatter corrections as a function of scattering volume, 
field size, shape, and radial distance; 
 (c) geometric corrections for source to point of calculation 
distance based on inverse square law; 
 (d) attenuation corrections for beam intensity modifiers 
such as wedge filters, compensators, blocks, etc.; 
 (e) attenuation corrections for tissue heterogeneities 
based on radiologic path length
Model-based Algorithms 
 Convolution-superposition is currently the most 
accurate model-based algorithm. 
 Direct Monte Carlo is the most accurate method for 
treatment planning, but currently it is not feasible 
because it requires prohibitively long computational 
times. However, with the continuing advancement of 
computer technology, it is possible that direct Monte 
Carlo will be used routinely for treatment planning in 
the not too distant future.
Thank 
you

New microsoft office power point presentation

  • 1.
    THREE-DIMENSIONAL CONFORMAL RADIATIONTHERAPY P Sathish Kumar RNT MEDICAL COLLEGE UDAIPUR
  • 2.
    INTRODUCTION  Theaims of 3-D CRT are to achieve conformity of the high dose region to the target volume and consequently to reduce the dose to the surrounding normal tissues.  3-D conformal radiotherapy (3-D CRT) is the term used to describe the design and delivery of radiotherapy treatment plans based on 3-D image data with treatment fields individually shaped to treat only the target tissue.
  • 3.
    A typical 3-DCRT Process
  • 5.
    CLINICAL IMPLEMENTATION OF3-D CONFORMAL RADIOTHERAPY  PATIENT ASSESSMENT AND DECISION TO TREAT WITH RADIATION.  IMMOBILIZATION AND PATIENT POSITIONING.  IMAGE ACQUISITION AND TARGET LOCALIZATION. CT imaging MRI and other imaging modalities • SEGMENTATION OF STRUCTURES. • TREATMENT PLANNING FOR 3-D CONFORMAL RADIOTHERAPY.
  • 6.
    PATIENT ASSESSMENT ANDDECISION TO TREAT WITH RADIATION  The first step in the process is patient assessment and deciding how the patient should be treated. During assessment various diagnostic and investigative procedures are undertaken to define the state of the disease.  This involves imaging, biochemical testing and review of pathologic information to identify the type, stage and grade of the cancer. The decision to treat the patient with radiation should be made by a team of clinicians
  • 7.
    IMMOBILIZATION AND PATIENT POSITIONING Ra.diation treatment accuracy can be divided into two separate but highly interrelated issues: Dosimetric accuracy- deal with issues such as radiation beam calibration and dose calculations. Geometric accuracy- It covers issues related to patient positioning and immobilization that have a strong effect on how well we can accurately cover a specified anatomic volume with a desired radiation dose
  • 8.
     An accuratelyset up laser alignment system is an essential requirement for accurate radiotherapy.  This should consist of at least three lasers to provide two lateral crosses and a sagittal line which can be used in conjunction with appropriately placed tattoos to ensure the patient is not rotated.  Special immobilization systems are available for immobilizing different parts of the body
  • 9.
    For example, kneesupports and ankle stocks are used for pelvic and abdominal immobilization, adjustable breast boards are used for breast and vacuum immobilization bags or alpha cradles are used for chest, thermoplastic masks are used for head and neck treatment, and relocatable stereotactic frames are used for brain tumours.
  • 10.
    Head Rest headrest- transparent headrest Polyurethane
  • 11.
    H &N Molds FLATTENED AT 70° C IN WATER HARDENS IN FEW MINUTES USED FOR HEAD & NECK AND PELVIS CASES EASILY FIXED TO THE COUCH REUSABLE CAN BE CUT AT STRATEGIC PLACES FOR BEAM ENTRANCE LASTS LONG WITHOUT DETERIORATION
  • 12.
    Patient is placedon the couch in the same position as was during simulation using the same immobilization devices
  • 13.
    Image acquisition andtarget Localization  CT imaging  For many tumour sites CT scanning provides the optimal method of tumour localization. All CT planning must be carried out under conditions as nearly identical as possible to those in the treatment room, including the patient support system (couch top), laser positioning lights and any patient positioning aids.
  • 14.
  • 15.
     For conformaltherapy a slice separation and thickness of between 3 mm and 5 mm is recommended for CT scanning.  For head and neck and Central Nervous System (CNS) planning this may be reduced to between 2 mm and 3 mm.  The CT scanner couch top must be flat, securely fitted and compatible with the therapy machine couch. Transverse and longitudinal lasers with additional laser positioning lights are needed in the CT room identical to those in the treatment room to ensure exact positioning of the patient.
  • 16.
    Digitally reconstructed radiographs  One of the important features of 3-D treatment planning is the ability to reconstruct images in planes other than that of the original transverse image. These are called the digitally reconstructed radiographs (DRRs).  DRRs are produced by tracing ray lines from a virtual source position through the CT data of the patient to a virtual film plane. The sum of the attenuation coefficients along any one ray line gives a quantity analogous to optical density (OD) on a radiographic film.
  • 17.
  • 18.
     In treatmentplanning, MRI images may be used alone or in conjunction with CT images. In general, MRI is considered superior to CT in soft-tissue discrimination such as central nervous system tumors and abnormalities in the brain.  Also, MRI is well suited to imaging head and neck cancers, sarcomas, the prostate gland, and lymph nodes. On the other hand, it is insensitive to calcification and bony structures, which are best imaged with CT.  Although important differences exist between CT and MRI image characteristics, the two are considered complementary in their roles in treatment planning.
  • 19.
     The mostbasic difference between CT and MRI is that the former is related to electron density and atomic number (actually representing x-ray linear attenuation coefficients), while the latter shows proton density distribution.  One of the most important requirements in treatment planning is the geometric accuracy. Of all the imaging modalities, CT provides the best geometric accuracy and, therefore, CT images are considered a reference for anatomic landmarks, when compared with the other modality images.
  • 20.
    SEGMENTATION OF STRUCTURES  The term image segmentation in treatment planning refers to slice-by-slice delineation of anatomic regions of interest, for example, external contours, targets, critical normal structures, anatomic landmarks, etc.  The segmented regions can be rendered in different colors and can be viewed in BEV configuration or in other planes using DRRs. Segmentation is also essential for calculating dose volume histograms (DVHs) for the selected regions of interest.
  • 21.
     Image segmentationis one of the most laborious but important processes in treatment planning.  Although the process can be aided for automatic delineation based on image contrast near the boundaries of structures, target delineation requires clinical judgment, which cannot be automated or completely image based.
  • 22.
    TREATMENT PLANNING FOR3-D CONFORMAL RADIOTHERAPY  CT: attenuation coefficients (m), can be converted to electron density,  used for treatment planning/dose calculation.  Spatial resolution ~1mm in X/Y directions,  variable (1-10 mm) in Z-direction, which affects the quality of DRR  MRI: proton density, better soft tissue delineation (brain, head/neck, prostate), but insensitive to calcification and bony structures.  Spatial resolution ~1mm in all directions.  PET: functional image
  • 23.
    DEFINITION OF VOLUMES  Volume definition is a prerequisite for meaningful 3-D treatment planning and for accurate dose reporting. ICRU Reports 62 and 83 define and describe several target and critical structure volumes that aid in the treatment planning process and provide a basis for comparison of treatment outcomes  Gross tumor volume or GTV  Clinical target volume or CTV  Planning target volume or PTV  Organ at risk or OAR  Planning organ-at-risk volume or PRV  Internal target volume or ITV  Treated volume or TV  Remaining volume at risk or RVR
  • 24.
     The GrossTumor Volume (GTV) is the gross palpable or visible/ demonstrable extent and location of malignant growth.  The GTV is usually based on information obtained from a combination of imaging modalities (computed tomography (CT), magnetic resonance imaging (MRI), ultrasound, etc.), diagnostic modalities (pathology and histological reports, etc.) and clinical examination.
  • 25.
     Clinical targetvolume.  The clinical target volume (CTV) is the tissue volume that contains a demonstrable GTV and/or sub-clinical microscopic malignant disease, which has to be eliminated. This volume thus has to be treated adequately in order to achieve the aim of therapy, cure or palliation.  The CTV often includes the area directly surrounding the GTV, which may contain microscopic disease and other areas considered to be at risk and requiring treatment (e.g. positive lymph nodes).  The CTV is usually stated as a fixed or variable margin around the GTV (e.g. CTV = GTV + 1 cm margin), but in some cases it is the same as the GTV (e.g. prostate
  • 26.
    Internal target volume  The ITV consists of the CTV plus an internal margin. The internal margin is designed to take into account the variations in the size and position of the CTV relative to the patient’s reference frame (usually defined by the bony anatomy); that is, variations due to organ motions such as breathing and bladder or rectal contents.
  • 27.
    Planning target volume  The planning target volume (PTV) is a geometrical concept, and it is defined to select appropriate beam arrangements, taking into consideration the net effect of all possible geometrical variations, in order to ensure that the prescribed dose is actually absorbed in the CTV.  The PTV includes the internal target margin (ICRU Report No. 62) and an additional margin for set-up uncertainties, machine tolerances and intratreatment variations. The PTV is linked to the reference frame of the treatment machine and is often described as the CTV plus a fixed or variable margin (e.g. PTV = CTV + 1 cm).
  • 28.
     The PTVdepends on the precision of such tools as immobilization devices and lasers, but does not include a margin for the dosimetric characteristics of the radiation beam (i.e. penumbral areas and buildup region), as these will require an additional margin during treatment planning and shielding design.
  • 29.
    Organ at risk  The organ at risk is an organ whose sensitivity to radiation is such that the dose received from a treatment plan may be significant compared with its tolerance, possibly requiring a change in the beam arrangement or a change in the dose.  Specific attention should be paid to organs that, although not immediately adjacent to the CTV, have a very low tolerance dose (e.g. the eye lens during nasopharyngeal or brain tumor treatments).  Organs with a radiation tolerance that depends on the fractionation scheme should be outlined completely to prevent biasing during treatment plan evaluation.
  • 30.
    Planning Organ atRisk Volume  As is the case with the PTV, uncertainties and variations in the position of the OAR during treatment must be considered to avoid serious complications. For this reason, margins have to be added to the OARs to compensate for these uncertainties and variations, using similar principles as for the PTV.  A margin around an OAR with a serial-like structure (e.g., spinal cord) is more clinically relevant than that around an OAR with a parallel-like structure (e.g., liver, lung, parotid).
  • 31.
    Treated Volume Because of the limitations of irradiation techniques, the volume receiving the prescribed absorbed dose might be different than the PTV; it might be larger (sometimes much larger) or smaller, and in general more simply shaped (less so with IMRT than with conventional or three dimensional radiation therapy).
  • 32.
    The treatment planningprocess  Once the target volume, organs at risk, and the required doses have been defined, the treatment plan will be produced by a person trained in 3-D planning.  The aim of the treatment planning process is to achieve the dose objectives to the target and critical structures and to produce a dose distribution that is “optimal”.
  • 33.
     The beamangles can be chosen using standard templates such as a six field prostate plan or by using a beam’s-eye-view display to maximize PTV coverage and to minimize irradiation of critical structures.  When a beam aperture is defined, an additional margin of about 7 to 8 mm needs to be added beyond the PTV in all directions in the transverse plane to obtain the desired dose coverage to the PTV.
  • 34.
     In thesuperior inferior directions one needs to add about 12 to 15 mm margin because of beam divergence effects.  In its most basic implementation conformal radiotherapy may consist of coplanar static beams in a standard geometric configuration with MLCs or conformal blocks used to achieve the required conformal shape.
  • 35.
    Dose-volume Histograms Display of dose distribution in the form of isodose curves or surfaces is useful because it shows not only regions of uniform dose, high dose, or low dose, but also their anatomic location and extent.  In 3-D treatment planning, this information is essential but should be supplemented by DVHs for the segmented structures, for example, targets, critical structures, etc.  A DVH not only provides quantitative information with regard to how much dose is absorbed in how much volume, but also summarizes the entire dose distribution into a single curve for each anatomic structure of interest. It is, therefore, a great tool for evaluating a given plan or comparing competing plans
  • 36.
     The DVHmay be represented in two forms: the cumulative integral DVH and the differential DVH.  The cumulative DVH is a plot of the volume of a given structure receiving a certain dose or higher as a function of dose .  Any point on the cumulative DVH curve shows the volume that receives the indicated dose or higher. The differential DVH is a plot of volume receiving a dose within a specified dose interval (or dose bin) as a function of dose
  • 37.
    100 75 50 25 0 Volume (%) target bladder rectum 0 25 50 75 100 Dose (Gy) femurs D=77Gy V=90% D=75Gy V=30% D=72Gy DVH for a prostate plan
  • 38.
    Dose Computation Algorithms  Dose calculation algorithms for computerized treatment planning have been evolving since the middle of the 1950s. In broad terms the algorithms fall into three categories.  a) correction based,  (b) model based,  (c) direct Monte Carlo  Either one of the methods can be used for 3-D treatment planning, although with a varying degree of accuracy and speed. However, the model-based algorithms and the direct Monte Carlo are becoming more and more the algorithms of the future.
  • 39.
    Correction-based Algorithms These algorithms are semiempirical. They are based primarily on measured data (e.g., percent depth doses and cross-beam profiles, etc.) obtained in a cubic water phantom.  The corrections typically consist of  (a) attenuation corrections for contour irregularity;  (b) scatter corrections as a function of scattering volume, field size, shape, and radial distance;  (c) geometric corrections for source to point of calculation distance based on inverse square law;  (d) attenuation corrections for beam intensity modifiers such as wedge filters, compensators, blocks, etc.;  (e) attenuation corrections for tissue heterogeneities based on radiologic path length
  • 40.
    Model-based Algorithms Convolution-superposition is currently the most accurate model-based algorithm.  Direct Monte Carlo is the most accurate method for treatment planning, but currently it is not feasible because it requires prohibitively long computational times. However, with the continuing advancement of computer technology, it is possible that direct Monte Carlo will be used routinely for treatment planning in the not too distant future.
  • 41.