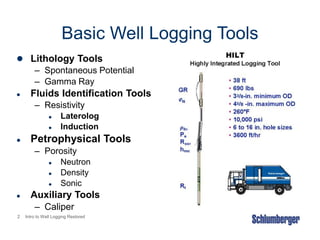
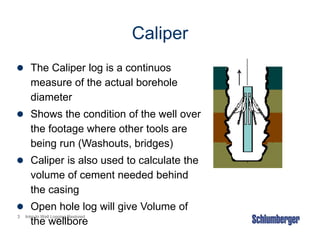
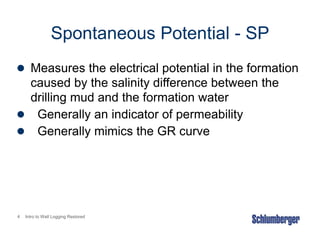
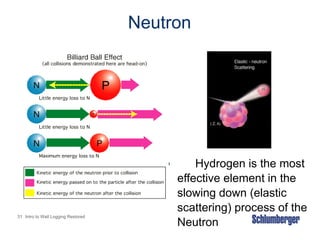
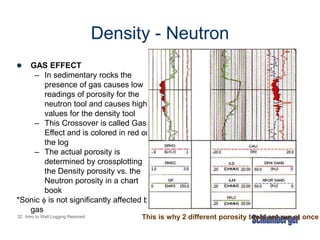
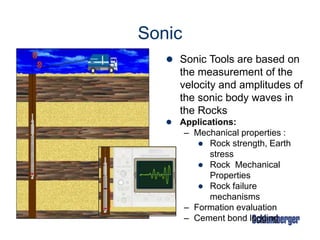
2. 2 Intro to Well Logging Restored
Basic Well Logging Tools
Lithology Tools
– Spontaneous Potential
– Gamma Ray
Fluids Identification Tools
– Resistivity
Laterolog
Induction
Petrophysical Tools
– Porosity
Neutron
Density
Sonic
Auxiliary Tools
– Caliper
3. 3 Intro to Well Logging Restored
Caliper
The Caliper log is a continuos
measure of the actual borehole
diameter
Shows the condition of the well over
the footage where other tools are
being run (Washouts, bridges)
Caliper is also used to calculate the
volume of cement needed behind
the casing
Open hole log will give Volume of
the wellbore
4. 4 Intro to Well Logging Restored
Spontaneous Potential - SP
Measures the electrical potential in the formation
caused by the salinity difference between the
drilling mud and the formation water
Generally an indicator of permeability
Generally mimics the GR curve
5. 5 Intro to Well Logging Restored
Spontaneous Potential - SP
6. 6 Intro to Well Logging Restored
Spontaneous Potential - SP
SP:
– Membrane Potential -
Em
– Liquid Junction Potential
- Ej
“The SP cannot be
recorded in holes with
nonconductive muds”
7. 7 Intro to Well Logging Restored
Spontaneous Potential - SP
If Rmf > Rw
– Shales will have a low SP
and clean sandstones will
have a higher SP.
If Rmf < Rw
– Shales will have a high
SP and clean sandstones
will have a lower SP.
If Rmf = Rw
– Little SP will be
developed and the SP log
will have very little
character.
8. 8 Intro to Well Logging Restored
Spontaneous Potential - SP
Shaliness indicator
– SPshale = -10 mV
– SPsand = -40 mV
– SPlog = SP reading from
the log = -25 mV
– The percentage of shale
will be :
SPlog - SPshale / SPsand
- SPshale =
– 15/-30 = .5 or 50% shale
Fresh and saltwater interface
Correlation
9. 9 Intro to Well Logging Restored
SP Log Response
Shale
Impervious
nonshale
Impervious
nonshale
Reservoir
bed
Reservoir
bed
Shale
SP
11. 11 Intro to Well Logging Restored
Gamma Ray
Gamma Ray Tools detect the naturally
occurring radiation within the rock
Radioactive elements tend to
concentrate in clays and shales
Potassium (K)
Uranium (U)
Thorium (Th)
12. 12 Intro to Well Logging Restored
Gamma Ray
In sedimentary formations, the
GR log reflects the clay or
shale content
Clean formations, such as
sandstones or limestones,
usually have a very low level of
radioactivity
In general, the lower the
Gamma Ray reading, the
cleaner the sand
Gamma Ray logs can be run in
cased holes, but the data will
be suppressed
13. 13 Intro to Well Logging Restored
Example GR Log
GRC
0 150
SPC
MV
-160 40
ACAL
6 16
ILDC
0.2 200
SNC
0.2 200
MLLCF
0.2 200
RHOC
1.95 2.95
CNLLC
0.45 -0.15
DT
us/f
150 50
001) BONANZA 1
10700
10800
10900
GR
Log
14. 14 Intro to Well Logging Restored
Resistivity Tools
Induction Tools
– Run in nonconductive or low-conductivity muds
– Dual Induction - DIL: Is the earlier version of induction tool
which read a Shallow (SFL) and deep measurement
– Phasor Induction - DIT-E: Is an enhanced Induction tool
giving Shallow, Medium, and Deep measurements
– Array Induction - AIT: Is the newer generation of Induction
tools giving 5 curves with set depths of investigation: 10”
(shallow), 20”, 30”, 60”, 90”.
Laterolog Tools
– Run in highly conductive muds (salt based)
– HRLA
15. 15 Intro to Well Logging Restored
Resistivity
Resistivity of the salt
water is low (highly
conductive)
Resistivity of the Oil is high
(Poor conductor)
16. 16 Intro to Well Logging Restored
Resistivity
Dry, nonmetallic minerals (rock matrix) have a very
high resistivity
17. 17 Intro to Well Logging Restored
Resistivity
The resistivity of a rock is a measurement of the
resistivity of the rock matrix as well as the
resistivity of the fluid within the porous volume of
the rock.
19. 19 Intro to Well Logging Restored
Borehole
Effects
on
Resistivity
Logs
20. 20 Intro to Well Logging Restored
Resistivity Profiles
Depth of Investigation:
– Logging tools are designed to
measure resistivity at different depths
radially from the wellbore to
determine the resistivity of the
flushed zone and the virgin zone.
– Flushed zone - is closest to the
wellbore and has been invaded by
drilling fluids (original fluids have
been flushed out).
– Virgin zone - is farthest from the
wellbore and has not been invaded
by drilling fluids. Clients will want to
use Virgin zone measurements
21. 21 Intro to Well Logging Restored
Invasion
Resistivity profile is the radial
distribution of resisitivity
resulting from the invasion of
fluids having different
conductivity than the formation
fluids.
Resistivity Profiles can tell a
client about permeability on a
qualitative level.
22. 22 Intro to Well Logging Restored
Laterolog
Laterolog
Principle:
– Measuring the
voltage difference
between two
electrodes is the
fundamental idea
behind laterolog
devices.
24. 24 Intro to Well Logging Restored
Porosity
Porosity Tools
Density
Neutron
Sonic
Magnetic Resonance
25. 25 Intro to Well Logging Restored
Density a 1 / Porosity
Density
Measuring the number of gamma rays and their
energy levels at a given distance from the source,
the electron density of the formation can be
predicted
26. 26 Intro to Well Logging Restored
Bulk Density
Matrix Fluids
f
ma
b 1
27. 27 Intro to Well Logging Restored
Porosity From Density Log
Porosity equation
The fluid density equation
xo
h
xo
mf
f S
1
S
f
ma
b
ma
29. 29 Intro to Well Logging Restored
Example Solution Density Log
GRC
0 150
SPC
MV
-160 40
ACAL
6 16
ILDC
0.2 200
SNC
0.2 200
MLLCF
0.2 200
RHOC
1.95 2.95
DPHISS
dec
0.45 -0.15
DT
us/f
150 50
001) BONANZA 1
10700
10800
10900
DPHI
30. 30 Intro to Well Logging Restored
Neutron
Neutron tools emit high energy
neutrons from either a
chemical source or a neutron
generator device (minitron)
and measure the response of
these neutrons as they
interact with the formation
31. 31 Intro to Well Logging Restored
Neutron
Hydrogen is the most
effective element in the
slowing down (elastic
scattering) process of the
Neutron
32. 32 Intro to Well Logging Restored
Density - Neutron
GAS EFFECT
– In sedimentary rocks the
presence of gas causes low
readings of porosity for the
neutron tool and causes high
values for the density tool
– This Crossover is called Gas
Effect and is colored in red on
the log
– The actual porosity is
determined by crossplotting
the Density porosity vs. the
Neutron porosity in a chart
book
*Sonic is not significantly affected by
gas
This is why 2 different porosity tools are run at once
34. 34 Intro to Well Logging Restored
Sonic
Sonic Tools are based on
the measurement of the
velocity and amplitudes of
the sonic body waves in
the Rocks
Applications:
– Mechanical properties :
Rock strength, Earth
stress
Rock Mechanical
Properties
Rock failure
mechanisms
– Formation evaluation
– Cement bond logging
35. 35 Intro to Well Logging Restored
Sonic - Formation Evaluation
The speed of sound depends
principally upon the rock matrix
material and the porosity.
The measurement of
compressional and shear wave
slowness can help us estimate:
– Primary porosity
– Lithology
– Presence of natural gas
Gas Effect
in Sonic
Log
36. 36 Intro to Well Logging Restored
Sonic Log
The response can be written as follows:
f
ma
log t
1
t
t
ma
f
ma
t
t
t
t
log
39. 39 Intro to Well Logging Restored
t
m
w
n
w
R
R
a
S
Formation Water Resistivity
40. 40 Intro to Well Logging Restored
Determining Rw
Directly
– From measured water sample
– This is the most accurate Rw reading
Indirectly
– From openhole well logs
SP logs
Pickett plots
Rwa technique
41. 41 Intro to Well Logging Restored
Rw Using the Rwa Technique
t
m
wa R
R
42. 42 Intro to Well Logging Restored
Mechanical Properties from Logs
From sonic data the mechanical
properties of the rock can be calculated
giving a continuous stress and
mechanical properties profile, but it
needs to be calibrated with external,
data either from core test or DataFRAC
Dipole Sonic is an Array tool which
gives Mechanical Properties. Geoquest
will process the data and create a
FracHite log and Mechanical Properties.
43. 43 Intro to Well Logging Restored
Sonic - CBL
Cement Bond
Logging
– Cement bond logs (CBL)
are used to evaluate the
quality of the cement
that was put in place
during the well
completion process
– An Amplitude gives a
quantitative reading and
the VDL (Variable
Density Log) shows the
quality of the bond
44. 44 Intro to Well Logging Restored
CMR - Combinable Magnetic
Resonance
CMR Gives information on:
– Grain size and distribution
– Permeability
– Free-fluid porosity
– Bound-fluid porosity
Helps client determine how much water will
actually flow out of the formation, and how much
is irreducible
45. 45 Intro to Well Logging Restored
CMR
T2 Distribution
MDT Perm
plotted on top
of CMR Perm
46. 47 Intro to Well Logging Restored
FMI
By wrapping the log we
can envision the wellbore
Faults and fractures can
be
traced on the log
Thin laminations can be
seen in the images