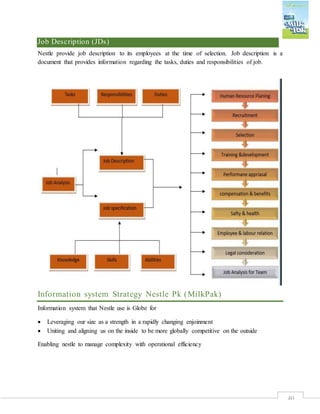
Downloaded 308 times
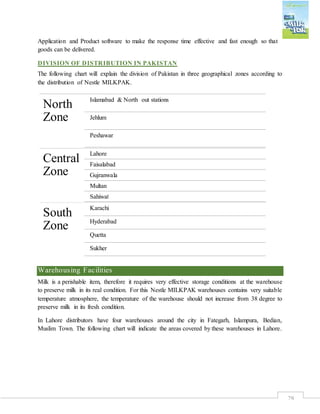
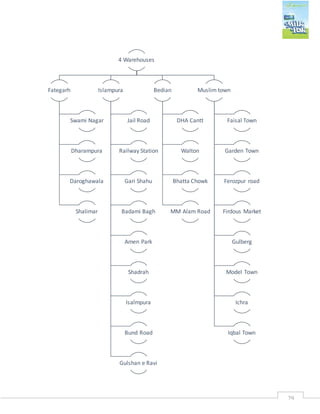

This document provides an overview of Nestle MilkPak, a subsidiary of Nestle Pakistan. It discusses the history of Nestle and Henri Nestle, the founder. It then focuses on Nestle MilkPak, describing its history in Pakistan, product offerings, and SWOT analysis. The document also examines MilkPak's marketing strategy, operations including supply chain and milk collection, and human resource management. It aims to understand how to make a project on Nestle MilkPak for general audiences.


