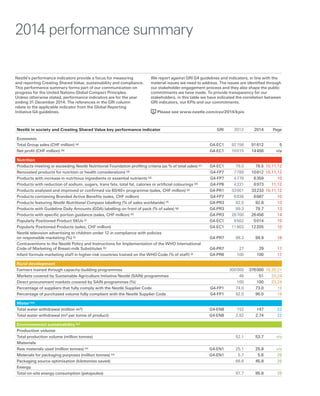
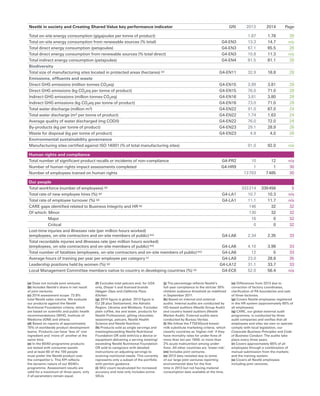
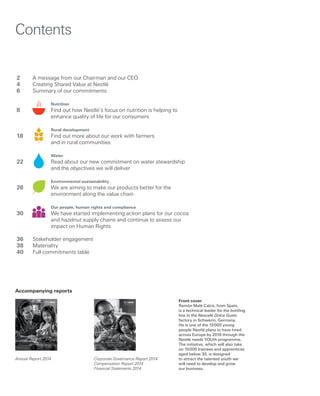
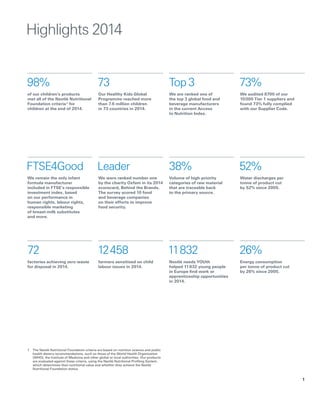
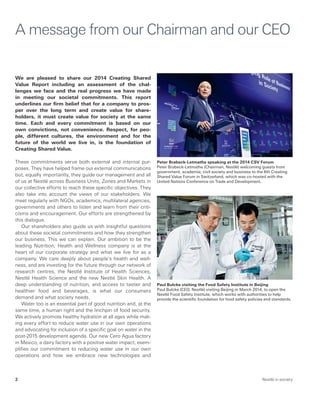
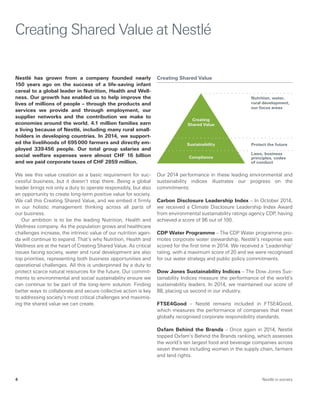
SlideShare a Scribd company logo
Nestlé in society
Creating Shared Value and meeting our commitments 2014
Nestlé in society and Creating Shared Value key performance indicator GRI 2013 2014 Page
Economic
Total Group sales (CHF million) (a) G4-EC1 92 158 91 612 5
Net profit (CHF million) (b) G4-EC1 10 015 14 456 n/a
Nutrition
Products meeting or exceeding Nestlé Nutritional Foundation profiling criteria (as % of total sales) (c) G4-EC1 76.0 78.5 10,11,12
Renovated products for nutrition or health considerations (d) G4-FP7 7 789 10 812 10,11,12
Products with increase in nutritious ingredients or essential nutrients (d) G4-FP7 4 778 6 359 10
Products with reduction of sodium, sugars, trans fats, total fat, calories or artificial colourings (d) G4-FP6 4 221 6 973 11,12
Products analysed and improved or confirmed via 60/40+ programme (sales, CHF million) (e) G4-PR1 33 001 33 233 10,11,12
Products containing Branded Active Benefits (sales, CHF million) G4-FP7 6 836 6 687 10
Products featuring Nestlé Nutritional Compass labelling (% of sales worldwide) (f) G4-PR3 92.5 92.8 13
Products with Guideline Daily Amounts (GDA) labelling on front of pack (% of sales) (g) G4-PR3 99.3 79.7 13
Products with specific portion guidance (sales, CHF million) (h) G4-PR3 26 700 26 456 14
Popularly Positioned Product SKUs (i) G4-EC1 9 562 5 014 10
Popularly Positioned Products (sales, CHF million) G4-EC1 11 803 12 205 10
Nestlé television advertising to children under 12 in compliance with policies
on responsible marketing (%) (j) G4-PR7 98.3 99.9 16
Contraventions to the Nestlé Policy and Instructions for Implementation of the WHO International
Code of Marketing of Breast-milk Substitutes (k) G4-PR7 27 29 17
Infant formula marketing staff in higher-risk countries trained on the WHO Code (% of staff) (l) G4-PR6 100 100 17
Rural development
Farmers trained through capacity-building programmes 300 000 376 000 18,20,21
Markets covered by Sustainable Agriculture Initiative Nestlé (SAIN) programmes 48 51 23,24
Direct procurement markets covered by SAIN programmes (%) 100 100 23,24
Percentage of suppliers that fully comply with the Nestlé Supplier Code G4-FP1 74.0 73.0 19
Percentage of purchased volume fully compliant with the Nestlé Supplier Code G4-FP1 92.0 95.0 19
Water (m)
Total water withdrawal (million m3) G4-EN8 152 147 22
Total water withdrawal (m3 per tonne of product) G4-EN8 2.92 2.74 22
Environmental sustainability (m)
Production volume
Total production volume (million tonnes) 52.1 53.7 n/a
Materials
Raw materials used (million tonnes) (n) G4-EN1 25.1 25.8 n/a
Materials for packaging purposes (million tonnes) (n) G4-EN1 5.7 5.6 26
Packaging source optimisation (kilotonnes saved) 66.6 45.8 26
Energy
Total on-site energy consumption (petajoules) 97.7 95.8 26
Nestlé’s performance indicators provide a focus for measuring
and reporting Creating Shared Value, sustainability and compliance.
This performance summary forms part of our communication on
progress for the United Nations Global Compact Principles.
Unless otherwise stated, performance indicators are for the year
ending 31 December 2014. The references in the GRI column
relate to the applicable indicator from the Global Reporting
Initiative G4 guidelines.
We report against GRI G4 guidelines and indicators, in line with the
material issues we need to address. The issues are identified through
our stakeholder engagement process and they also shape the public
commitments we have made. To provide transparency for our
stakeholders, in this table we have indicated the correlation between
GRI indicators, our KPIs and our commitments.
Please see www.nestle.com/csv/2014/kpis
2014 performance summary
(a) Does not include joint ventures.
(b) Includes Nestlé’s share in net result
of joint ventures.
(c) 2014 assessment scope: 73.8%
total Nestlé sales volume. We evaluate
our products against the Nestlé
Nutritional Foundation criteria, which
are based on scientific and public health
recommendations (WHO, Institute of
Medicine (IOM) and others).
(d) Based on reports of approximately
75% of worldwide product development
teams. Products can have ‘less of’ one
ingredient and ‘more of’ another at the
same time.
(e) In the 60/40 programme products
are tested with consumer panels
and at least 60 of the 100 people
must prefer the Nestlé product over
the competitor’s. This KPI reflects
the dynamic nature of our 60/40+
programme. Assessment results are
valid for a maximum of three years, only
if all parameters remain equal.
(f) Excludes total petcare and, for USA
only, Dreyer’s and licensed brands
Häagen-Dazs and California Pizza
Kitchen.
(g) 2014 figure is global. 2013 figure is
EU 28 plus Switzerland, the Adriatic
Region, Ukraine and Moldavia. Excludes
plain coffee, tea and water, products for
Nestlé Professional, gifting chocolate,
seasonings, petcare, Nestlé Health
Science and Nestlé Nutrition.
(h) Products sold as single servings and
meeting/exceeding Nestlé Nutritional
Foundation OR sold with/via a device or
equipment delivering a serving meeting/
exceeding Nestlé Nutritional Foundation
OR sold to caregivers with detailed
instructions on adjusting servings to
evolving nutritional needs. This currently
represents only a subset of the portfolio
with portion guidance.
(i) SKU count recalculated for increased
accuracy and now only includes active
SKUs.
(j) The percentage reflects Nestlé’s
full-year compliance to the stricter 35%
children audience threshold as redefined
in September 2011.
(k) Based on internal and external
audits. Internal audits are conducted by
HQ-based auditors (Nestlé Group Audit)
and country-based auditors (Nestlé
Market Audit). External audits were
conducted by Bureau Veritas.
(l) We follow the FTSE4Good breast-
milk substitute marketing criteria, which
classify countries as ‘higher-risk’ if they
have mortality rates for under-fives of
more than ten per 1000, or more than
2% acute malnutrition among under-
fives. All other countries are ‘lower-risk’.
(m) Includes joint ventures.
(n) 2013 data restated due to some
of our large joint ventures reporting
environmental data for the first
time in 2013 but not having material
consumption data available at the time.
(o) Differences from 2013 due to
correction of factory coordinates,
clarification of PA boundaries and sale
of three factories.
(p) Covers Nestlé employees registered
in the HR system (approximately 85% of
all employees).
(q) CARE, our global external audit
programme, is conducted by three
audit companies and verifies that all
employees and sites we own or operate
comply with local legislation, our
Corporate Business Principles and Code
of Business Conduct. The audits take
place every three years.
(r) Covers approximately 85% of all
employees through a combination of
manual submission from the markets
and the training system.
(s) Covers all Nestlé employees
including joint ventures.
Nestlé in society and Creating Shared Value key performance indicator GRI 2013 2014 Page
Total on-site energy consumption (gigajoules per tonne of product) 1.87 1.78 26
Total on-site energy consumption from renewable sources (% total) G4-EN3 13.3 14.7 n/a
Total direct energy consumption (petajoules) G4-EN3 67.1 65.5 26
Total direct energy consumption from renewable sources (% total direct) G4-EN3 10.8 11.3 n/a
Total indirect energy consumption (petajoules) G4-EN4 81.5 81.1 26
Biodiversity
Total size of manufacturing sites located in protected areas (hectares) (o) G4-EN11 32.9 18.8 28
Emissions, effluents and waste
Direct GHG emissions (million tonnes CO2eq) G4-EN15 3.99 3.81 28
Direct GHG emissions (kg CO2eq per tonne of product) G4-EN15 76.0 71.0 28
Indirect GHG emissions (million tonnes CO2eq) G4-EN16 3.81 3.80 28
Indirect GHG emissions (kg CO2eq per tonne of product) G4-EN16 73.0 71.0 28
Total water discharge (million m3) G4-EN22 91.0 87.0 24
Total water discharge (m3 per tonne of product) G4-EN22 1.74 1.63 24
Average quality of water discharged (mg COD/l) G4-EN22 76.0 72.0 24
By-products (kg per tonne of product) G4-EN23 29.1 28.9 26
Waste for disposal (kg per tonne of product) G4-EN23 4.9 4.0 26
Environmental sustainability governance
Manufacturing sites certified against ISO 14001 (% of total manufacturing sites) 91.0 92.0 n/a
Human rights and compliance
Total number of significant product recalls or incidents of non-compliance G4-PR2 10 12 n/a
Number of human rights impact assessments completed G4-HR9 1 1 30
Number of employees trained on human rights 13 793 7 485 30
Our people
Total workforce (number of employees) (a) 333 214 339 456 5
Total rate of new employee hires (%) (p) G4-LA1 10.7 10.3 n/a
Total rate of employee turnover (%) (p) G4-LA1 11.1 11.7 n/a
CARE gaps identified related to Business Integrity and HR (q) 146 32 32
Of which: Minor 130 32 32
	 Major 16 0 32
	 Critical 0 0 32
Lost-time injuries and illnesses rate (per million hours worked)
(employees, on-site contractors and on-site members of public) (m) G4-LA6 2.34 2.35 33
Total recordable injuries and illnesses rate (per million hours worked)
(employees, on-site contractors and on-site members of public) (m) G4-LA6 4.10 3.98 33
Total number of fatalities (employees, on-site contractors and on-site members of public) (m) G4-LA6 12 5 33
Average hours of training per year per employee per category (r) G4-LA9 23.0 28.8 35
Leadership positions held by women (%) (p) G4-LA12 31.1 33.7 33
Local Management Committee members native to country in developing countries (%) (s) G4-EC6 52.0 56.4 n/a
Front cover
Ramón Malé Calcó, from Spain,
is a technical leader for the bottling
line in the Nescafé Dolce Gusto
factory in Schwerin, Germany.
He is one of the 10 000 young
people Nestlé plans to have hired
across Europe by 2016 through the
Nestlé needs YOUth programme.
The initiative, which will also take
on 10 000 trainees and apprentices
aged below 30, is designed
to attract the talented youth we
will need to develop and grow
our business.
2	 A message from our Chairman and our CEO
4	 Creating Shared Value at Nestlé
6	 Summary of our commitments
		 Nutrition
8		Find out how Nestlé’s focus on nutrition is helping to
enhance quality of life for our consumers
		 Rural development
18		 Find out more about our work with farmers
		 and in rural communities
		 Water
22		Read about our new commitment on water stewardship
and the objectives we will deliver
		 Environmental sustainability
26		We are aiming to make our products better for the
		 environment along the value chain
		 Our people, human rights and compliance
30		We have started implementing action plans for our cocoa
and hazelnut supply chains and continue to assess our
impact on Human Rights
36	 Stakeholder engagement
38	Materiality
40	 Full commitments table
Contents
Corporate Governance Report 2014
Compensation Report 2014
Financial Statements 2014
Annual Report 2014
Accompanying reports
Corporate Governance Report 2014
Compensation Report 2014
Financial Statements 2014
Nestlé–CorporateGovernanceReport2014|CompensationReport2014|FinancialStatements2014
Annual Report 2014
Nestlé–AnnualReport2014
98%
of our children’s products
met all of the Nestlé Nutritional
Foundation criteria 1 for
children at the end of 2014.
73
Our Healthy Kids Global
Programme reached more
than 7.6 million children
in 73 countries in 2014.
Top 3
We are ranked one of
the top 3 global food and
beverage manufacturers
in the current Access
to Nutrition Index.
73%
We audited 8700 of our
10 000 Tier 1 suppliers and
found 73% fully complied
with our Supplier Code.
38%
Volume of high-priority
categories of raw material
that are traceable back
to the primary source.
52%
Water discharges per
tonne of product cut
by 52% since 2005.
Leader
We were ranked number one
by the charity Oxfam in its 2014
scorecard, Behind the Brands.
The survey scored 10 food
and beverage companies
on their efforts to improve
food security.
FTSE4Good
We remain the only infant
formula manufacturer
included in FTSE’s responsible
investment index, based
on our performance in
human rights, labour rights,
responsible marketing
of breast-milk substitutes
and more.
11 832
Nestlé needs YOUth
helped 11 832 young people
in Europe find work or
apprenticeship opportunities
in 2014.
26%
Energy consumption
per tonne of product cut
by 26% since 2005.
12 458
farmers sensitised on child
labour issues in 2014.
72
factories achieving zero waste
for disposal in 2014.
1	 The Nestlé Nutritional Foundation criteria are based on nutrition science and public
health dietary recommendations, such as those of the World Health Organization
(WHO), the Institute of Medicine and other global or local authorities. Our products
are evaluated against these criteria, using the Nestlé Nutritional Profiling System,
which determines their nutritional value and whether they achieve the Nestlé
Nutritional Foundation status.
Highlights 2014
1
We are pleased to share our 2014 Creating Shared
Value Report including an assessment of the chal­
lenges we face and the real progress we have made
in meeting our societal commitments. This report
­underlines our firm belief that for a company to pros-
per over the long term and create value for share­
holders, it must create value for society at the same
time. Each and every commitment is based on our
own convictions, not convenience. Respect, for peo-
ple, different cultures, the environment and for the
­future of the world we live in, is the foundation of
­Creating Shared Value.
These commitments serve both external and internal pur-
poses. They have helped frame our external communications
but, equally importantly, they guide our management and all
of us at Nestlé across Business Units, Zones and Markets in
our collective efforts to reach these specific objectives. They
also take into account the views of our stakeholders. We
meet regularly with NGOs, academics, multilateral agencies,
­governments and others to listen and learn from their criti-
cisms and encouragement. Our efforts are strengthened by
this dialogue.
Our shareholders also guide us with insightful questions
about these societal commitments and how they strengthen
our business. This we can explain. Our ambition to be the
leading Nutrition, Health and Wellness company is at the
heart of our corporate strategy and what we live for as a
company. We care deeply about people’s health and well-
ness, and are investing for the future through our network of
research centres, the Nestlé Institute of Health Sciences,
Nestlé Health Science and the new Nestlé Skin Health. A
deep understanding of nutrition, and access to tastier and
healthier food and beverages, is what our consumers
­demand and what society needs.
Water too is an essential part of good nutrition and, at the
same time, a human right and the linchpin of food security.
We actively promote healthy hydration at all ages while mak-
ing every effort to reduce water use in our own operations
and advocating for inclusion of a specific goal on water in the
post-2015 development agenda. Our new Cero Agua factory
in Mexico, a dairy factory with a positive water impact, exem-
plifies our commitment to reducing water use in our own
operations and how we embrace new technologies and
Peter Brabeck-Letmathe speaking at the 2014 CSV Forum
Peter Brabeck-Letmathe (Chairman, Nestlé) welcoming guests from
government, academia, civil society and business to the 6th Creating
Shared Value Forum in Switzerland, which was co-hosted with the
United Nations Conference on Trade and Development.
Paul Bulcke visiting the Food Safety Institute in Beijing
Paul Bulcke (CEO, Nestlé) visiting Beijing in March 2014, to open the
Nestlé Food Safety Institute, which works with authorities to help
provide the scientific foundation for food safety policies and standards.
A message from our Chairman and our CEO
Nestlé in society2
­innovative ways to achieve this goal. Water is a business op-
portunity, an operational challenge and a societal issue that
is of deep concern to us all. As we have said many times, we
will run out of water long before we run out of oil.
Likewise, rural development and our work with farmers
combined with our Responsible Sourcing Guideline help ad-
dress the need to build sustainable farming communities, but
also to answer our own consumers’ demands to know
‘where does my food come from?’ Our rural development
work helps secure the quality and quantity of supply of our
key categories and increase the attractiveness of farming for
future generations.
We continue to actively manage our commitments to en-
vironmental and social sustainability, necessary for operating
our factories and for the sustainable growth and develop-
ment of the communities and countries where we operate.
Our commitment to youth employment, called the Nestlé
needs YOUth Initiative, helps strengthen and develop the
skills and employability of young people across Europe. This
programme will soon be extended globally.
At Nestlé, Creating Shared Value is the way we do busi-
ness and it is embedded in our holistic management think-
ing. Integrating business opportunity and societal need is
what we expect of our leaders and employees. Internal man-
agement tools help facilitate this process, such as a strategic
portfolio tool that assesses our brands against financial and
nutrition targets, a capital expenditure process that includes
societal indicators, and a Rural Development Framework
which digs deep into the needs of cocoa, coffee and dairy
farmers and farming communities, helping us to better target
our efforts and investments. Our challenge is to find a con-
sistent method of measuring the business value of Creating
Shared Value as well as to assess societal impacts and not
just activities. We will continue to develop our thinking on
this during 2015.
Join us on our Creating Shared Value journey which fo-
cuses business on the long term where the success of soci-
ety and economic activity are intimately intertwined and
mutually reinforcing. It should also lead to more effective,
collective action to address some of society’s deepest con-
cerns and challenges. Better dialogue, engagement and part-
nerships are required if we are to help address the ‘double
burden’ of malnutrition, water scarcity, sustainable farming,
climate change, human rights and more.
This year, again, we have introduced some new commit-
ments in the areas of responsible marketing to children, anti-
corruption and internal and external grievance mechanisms.
With this report, we also restate our support for the UN Global
Compact, as a founding member of the UN Global Compact
Lead – an important platform for corporate sustainability lead-
ership. We look forward to your feedback on our commit-
ments and on this report.
Peter Brabeck-Letmathe
Chairman
Paul Bulcke
Chief Executive Officer
3
Nestlé has grown from a company founded nearly
150 years ago on the success of a life-saving infant
­cereal to a global leader in Nutrition, Health and Well-
ness. Our growth has enabled us to help improve the
lives of millions of people – through the products and
services we provide and through employment, our
supplier networks and the contribution we make to
economies around the world. 4.1 million families earn
a living because of Nestlé, including many rural small-
holders in developing countries. In 2014, we support-
ed the livelihoods of 695 000 farmers and directly em-
ployed 339 456  people. Our total group salaries and
social welfare expenses were ­almost CHF  16  billion
and we paid corporate taxes of CHF 2859 million.
We see this value creation as a basic requirement for suc-
cessful business, but it doesn’t stop there. Being a global
leader brings not only a duty to operate responsibly, but also
an opportunity to create long-term positive value for society.
We call this Creating Shared Value, and we embed it firmly
in our holistic management thinking across all parts of
our business.
Our ambition is to be the leading Nutrition, Health and
Wellness company. As the population grows and healthcare
challenges increase, the intrinsic value of our nutrition agen-
da will continue to expand. That’s why Nutrition, Health and
Wellness are at the heart of Creating Shared Value. As critical
issues facing society, water and rural development are also
top priorities, representing both business opportunities and
operational challenges. All this is underpinned by a duty to
protect scarce natural resources for the future. Our commit-
ments to environmental and social sustainability ensure we
can continue to be part of the long-term solution. Finding
better ways to collaborate and secure collective action is key
to addressing society’s most critical challenges and maximis-
ing the shared value we can create.
Creating Shared Value at Nestlé
Our 2014 performance in these leading environmental and
sustainability indices illustrates our progress on the
commitments:
Carbon Disclosure Leadership Index – In October 2014,
we received a Climate Disclosure Leadership Index Award
from environmental sustainability ratings agency CDP, having
achieved a score of 96 out of 100.
CDP Water Programme – The CDP Water programme pro-
motes corporate water stewardship. Nestlé’s response was
scored for the first time in 2014. We received a ‘Leadership’
rating, with a maximum score of 20 and we were recognised
for our water strategy and public policy commitments.
Dow Jones Sustainability Indices – The Dow Jones Sus-
tainability Indices measure the performance of the world’s
sustainability leaders. In 2014, we maintained our score of
88, placing us second in our industry.
FTSE4Good – Nestlé remains included in FTSE4Good,
which measures the performance of companies that meet
globally recognised corporate responsibility standards.
Oxfam Behind the Brands – Once again in 2014, Nestlé
topped Oxfam’s Behind the Brands ranking, which assesses
the world’s ten largest food and beverage companies across
seven themes including women in the supply chain, farmers
and land rights.
Creating Shared Value
Protect the future
Laws, business
principles, codes
of conduct
Sustainability
Compliance
Nutrition, water,
rural development,
our focus areas
Creating
Shared Value
Nestlé in society4
CHF 91.6 billion
total group sales
339 456
number of employees
695 000
farmers working directly
with Nestlé
More than1billion
number of servings consumed per day
442
number of factories worldwide
4.1 million
number of families earning
a livelihood because of us
CHF 16 billion
total group salaries and social
welfare expenses
CHF 2859 million
corporate taxes paid in 2014
Creating
Shared Value
5
Summary of our commitments
Nutrition
Build knowledge leadership
in children’s nutrition
Lead the industry in nutrition
and health research through
collaboration
Provide nutritionally sound products
designed for children
Help reduce the risk of undernutrition
through micronutrient fortification
Reduce sodium (salt) in our products
Reduce sugars in our products
Reduce saturated fats and remove
trans fats in our products 2
Encourage consumption of whole grains
and vegetables
Deliver nutrition information and advice
on all our labels
Provide portion guidance for consumers
Promote healthy diets and lifestyles,
including physical activity
Promote healthy hydration as part
of a healthy lifestyle
Provide education programmes for
good nutrition and feeding practices
Ensure responsible marketing
communication to children
Market breast-milk substitutes
responsibly
Rural development
Roll out the Rural Development
Framework to understand the needs
of farmers
Implement responsible sourcing
in our supply chain
Roll out the Nestlé Cocoa Plan
with cocoa farmers
Roll out the Nescafé Plan with
coffee farmers
Our commitments relate
directly to our material issues
(see page 39). They help drive
continuous improvement and
allow stakeholders to hold Nestlé
accountable for delivering on
its promises. In some instances,
the title of a commitment has been
updated from last year, to provide
greater clarity and transparency,
although the ambitions behind our
commitments remain unchanged.
Page 8 Page 18
	 See our full report for more details
of our approach, policies and procedures
at www.nestle.com/csv/downloads
2	 This commitment refers to trans fats originating from
partially hydrogenated oils in our products.
Nestlé in society6
Water
Work to achieve water efficiency and
sustainability across our operations
Advocate for effective water policies
and stewardship
Treat the water we discharge effectively
Engage with suppliers,
especially those in agriculture
Raise awareness on water conservation
and improve access to water
and sanitation across our value chain
Environmental
sustainability
Improve resource efficiency
in our operations
Improve the environmental performance
of our packaging
Assess and optimise the environmental
impact of our products
Provide climate change leadership
Preserve natural capital,
including forests
Provide meaningful and accurate
environmental information and dialogue
Our people, human rights
and compliance
Assess and address human rights impacts
in our operations and supply chain
Eliminate child labour in key
commodities
Ensure that all employees and
stakeholders can easily report
possible compliance violations
Work against corruption and bribery
Ensure all Nestlé units have basic
safety and health protection systems
for all employees
Enhance gender balance
in our workforce
Offer 20 000 job opportunities for young
people below 30 years of age at Nestlé
in Europe
Provide CSV, nutrition (NQ) and
environmental sustainability training
for our employees
Page 22 Page 26 Page 30
7
Our commitment
Build knowledge leadership
in children’s nutrition
Our objective
By 2016 – Launch large-scale research
projects in at least 10 countries across the
globe, including the USA, Mexico, China
and Russia, to expand understanding
of children’s nutrition and inform our
own product and service development.3
Our progress
Our new commitment to carry out studies
in at least 10 countries, to understand
children’s nutrient intakes, dietary patterns
and related lifestyle factors, is based on the
success of the Nestlé Feeding Infants and
Toddlers Study, which had previously been
conducted twice in the USA and, at varying
scales, in five other countries. We have
now started a third round of field research
in the USA and we are analysing data
in Mexico and China, where we have also
studied maternal nutrition.
The Kids Nutrition and Health Study,
which analyses the diets of children
aged 4–12 years, is underway in the USA,
Mexico and China. We are engaging
with stakeholders in a number of other
countries to set up additional studies.
In 2014, research results were presented
at several international congresses
and health practitioner conferences,
and we strengthened our new product
innovation workstream in response
to research findings.
Nutrition
Our ambition is to be
the world’s leading
Nutrition, Health and
Wellness company.
Our global commitments
on research, product
reformulation and
innovation, nutrition
labelling, responsible
marketing to children,
and promotion of healthy
lifestyles help shape
our strategies, and ensure
effective implementation.
	
For all objectives, we aim to fulfil our
commitment by 31 December of the
year stated.
Our perspective
We aim to provide products, information
and education that support parents in
ensuring the healthy growth and
development of their children. In addition
to dietary intakes and behaviours, our
research explores family dynamics around
diets and key lifestyle patterns of children,
while documenting their height and
weight. This informs our product
formulation, consumer communication
and educational programmes.
Our research and collaboration with
local experts across the world offers
huge learning potential but also presents
significant challenges, such as achieving
detailed knowledge on children’s dietary
habits, which is difficult to record and can
be sensitive. We also continue to share
the results, through the Nestlé Nutrition
Institute, with over 240 000 public health
opinion leaders, third-party organisations
and paediatricians to maximise the
benefits of our research.
Nestlé in society8
First step towards
made-to-measure vitamins
To understand the molecular relationships
between nutrients and their effects on
patients at different stages of their lives,
the Nestlé Institute of Health Sciences
and the Waters Corporation – based in
Massachusetts, USA – are collaborating on
a ground-breaking research project that
could lead to vitamin combinations tailored
to individual needs. The partnership aims
to develop new tests to measure the amount
of vitamins in bodily fluids, such as blood
and urine. Eventually, these tools will help
to define and address the specific nutrient
needs of individuals and groups.
Our progress
In January 2014, the Nestlé Institute of
Health Sciences signed a long-term
agreement with a USA-based developer of
stem cell technologies, Cellular Dynamics
International (CDI). The agreement will
give the Institute access to cell products,
obtained from adult non-embryonic
stem cells (iPSCs) 4, to support research
programmes on maintaining health and
managing conditions such as diabetes
and obesity.
Also in 2014, Nestlé entered into a
strategic partnership with the Singapore
government’s Agency for Science,
Technology and Research, A*STAR,
with the goal of setting up global
research programmes in food science
and technology.
The research teams at NRC are now
focused on five research programmes:
Food Safety and Integrity, First 1000 days
and Healthy Kids; Healthy Ageing;
Healthy Pleasure; and Sustainable Nutrition.
At the end of 2014, the NRC had 33 clinical
trials, 10 trials briefed by NRC and 23 trials
briefed by Nestlé businesses and managed
by NRC. 
3	 Russia has replaced France as one of the countries in the objective.
4	 Nestlé does not do any research using human embryonic stem cells.
Our commitment
Lead the industry in nutrition
and health research
through collaboration
Our objectives
By 2016 – Further develop and integrate
the molecular nutrition capabilities and
clinical strategies of the Nestlé Institute
of Health Sciences (NIHS) and the Nestlé
Clinical Development Unit to help improve
the management of diseases using
nutritional solutions.
By 2016 – Refocus the Nestlé Research
Center (NRC) on five key platforms where
we can make a positive difference: Healthy
Ageing; Healthy Pleasure; First 1000 days
and Healthy Kids; Sustainable Nutrition;
and Food Safety and Integrity.
Our perspective
We have a responsibility to use our
knowledge, research and development
capability to make a positive difference to
society. Through investing in innovation
and leveraging leading-edge science, we
are striving to forge a new industry between
food and pharmaceuticals based upon
inherently safe nutritional therapies with
relevant levels of quality of life benefits and
proven clinical and health economic value.
Nestlé Health Science aims at advancing
the role of nutritional therapy to change the
course of health management for
consumers, patients and our partners in
healthcare. However, converting scientific
research into a commercially viable product
is a long and complex process. One of the
challenges relates to the definition of
medical foods – foods that are specifically
formulated for the dietary management
of patients with diseases or conditions for
which there are distinctive nutritional
requirements. There are still many questions
around the definition of medical foods,
which have knock-on implications for
product claims, labelling and marketing.
9
Nutrition
Help reduce the risk of
undernutrition through
micronutrient fortification
Our objectives
By 2016 – We will reach 200 billion
micronutrient-fortified servings of foods and
beverages annually worldwide, helping to
address global micronutrient deficiencies
with a special focus on children and women
of childbearing age.
By 2015 – We will develop biofortified crops
and launch new products in key markets
to expand our fortified products portfolio
and benefit rural farming communities.
Our progress
In 2014, we continued to make good
progress towards our target, providing
183 billion servings of fortified foods
worldwide (2013: over 167 billion). We
extended reach on product categories for
children and women of childbearing age,
such as fortified infant cereals and
growing-up milks.
We continue to develop and test
biofortified varieties of staple crops in
collaboration with agricultural research
institutes in several countries. Current work
focuses on establishing supply chains to
ensure the availability of commercial
quantities of these crops. We have focused
on four promising biofortified crops in 2014:
maize, wheat, sweet potato and rice.
Our perspective
Nestlé is committed to helping address
micronutrient deficiencies through
fortification of affordable, nutritious foods
and beverages. Developing new varieties
of biofortified staple food crops is one way
we can improve the nutritional content
of our products and address micronutrient
deficiencies in the diets of local
communities at the same time. But this
complex process can take several years as
new plant varieties must be tested for crop
yield under different climatic conditions
and disease resistance, and their nutritional
characteristics validated. The new crop
must then be approved for release by the
relevant governmental authorities and
a stable supply of high-quality seeds
established. Farmers may need training
and support to grow it with good results.
Identifying ways to measure the impact of
our biofortified foods remains a key focus.
Our commitment
Provide nutritionally sound
products designed for children
Our objectives
By 2014 – 100% of our children’s products 5
meet Nestlé Nutritional Foundation criteria 1
for children, based on nutrition science and
dietary recommendations, such as those
published by the World Health Organization
and the Institute of Medicine.
By 2015 – Maintain at 100% our children’s
products 5 that meet all Nestlé Nutritional
Foundation criteria 1 for children.
Our progress
At the end of 2014, 98% 6 of our children’s
products met all of the Nestlé Nutritional
Foundation criteria 1 for children (2013:
96%). We continued to work with renowned
scientists to review the strength and
breadth of our Nestlé Nutritional Foundation
criteria. Products that were reformulated
to meet the criteria in 2014 include Milkybar
cream dessert (40% reduction in saturated
fat; for launch in 2015); Pirulo ice lollies
(35% reduction in sugar); and Mio yoghurt
(18% reduction in sugar).
From January 2015, all of our children’s
products will be manufactured to meet
Nestlé Nutritional Foundation criteria.
Our commitment
Our perspective
Our aim is to contribute to improving
children’s food environments by assessing
all children’s products 5 against international
public health recommendations, such as
those of the World Health Organization and
the Institute of Medicine.
We manufacture and sell products in
many countries. This poses both nutrition
and public health science challenges, and
also challenges for our own Nutritional
Profiling System, which must reflect
changes in public health priorities. Another
important hurdle we face is accurately
capturing and tracking the development of
all our recipes across the globe in a single
IT system. Our product portfolio will
continue to evolve; with more than 1 billion
Nestlé servings consumed every day, this
will be a significant and ongoing task.
Reducing sugars in Nestlé Nesquik
powder products
Since 2014, the global range of Nestlé
Nesquik powder products have undergone
a significant sugar reduction of 1200
tonnes to achieve our Nutrition Foundation
status, while still retaining consumer
preference. The main challenge was to
reduce the sugar content and maintain a
taste preference, which was achieved by
replacing sugar with cocoa. The journey
continues into 2015, with newly available
technical solutions allowing us to make
even more substantial sugar reductions.
Nestlé in society10
Reducing salt in Tomato
Mozzarella Soup
We have cut the salt content of our
Maggi Tomato Mozzarella Soup, sold in
Germany, by 34%. Our challenge was to
reduce salt without impacting on taste.
Our research and development chefs
overcame this challenge by selecting and
optimising the best ingredients to rebalance
the taste profile. At the same time, they
were able to reduce sugar content by 36%
and saturated fat by 53%. The new recipe
achieved a consumer taste test win of
66/34, meaning 66% of people prefer it
over our competitor’s alternative.
The product is due to be re-launched
in June 2015.
Reduce sodium (salt)
in our products
Our objectives
By 2014 – 100% of children’s products 5
meet the Nestlé Nutritional Foundation
sodium criteria 1 to help promote a reduction
of salt in children’s diets.
By 2016 – We will further reduce salt
content by 10% in all relevant 7 products that
do not meet the Nestlé Nutritional
Foundation criteria1, ensuring gradual salt
reduction even in more challenging areas
of our product portfolio.
Our progress
In 2014, 98% 6 of our children’s products 5
met the Nestlé Nutritional Foundation
sodium criteria1 (2013: 96%).
1	 The Nestlé Nutritional Foundation criteria are based on nutrition science and public health dietary recommendations, such as those of the World
Health Organization (WHO), the Institute of Medicine and other global or local authorities. Our products are evaluated against these criteria,
using the Nestlé Nutritional Profiling System, which determines their nutritional value and whether they achieve the Nestlé Nutritional Foundation status.
5	 Products for which 50% or more of consumers are below 12 years of age, or are designed for or perceived as being designed for this age group.
6	 We have identified all products in the outstanding 2%, which are at different stages of the approval and/or registration process at market level
before the product can be launched.
7	 Relevant products means to exclude exemptions (Nestlé Nutrition, Nestlé Health Science, Nestlé Professional, Nestlé Purina PetCare,
plain water/coffee/tea, Confectionery gifting, Culinary free-dosing and table-top seasonings, and products designed for children
below four years of age as other legal considerations are relevant) and where regulations are not allowed.
Our commitment
98% 6 of our children’s
products 5 met the
Nestlé Nutritional
Foundation criteria
for salt
We have assessed our entire product
portfolio against the Nestlé Nutritional
Foundation sodium criteria, and our overall
sodium reduction achievement was 4.7%.
We are now looking into potential solutions
for those products that do not currently
meet the required standards.
We have already relaunched a wide
range of reduced-salt products, including:
•	Maggi Spaghetti Bolognese ‘Fix’ in
Germany (17% sodium reduction);
•	Maggi Juicy Chicken Garlic and Maggi
Juicy Chicken Paprika in Russia
(respectively 12% and 19% sodium
reduction);
•	Maggi soup range in Austria
(14.5% – 22.5% sodium reduction); and
•	Stouffer´s vegetable lasagna in the USA
(19% sodium reduction).
Our perspective
Sodium is an essential mineral, but too
much of the salt in our diet comes from
what’s added during manufacturing, home
cooking or at the table. In 2013, we pledged
to accelerate salt reduction across all of
our savoury food products to support the
WHO salt target of no more than 5 g of salt
per person per day by 2025. However,
reducing the salt content in some products
poses a technical challenge. Besides
seasoning, salt is important for food
preservation and texture.
We also need to reduce salt content
without consumers either adding it
themselves or choosing saltier alternatives.
That is why we take a gradual approach
and combine reduced salt content
with optimised ingredient combinations
to promote taste.
11
Nutrition
There are more whole grains
than any other ingredient
in at least 95% of our
children’s 5 and teenagers’ 8
breakfast cereal servings
Reduce saturated fats and
remove trans fats in our products 2
Our objectives
By 2014 – 100% of children’s products 5
meet the Nestlé Nutritional Foundation
saturated fats criteria 1, helping to promote a
reduction in saturated fats in children’s diets.
By 2016 – We will further reduce saturated
fat content by 10% in all relevant 7 products
that do not meet the Nestlé Nutritional
Foundation criteria1 and we will remove
trans fats originating from partially
hydrogenated oils (PHOs), to ensure
continual improvement even in more
challenging areas of our product portfolio.
Our progress
By the end of 2014, 98% 6 of our children’s
products5 met the Nestlé Nutritional
Foundation saturated fats criteria 1 (2013:
96%).
In total, around 10% of our products
do not yet meet the Nestlé Nutritional
Foundation criteria for saturated fat. We are
now working to identify solutions for some
of these products.
In 2014, we strengthened our policy
to remove all trans fats originating from
PHOs from our foods and beverages.
96% of the oils we use now meet our
Nestlé Policy on Trans Fats.
We have re-launched a number of
products with reduced saturated fat levels,
including:
•	Bouillon in Poland (13% reduction);
•	Herb sauce in Germany (33% reduction);
•	Onion soup in France (80% reduction);
and
•	Uncle Toby’s Le Yoghurt Topps in Australia
(34% reduction).
Our perspective
Dietary fats are important as part of a
healthy, balanced diet but too much
saturated fat in the diet poses a significant
risk for non-communicable diseases such
as cardiovascular disease. For some
products, reducing saturated fat without
impacting safety, texture, appearance
and taste is a challenge.
Trans fats occur naturally in foods such
as milk and meat, but most trans fats in the
human diet come from foods containing
partially hydrogenated vegetable oils, such
as bakery and savoury snacks. Our objective
is to complete the removal of all trans fats
originating from PHOs. We are working
intensively with suppliers to source and
develop new ingredients where required.
Removing trans fat from liquid
Coffee-mate
In 2014, our leading Product Technology
Centre successfully challenged long-
established beliefs about oil stability when
they reformulated the recipe for liquid
Coffee-mate. In collaboration with our oil
supplier, we succeeded in replacing the
partially hydrogenated soybean/cottonseed
oil with a high oleic soybean oil. It was the
first time this new oil crop had been grown
at large scale, and it was successfully
industrialised to match our quality demands.
The result is already a complete
replacement of 16 000 tonnes of partially
hydrogenated oil per year and the removal
of 6000 tonnes of trans fat from our product
in 2014. This was achieved without
compromising on taste and consumer’s
acceptance, or increasing saturated fat
content. In 2015, 26 000 tonnes of oils will
be replaced and 10 000 tonnes of pure trans
fats removed. The changeover will be
completed by September 2015.
Our commitment
Reduce sugars in our products
Our objectives
By 2015 – Reduce the sugar content
in any serving of children’s 5 or teenagers’ 8
breakfast cereal brands to 9 g or less per
serving, to promote a reduction in sugar
in children’s diets.
By 2016 – We will further reduce sugar
content by 10% in all relevant 7 products
that do not meet the Nestlé Nutritional
Foundation criteria 1, to ensure continual
improvement even in more challenging
areas of our product portfolio.
Our progress
By the end of 2014, 98% 6 of our children’s
products 5 met the Nestlé Nutritional
Foundation 1 sugars criteria (2013: 96%).
We are reducing the sugar content
to 9 g total sugars or less per serving (30 g)
in Nestlé breakfast cereal brands such as
Nesquik, Chocapic, Honey Cheerios, Lion
and Milo, as well as over 15 other Nestlé
branded breakfast cereals. We have already
relaunched a number of other reduced-
sugar products including:
•	Nesquik global range of powder products
(sugar reduction of 1200 tonnes – see
page 10); and
•	Belte ice tea in Italy (18% sugar reduction,
18% calorie reduction).
Our perspective
Public health authorities recommend
a reduction in the intake of added sugars,
particularly because sugar can displace
other essential, nutritious foods in the diet.
We know it can be a challenge getting
kids to eat a balanced breakfast – or any
breakfast at all – so we are taking a
gradual approach to reducing sugar, to
help adapt taste preferences for the long
term. Sometimes, reducing sugar without
affecting flavour, texture, structure,
colour and preservative properties is a
significant challenge. Certain products,
such as sweetened condensed milk, must
comply with legally set compositional
requirements. For these products, we are
working to improve nutritional labelling
and portion guidance.
Our commitment
Nestlé in society12
Our perspective
We champion GDA-based labels that inform
consumers about calories, sugars, fat and
other nutrients and how this compares with
reference daily guidelines. We believe in
providing GDA percentages that are based
on a serving reasonably consumed, rather
than the more abstract 100 g quantity.
GDA challenges include product labelling
regulation. We believe in empowering
consumers to make informed choices and,
where allowed, we have started re-
launching our children’s products 5 featuring
GDA information tailored to the consumer
audience. Where it is not yet allowed, we
engage with authorities, nutrition experts
and industry bodies to promote GDA
benefits, as well as targeting consumer
education and engagement.
Going beyond the label
Media reports last year forecast that
phone users in India and China would
purchase more than 500 million
smartphones in 2014. India alone was
predicted to be the second-largest country
for smartphones worldwide. We want to
make nutritional information more
accessible for our consumers, and our
Maggi brand is using smartphone QR
codes in India to deliver it. Maggi Soups
has launched a microsite (accessible by
scanning on-pack QR codes with a
smartphone) that contains tips on portion
guidance and vegetable consumption.
Deliver nutrition information
and advice on all our labels
Our objectives
By 2016 – All our relevant 9 food and
beverage products worldwide will have
Guideline Daily Amount (GDA)-based labels
on front of pack to inform consumers about
nutritional content.
By 2016 – We will introduce GDA-based
labelling, based on children’s reference
values, for all products designed for
children5 (where regulations allow) to help
parents make better nutritional choices
for children.
By 2016 – Make information more
accessible by providing further product
information and nutrition advice on
pack, via Quick Response (QR) codes
for smartphones.
Our progress
After broadly implementing GDA-based
nutritional information on our products
across Europe, we are now extending our
approach into all other regions. At the end of
2014, 79.7% of our relevant 6 products
feature front-of-pack GDA-based labels
(2013: 53.5%). In 2014, 62.7% of relevant
products designed for children used
children’s GDA (Guideline Daily Allowances),
where regulations allow in 53 countries.
Product information is now being
provided via more than 2000 product
websites 10 covering a total of 31 brands in
43 countries, especially children’s and
family brands.
1	 The Nestlé Nutritional Foundation criteria are based on nutrition science and public health dietary
recommendations, such as those of the World Health Organization (WHO), the Institute of Medicine
and other global or local authorities. Our products are evaluated against these criteria, using the
Nestlé Nutritional Profiling System, which determines their nutritional value and whether they achieve
the Nestlé Nutritional Foundation status.
2	 This commitment refers to trans fats originating from partially hydrogenated oils in our products.
5	 Products for which 50% or more of consumers are below 12 years of age, or are designed for or perceived
as being designed for this age group.
6	 We have identified all products in the outstanding 2% which are at different stages of the approval and/or
registration process at market level before the product can be launched.
7	 Relevant products means to exclude exemptions (Nestlé Nutrition, Nestlé Health Science,
Nestlé Professional, Nestlé Purina PetCare, plain water/coffee/tea, Confectionery gifting, Culinary free-dosing
and table-top seasonings, and products designed for children below four years of age as other legal
considerations are relevant) and where regulations are not allowed.
8	 Products for which 50% or more of consumers are below 18 years of age and, within this,
more teens than children.
9	 Products with significant everyday usage, by humans (not pets), that deliver calories,
and have sufficient pack surface to feature a GDA label.
10	 In 2014, product websites are reported over product lines to provide more robust measurement.
Our commitment
Encourage consumption
of whole grains and vegetables
Our objectives
By 2015 – To ensure a high nutritional
content, there will be more whole grain than
any other ingredient in any serving of
children’s 5 or teenagers’ 8 breakfast cereals.
By 2015 – Maggi Cooking Lesson
Programme will be ongoing in 30 countries
to promote cooking with whole grains
and vegetables.
By 2015 – 90% of Maggi product portfolio
worldwide will be promoting home cooking
and meals with vegetables.
Our progress
We have introduced more whole grains than
any other ingredient in at least 95% of our
children’s 5 and teenagers’ 8 breakfast cereal
servings (2013: 74%) and have committed to
including whole grain as the primary
ingredient of 100% of these products by
2015. Today we help consumers identify
cereal options with more than 8 g of whole
grain per serving, as indicated on packaging
with the Green Banner.
At the end of 2014, our Maggi Cooking
Lesson Programme was taking place in
20 countries (2013: 16). To date, 73% of the
Maggi product portfolio promotes home
cooking and meals with vegetables via
packaging/promotional materials (2013:
68%).
Our perspective
Whole grains and vegetables are vital for a
healthy diet, but many people do not
consume enough. Evidence suggests that
nine out of 10 people do not reach the
recommended level of consumption. This is
the reason why we use whole grain to make
our breakfast cereals, and why our
innovation and renovation programmes aim
to increase the whole grain content of our
recipes. We have made steady progress in
this but, because adding more whole grain
impacts on everything from taste and texture
to shelf life, we are proceeding with care to
achieve a gradual, lasting improvement. We
are optimistic that we will be able to convert
all our children’s 5 or teenagers’ 8 breakfast
cereals to have more whole grain by the end
of 2015. The challenge we face around
promoting vegetable consumption is the
difficulty in tracking whether our efforts
translate into long-term behaviour change
among consumers.
Our commitment
Product information is
provided through QR code
scanning technology
on 31 Nestlé brands in
43 countries
13
Promote healthy diets and lifestyles,
including physical activity
Our objective
By 2015 – Nestlé Healthy Kids Global
Programme will be ongoing in 80 countries,
with the activation of the International
Association of Athletics Federations (IAAF)
Kids’ Athletics programme to improve the
nutrition, health and wellness of children
around the world.
Our progress
By the end of 2014, we were actively working
with 294 partners across 73 countries to
deliver our Healthy Kids Global Programme
(2013: 68 countries). 67 out of a total of
77 Healthy Kids programmes contain a
physical activity component, for which our
main partner is the IAAF (see case study on
page 15). We reached more than 7.6 million
children in 2014 alone (2013: 6.9 million).
Our perspective
Driving behaviour change towards healthier
diets and lifestyles is a global challenge.
Nestlé is committed to promoting the
importance of a balanced diet and regular
physical activity among young people.
We support initiatives that demonstrate how
diet and exercise can improve health and
well-being, and we are developing evidence-
based, impactful initiatives that contribute to
the health of local school communities.
Effectively measuring the long-term
success of our Healthy Kids Global
Programme is a key priority, and at times
a challenge. Sustained success is itself a
challenge as this depends on quality
partnerships and the ability of the education
system to provide nutrition education and
physical activity in schools. Nestlé is
committed to supporting authorities
globally, to help ensure children adopt
appropriate nutrition and physical
activity habits, which are important for
their development and learning ability.
Together with our partners, we need to
further advocate for whole-school
approaches where nutrition and health
are considered an important part of
children’s development.
Our commitment
Nutrition
Portion guidance
The Nestlé Pizza Portion Guide offers nutritional information and ideas for incorporating pizza
into a balanced meal.
Provide portion guidance
for consumers
Our objective
By 2015 – Provide portion guidance on
all children’s 5 and family products 8 to
encourage healthy portion consumption.
Our progress
By the end of 2014, we offered specific
portion guidance for an estimated 30.2%
of our children’s 5 and family products 8
portfolio.
Our perspective
Nestlé Portion Guidance 11 is a voluntary
initiative that bridges the gap between
dietary recommendations and more user-
friendly information to promote mindful
portion size. The initiative is designed to
help re-frame portion norms, particularly
in energy-dense categories where habitual
servings have increased over time.
By providing practical on-pack portion
guidance, we aim to help consumers
make intuitive portion choices in terms
of size and quantity.
Modifying norms about portion sizes is
a complex issue involving many different
challenges, which requires innovative
solutions and collaboration between
nutrition, education and industry experts.
There are also perception-related
challenges. Encouraging consumers to
adopt smaller portion sizes of a product
may represent a cultural change that will
take time to embed. And among our
stakeholders, we need to build trust and
understanding around our motivation to
lead the industry in promoting healthier
portion sizes.
Our commitment
Nestlé in society14
Drink Better. Live Better.
with Nestlé Waters
Nestlé Waters supports the Partnership
for Healthier America’s Drink Up initiative,
a programme that guides people to
drink more water. Nestlé Pure Life
communicated the partnership on bottled
water products, trucks, advertising and
social media conversations with both
English and Spanish-speaking audiences.
Nestlé Waters also launched Drink Better.
Live Better., a programme that makes
drinking water more fun for families by
redeeming points collected for a variety
of rewards.
Supporting Australian kids’ athletics
In April 2014, Athletics Australia launched
the IAAF Nestlé Healthy Active Kids’
Athletics to boost participation among
young people. The pilot will be offered to
Australian children through the national
after-school care scheme, and more than
100 children attended a sports clinic run
by Australian and American champions
to launch the programme.
5	 Products for which 50% or more of consumers are below 12 years of age, or are designed for or perceived as being designed for this age group.
8	 Products for which more than 20% but less than 50% of consumers are below 18 years of age.
11	 We capitalize portion guidance to distinguish and promote its consumer-engaging on-pack guidance nature compared to simple portion information.
Promote healthy hydration
as part of a healthy lifestyle
Our objective
By 2014 – Further implement our fact-based
healthy hydration awareness programme
for healthcare professionals, caregivers and
parents worldwide, providing a better
understanding of the benefits of water as
key to healthy hydration.
Our progress
In 2014, we analysed the data of a national
nutrition survey conducted in Mexico to
estimate the total water intake of children
aged 1–18. This work, published in a
peer-reviewed journal, showed that children
are not meeting their daily water needs as
recommended by the Institute of Medicine.
We are in the process of publishing similar
research conducted in Egypt.
We continue to raise awareness of
healthy hydration – notably through
campaigns in the USA and Turkey. Healthy
hydration is now integral to the Nestlé
Healthy Kids Global Programme, and Nestlé
Waters has expanded the reach of Project
WET (a global water education programme)
modules on healthy hydration through
national programmes in Nigeria, Jordan and
China, and during World Water Day events
globally. In 2014, our World Water Day
events alone educated over 20 000 children
about the benefits of healthy hydration.
Our commitment to promote healthy
hydration as part of a healthy lifestyle is an
ongoing effort. Having fulfilled our
objectives for 2014, we are working with our
Markets and stakeholders to come up with
objectives for 2015 and beyond, that will be
communicated in next year’s report.
Our perspective
What you drink is as important to a healthy
lifestyle as what you eat and how often you
exercise. Plain water – whether from a tap or
a bottle – should be the preferred choice for
daily hydration, as it doesn’t add any
calories to the diet.
We believe healthy hydration habits
start early, but our studies in four countries
have shown that two-thirds of children
are insufficiently hydrated when they
arrive at school. We provide child-health
stakeholders – including teachers,
parents and educators – with the tools and
information they need to ensure children
learn about the benefits
of healthy hydration.
Our commitment
Our Healthy Kids Global
Programme reached more
than 7.6 million children
in 73 countries in 2014
15
Ensure responsible marketing
communication to children
Our objective
By 2015 – Implement a strengthened Policy
on Marketing Communication to Children.
Our progress
We have ensured global compliance with
responsible advertising and marketing
standards for children since establishing our
Corporate Communication Principles in
2002 and introducing the Policy on
Marketing Communication to Children in
2008. We abide by external pledges
including IFBA Commitments 12, the EU
Pledge and local pledges. In 2014, 99.92%
of Nestlé television advertising to children
under 12 was compliant with responsible
marketing policies 13 (2013: 98.3%).
Our Marketing to Children Policy states
that we do not direct marketing
communciation to children under six. From
December 2015 direct marketing
communication to children 6 to 12 years of
age can only be with products that achieve
EU Pledge Nutrition Criteria or meet Nestlé
Nutritional Foundation status where no
criteria have been adopted under the EU
Pledge criteria. Irrespective of the criteria
being met, we do not direct any marketing
communication for biscuits, sugar
confectionery and chocolate confectionery
products to children 14. The media channels
covered by this Policy include television,
radio, print, cinema, digital media, mobile,
games, consumer relationship marketing,
viral marketing, apps, emails/SMS,
Nestlé-owned websites, movie tie-ins,
promotions, contests, product sponsorship,
events and sampling. With the new policy
we developed a qualitative set of criteria to
define the ‘appeal’ of marketing
communications to children under 12.
To ensure consistent and effective
implementation, detailed internal guidelines
have been developed and external
stakeholders are encouraged to provide
feedback via our ‘Tell us’ reporting
mechanism (see page 32).
Our perspective
We are phasing out our marketing
communications in schools, while
strengthening our health and wellness
education activities, particularly those that
positively impact childrens’ development
and support governments’ goals to increase
physical activity, such as the Nestlé Milo
sports development programmes.
Our commitment
ESPHGAN Goes Africa
To maximise the reach of our programmes
to benefit communities around the world,
Nestlé supports the European Society for
Paediatric Gastroenterology, Hepatology
and Nutrition (ESPGHAN) with an education
grant to run a Diploma course on
gastroenterology and nutrition for
paediatricians in Africa. Eighty seven
doctors from 18 African countries have been
trained since 2012, and 30 more will be
trained in 2015. Our aim is to build up a
critical mass of trained paediatricians in
gastroenterology and nutrition who will then
cascade their knowledge to others.
Provide education programmes
for good nutrition
and feeding practices
Our objectives
Help guide parents and caregivers to
raise healthier children, and help
healthcare professionals have a greater
impact on the nutritional aspects of care
of future generations.
Ongoing – Offer nutrition education
services and programmes for healthcare
professionals addressing global under- and
over-nutrition problems (Nestlé Nutrition
Institute).
Ongoing – Provide science-based practical
nutrition education for parents and
caregivers that focuses on the importance
of the first 1000 days (from conception to
the child’s second birthday), including
maternal nutrition during pregnancy and
promoting breastfeeding as the best start in
life (Nestlé Start Healthy Stay Healthy).
By 2015 – Nestlé Nutrition Institute will
reach over 1 million healthcare
professionals via its online educational
services in nine languages.
By 2015 – Nestlé Start Healthy Stay Healthy
will reach over 5 million mothers and
caregivers worldwide with multi-lingual
online nutrition education services.
Our progress
The Nestlé Nutrition Institute (NNI) offers
educational services to healthcare
professionals in 195 countries. More than
243 000 healthcare professionals are
registered as members of its educational
website. As the world’s largest private
publisher of nutritional information, over
3000 publications can be downloaded free
by members from the NNI website.
Since its inception in 1981, the NNI has
held 85 International Nutrition Workshops,
over 700 online conferences and awarded
8–10 postgraduate academic fellowships
per year to young medical doctors
from developing regions. In 2014, by
broadcasting NNI workshops live over
the internet, we reached ten times
more healthcare professionals than
in previous years.
Nestlé Start Healthy Stay Healthy is our
new interactive, science-based education
programme designed to help mothers
and caregivers provide nutritionally and
developmentally adequate nutrition in the
crucial first 1000 days of life.
Our perspective
Nestlé believes it has a responsibility to
share its expertise in nutrition and deep
consumer understanding to benefit society.
We place significant focus on promoting
better health through nutrition in the first
1000 days of life. Poor maternal nutrition,
for example, affects foetal growth and
cognitive functions and increases infant
morbidity and mortality. Children who suffer
malnutrition in their early years fail to fully
develop their physical and cognitive
potential and have an increased risk of poor
health later in life.
Our educational programmes are
targeted at the people who are most
involved in implementing good practices
during the first 1000 days to help guide
parents and caregivers to raise healthier
children, and help healthcare professionals
have a greater impact on the nutritional
aspects of care of future generations.
One challenge we face in this objective is
overcoming a perceived conflict of interest
concerning our engagement with the
scientific and public health communities.
We address this challenge by maintaining
the highest level of transparency, scientific
rigour, and ethical standards in the
collaboration, conduct, and dissemination
of scientific research and educational
programmes.
Our commitment
Nutrition
Nestlé in society16
Super Babies shout the benefits of
breastfeeding in India
During Breastfeeding Week in August 2014,
Nestlé India launched a social media
campaign to reinforce the importance of
breastfeeding. Featuring the animated,
rapping Super Babies, the 2014 campaign
aimed to go beyond the half a million
pledges generated the previous year, by
taking public support and converting it into
an action through discussions on the
benefits of breastfeeding and involving the
public at large. By the end of 2014, the
Super Babies video had been watched more
than two million times.
Our progress
We have been included in the FTSE4Good
Index since 2011, the only global responsible
investment index with clear criteria on the
marketing of breast-milk substitutes (BMS)
up to 12 months of age in 152 higher-risk
countries. Policies and procedures applied
by our Wyeth Infant Nutrition business
are now aligned with the requirements
stemming from the FTSE4Good BMS
Marketing Criteria.
In 2014, our practices were audited in
39 countries by internal auditors and in
four countries by external auditors 15.
Building on these and previous years’
recommendations, we have strengthened
training for third-party distributors and
their requirements to comply with national
legislation and the Nestlé Policy and
Instructions for Implementation of the WHO
Code. We also enhanced our systems for
the reporting of concerns, largely by external
stakeholders, through the ‘Tell us’ system
(see page 32).
Market breast-milk substitutes
responsibly
Our objectives
Ongoing – As part of our ongoing efforts
to promote good nutrition in the first
1000 days of life and support breastfeeding,
report publicly on our progress regarding
the responsible marketing of breast-milk
substitutes.
By 2014 – Ensure our newly acquired
Wyeth Nutrition Infant Formula business
meets the FTSE4Good Index criteria.
By 2015 – Continue to strengthen our
practices to ensure both Nestlé Infant
Nutrition and Wyeth Infant Nutrition
consistently meet the FTSE4Good Index
BMS criteria.
Our commitment
12	 International Food and Beverage Alliance’s Global Policy on Advertising and Marketing Communications to Children.
13	 The percentage reflects Nestlé’s full-year compliance to the stricter 35% children audience threshold as redefined in September 2011.
14	 Marketing communication will be deemed directed to children 6–12 years old if 35% or more of the media channel’s audience is that of that age group.
In addition, we will take into account channels of placement, content and overall impression of the marketing communication.
15 	As per existing company practices, internal audits of newly acquired businesses slightly differed upon acquisition to allow time for integration
of policies and practices. Wyeth Nutrition will be included in the standard audit cycle along with the business starting from 2015 onwards.
Our perspective
We believe breast-milk is the best food for
infants and this is why we promote it.
However, there are still numerous barriers to
breastfeeding. When, in consultation with
their healthcare providers, mothers and
families decide that optimal breastfeeding
is not possible, infant formula – the only
suitable breast-milk substitute recognised
by the WHO – plays a vital role in providing
essential nutrients to infants. We are
committed to the highest standards of
responsible marketing of BMS and comply
with the WHO Code as implemented by
national governments as well as the Nestlé
Policy and Instructions for Implementation of
the WHO Code. We pledge to apply the most
rigorous policies and systems to monitor our
practices. As we seek to continuously
improve, we encourage stakeholders to share
with us their comments. In 2015, we will
pursue our efforts to create a conducive
environment for our employees who
breastfeed. We will also continue to engage
with key stakeholders to increase
collaboration, promote responsible conduct
and establish an accepted standard for
assessing the commercialisation of
breast-milk substitutes.
17
Roll out the Rural Development
Framework to understand the
needs of farmers
Our objectives
The Nestlé Rural Development Framework 16
helps us to identify the needs of farmers
and farming communities and, therefore,
to target our investments better.
By 2015 – Continue to establish baseline
assessments in the countries of key
importance to our business that show
pronounced social need to guide us in
aligning our own activities with the priorities
of local communities.
Our progress
In 2013, we piloted the Rural Development
Framework in our coffee programmes in
China and Vietnam, and coffee, cocoa and
cassava procurement in Côte d’Ivoire. This
involved conducting baseline assessments
to understand current conditions and design
appropriate interventions. Some common
findings, published in July 2014, include
poor resource management, and variable
access to clean water, sanitation and
nutrition. In some cases, issues concerning
land tenure, the status of women and
agronomy knowledge were also raised.
Following stakeholder feedback on our
human rights and rural development
approach in April 2014, we adjusted our
approach and began work across Mexico,
Colombia, Kenya, Ethiopia, Indonesia and
the Philippines. Some of our findings have
already been incorporated into country
business plans, while others require further
discussions with partners, communities and
government agencies to align our efforts
and avoid duplication.
Our perspective
Nestlé has a huge stake in rural communities
around the world, sourcing agricultural raw
materials from millions of farmers globally.
These farmers are essential to the ongoing
success of our business, but the global
farming population is ageing and more
people are moving away to urban areas.
The Nestlé Rural Development Framework
helps align our business activities with
local development priorities. In addition to
helping farmers access financial assistance,
our agripreneurship model provides a
training pipeline for farmers to develop
their skills.
But making rural areas attractive
places to live, work and invest in doesn’t
just depend on our supply chain. Rural
populations need access to clean energy,
banking and finance, healthcare,
telecommunications and other
infrastructure. We are working with the
World Business Council for Sustainable
Development (WBCSD) and its member
companies to explore how different
sectors can come together to focus their
investments in rural areas. We also know
that for many communities, nutritional
status remains a critical challenge. At this
point, our Rural Development Framework
may not yet address this aspect sufficiently.
Developing the dairy farming sector
in China
Nestlé built its factory in Shuangcheng,
China, in 1987. In 2012, having recognised
a need to improve the sustainability
of our milk supply chain, we committed
to establishing the Nestlé Dairy Farming
Institute. Helping farmers to increase their
knowledge and skills is a key focus area
of our rural development strategy.
By adopting best practices, farmers are
able to improve productivity, trading
relations and cost control. The Institute
consists of three demonstration dairy
farms, where farm owners and workers
attend training sessions to improve farm
management skills, learn how to use
the latest technology and gain practical
experience in expanding their businesses.
In 2014, the Institute launched training
programmes covering dairy farm
management and dairy cow breeding.
Our commitment
Rural development
We depend on a secure,
long-term supply of
ingredients for our products
and we want to ensure
those ingredients are
produced responsibly.
By understanding where
and how our raw
materials are produced
and aligning our business
activities with local
priorities, we can contribute
to important issues
such as rural development,
eliminating child labour
and promoting better
agricultural practices.
	
For all objectives, we aim to fulfil our
commitment by 31 December of the
year stated.
Nestlé in society18
Our progress
By the end of 2014, we had audited 8700
of our 10 000 Tier 1 suppliers (2013: 6500),
73% of which fully complied with our
Supplier Code. 1300 more audits are
planned for 2015. If we reach 10 000 audits
by the end of 2015, we will have covered
over 60% of our raw and packaging material
suppliers, accounting for over 95% of our
overall spend.
Currently, 38% of purchased volumes
of our priority categories are traceable
(2013: 17%), which means all farmers
involved in supplying that ingredient (even
via third parties) are known and identifiable
by Nestlé or our suppliers. Furthermore,
28% (2013: 9%) are Responsibly Sourced,
whereby the plantation or farm is either
compliant with our Responsible Sourcing
Guideline requirements or has an
improvement plan in place, or complies
with an equivalent certification scheme.
With operational activities for meat,
dairy, shea and fish commencing in 2014,
we are confident that 40% of our priority
category volumes will be traceable, and
30% Responsibly Sourced, by 2015.
A global partnership
for animal welfare
In March 2014, Nestlé became the first
major food company to form a global
partnership with an international animal
welfare NGO, World Animal Protection.
Nestlé uses dairy, eggs, meat and poultry
as ingredients in a range of products and
has publicly committed to further improving
farm welfare in its global supply chain.
Through this partnership, World Animal
Protection shares its expertise on farm animal
health, care and welfare. In turn, Nestlé,
through its responsible sourcing activities,
provides World Animal Protection with the
opportunity to further engage with suppliers
and to promote good farm animal welfare
practices within the food industry.
16	 Created to bring all our rural development activities together, the framework – supported by our Rural Development Commitment – is composed
of three pillars underpinned by alignment, collaboration and advocacy: successful farmers; productive and respected workers; and prospering communities.
We have audited 8700 of
our 10 000 Tier 1 suppliers
and found 73% fully complied
with our Supplier Code
Our perspective
With consumers and other stakeholders
increasingly looking for information about
where their food comes from and how it
was produced, responsible sourcing is an
important investment, in both Nestlé’s
future and that of the producers we rely on.
Our supply chains are complex and
continuous improvement requires all
parties to address social and environmental
issues. We’ve made steady progress by
encouraging the adoption of good
agricultural practices, and engaging in
capacity building, knowledge sharing and
training, enabling our suppliers to reach
higher levels of sustainability.
As well as working alongside NGO
partners such as Proforest and The Forest
Trust to map our supply chains for sugar,
soya, palm oil and paper, we are also
taking a proactive role in assessing
suppliers of animal-derived ingredients
against our Responsible Sourcing Guideline
on farm animal welfare, and in tackling
deforestation and addressing child labour
in our supply chains.
Our commitment
Implement responsible sourcing
in our supply chain
Our objectives
By 2015 – To both improve and demonstrate
compliance with the Nestlé Supplier Code,
and complete 10 000 Responsible Sourcing
audits, 70% of them with full compliance.
By 2015 – 40% of the volumes of the
12 priority categories (palm oil; soya; sugar;
pulp and paper; coffee; cocoa; dairy; fish
and seafood; shea; vanilla; hazelnuts; and
meat, poultry and eggs) to be traceable.
19
Nestlé Cocoa Plan in Venezuela
In Venezuela, we have faced a number
of challenges in securing a reliable supply
of some of the world’s finest cocoa; these
range from a decline in the quality of native
cocoa plants to the limited appeal of
agricultural work to the younger generation.
But through the Nestlé Cocoa Plan, we are
helping to make cocoa production a
livelihood of choice – one that leads to higher
incomes and improved social conditions.
Six hundred farmers across the country’s
three main cocoa-producing regions are
currently involved in the Nestlé Cocoa Plan.
And since 2008, Nestlé Venezuela staff
have made almost 6130 visits to their farms,
distributing high-quality plantlets and
organic fertilizers, offering technical
assistance and providing training in good
agricultural practices such as pruning,
which increases yield and restricts the
spread of disease. On our demo plots pod
counts indicate an increase from 878 kg to
over 1500 kg per hectare.
Our progress
In 2014, we purchased 91 801 tonnes
of cocoa through the Nestlé Cocoa Plan
(2013: 62 299). We trained 45 833 cocoa
farmers (2013: 33 885) and built or
refurbished 17 schools (2013: 13), meeting
our target of building or refurbishing
40 schools in four years.
In August 2014, the Fair Labor
Association (FLA) published its first report
on Nestlé’s cocoa supply chain in Côte
d’Ivoire, highlighting areas where we need
to do more to meet its Code of Conduct.
We have since extended our Child Labour
Monitoring and Remediation System
to include another 14 co-operatives in
Côte d’Ivoire (2013: eight), bringing the
cumulative total to 22. Community liaison
officers are selected from the farming
communities to identify the children at
risk, and to engage with cocoa farmers
in an open and transparent way. We plan
to extend the initiative to cover all
67 Nestlé Cocoa Plan co-operatives by
the end of 2016.
Rural development
Roll out the Nestlé Cocoa Plan with
cocoa farmers
Our objectives
The Nestlé Cocoa Plan aims to improve the
lives of cocoa farming communities and the
quality of the cocoa we purchase.
By 2015 – Source 100 000 tonnes of cocoa
through the Nestlé Cocoa Plan.
By 2016 – Source 120 000 tonnes of cocoa
through the Nestlé Cocoa Plan and complete
the roll-out of our Child Labour Monitoring
and Remediation System to identify child
labour in all Nestlé Cocoa Plan co-operatives
in Côte d’Ivoire.
By 2017 – Source 150 000 tonnes of cocoa
through the Nestlé Cocoa Plan.
Our commitment
For more details about the Nestlé
Commitment on Child Labour in Agricultural
Supply Chains and our action plans to
address the issue in the supply chains of
key categories, see our commitment on
child labour on page 31.
Our perspective
The Nestlé Cocoa Plan has three pillars:
enabling farmers to run profitable farms;
improving social conditions; and sourcing
good quality, sustainable cocoa for our
products. By providing stronger plants and
training farmers in better agricultural
practices, we can help them improve their
long-term profitability and sustainability.
Better access to education and support for
women involved in our supply chain is
improving social conditions and reducing
the risks of child labour. Nestlé is one of the
largest buyers of Ivorian cocoa, working
with 67 cocoa co-operatives. Our Child
Labour Monitoring and Remediation System
is exposing the extent of and causes behind
child labour in Côte d’Ivoire’s cocoa farming
industry, helping Nestlé and our partners
tackle the problem in a way that meets the
needs of families and communities.
Nestlé in society20
Roll out the Nescafé Plan with
coffee farmers
Our objectives
By 2015 – To improve the sustainability of
our coffee supply chain, source
180 000 tonnes of coffee from Farmer
Connect 17, all of which is 100% in line with
4C’s 18 baseline sustainability standard.
By 2020 – To improve the quality, quantity
and sustainability of our coffee supply
chain, distribute 220 million coffee
plantlets 19 and source 90 000 tonnes of
coffee that is compliant with the Sustainable
Agriculture Network principles 20.
Our progress
During 2014, we further embedded the
Nescafé Plan in the 14 countries where it
currently operates. We also enhanced its
scope in Vietnam and Colombia through
initiatives related to water, coffee and
rural development.
By the end of 2014, Nescafé had
sourced around 186 750 tonnes directly
through our Farmer Connect 17 sourcing
operations from about 171 900 farmers
(2013: 176 040 farmers). Of this amount
130 500 tonnes (or 70%) is compliant
according to the 4C standard
(2013: 71 493 tonnes, 48%).
The total volume of responsibly sourced
coffee increased to 412 538 tonnes (2013:
366 270 tonnes).
We also distributed more than
29.8 million high-yield, disease-resistant
coffee plantlets to farmers in 2014 (2013:
21.4 million), taking our cumulative total
to 73.8 million.
Our commitment
The Positive Cup
In addition to our Nescafé Plan activities, in August 2014, Nespresso announced ‘The Positive
Cup’, a new sustainability strategy to improve farmer welfare and drive environmental
sustainability in coffee sourcing and consumption over the next six years. It sets out the
steps the company will take to achieve ambitious goals in the areas of coffee sourcing and
social welfare; aluminium sourcing, use and disposal; and resilience to climate change.
Building on what Nespresso has already achieved over the last 11 years, Nespresso will
source 100% of its permanent range of Nespresso Grands Crus coffees sustainably through
its Nespresso AAA Sustainable Quality Programme, including investing in the economic and
social development of coffee-farming communities in Ethiopia, Kenya and South Sudan.
17 	Our programme for direct sourcing from farmers, through which we commit to the local sourcing of raw materials,
offering technical assistance and ensuring cooperation to meet the highest sourcing standards.
18	 The Common Code for the Coffee Community (4C) Association is a multi-stakeholder group with members across trade and industry,
producers, civil society and companies active in the coffee supply chain.
19	 This is an aggregate figure from 2010 to 2020.
20	 An international coalition of leading conservation groups in sustainable agriculture, with standards for environmental protection,
social responsibility and economic vitality.
Our perspective
Our long-term ability to source the right
quality and quantity of coffee for our major
brands depends on the sustainability of
coffee farming. Ageing trees, plant
diseases, declining yields, volatile prices
and climate change are just some of the
threats to the livelihoods of coffee farmers,
the vast majority of whom are smallholders.
Coffee growing is also being challenged
by alternative crops, considered by growers
as better commercial prospects.
We are responding by helping farmers
build a more robust business – offering
efficient routes to market, local training,
plant propagation and distribution, and
technical assistance through our team of
more than 300 agronomists.
In 2014 Nescafé
responsibly sourced
412 538 tonnes
of coffee
21
Water
Work to achieve water
efficiency and sustainability
across our operations
Our objectives
We aim to minimise the impact of our
operations on natural water resources and
the communities they support.
By 2015 – Reduce direct water withdrawals
per tonne of product in every product
category to achieve an overall reduction of
40% since 2005.
By 2015 – Establish and implement detailed
guidelines on human rights to water and
sanitation due diligence.
By 2016 – Define water stewardship
initiatives and start implementation in five
high-priority locations.
By 2016 – Implement water savings
projects in 100% of high-priority
manufacturing facilities.
By 2016 – Carry out 45 new water resources
reviews in selected manufacturing facilities,
and all greenfield sites.
Our progress
In line with our Commitment on Water
Stewardship (2013), Nestlé actively seeks
new opportunities to reduce, reuse and
recycle water in our operations. We have
introduced a global ‘Water Stewardship
Master Plan’ at a corporate level, and we
have started to develop local master plans
in key markets, beginning with Pakistan
(2014). These contain documented
responsibilities, targets and deadlines
that direct our improvements.
Today, our people are carrying out over
376 water-saving projects in Nestlé’s
factories, which will save around
1.84 million m3 of water. In 2014, we reduced
direct water withdrawals per tonne of
product by 6% (37% reduction since 2005).
We have identified and prioritised
31 high-priority manufacturing facilities that
are located in areas of severe water stress
and/or represent a significant portion of our
water withdrawals. By the end of 2014, we
have decreased water withdrawals and
improved efficiency (against 2013 levels) in
42% of these facilities. We improve local
water stewardship efforts by conducting
Water Resource Reviews across our factory
sites, with 18 new reviews carried out this
year. Water, Sanitation and Hygiene (WASH)
considerations are being integrated into
the process.
Our perspective
Nestlé welcomes the growing level of
stakeholder interest in water issues,
recognising that it reflects a greater awareness
of the impacts of global water scarcity. We
remain convinced that public debate around
water use (including our own water use), leads
to positive collective action. With 38% of our
factories situated in water-stressed regions,
responsible water stewardship rightly remains
a critical issue for our business and our
stakeholders. Water resource reviews help us
to assess potential impacts to the Right to
Water and Sanitation of local communities
where we operate and they propose
appropriate corrective actions, when needed.
The right to water and sanitation is also
systematically included in our corporate
Human Rights Impact Assessment. By the
end of 2014, 133 factories had undergone a
Water Resources Review. We will continue to
drive improvements in water efficiency and
sustainability across our operations.
Our commitment
Cero Agua Mexico
This year, in Mexico, we opened our most
water-efficient factory. Over the last
60 years, water availability per person has
drastically declined in the country, due to
population growth. Using new processes,
our Cero Agua dairy factory in the
water-stressed state of Jalisco is already
moving towards zero water withdrawals
on-site. Instead, the factory uses the water
vapour generated when we evaporate
cow’s milk. This water is condensed,
treated and recycled for use as potable
process water, and again for cooling and
cleaning. This is saving around 1.6 million
litres of water a day – enough to meet the
average daily consumption of 6400 people
in the surrounding area 21. We are
replicating the process in locations such as
Nestlé South Africa, where our five-year
investment plan includes converting our
Mossel Bay dairy factory to ‘Zero Water’.
Water, more than any other
substance, is essential
for human survival and
cannot be replaced. The
gap between the supply
and demand of safe
fresh water is increasing
and, by 2030, water
withdrawals are predicted
to exceed renewals
by 40% if no action is
taken. Responsible water
stewardship is critical
for all of us and to the
future of our business.
We respect the human
right to water and
sanitation, and are helping
to facilitate the sustainable
management of water
catchments where we
source our goods, where
our factories are located,
and where our suppliers
and consumers live.
	
For all objectives, we aim to fulfil our
commitment by 31 December of the
year stated.
Nestlé in society22
Water discharges
per tonne of
product
cut by 52%
since 2005
Advocate for effective water
policies and stewardship
Our objectives
We aim to promote water policy and
management that helps towards sustainable
use by industry and others, both globally
and locally.
By 2016 – Continue to build the 2030 Water
Resources Group Public Private Partnership
by adding two more countries per year and
further develop and publicise the Global
Catalogue on Good Practices.22
By 2016 – Support the launch of the CEO
Water Mandate Guide on Good Practices for
Business on the Human Right to Water and
Sanitation and pilot test the Guide in our
water due diligence in selected markets.23
By 2016 – Support the World Business
Council for Sustainable Development
(WBCSD) to achieve 50 signatories of the
WASH Pledge.24
By 2016 – Initiate the roll-out process of the
Alliance for Water Stewardship’s (AWS)
International Water Stewardship Standard by
implementing it in at least five locations.22
By 2016 – Work with the Sustainable
Agriculture Initiative Platform (SAI) and the
Sustainable Food Lab (SFL) to implement
the Water Risk Assessment and Mitigation
collaboration initiative in at least one
sourcing area of agricultural raw materials.25
Our progress
Nestlé maintains a strong presence in
high-profile initiatives on water policy and
stewardship, promoting opportunities to
improve best practice. Many of our senior
people, including our Chairman, play a
leading role in the 2030 Water Resources
Group (2030 WRG). We currently chair this
public-private-civil society collaboration,
which seeks to catalyse practical solutions
for water resources reform in water-stressed
developing economies. The WRG has been
invited to work in Peru and Tanzania, and is
also exploring other countries such as
Bangladesh, Kenya and Lebanon.
In July 2014, we welcomed the
publication of the international standard
ISO 14046:2014 Environmental management
– Water footprint – Principles, Requirements
and Guidelines. It marks the culmination of
five years of collaboration between more
than 90 experts and Nestlé has been an
active member of the working group.
We continue to support the CEO Water
Mandate Public Disclosure Guidelines,
released in September 2014, and champion
the WBCSD Pledge in our own operations
and beyond, acting as a vocal WASH
Ambassador on the international platform.
We have produced internal guidance on
the AWS International Water Stewardship
Standard (AWS Standard) to strengthen
water stewardship at key Nestlé locations.
A wider roll-out is planned for 2015.
Promoting water stewardship at Nestlé’s Douala factory in Cameroon
In 2014, we completed a Water Resources Review (WRR) at our Douala factory in Cameroon
where we produce Maggi soup bases. We used the WBCSD WASH self-assessment tool
to examine access to water, sanitation and hygiene for more than 500 employees, vendors
and visitors to the site. The factory satisfactorily met the Pledge’s overall compliance levels,
and we have developed an action plan to tackle the few improvement issues it highlighted.
Communities as far as two to three kilometres away benefit from free access to water
fountains on site during set hours, resulting in around 5000 litres of water being collected
by local residents every day. A new CHF 474 905 wastewater drainage project is planned
to help reduce the risk of flooding and improve the local environment for communities.
Our commitment
21	 This figure is based on use of an average daily consumption of approximately 250 l per person. Source: Tecnologías Alternativas y Ecodiseño.
22	This is an ongoing extension of our 2014 objective.
23	Our 2014 objective to contribute to the Guidelines was achieved.
24	Our 2014 objective to contribute to the ISO 14046: Water Footprint – Principles, Requirements and Guidelines was achieved.
25	Our 2014 objective to use the principles of the AWS Standard as a self-assessment guide at selected high-priority locations was achieved.
Our perspective
We are all facing an urgent challenge to
provide safe water for and feed the world’s
growing population. It calls for joint efforts
and common goals going forward. We
believe governments must take a systemic
approach to water. They must provide
strong leadership, avoid acting in ‘silos’ and
ensure accountability towards political
commitments. They must also strengthen
institutions, particularly for community-
based affordable solutions within the water
safety/sanitation/poverty nexus, act as
regulators (for both public and private water
supply structures) and set incentives to
ensure cost-effective solutions and good
management of water security, water
supply, sanitation and treatment. We are
willing to help by advocating for effective
water policies and water stewardship.
Our proactive approach brings us into
contact with Public Private Partnerships,
industry bodies, NGOs and research
institutions to learn and share best practice.
The progress delivered through these
relationships is communicated transparently
via our website.
23
Water
Engage with suppliers,
especially those in agriculture
Our objective
By 2015 – Define and start to implement
action plans to save water in our upstream
supply chain for coffee, sugar, rice and
cereals in high-priority locations.
Our progress
Improving the water efficiency of our
complex agricultural supply chain is one of
our greatest challenges. Nestlé works
directly with around 695 000 farmers and,
through the Sustainable Agriculture
Initiative at Nestlé, we promote sustainable
development and offer support to farmers.
The global programme focuses on a range
of categories and enables us to address
some key challenges in water management
and irrigation, such as resilience to drought
and flooding; wastewater and organic waste
treatment; and farm intensification
techniques. In 2014, we supported:
•	an integrated water management project
to develop a climate-intelligent coffee
sector in Colombia;
•	the application of the Water Footprint
methodology in Colombia, to improve
water use awareness, efficiency and
water pollution control on dairy farms and
at our factories;
•	a water stewardship agriculture seminar
in Spain; and
•	new changes to irrigation methods and
water management in Vietnam to produce
more coffee beans with less water.
Our perspective
Water is a shared resource, impacted by all
users in a catchment area. We believe that,
sometimes, the greatest improvement to the
health of a water catchment can be achieved
when Nestlé invests resources in an external
initiative rather than our own factory. We can
achieve significant improvements in water
use by introducing better agricultural
techniques at a farm level, and these do not
always require significant investment. We
also believe there is an opportunity for
businesses that purchase from large global
suppliers to use their collective influence to
demand better water efficiency, for example
through the Sustainable Agricultural
Initiative Platform. We will invest in external
shared initiatives that help all catchment
users to improve water efficiency.
Treat the water
we discharge effectively
Our objective
By 2016 – Implement the new and
strengthened Nestlé Environmental
Requirements for water quality and effluent
discharge in all factories in order to help
protect the environment.
Our progress
In 2014, we approved a spend of
CHF 18 million on new and improved
treatment facilities and strengthened our
water quality requirements for new effluent
treatment installations.
At the end of 2014, we have reduced
water discharges per tonne of product
by 51.8% since 2005 (2013: 48.5%), with
an average quality of water discharge
of 72 mg COD/l (2013: 76 mg COD/l).
Our commitmentOur commitment
Treating waste water with bio-digestion
Nestlé’s Fawdon confectionary factory in the UK has invested CHF 4.9 million in an
anaerobic digestion system, completed in September 2014, which converts solid and liquid
sewage waste into clean water and methane gas using natural biological digestion
processes. The facility will save 1000 tonnes CO2 every year year, cut solid waste by 4000 kg
per day, and reduce effluent discharges by 95%. Financial savings represent CHF 380 000
in effluent charges and CHF 600 000 in electricity charges.
Our perspective
We are committed to developing our
business in a way that helps to safeguard
biodiversity and ecosystem services.
Nestlé has set ambitious targets for
discharged water quality from 2016, and
ensuring we meet them is a challenge.
We have deployed a water and effluents
dashboard focusing on water withdrawal,
discharge and quality reporting to support
progress. Training and raising awareness
among our employees is a priority.
Wherever possible, we use municipal
wastewater treatment facilities. Where
these are non-existent or not efficient
enough, we invest in our own facilities to
discharge water treated to a level that
meets local legislation and/or our internal
standards, whichever is more stringent.
Nestlé in society24
Raise awareness on water
conservation and improve access
to water and sanitation across
our value chain
Our objectives
By 2015 – Every Nestlé employee has
access to safe water, sanitation and hygiene
of an appropriate standard at the workplace.
By 2016 – 350 000 beneficiaries in local
communities will have access to water,
sanitation or hygiene projects around our
manufacturing facilities and in Farmer
Connect areas.
Our progress
We continue to work with expert partners,
including the WBCSD and the International
Federation of Red Cross and Red Crescent
Societies (IFRC) (see case study below),
to improve access to water and sanitation,
and in 2014:
•	we tested the WBCSD self-assessment
WASH tool at key manufacturing sites, and
•	almost 400 000 people (2013: over
300 000) had access to water, sanitation
or hygiene around our manufacturing
facilities and in Farmer Connect
areas meaning we reached our 2016
target early.
Through education initiatives, we are
helping our employees, suppliers and
consumers to improve their understanding
of the importance of water conservation and
stewardship. In addition to supplier
activities (see page 24), during 2014 we
have:
•	delivered a new training programme to
our Corporate HR Team (117 people), and
made course content available to all
employees via the company intranet;
•	continued our sponsorship of the global
water education programme, ‘Project
WET’, which expanded its reach in Nigeria
to the Osun State; and
•	marked World Water Day with around
650 employees helping to organise
factory events for more than
22 000 children in 32 countries.
Providing clean water and sanitation
in Côte d’Ivoire
Since 2006, the International Federation
of Red Cross and Red Crescent Societies
and Nestlé have been working together
with a particular focus on improving rural
communities’ access to water. Through
the collaboration, 196 546 people in
Côte d’Ivoire’s cocoa communities now
have access to clean drinking water
and sanitation facilities.
In October 2014, we renewed our long-
standing collaboration with the IFRC, and
will contribute CHF 5 million over five years
to the organisation to improve access to
sustainable water, sanitation and hygiene
services in rural areas, and to extend the
project to Ghana. Nestlé was the IFRC’s
first corporate partner in 2002. In addition
to the ongoing collaboration on water
and sanitation, we are also sponsoring the
production of the IFRC’s annual World
Disaster Report, engaging with national
Red Cross and Red Crescent societies
and supporting the IFRC’s disaster relief
operations (e.g. Ebola in 2014).
Our commitment
26	 www.wbcsd.org/work-program/sector-projects/water/accesswatersanitation.aspx
Our perspective
The WHO estimates that every person
needs 50 to 100 litres of fresh water per day
to meet their basic daily needs. But, today,
as estimated by the WBCSD, more than
1.8 billion people depend on unsafe drinking
water, and an estimated 4 billion lack access
to basic sanitation 26. We agree that lack of
access to safe water, sanitation and hygiene
can cause illness or death, impair
productivity, and restrict markets for some
products and services. We believe there
is a clear and compelling economic case for
businesses to demonstrate leadership by
addressing this situation. That is why, last
year, Nestlé became one of the first
signatories of the WBCSD WASH Pledge,
committing to providing access to safe
water, sanitation and hygiene at all of our
direct workplace premises within three
years. By signing the pledge, we restated
our own commitment and are encouraging
others along the value chain to do the same.
If all WBCSD member companies signed
the WASH Pledge it would represent
15 million employees.
25
Nestle Creating Shared Value Report 2014

More Related Content

What's hot

Supply Chain Management of Nestle Company
Supply Chain Management of Nestle CompanySupply Chain Management of Nestle Company
Supply Chain Management of Nestle Company
Asad Rehman
 
DEVELOPING DEMAND FORECASTING MODEL FOR FMCG PRODUCT
DEVELOPING DEMAND FORECASTING MODEL FOR FMCG PRODUCTDEVELOPING DEMAND FORECASTING MODEL FOR FMCG PRODUCT
DEVELOPING DEMAND FORECASTING MODEL FOR FMCG PRODUCT
Gagan Gouda
 
Financial Analysis of Nestle company
Financial Analysis of Nestle companyFinancial Analysis of Nestle company
Financial Analysis of Nestle company
عرفان محسن
 
BMW ERP base
BMW ERP baseBMW ERP base
BMW ERP base
Hemal Patel Sam
 
Marketing audit - nestle
Marketing audit - nestleMarketing audit - nestle
Marketing audit - nestle
Rahul Tanwar
 
Maggi marketing strategy
Maggi   marketing strategyMaggi   marketing strategy
Maggi marketing strategy
Vikas Awasthi
 
Operations at Big Bazaar
Operations at Big BazaarOperations at Big Bazaar
Operations at Big Bazaar
SHAHBAAZ AHMED
 
Project report on retail management .
Project report on retail management .Project report on retail management .
Project report on retail management .c143k
 
Questionnaire on consumer behaviour on cosmetic product
Questionnaire on consumer behaviour on cosmetic productQuestionnaire on consumer behaviour on cosmetic product
Questionnaire on consumer behaviour on cosmetic product
MOHAMMED AFTHAB A.M
 
Ikea Invades India - Market Research report on entry strategy in India
Ikea Invades India - Market Research report on entry strategy in IndiaIkea Invades India - Market Research report on entry strategy in India
Ikea Invades India - Market Research report on entry strategy in India
Maneesh Garg
 
Report on Consumer behavior towards dairy milk
Report on Consumer behavior towards dairy milkReport on Consumer behavior towards dairy milk
Report on Consumer behavior towards dairy milk
Prateek Pawar
 
Walgreens constellation wine category review
Walgreens constellation wine category reviewWalgreens constellation wine category review
Walgreens constellation wine category review
Megan Caron
 
Rin ppt
Rin pptRin ppt
Rin ppt
Swati Lal
 
Parle products, all about manufacturing by Manpreet singh Digital
Parle products, all about manufacturing by Manpreet singh DigitalParle products, all about manufacturing by Manpreet singh Digital
Parle products, all about manufacturing by Manpreet singh Digital
Manpreet Singh Chhabra
 
Brand communication of Maggi Noodles
Brand communication of Maggi NoodlesBrand communication of Maggi Noodles
Brand communication of Maggi Noodles
PRINCEKUMAR667
 
Sumul dairy
Sumul dairy Sumul dairy
Sumul dairy
Dharmesh Chheta
 
HUL vs P&G
HUL vs P&GHUL vs P&G
HUL vs P&G
Saurabh Barnwal
 
Marketing practices by fmcg companies for rural market shailu (2)
Marketing practices by fmcg companies for rural market shailu (2)Marketing practices by fmcg companies for rural market shailu (2)
Marketing practices by fmcg companies for rural market shailu (2)
Md Aktar
 

What's hot (20)

Supply Chain Management of Nestle Company
Supply Chain Management of Nestle CompanySupply Chain Management of Nestle Company
Supply Chain Management of Nestle Company
 
DEVELOPING DEMAND FORECASTING MODEL FOR FMCG PRODUCT
DEVELOPING DEMAND FORECASTING MODEL FOR FMCG PRODUCTDEVELOPING DEMAND FORECASTING MODEL FOR FMCG PRODUCT
DEVELOPING DEMAND FORECASTING MODEL FOR FMCG PRODUCT
 
Financial Analysis of Nestle company
Financial Analysis of Nestle companyFinancial Analysis of Nestle company
Financial Analysis of Nestle company
 
BMW ERP base
BMW ERP baseBMW ERP base
BMW ERP base
 
Shoppers Stop
Shoppers StopShoppers Stop
Shoppers Stop
 
Marketing audit - nestle
Marketing audit - nestleMarketing audit - nestle
Marketing audit - nestle
 
Maggi marketing strategy
Maggi   marketing strategyMaggi   marketing strategy
Maggi marketing strategy
 
Operations at Big Bazaar
Operations at Big BazaarOperations at Big Bazaar
Operations at Big Bazaar
 
Project report on retail management .
Project report on retail management .Project report on retail management .
Project report on retail management .
 
Maggi - Nestlé
Maggi - NestléMaggi - Nestlé
Maggi - Nestlé
 
Questionnaire on consumer behaviour on cosmetic product
Questionnaire on consumer behaviour on cosmetic productQuestionnaire on consumer behaviour on cosmetic product
Questionnaire on consumer behaviour on cosmetic product
 
Ikea Invades India - Market Research report on entry strategy in India
Ikea Invades India - Market Research report on entry strategy in IndiaIkea Invades India - Market Research report on entry strategy in India
Ikea Invades India - Market Research report on entry strategy in India
 
Report on Consumer behavior towards dairy milk
Report on Consumer behavior towards dairy milkReport on Consumer behavior towards dairy milk
Report on Consumer behavior towards dairy milk
 
Walgreens constellation wine category review
Walgreens constellation wine category reviewWalgreens constellation wine category review
Walgreens constellation wine category review
 
Rin ppt
Rin pptRin ppt
Rin ppt
 
Parle products, all about manufacturing by Manpreet singh Digital
Parle products, all about manufacturing by Manpreet singh DigitalParle products, all about manufacturing by Manpreet singh Digital
Parle products, all about manufacturing by Manpreet singh Digital
 
Brand communication of Maggi Noodles
Brand communication of Maggi NoodlesBrand communication of Maggi Noodles
Brand communication of Maggi Noodles
 
Sumul dairy
Sumul dairy Sumul dairy
Sumul dairy
 
HUL vs P&G
HUL vs P&GHUL vs P&G
HUL vs P&G
 
Marketing practices by fmcg companies for rural market shailu (2)
Marketing practices by fmcg companies for rural market shailu (2)Marketing practices by fmcg companies for rural market shailu (2)
Marketing practices by fmcg companies for rural market shailu (2)
 

Viewers also liked

7. Jolanda Soons-Dings Creating Shared Value across the supply chain - LWM 0...
7. Jolanda Soons-Dings Creating  Shared Value across the supply chain - LWM 0...7. Jolanda Soons-Dings Creating  Shared Value across the supply chain - LWM 0...
7. Jolanda Soons-Dings Creating Shared Value across the supply chain - LWM 0...Jolanda Soons-Dings
 
Sourcing Opportunities in Thailand
Sourcing Opportunities in ThailandSourcing Opportunities in Thailand
Sourcing Opportunities in Thailand
Dragon Sourcing
 
Nestle 2013 creating shared value report
Nestle 2013 creating shared value reportNestle 2013 creating shared value report
Nestle 2013 creating shared value report
Sustainable Brands
 
SB11 - Kendall Jackson - Robert Boller
SB11 - Kendall Jackson - Robert Boller SB11 - Kendall Jackson - Robert Boller
SB11 - Kendall Jackson - Robert Boller Sustainable Brands
 
Csv 102012 Final
Csv 102012 FinalCsv 102012 Final
Csv 102012 Final
candice_chow
 
Cost accounting brownies basket with cost sheet
Cost accounting brownies basket with cost sheetCost accounting brownies basket with cost sheet
Cost accounting brownies basket with cost sheet
Jasvinder Notra
 
Nestle financial report analysis 2013 & 2014
Nestle financial report analysis 2013 & 2014Nestle financial report analysis 2013 & 2014
Nestle financial report analysis 2013 & 2014
shahryar akram
 
Analysis Of Annual Report Nestle
Analysis Of Annual Report NestleAnalysis Of Annual Report Nestle
Analysis Of Annual Report NestleAshish Khera
 
Nestle assignment
Nestle assignmentNestle assignment
Project report on marketing mix and competitive analysis of pureit hul
Project report on marketing mix and competitive analysis of pureit hulProject report on marketing mix and competitive analysis of pureit hul
Project report on marketing mix and competitive analysis of pureit hulJitender Kumar
 
Project report on Hindustan Unilever Product - Pure-it
Project report on Hindustan Unilever Product - Pure-itProject report on Hindustan Unilever Product - Pure-it
Project report on Hindustan Unilever Product - Pure-itDjSai Pune
 
Nestlé Case Study
Nestlé Case StudyNestlé Case Study
Nestlé Case Study
Lauren D. Perry
 
Nestle final project
Nestle final projectNestle final project
Nestle final project
waheeducp
 
STRATEGIC MANAGEMENT - NESTLE COMPANY
STRATEGIC MANAGEMENT - NESTLE COMPANYSTRATEGIC MANAGEMENT - NESTLE COMPANY
STRATEGIC MANAGEMENT - NESTLE COMPANYSiti Rizki
 

Viewers also liked (14)

7. Jolanda Soons-Dings Creating Shared Value across the supply chain - LWM 0...
7. Jolanda Soons-Dings Creating  Shared Value across the supply chain - LWM 0...7. Jolanda Soons-Dings Creating  Shared Value across the supply chain - LWM 0...
7. Jolanda Soons-Dings Creating Shared Value across the supply chain - LWM 0...
 
Sourcing Opportunities in Thailand
Sourcing Opportunities in ThailandSourcing Opportunities in Thailand
Sourcing Opportunities in Thailand
 
Nestle 2013 creating shared value report
Nestle 2013 creating shared value reportNestle 2013 creating shared value report
Nestle 2013 creating shared value report
 
SB11 - Kendall Jackson - Robert Boller
SB11 - Kendall Jackson - Robert Boller SB11 - Kendall Jackson - Robert Boller
SB11 - Kendall Jackson - Robert Boller
 
Csv 102012 Final
Csv 102012 FinalCsv 102012 Final
Csv 102012 Final
 
Cost accounting brownies basket with cost sheet
Cost accounting brownies basket with cost sheetCost accounting brownies basket with cost sheet
Cost accounting brownies basket with cost sheet
 
Nestle financial report analysis 2013 & 2014
Nestle financial report analysis 2013 & 2014Nestle financial report analysis 2013 & 2014
Nestle financial report analysis 2013 & 2014
 
Analysis Of Annual Report Nestle
Analysis Of Annual Report NestleAnalysis Of Annual Report Nestle
Analysis Of Annual Report Nestle
 
Nestle assignment
Nestle assignmentNestle assignment
Nestle assignment
 
Project report on marketing mix and competitive analysis of pureit hul
Project report on marketing mix and competitive analysis of pureit hulProject report on marketing mix and competitive analysis of pureit hul
Project report on marketing mix and competitive analysis of pureit hul
 
Project report on Hindustan Unilever Product - Pure-it
Project report on Hindustan Unilever Product - Pure-itProject report on Hindustan Unilever Product - Pure-it
Project report on Hindustan Unilever Product - Pure-it
 
Nestlé Case Study
Nestlé Case StudyNestlé Case Study
Nestlé Case Study
 
Nestle final project
Nestle final projectNestle final project
Nestle final project
 
STRATEGIC MANAGEMENT - NESTLE COMPANY
STRATEGIC MANAGEMENT - NESTLE COMPANYSTRATEGIC MANAGEMENT - NESTLE COMPANY
STRATEGIC MANAGEMENT - NESTLE COMPANY
 

Similar to Nestle Creating Shared Value Report 2014

Embraer-RA16.pdf - relatorio anual das atividades
Embraer-RA16.pdf - relatorio anual das atividadesEmbraer-RA16.pdf - relatorio anual das atividades
Embraer-RA16.pdf - relatorio anual das atividades
VICTORMBEBE
 
(Ximb)sustainability compressor industry
(Ximb)sustainability compressor industry(Ximb)sustainability compressor industry
(Ximb)sustainability compressor industry
SustainabilityXIMB
 
2020-12-10 EC - PEF for SMEs.pdf
2020-12-10 EC - PEF for SMEs.pdf2020-12-10 EC - PEF for SMEs.pdf
2020-12-10 EC - PEF for SMEs.pdf
Anna Zhenova
 
Bioenergy "Strategy" in Brazil
Bioenergy "Strategy" in BrazilBioenergy "Strategy" in Brazil
Bioenergy "Strategy" in Brazil
Antonio Geraldo de Paula Oliveira
 
Daniel Dussaux
Daniel Dussaux Daniel Dussaux
Daniel Dussaux
Structuralpolicyanalysis
 
Environmental Stewards of Capitalism
Environmental Stewards of Capitalism Environmental Stewards of Capitalism
Environmental Stewards of Capitalism
Dane Thompson
 
Upl ru2 qfy2011-261010
Upl ru2 qfy2011-261010Upl ru2 qfy2011-261010
Upl ru2 qfy2011-261010Angel Broking
 
BASF 2013 Sustainability Report
BASF 2013 Sustainability ReportBASF 2013 Sustainability Report
BASF 2013 Sustainability Report
Sustainable Brands
 
Presentation 1Q16 - CPFL Energia
Presentation 1Q16 - CPFL EnergiaPresentation 1Q16 - CPFL Energia
Presentation 1Q16 - CPFL Energia
CPFL RI
 
Apresentação 3 t15_master_inglês
Apresentação 3 t15_master_inglêsApresentação 3 t15_master_inglês
Apresentação 3 t15_master_inglês
CPFL RI
 
The future of food agriculture - FAO / United Nations
The future of food agriculture - FAO / United NationsThe future of food agriculture - FAO / United Nations
The future of food agriculture - FAO / United Nations
TheFoodChallenge
 
II BTG Pactual Utilities Days
II BTG Pactual Utilities DaysII BTG Pactual Utilities Days
II BTG Pactual Utilities DaysCPFL RI
 
2023-11-30-JP-Morgan-Brazil-Opportunities-Conference-2023.pdf
2023-11-30-JP-Morgan-Brazil-Opportunities-Conference-2023.pdf2023-11-30-JP-Morgan-Brazil-Opportunities-Conference-2023.pdf
2023-11-30-JP-Morgan-Brazil-Opportunities-Conference-2023.pdf
MarcelAndrade32
 
Presentation 3Q15 - CPFL Energia
Presentation 3Q15 - CPFL EnergiaPresentation 3Q15 - CPFL Energia
Presentation 3Q15 - CPFL Energia
CPFL RI
 
DEMYSTIFYING CLIMATE TRANSITION SCENARIOS - Ryan Whisnant
DEMYSTIFYING CLIMATE TRANSITION SCENARIOS - Ryan WhisnantDEMYSTIFYING CLIMATE TRANSITION SCENARIOS - Ryan Whisnant
DEMYSTIFYING CLIMATE TRANSITION SCENARIOS - Ryan Whisnant
GreenBiz Group
 
Manual on material_flow_cost_accounting_iso 14051-2014
Manual on material_flow_cost_accounting_iso 14051-2014Manual on material_flow_cost_accounting_iso 14051-2014
Manual on material_flow_cost_accounting_iso 14051-2014
zubeditufail
 
Apresentação de resultados 4 q12 eng final v02
Apresentação de resultados 4 q12 eng final v02Apresentação de resultados 4 q12 eng final v02
Apresentação de resultados 4 q12 eng final v02vigor_ri
 
Elringklinger - Conference Call Q1 2014 Presentation
Elringklinger - Conference Call Q1 2014 Presentation Elringklinger - Conference Call Q1 2014 Presentation
Elringklinger - Conference Call Q1 2014 Presentation Company Spotlight
 
Circular economys frontier of knowledge Nabil Nasr wcef2018
Circular economys frontier of knowledge Nabil Nasr wcef2018Circular economys frontier of knowledge Nabil Nasr wcef2018
Circular economys frontier of knowledge Nabil Nasr wcef2018
WorldCircularEconomyForum2018
 

Similar to Nestle Creating Shared Value Report 2014 (20)

Embraer-RA16.pdf - relatorio anual das atividades
Embraer-RA16.pdf - relatorio anual das atividadesEmbraer-RA16.pdf - relatorio anual das atividades
Embraer-RA16.pdf - relatorio anual das atividades
 
Nestlé Nigeria 2014 CSV Report
Nestlé Nigeria 2014 CSV ReportNestlé Nigeria 2014 CSV Report
Nestlé Nigeria 2014 CSV Report
 
(Ximb)sustainability compressor industry
(Ximb)sustainability compressor industry(Ximb)sustainability compressor industry
(Ximb)sustainability compressor industry
 
2020-12-10 EC - PEF for SMEs.pdf
2020-12-10 EC - PEF for SMEs.pdf2020-12-10 EC - PEF for SMEs.pdf
2020-12-10 EC - PEF for SMEs.pdf
 
Bioenergy "Strategy" in Brazil
Bioenergy "Strategy" in BrazilBioenergy "Strategy" in Brazil
Bioenergy "Strategy" in Brazil
 
Daniel Dussaux
Daniel Dussaux Daniel Dussaux
Daniel Dussaux
 
Environmental Stewards of Capitalism
Environmental Stewards of Capitalism Environmental Stewards of Capitalism
Environmental Stewards of Capitalism
 
Upl ru2 qfy2011-261010
Upl ru2 qfy2011-261010Upl ru2 qfy2011-261010
Upl ru2 qfy2011-261010
 
BASF 2013 Sustainability Report
BASF 2013 Sustainability ReportBASF 2013 Sustainability Report
BASF 2013 Sustainability Report
 
Presentation 1Q16 - CPFL Energia
Presentation 1Q16 - CPFL EnergiaPresentation 1Q16 - CPFL Energia
Presentation 1Q16 - CPFL Energia
 
Apresentação 3 t15_master_inglês
Apresentação 3 t15_master_inglêsApresentação 3 t15_master_inglês
Apresentação 3 t15_master_inglês
 
The future of food agriculture - FAO / United Nations
The future of food agriculture - FAO / United NationsThe future of food agriculture - FAO / United Nations
The future of food agriculture - FAO / United Nations
 
II BTG Pactual Utilities Days
II BTG Pactual Utilities DaysII BTG Pactual Utilities Days
II BTG Pactual Utilities Days
 
2023-11-30-JP-Morgan-Brazil-Opportunities-Conference-2023.pdf
2023-11-30-JP-Morgan-Brazil-Opportunities-Conference-2023.pdf2023-11-30-JP-Morgan-Brazil-Opportunities-Conference-2023.pdf
2023-11-30-JP-Morgan-Brazil-Opportunities-Conference-2023.pdf
 
Presentation 3Q15 - CPFL Energia
Presentation 3Q15 - CPFL EnergiaPresentation 3Q15 - CPFL Energia
Presentation 3Q15 - CPFL Energia
 
DEMYSTIFYING CLIMATE TRANSITION SCENARIOS - Ryan Whisnant
DEMYSTIFYING CLIMATE TRANSITION SCENARIOS - Ryan WhisnantDEMYSTIFYING CLIMATE TRANSITION SCENARIOS - Ryan Whisnant
DEMYSTIFYING CLIMATE TRANSITION SCENARIOS - Ryan Whisnant
 
Manual on material_flow_cost_accounting_iso 14051-2014
Manual on material_flow_cost_accounting_iso 14051-2014Manual on material_flow_cost_accounting_iso 14051-2014
Manual on material_flow_cost_accounting_iso 14051-2014
 
Apresentação de resultados 4 q12 eng final v02
Apresentação de resultados 4 q12 eng final v02Apresentação de resultados 4 q12 eng final v02
Apresentação de resultados 4 q12 eng final v02
 
Elringklinger - Conference Call Q1 2014 Presentation
Elringklinger - Conference Call Q1 2014 Presentation Elringklinger - Conference Call Q1 2014 Presentation
Elringklinger - Conference Call Q1 2014 Presentation
 
Circular economys frontier of knowledge Nabil Nasr wcef2018
Circular economys frontier of knowledge Nabil Nasr wcef2018Circular economys frontier of knowledge Nabil Nasr wcef2018
Circular economys frontier of knowledge Nabil Nasr wcef2018
 

More from Sustainable Brands

How a Breakthrough Product Portfolio Assessment is Changing Business Strategy...
How a Breakthrough Product Portfolio Assessment is Changing Business Strategy...How a Breakthrough Product Portfolio Assessment is Changing Business Strategy...
How a Breakthrough Product Portfolio Assessment is Changing Business Strategy...
Sustainable Brands
 
The Crucial Role of Structuring and Executing Innovative Partnerships in Brin...
The Crucial Role of Structuring and Executing Innovative Partnerships in Brin...The Crucial Role of Structuring and Executing Innovative Partnerships in Brin...
The Crucial Role of Structuring and Executing Innovative Partnerships in Brin...
Sustainable Brands
 
Building Harmony: How to Champion Sustainability from Grain to Biscuit
Building Harmony: How to Champion Sustainability from Grain to BiscuitBuilding Harmony: How to Champion Sustainability from Grain to Biscuit
Building Harmony: How to Champion Sustainability from Grain to Biscuit
Sustainable Brands
 
Tackling Systemic Problems and Shifting Entire Product Categories through Mul...
Tackling Systemic Problems and Shifting Entire Product Categories through Mul...Tackling Systemic Problems and Shifting Entire Product Categories through Mul...
Tackling Systemic Problems and Shifting Entire Product Categories through Mul...
Sustainable Brands
 
Market Insights from Top Researchers: The Latest Intelligence on Customer Att...
Market Insights from Top Researchers: The Latest Intelligence on Customer Att...Market Insights from Top Researchers: The Latest Intelligence on Customer Att...
Market Insights from Top Researchers: The Latest Intelligence on Customer Att...
Sustainable Brands
 
New Tactics in Contextual Promotion of Healthy Lifestyles
New Tactics in Contextual Promotion of Healthy LifestylesNew Tactics in Contextual Promotion of Healthy Lifestyles
New Tactics in Contextual Promotion of Healthy Lifestyles
Sustainable Brands
 
Green Giants: What Underlies the Success of the World’s First Billion-Dollar ...
Green Giants: What Underlies the Success of the World’s First Billion-Dollar ...Green Giants: What Underlies the Success of the World’s First Billion-Dollar ...
Green Giants: What Underlies the Success of the World’s First Billion-Dollar ...
Sustainable Brands
 
Enabling Responsible Consumption Globally: Local Partnerships Driving a Respo...
Enabling Responsible Consumption Globally: Local Partnerships Driving a Respo...Enabling Responsible Consumption Globally: Local Partnerships Driving a Respo...
Enabling Responsible Consumption Globally: Local Partnerships Driving a Respo...
Sustainable Brands
 
Sustainable Living Brands: Why Purpose Alone is Not Enough to Drive Sustainab...
Sustainable Living Brands: Why Purpose Alone is Not Enough to Drive Sustainab...Sustainable Living Brands: Why Purpose Alone is Not Enough to Drive Sustainab...
Sustainable Living Brands: Why Purpose Alone is Not Enough to Drive Sustainab...
Sustainable Brands
 
Surviving a Seismic Shift in Employee Attitudes: How HR, Sustainability and C...
Surviving a Seismic Shift in Employee Attitudes: How HR, Sustainability and C...Surviving a Seismic Shift in Employee Attitudes: How HR, Sustainability and C...
Surviving a Seismic Shift in Employee Attitudes: How HR, Sustainability and C...
Sustainable Brands
 
Leveraging the New UN Sustainable Development Goals: Expectations and Engagem...
Leveraging the New UN Sustainable Development Goals: Expectations and Engagem...Leveraging the New UN Sustainable Development Goals: Expectations and Engagem...
Leveraging the New UN Sustainable Development Goals: Expectations and Engagem...
Sustainable Brands
 
The Rise of Bio-Materials and Bio-Products: Current State of Play, Likely Fut...
The Rise of Bio-Materials and Bio-Products: Current State of Play, Likely Fut...The Rise of Bio-Materials and Bio-Products: Current State of Play, Likely Fut...
The Rise of Bio-Materials and Bio-Products: Current State of Play, Likely Fut...
Sustainable Brands
 
Leveraging the New UN Sustainable Development Goals: Expectations and Engagem...
Leveraging the New UN Sustainable Development Goals: Expectations and Engagem...Leveraging the New UN Sustainable Development Goals: Expectations and Engagem...
Leveraging the New UN Sustainable Development Goals: Expectations and Engagem...
Sustainable Brands
 
Leveraging the New UN Sustainable Development Goals: Expectations and Engagem...
Leveraging the New UN Sustainable Development Goals: Expectations and Engagem...Leveraging the New UN Sustainable Development Goals: Expectations and Engagem...
Leveraging the New UN Sustainable Development Goals: Expectations and Engagem...
Sustainable Brands
 
Building Brand Value through Upcycling: How Creativity, Marketing and Social ...
Building Brand Value through Upcycling: How Creativity, Marketing and Social ...Building Brand Value through Upcycling: How Creativity, Marketing and Social ...
Building Brand Value through Upcycling: How Creativity, Marketing and Social ...
Sustainable Brands
 

More from Sustainable Brands (20)

How a Breakthrough Product Portfolio Assessment is Changing Business Strategy...
How a Breakthrough Product Portfolio Assessment is Changing Business Strategy...How a Breakthrough Product Portfolio Assessment is Changing Business Strategy...
How a Breakthrough Product Portfolio Assessment is Changing Business Strategy...
 
The Crucial Role of Structuring and Executing Innovative Partnerships in Brin...
The Crucial Role of Structuring and Executing Innovative Partnerships in Brin...The Crucial Role of Structuring and Executing Innovative Partnerships in Brin...
The Crucial Role of Structuring and Executing Innovative Partnerships in Brin...
 
Building Harmony: How to Champion Sustainability from Grain to Biscuit
Building Harmony: How to Champion Sustainability from Grain to BiscuitBuilding Harmony: How to Champion Sustainability from Grain to Biscuit
Building Harmony: How to Champion Sustainability from Grain to Biscuit
 
Tackling Systemic Problems and Shifting Entire Product Categories through Mul...
Tackling Systemic Problems and Shifting Entire Product Categories through Mul...Tackling Systemic Problems and Shifting Entire Product Categories through Mul...
Tackling Systemic Problems and Shifting Entire Product Categories through Mul...
 
Market Insights from Top Researchers: The Latest Intelligence on Customer Att...
Market Insights from Top Researchers: The Latest Intelligence on Customer Att...Market Insights from Top Researchers: The Latest Intelligence on Customer Att...
Market Insights from Top Researchers: The Latest Intelligence on Customer Att...
 
Market Insights from Top Researchers: The Latest Intelligence on Customer Att...
Market Insights from Top Researchers: The Latest Intelligence on Customer Att...Market Insights from Top Researchers: The Latest Intelligence on Customer Att...
Market Insights from Top Researchers: The Latest Intelligence on Customer Att...
 
New Tactics in Contextual Promotion of Healthy Lifestyles
New Tactics in Contextual Promotion of Healthy LifestylesNew Tactics in Contextual Promotion of Healthy Lifestyles
New Tactics in Contextual Promotion of Healthy Lifestyles
 
Green Giants: What Underlies the Success of the World’s First Billion-Dollar ...
Green Giants: What Underlies the Success of the World’s First Billion-Dollar ...Green Giants: What Underlies the Success of the World’s First Billion-Dollar ...
Green Giants: What Underlies the Success of the World’s First Billion-Dollar ...
 
Enabling Responsible Consumption Globally: Local Partnerships Driving a Respo...
Enabling Responsible Consumption Globally: Local Partnerships Driving a Respo...Enabling Responsible Consumption Globally: Local Partnerships Driving a Respo...
Enabling Responsible Consumption Globally: Local Partnerships Driving a Respo...
 
Sustainable Living Brands: Why Purpose Alone is Not Enough to Drive Sustainab...
Sustainable Living Brands: Why Purpose Alone is Not Enough to Drive Sustainab...Sustainable Living Brands: Why Purpose Alone is Not Enough to Drive Sustainab...
Sustainable Living Brands: Why Purpose Alone is Not Enough to Drive Sustainab...
 
Surviving a Seismic Shift in Employee Attitudes: How HR, Sustainability and C...
Surviving a Seismic Shift in Employee Attitudes: How HR, Sustainability and C...Surviving a Seismic Shift in Employee Attitudes: How HR, Sustainability and C...
Surviving a Seismic Shift in Employee Attitudes: How HR, Sustainability and C...
 
Leveraging the New UN Sustainable Development Goals: Expectations and Engagem...
Leveraging the New UN Sustainable Development Goals: Expectations and Engagem...Leveraging the New UN Sustainable Development Goals: Expectations and Engagem...
Leveraging the New UN Sustainable Development Goals: Expectations and Engagem...
 
Leveraging the New UN Sustainable Development Goals: Expectations and Engagem...
Leveraging the New UN Sustainable Development Goals: Expectations and Engagem...Leveraging the New UN Sustainable Development Goals: Expectations and Engagem...
Leveraging the New UN Sustainable Development Goals: Expectations and Engagem...
 
The Rise of Bio-Materials and Bio-Products: Current State of Play, Likely Fut...
The Rise of Bio-Materials and Bio-Products: Current State of Play, Likely Fut...The Rise of Bio-Materials and Bio-Products: Current State of Play, Likely Fut...
The Rise of Bio-Materials and Bio-Products: Current State of Play, Likely Fut...
 
Leveraging the New UN Sustainable Development Goals: Expectations and Engagem...
Leveraging the New UN Sustainable Development Goals: Expectations and Engagem...Leveraging the New UN Sustainable Development Goals: Expectations and Engagem...
Leveraging the New UN Sustainable Development Goals: Expectations and Engagem...
 
Leveraging the New UN Sustainable Development Goals: Expectations and Engagem...
Leveraging the New UN Sustainable Development Goals: Expectations and Engagem...Leveraging the New UN Sustainable Development Goals: Expectations and Engagem...
Leveraging the New UN Sustainable Development Goals: Expectations and Engagem...
 
Building Brand Value through Upcycling: How Creativity, Marketing and Social ...
Building Brand Value through Upcycling: How Creativity, Marketing and Social ...Building Brand Value through Upcycling: How Creativity, Marketing and Social ...
Building Brand Value through Upcycling: How Creativity, Marketing and Social ...
 

Recently uploaded

Maksym Vyshnivetskyi: PMO Quality Management (UA)
Maksym Vyshnivetskyi: PMO Quality Management (UA)Maksym Vyshnivetskyi: PMO Quality Management (UA)
Maksym Vyshnivetskyi: PMO Quality Management (UA)
Lviv Startup Club
 
Premium MEAN Stack Development Solutions for Modern Businesses
Premium MEAN Stack Development Solutions for Modern BusinessesPremium MEAN Stack Development Solutions for Modern Businesses
Premium MEAN Stack Development Solutions for Modern Businesses
SynapseIndia
 
Digital Transformation and IT Strategy Toolkit and Templates
Digital Transformation and IT Strategy Toolkit and TemplatesDigital Transformation and IT Strategy Toolkit and Templates
Digital Transformation and IT Strategy Toolkit and Templates
Aurelien Domont, MBA
 
Creative Web Design Company in Singapore
Creative Web Design Company in SingaporeCreative Web Design Company in Singapore
Creative Web Design Company in Singapore
techboxsqauremedia
 
The Influence of Marketing Strategy and Market Competition on Business Perfor...
The Influence of Marketing Strategy and Market Competition on Business Perfor...The Influence of Marketing Strategy and Market Competition on Business Perfor...
The Influence of Marketing Strategy and Market Competition on Business Perfor...
Adam Smith
 
FIA officials brutally tortured innocent and snatched 200 Bitcoins of worth 4...
FIA officials brutally tortured innocent and snatched 200 Bitcoins of worth 4...FIA officials brutally tortured innocent and snatched 200 Bitcoins of worth 4...
FIA officials brutally tortured innocent and snatched 200 Bitcoins of worth 4...
jamalseoexpert1978
 
The Influence of Marketing Strategy and Market Competition on Business Perfor...
The Influence of Marketing Strategy and Market Competition on Business Perfor...The Influence of Marketing Strategy and Market Competition on Business Perfor...
The Influence of Marketing Strategy and Market Competition on Business Perfor...
Adam Smith
 
Discover the innovative and creative projects that highlight my journey throu...
Discover the innovative and creative projects that highlight my journey throu...Discover the innovative and creative projects that highlight my journey throu...
Discover the innovative and creative projects that highlight my journey throu...
dylandmeas
 
Mastering B2B Payments Webinar from BlueSnap
Mastering B2B Payments Webinar from BlueSnapMastering B2B Payments Webinar from BlueSnap
Mastering B2B Payments Webinar from BlueSnap
Norma Mushkat Gaffin
 
amptalk_RecruitingDeck_english_2024.06.05
amptalk_RecruitingDeck_english_2024.06.05amptalk_RecruitingDeck_english_2024.06.05
amptalk_RecruitingDeck_english_2024.06.05
marketing317746
 
Observation Lab PowerPoint Assignment for TEM 431
Observation Lab PowerPoint Assignment for TEM 431Observation Lab PowerPoint Assignment for TEM 431
Observation Lab PowerPoint Assignment for TEM 431
ecamare2
 
The Influence of Marketing Strategy and Market Competition on Business Perfor...
The Influence of Marketing Strategy and Market Competition on Business Perfor...The Influence of Marketing Strategy and Market Competition on Business Perfor...
The Influence of Marketing Strategy and Market Competition on Business Perfor...
Adam Smith
 
Company Valuation webinar series - Tuesday, 4 June 2024
Company Valuation webinar series - Tuesday, 4 June 2024Company Valuation webinar series - Tuesday, 4 June 2024
Company Valuation webinar series - Tuesday, 4 June 2024
FelixPerez547899
 
Anny Serafina Love - Letter of Recommendation by Kellen Harkins, MS.
Anny Serafina Love - Letter of Recommendation by Kellen Harkins, MS.Anny Serafina Love - Letter of Recommendation by Kellen Harkins, MS.
Anny Serafina Love - Letter of Recommendation by Kellen Harkins, MS.
AnnySerafinaLove
 
Recruiting in the Digital Age: A Social Media Masterclass
Recruiting in the Digital Age: A Social Media MasterclassRecruiting in the Digital Age: A Social Media Masterclass
Recruiting in the Digital Age: A Social Media Masterclass
LuanWise
 
Exploring Patterns of Connection with Social Dreaming
Exploring Patterns of Connection with Social DreamingExploring Patterns of Connection with Social Dreaming
Exploring Patterns of Connection with Social Dreaming
Nicola Wreford-Howard
 
BeMetals Investor Presentation_June 1, 2024.pdf
BeMetals Investor Presentation_June 1, 2024.pdfBeMetals Investor Presentation_June 1, 2024.pdf
BeMetals Investor Presentation_June 1, 2024.pdf
DerekIwanaka1
 
buy old yahoo accounts buy yahoo accounts
buy old yahoo accounts buy yahoo accountsbuy old yahoo accounts buy yahoo accounts
buy old yahoo accounts buy yahoo accounts
Susan Laney
 
Tata Group Dials Taiwan for Its Chipmaking Ambition in Gujarat’s Dholera
Tata Group Dials Taiwan for Its Chipmaking Ambition in Gujarat’s DholeraTata Group Dials Taiwan for Its Chipmaking Ambition in Gujarat’s Dholera
Tata Group Dials Taiwan for Its Chipmaking Ambition in Gujarat’s Dholera
Avirahi City Dholera
 
Agency Managed Advisory Board As a Solution To Career Path Defining Business ...
Agency Managed Advisory Board As a Solution To Career Path Defining Business ...Agency Managed Advisory Board As a Solution To Career Path Defining Business ...
Agency Managed Advisory Board As a Solution To Career Path Defining Business ...
Boris Ziegler
 

Recently uploaded (20)

Maksym Vyshnivetskyi: PMO Quality Management (UA)
Maksym Vyshnivetskyi: PMO Quality Management (UA)Maksym Vyshnivetskyi: PMO Quality Management (UA)
Maksym Vyshnivetskyi: PMO Quality Management (UA)
 
Premium MEAN Stack Development Solutions for Modern Businesses
Premium MEAN Stack Development Solutions for Modern BusinessesPremium MEAN Stack Development Solutions for Modern Businesses
Premium MEAN Stack Development Solutions for Modern Businesses
 
Digital Transformation and IT Strategy Toolkit and Templates
Digital Transformation and IT Strategy Toolkit and TemplatesDigital Transformation and IT Strategy Toolkit and Templates
Digital Transformation and IT Strategy Toolkit and Templates
 
Creative Web Design Company in Singapore
Creative Web Design Company in SingaporeCreative Web Design Company in Singapore
Creative Web Design Company in Singapore
 
The Influence of Marketing Strategy and Market Competition on Business Perfor...
The Influence of Marketing Strategy and Market Competition on Business Perfor...The Influence of Marketing Strategy and Market Competition on Business Perfor...
The Influence of Marketing Strategy and Market Competition on Business Perfor...
 
FIA officials brutally tortured innocent and snatched 200 Bitcoins of worth 4...
FIA officials brutally tortured innocent and snatched 200 Bitcoins of worth 4...FIA officials brutally tortured innocent and snatched 200 Bitcoins of worth 4...
FIA officials brutally tortured innocent and snatched 200 Bitcoins of worth 4...
 
The Influence of Marketing Strategy and Market Competition on Business Perfor...
The Influence of Marketing Strategy and Market Competition on Business Perfor...The Influence of Marketing Strategy and Market Competition on Business Perfor...
The Influence of Marketing Strategy and Market Competition on Business Perfor...
 
Discover the innovative and creative projects that highlight my journey throu...
Discover the innovative and creative projects that highlight my journey throu...Discover the innovative and creative projects that highlight my journey throu...
Discover the innovative and creative projects that highlight my journey throu...
 
Mastering B2B Payments Webinar from BlueSnap
Mastering B2B Payments Webinar from BlueSnapMastering B2B Payments Webinar from BlueSnap
Mastering B2B Payments Webinar from BlueSnap
 
amptalk_RecruitingDeck_english_2024.06.05
amptalk_RecruitingDeck_english_2024.06.05amptalk_RecruitingDeck_english_2024.06.05
amptalk_RecruitingDeck_english_2024.06.05
 
Observation Lab PowerPoint Assignment for TEM 431
Observation Lab PowerPoint Assignment for TEM 431Observation Lab PowerPoint Assignment for TEM 431
Observation Lab PowerPoint Assignment for TEM 431
 
The Influence of Marketing Strategy and Market Competition on Business Perfor...
The Influence of Marketing Strategy and Market Competition on Business Perfor...The Influence of Marketing Strategy and Market Competition on Business Perfor...
The Influence of Marketing Strategy and Market Competition on Business Perfor...
 
Company Valuation webinar series - Tuesday, 4 June 2024
Company Valuation webinar series - Tuesday, 4 June 2024Company Valuation webinar series - Tuesday, 4 June 2024
Company Valuation webinar series - Tuesday, 4 June 2024
 
Anny Serafina Love - Letter of Recommendation by Kellen Harkins, MS.
Anny Serafina Love - Letter of Recommendation by Kellen Harkins, MS.Anny Serafina Love - Letter of Recommendation by Kellen Harkins, MS.
Anny Serafina Love - Letter of Recommendation by Kellen Harkins, MS.
 
Recruiting in the Digital Age: A Social Media Masterclass
Recruiting in the Digital Age: A Social Media MasterclassRecruiting in the Digital Age: A Social Media Masterclass
Recruiting in the Digital Age: A Social Media Masterclass
 
Exploring Patterns of Connection with Social Dreaming
Exploring Patterns of Connection with Social DreamingExploring Patterns of Connection with Social Dreaming
Exploring Patterns of Connection with Social Dreaming
 
BeMetals Investor Presentation_June 1, 2024.pdf
BeMetals Investor Presentation_June 1, 2024.pdfBeMetals Investor Presentation_June 1, 2024.pdf
BeMetals Investor Presentation_June 1, 2024.pdf
 
buy old yahoo accounts buy yahoo accounts
buy old yahoo accounts buy yahoo accountsbuy old yahoo accounts buy yahoo accounts
buy old yahoo accounts buy yahoo accounts
 
Tata Group Dials Taiwan for Its Chipmaking Ambition in Gujarat’s Dholera
Tata Group Dials Taiwan for Its Chipmaking Ambition in Gujarat’s DholeraTata Group Dials Taiwan for Its Chipmaking Ambition in Gujarat’s Dholera
Tata Group Dials Taiwan for Its Chipmaking Ambition in Gujarat’s Dholera
 
Agency Managed Advisory Board As a Solution To Career Path Defining Business ...
Agency Managed Advisory Board As a Solution To Career Path Defining Business ...Agency Managed Advisory Board As a Solution To Career Path Defining Business ...
Agency Managed Advisory Board As a Solution To Career Path Defining Business ...
 

Nestle Creating Shared Value Report 2014

  • 1. Nestlé in society Creating Shared Value and meeting our commitments 2014
  • 2. Nestlé in society and Creating Shared Value key performance indicator GRI 2013 2014 Page Economic Total Group sales (CHF million) (a) G4-EC1 92 158 91 612 5 Net profit (CHF million) (b) G4-EC1 10 015 14 456 n/a Nutrition Products meeting or exceeding Nestlé Nutritional Foundation profiling criteria (as % of total sales) (c) G4-EC1 76.0 78.5 10,11,12 Renovated products for nutrition or health considerations (d) G4-FP7 7 789 10 812 10,11,12 Products with increase in nutritious ingredients or essential nutrients (d) G4-FP7 4 778 6 359 10 Products with reduction of sodium, sugars, trans fats, total fat, calories or artificial colourings (d) G4-FP6 4 221 6 973 11,12 Products analysed and improved or confirmed via 60/40+ programme (sales, CHF million) (e) G4-PR1 33 001 33 233 10,11,12 Products containing Branded Active Benefits (sales, CHF million) G4-FP7 6 836 6 687 10 Products featuring Nestlé Nutritional Compass labelling (% of sales worldwide) (f) G4-PR3 92.5 92.8 13 Products with Guideline Daily Amounts (GDA) labelling on front of pack (% of sales) (g) G4-PR3 99.3 79.7 13 Products with specific portion guidance (sales, CHF million) (h) G4-PR3 26 700 26 456 14 Popularly Positioned Product SKUs (i) G4-EC1 9 562 5 014 10 Popularly Positioned Products (sales, CHF million) G4-EC1 11 803 12 205 10 Nestlé television advertising to children under 12 in compliance with policies on responsible marketing (%) (j) G4-PR7 98.3 99.9 16 Contraventions to the Nestlé Policy and Instructions for Implementation of the WHO International Code of Marketing of Breast-milk Substitutes (k) G4-PR7 27 29 17 Infant formula marketing staff in higher-risk countries trained on the WHO Code (% of staff) (l) G4-PR6 100 100 17 Rural development Farmers trained through capacity-building programmes 300 000 376 000 18,20,21 Markets covered by Sustainable Agriculture Initiative Nestlé (SAIN) programmes 48 51 23,24 Direct procurement markets covered by SAIN programmes (%) 100 100 23,24 Percentage of suppliers that fully comply with the Nestlé Supplier Code G4-FP1 74.0 73.0 19 Percentage of purchased volume fully compliant with the Nestlé Supplier Code G4-FP1 92.0 95.0 19 Water (m) Total water withdrawal (million m3) G4-EN8 152 147 22 Total water withdrawal (m3 per tonne of product) G4-EN8 2.92 2.74 22 Environmental sustainability (m) Production volume Total production volume (million tonnes) 52.1 53.7 n/a Materials Raw materials used (million tonnes) (n) G4-EN1 25.1 25.8 n/a Materials for packaging purposes (million tonnes) (n) G4-EN1 5.7 5.6 26 Packaging source optimisation (kilotonnes saved) 66.6 45.8 26 Energy Total on-site energy consumption (petajoules) 97.7 95.8 26 Nestlé’s performance indicators provide a focus for measuring and reporting Creating Shared Value, sustainability and compliance. This performance summary forms part of our communication on progress for the United Nations Global Compact Principles. Unless otherwise stated, performance indicators are for the year ending 31 December 2014. The references in the GRI column relate to the applicable indicator from the Global Reporting Initiative G4 guidelines. We report against GRI G4 guidelines and indicators, in line with the material issues we need to address. The issues are identified through our stakeholder engagement process and they also shape the public commitments we have made. To provide transparency for our stakeholders, in this table we have indicated the correlation between GRI indicators, our KPIs and our commitments. Please see www.nestle.com/csv/2014/kpis 2014 performance summary
  • 3. (a) Does not include joint ventures. (b) Includes Nestlé’s share in net result of joint ventures. (c) 2014 assessment scope: 73.8% total Nestlé sales volume. We evaluate our products against the Nestlé Nutritional Foundation criteria, which are based on scientific and public health recommendations (WHO, Institute of Medicine (IOM) and others). (d) Based on reports of approximately 75% of worldwide product development teams. Products can have ‘less of’ one ingredient and ‘more of’ another at the same time. (e) In the 60/40 programme products are tested with consumer panels and at least 60 of the 100 people must prefer the Nestlé product over the competitor’s. This KPI reflects the dynamic nature of our 60/40+ programme. Assessment results are valid for a maximum of three years, only if all parameters remain equal. (f) Excludes total petcare and, for USA only, Dreyer’s and licensed brands Häagen-Dazs and California Pizza Kitchen. (g) 2014 figure is global. 2013 figure is EU 28 plus Switzerland, the Adriatic Region, Ukraine and Moldavia. Excludes plain coffee, tea and water, products for Nestlé Professional, gifting chocolate, seasonings, petcare, Nestlé Health Science and Nestlé Nutrition. (h) Products sold as single servings and meeting/exceeding Nestlé Nutritional Foundation OR sold with/via a device or equipment delivering a serving meeting/ exceeding Nestlé Nutritional Foundation OR sold to caregivers with detailed instructions on adjusting servings to evolving nutritional needs. This currently represents only a subset of the portfolio with portion guidance. (i) SKU count recalculated for increased accuracy and now only includes active SKUs. (j) The percentage reflects Nestlé’s full-year compliance to the stricter 35% children audience threshold as redefined in September 2011. (k) Based on internal and external audits. Internal audits are conducted by HQ-based auditors (Nestlé Group Audit) and country-based auditors (Nestlé Market Audit). External audits were conducted by Bureau Veritas. (l) We follow the FTSE4Good breast- milk substitute marketing criteria, which classify countries as ‘higher-risk’ if they have mortality rates for under-fives of more than ten per 1000, or more than 2% acute malnutrition among under- fives. All other countries are ‘lower-risk’. (m) Includes joint ventures. (n) 2013 data restated due to some of our large joint ventures reporting environmental data for the first time in 2013 but not having material consumption data available at the time. (o) Differences from 2013 due to correction of factory coordinates, clarification of PA boundaries and sale of three factories. (p) Covers Nestlé employees registered in the HR system (approximately 85% of all employees). (q) CARE, our global external audit programme, is conducted by three audit companies and verifies that all employees and sites we own or operate comply with local legislation, our Corporate Business Principles and Code of Business Conduct. The audits take place every three years. (r) Covers approximately 85% of all employees through a combination of manual submission from the markets and the training system. (s) Covers all Nestlé employees including joint ventures. Nestlé in society and Creating Shared Value key performance indicator GRI 2013 2014 Page Total on-site energy consumption (gigajoules per tonne of product) 1.87 1.78 26 Total on-site energy consumption from renewable sources (% total) G4-EN3 13.3 14.7 n/a Total direct energy consumption (petajoules) G4-EN3 67.1 65.5 26 Total direct energy consumption from renewable sources (% total direct) G4-EN3 10.8 11.3 n/a Total indirect energy consumption (petajoules) G4-EN4 81.5 81.1 26 Biodiversity Total size of manufacturing sites located in protected areas (hectares) (o) G4-EN11 32.9 18.8 28 Emissions, effluents and waste Direct GHG emissions (million tonnes CO2eq) G4-EN15 3.99 3.81 28 Direct GHG emissions (kg CO2eq per tonne of product) G4-EN15 76.0 71.0 28 Indirect GHG emissions (million tonnes CO2eq) G4-EN16 3.81 3.80 28 Indirect GHG emissions (kg CO2eq per tonne of product) G4-EN16 73.0 71.0 28 Total water discharge (million m3) G4-EN22 91.0 87.0 24 Total water discharge (m3 per tonne of product) G4-EN22 1.74 1.63 24 Average quality of water discharged (mg COD/l) G4-EN22 76.0 72.0 24 By-products (kg per tonne of product) G4-EN23 29.1 28.9 26 Waste for disposal (kg per tonne of product) G4-EN23 4.9 4.0 26 Environmental sustainability governance Manufacturing sites certified against ISO 14001 (% of total manufacturing sites) 91.0 92.0 n/a Human rights and compliance Total number of significant product recalls or incidents of non-compliance G4-PR2 10 12 n/a Number of human rights impact assessments completed G4-HR9 1 1 30 Number of employees trained on human rights 13 793 7 485 30 Our people Total workforce (number of employees) (a) 333 214 339 456 5 Total rate of new employee hires (%) (p) G4-LA1 10.7 10.3 n/a Total rate of employee turnover (%) (p) G4-LA1 11.1 11.7 n/a CARE gaps identified related to Business Integrity and HR (q) 146 32 32 Of which: Minor 130 32 32 Major 16 0 32 Critical 0 0 32 Lost-time injuries and illnesses rate (per million hours worked) (employees, on-site contractors and on-site members of public) (m) G4-LA6 2.34 2.35 33 Total recordable injuries and illnesses rate (per million hours worked) (employees, on-site contractors and on-site members of public) (m) G4-LA6 4.10 3.98 33 Total number of fatalities (employees, on-site contractors and on-site members of public) (m) G4-LA6 12 5 33 Average hours of training per year per employee per category (r) G4-LA9 23.0 28.8 35 Leadership positions held by women (%) (p) G4-LA12 31.1 33.7 33 Local Management Committee members native to country in developing countries (%) (s) G4-EC6 52.0 56.4 n/a
  • 4. Front cover Ramón Malé Calcó, from Spain, is a technical leader for the bottling line in the Nescafé Dolce Gusto factory in Schwerin, Germany. He is one of the 10 000 young people Nestlé plans to have hired across Europe by 2016 through the Nestlé needs YOUth programme. The initiative, which will also take on 10 000 trainees and apprentices aged below 30, is designed to attract the talented youth we will need to develop and grow our business. 2 A message from our Chairman and our CEO 4 Creating Shared Value at Nestlé 6 Summary of our commitments Nutrition 8 Find out how Nestlé’s focus on nutrition is helping to enhance quality of life for our consumers Rural development 18 Find out more about our work with farmers and in rural communities Water 22 Read about our new commitment on water stewardship and the objectives we will deliver Environmental sustainability 26 We are aiming to make our products better for the environment along the value chain Our people, human rights and compliance 30 We have started implementing action plans for our cocoa and hazelnut supply chains and continue to assess our impact on Human Rights 36 Stakeholder engagement 38 Materiality 40 Full commitments table Contents Corporate Governance Report 2014 Compensation Report 2014 Financial Statements 2014 Annual Report 2014 Accompanying reports Corporate Governance Report 2014 Compensation Report 2014 Financial Statements 2014 Nestlé–CorporateGovernanceReport2014|CompensationReport2014|FinancialStatements2014 Annual Report 2014 Nestlé–AnnualReport2014
  • 5. 98% of our children’s products met all of the Nestlé Nutritional Foundation criteria 1 for children at the end of 2014. 73 Our Healthy Kids Global Programme reached more than 7.6 million children in 73 countries in 2014. Top 3 We are ranked one of the top 3 global food and beverage manufacturers in the current Access to Nutrition Index. 73% We audited 8700 of our 10 000 Tier 1 suppliers and found 73% fully complied with our Supplier Code. 38% Volume of high-priority categories of raw material that are traceable back to the primary source. 52% Water discharges per tonne of product cut by 52% since 2005. Leader We were ranked number one by the charity Oxfam in its 2014 scorecard, Behind the Brands. The survey scored 10 food and beverage companies on their efforts to improve food security. FTSE4Good We remain the only infant formula manufacturer included in FTSE’s responsible investment index, based on our performance in human rights, labour rights, responsible marketing of breast-milk substitutes and more. 11 832 Nestlé needs YOUth helped 11 832 young people in Europe find work or apprenticeship opportunities in 2014. 26% Energy consumption per tonne of product cut by 26% since 2005. 12 458 farmers sensitised on child labour issues in 2014. 72 factories achieving zero waste for disposal in 2014. 1 The Nestlé Nutritional Foundation criteria are based on nutrition science and public health dietary recommendations, such as those of the World Health Organization (WHO), the Institute of Medicine and other global or local authorities. Our products are evaluated against these criteria, using the Nestlé Nutritional Profiling System, which determines their nutritional value and whether they achieve the Nestlé Nutritional Foundation status. Highlights 2014 1
  • 6. We are pleased to share our 2014 Creating Shared Value Report including an assessment of the chal­ lenges we face and the real progress we have made in meeting our societal commitments. This report ­underlines our firm belief that for a company to pros- per over the long term and create value for share­ holders, it must create value for society at the same time. Each and every commitment is based on our own convictions, not convenience. Respect, for peo- ple, different cultures, the environment and for the ­future of the world we live in, is the foundation of ­Creating Shared Value. These commitments serve both external and internal pur- poses. They have helped frame our external communications but, equally importantly, they guide our management and all of us at Nestlé across Business Units, Zones and Markets in our collective efforts to reach these specific objectives. They also take into account the views of our stakeholders. We meet regularly with NGOs, academics, multilateral agencies, ­governments and others to listen and learn from their criti- cisms and encouragement. Our efforts are strengthened by this dialogue. Our shareholders also guide us with insightful questions about these societal commitments and how they strengthen our business. This we can explain. Our ambition to be the leading Nutrition, Health and Wellness company is at the heart of our corporate strategy and what we live for as a company. We care deeply about people’s health and well- ness, and are investing for the future through our network of research centres, the Nestlé Institute of Health Sciences, Nestlé Health Science and the new Nestlé Skin Health. A deep understanding of nutrition, and access to tastier and healthier food and beverages, is what our consumers ­demand and what society needs. Water too is an essential part of good nutrition and, at the same time, a human right and the linchpin of food security. We actively promote healthy hydration at all ages while mak- ing every effort to reduce water use in our own operations and advocating for inclusion of a specific goal on water in the post-2015 development agenda. Our new Cero Agua factory in Mexico, a dairy factory with a positive water impact, exem- plifies our commitment to reducing water use in our own operations and how we embrace new technologies and Peter Brabeck-Letmathe speaking at the 2014 CSV Forum Peter Brabeck-Letmathe (Chairman, Nestlé) welcoming guests from government, academia, civil society and business to the 6th Creating Shared Value Forum in Switzerland, which was co-hosted with the United Nations Conference on Trade and Development. Paul Bulcke visiting the Food Safety Institute in Beijing Paul Bulcke (CEO, Nestlé) visiting Beijing in March 2014, to open the Nestlé Food Safety Institute, which works with authorities to help provide the scientific foundation for food safety policies and standards. A message from our Chairman and our CEO Nestlé in society2
  • 7. ­innovative ways to achieve this goal. Water is a business op- portunity, an operational challenge and a societal issue that is of deep concern to us all. As we have said many times, we will run out of water long before we run out of oil. Likewise, rural development and our work with farmers combined with our Responsible Sourcing Guideline help ad- dress the need to build sustainable farming communities, but also to answer our own consumers’ demands to know ‘where does my food come from?’ Our rural development work helps secure the quality and quantity of supply of our key categories and increase the attractiveness of farming for future generations. We continue to actively manage our commitments to en- vironmental and social sustainability, necessary for operating our factories and for the sustainable growth and develop- ment of the communities and countries where we operate. Our commitment to youth employment, called the Nestlé needs YOUth Initiative, helps strengthen and develop the skills and employability of young people across Europe. This programme will soon be extended globally. At Nestlé, Creating Shared Value is the way we do busi- ness and it is embedded in our holistic management think- ing. Integrating business opportunity and societal need is what we expect of our leaders and employees. Internal man- agement tools help facilitate this process, such as a strategic portfolio tool that assesses our brands against financial and nutrition targets, a capital expenditure process that includes societal indicators, and a Rural Development Framework which digs deep into the needs of cocoa, coffee and dairy farmers and farming communities, helping us to better target our efforts and investments. Our challenge is to find a con- sistent method of measuring the business value of Creating Shared Value as well as to assess societal impacts and not just activities. We will continue to develop our thinking on this during 2015. Join us on our Creating Shared Value journey which fo- cuses business on the long term where the success of soci- ety and economic activity are intimately intertwined and mutually reinforcing. It should also lead to more effective, collective action to address some of society’s deepest con- cerns and challenges. Better dialogue, engagement and part- nerships are required if we are to help address the ‘double burden’ of malnutrition, water scarcity, sustainable farming, climate change, human rights and more. This year, again, we have introduced some new commit- ments in the areas of responsible marketing to children, anti- corruption and internal and external grievance mechanisms. With this report, we also restate our support for the UN Global Compact, as a founding member of the UN Global Compact Lead – an important platform for corporate sustainability lead- ership. We look forward to your feedback on our commit- ments and on this report. Peter Brabeck-Letmathe Chairman Paul Bulcke Chief Executive Officer 3
  • 8. Nestlé has grown from a company founded nearly 150 years ago on the success of a life-saving infant ­cereal to a global leader in Nutrition, Health and Well- ness. Our growth has enabled us to help improve the lives of millions of people – through the products and services we provide and through employment, our supplier networks and the contribution we make to economies around the world. 4.1 million families earn a living because of Nestlé, including many rural small- holders in developing countries. In 2014, we support- ed the livelihoods of 695 000 farmers and directly em- ployed 339 456  people. Our total group salaries and social welfare expenses were ­almost CHF  16  billion and we paid corporate taxes of CHF 2859 million. We see this value creation as a basic requirement for suc- cessful business, but it doesn’t stop there. Being a global leader brings not only a duty to operate responsibly, but also an opportunity to create long-term positive value for society. We call this Creating Shared Value, and we embed it firmly in our holistic management thinking across all parts of our business. Our ambition is to be the leading Nutrition, Health and Wellness company. As the population grows and healthcare challenges increase, the intrinsic value of our nutrition agen- da will continue to expand. That’s why Nutrition, Health and Wellness are at the heart of Creating Shared Value. As critical issues facing society, water and rural development are also top priorities, representing both business opportunities and operational challenges. All this is underpinned by a duty to protect scarce natural resources for the future. Our commit- ments to environmental and social sustainability ensure we can continue to be part of the long-term solution. Finding better ways to collaborate and secure collective action is key to addressing society’s most critical challenges and maximis- ing the shared value we can create. Creating Shared Value at Nestlé Our 2014 performance in these leading environmental and sustainability indices illustrates our progress on the commitments: Carbon Disclosure Leadership Index – In October 2014, we received a Climate Disclosure Leadership Index Award from environmental sustainability ratings agency CDP, having achieved a score of 96 out of 100. CDP Water Programme – The CDP Water programme pro- motes corporate water stewardship. Nestlé’s response was scored for the first time in 2014. We received a ‘Leadership’ rating, with a maximum score of 20 and we were recognised for our water strategy and public policy commitments. Dow Jones Sustainability Indices – The Dow Jones Sus- tainability Indices measure the performance of the world’s sustainability leaders. In 2014, we maintained our score of 88, placing us second in our industry. FTSE4Good – Nestlé remains included in FTSE4Good, which measures the performance of companies that meet globally recognised corporate responsibility standards. Oxfam Behind the Brands – Once again in 2014, Nestlé topped Oxfam’s Behind the Brands ranking, which assesses the world’s ten largest food and beverage companies across seven themes including women in the supply chain, farmers and land rights. Creating Shared Value Protect the future Laws, business principles, codes of conduct Sustainability Compliance Nutrition, water, rural development, our focus areas Creating Shared Value Nestlé in society4
  • 9. CHF 91.6 billion total group sales 339 456 number of employees 695 000 farmers working directly with Nestlé More than1billion number of servings consumed per day 442 number of factories worldwide 4.1 million number of families earning a livelihood because of us CHF 16 billion total group salaries and social welfare expenses CHF 2859 million corporate taxes paid in 2014 Creating Shared Value 5
  • 10. Summary of our commitments Nutrition Build knowledge leadership in children’s nutrition Lead the industry in nutrition and health research through collaboration Provide nutritionally sound products designed for children Help reduce the risk of undernutrition through micronutrient fortification Reduce sodium (salt) in our products Reduce sugars in our products Reduce saturated fats and remove trans fats in our products 2 Encourage consumption of whole grains and vegetables Deliver nutrition information and advice on all our labels Provide portion guidance for consumers Promote healthy diets and lifestyles, including physical activity Promote healthy hydration as part of a healthy lifestyle Provide education programmes for good nutrition and feeding practices Ensure responsible marketing communication to children Market breast-milk substitutes responsibly Rural development Roll out the Rural Development Framework to understand the needs of farmers Implement responsible sourcing in our supply chain Roll out the Nestlé Cocoa Plan with cocoa farmers Roll out the Nescafé Plan with coffee farmers Our commitments relate directly to our material issues (see page 39). They help drive continuous improvement and allow stakeholders to hold Nestlé accountable for delivering on its promises. In some instances, the title of a commitment has been updated from last year, to provide greater clarity and transparency, although the ambitions behind our commitments remain unchanged. Page 8 Page 18 See our full report for more details of our approach, policies and procedures at www.nestle.com/csv/downloads 2 This commitment refers to trans fats originating from partially hydrogenated oils in our products. Nestlé in society6
  • 11. Water Work to achieve water efficiency and sustainability across our operations Advocate for effective water policies and stewardship Treat the water we discharge effectively Engage with suppliers, especially those in agriculture Raise awareness on water conservation and improve access to water and sanitation across our value chain Environmental sustainability Improve resource efficiency in our operations Improve the environmental performance of our packaging Assess and optimise the environmental impact of our products Provide climate change leadership Preserve natural capital, including forests Provide meaningful and accurate environmental information and dialogue Our people, human rights and compliance Assess and address human rights impacts in our operations and supply chain Eliminate child labour in key commodities Ensure that all employees and stakeholders can easily report possible compliance violations Work against corruption and bribery Ensure all Nestlé units have basic safety and health protection systems for all employees Enhance gender balance in our workforce Offer 20 000 job opportunities for young people below 30 years of age at Nestlé in Europe Provide CSV, nutrition (NQ) and environmental sustainability training for our employees Page 22 Page 26 Page 30 7
  • 12. Our commitment Build knowledge leadership in children’s nutrition Our objective By 2016 – Launch large-scale research projects in at least 10 countries across the globe, including the USA, Mexico, China and Russia, to expand understanding of children’s nutrition and inform our own product and service development.3 Our progress Our new commitment to carry out studies in at least 10 countries, to understand children’s nutrient intakes, dietary patterns and related lifestyle factors, is based on the success of the Nestlé Feeding Infants and Toddlers Study, which had previously been conducted twice in the USA and, at varying scales, in five other countries. We have now started a third round of field research in the USA and we are analysing data in Mexico and China, where we have also studied maternal nutrition. The Kids Nutrition and Health Study, which analyses the diets of children aged 4–12 years, is underway in the USA, Mexico and China. We are engaging with stakeholders in a number of other countries to set up additional studies. In 2014, research results were presented at several international congresses and health practitioner conferences, and we strengthened our new product innovation workstream in response to research findings. Nutrition Our ambition is to be the world’s leading Nutrition, Health and Wellness company. Our global commitments on research, product reformulation and innovation, nutrition labelling, responsible marketing to children, and promotion of healthy lifestyles help shape our strategies, and ensure effective implementation. For all objectives, we aim to fulfil our commitment by 31 December of the year stated. Our perspective We aim to provide products, information and education that support parents in ensuring the healthy growth and development of their children. In addition to dietary intakes and behaviours, our research explores family dynamics around diets and key lifestyle patterns of children, while documenting their height and weight. This informs our product formulation, consumer communication and educational programmes. Our research and collaboration with local experts across the world offers huge learning potential but also presents significant challenges, such as achieving detailed knowledge on children’s dietary habits, which is difficult to record and can be sensitive. We also continue to share the results, through the Nestlé Nutrition Institute, with over 240 000 public health opinion leaders, third-party organisations and paediatricians to maximise the benefits of our research. Nestlé in society8
  • 13. First step towards made-to-measure vitamins To understand the molecular relationships between nutrients and their effects on patients at different stages of their lives, the Nestlé Institute of Health Sciences and the Waters Corporation – based in Massachusetts, USA – are collaborating on a ground-breaking research project that could lead to vitamin combinations tailored to individual needs. The partnership aims to develop new tests to measure the amount of vitamins in bodily fluids, such as blood and urine. Eventually, these tools will help to define and address the specific nutrient needs of individuals and groups. Our progress In January 2014, the Nestlé Institute of Health Sciences signed a long-term agreement with a USA-based developer of stem cell technologies, Cellular Dynamics International (CDI). The agreement will give the Institute access to cell products, obtained from adult non-embryonic stem cells (iPSCs) 4, to support research programmes on maintaining health and managing conditions such as diabetes and obesity. Also in 2014, Nestlé entered into a strategic partnership with the Singapore government’s Agency for Science, Technology and Research, A*STAR, with the goal of setting up global research programmes in food science and technology. The research teams at NRC are now focused on five research programmes: Food Safety and Integrity, First 1000 days and Healthy Kids; Healthy Ageing; Healthy Pleasure; and Sustainable Nutrition. At the end of 2014, the NRC had 33 clinical trials, 10 trials briefed by NRC and 23 trials briefed by Nestlé businesses and managed by NRC.  3 Russia has replaced France as one of the countries in the objective. 4 Nestlé does not do any research using human embryonic stem cells. Our commitment Lead the industry in nutrition and health research through collaboration Our objectives By 2016 – Further develop and integrate the molecular nutrition capabilities and clinical strategies of the Nestlé Institute of Health Sciences (NIHS) and the Nestlé Clinical Development Unit to help improve the management of diseases using nutritional solutions. By 2016 – Refocus the Nestlé Research Center (NRC) on five key platforms where we can make a positive difference: Healthy Ageing; Healthy Pleasure; First 1000 days and Healthy Kids; Sustainable Nutrition; and Food Safety and Integrity. Our perspective We have a responsibility to use our knowledge, research and development capability to make a positive difference to society. Through investing in innovation and leveraging leading-edge science, we are striving to forge a new industry between food and pharmaceuticals based upon inherently safe nutritional therapies with relevant levels of quality of life benefits and proven clinical and health economic value. Nestlé Health Science aims at advancing the role of nutritional therapy to change the course of health management for consumers, patients and our partners in healthcare. However, converting scientific research into a commercially viable product is a long and complex process. One of the challenges relates to the definition of medical foods – foods that are specifically formulated for the dietary management of patients with diseases or conditions for which there are distinctive nutritional requirements. There are still many questions around the definition of medical foods, which have knock-on implications for product claims, labelling and marketing. 9
  • 14. Nutrition Help reduce the risk of undernutrition through micronutrient fortification Our objectives By 2016 – We will reach 200 billion micronutrient-fortified servings of foods and beverages annually worldwide, helping to address global micronutrient deficiencies with a special focus on children and women of childbearing age. By 2015 – We will develop biofortified crops and launch new products in key markets to expand our fortified products portfolio and benefit rural farming communities. Our progress In 2014, we continued to make good progress towards our target, providing 183 billion servings of fortified foods worldwide (2013: over 167 billion). We extended reach on product categories for children and women of childbearing age, such as fortified infant cereals and growing-up milks. We continue to develop and test biofortified varieties of staple crops in collaboration with agricultural research institutes in several countries. Current work focuses on establishing supply chains to ensure the availability of commercial quantities of these crops. We have focused on four promising biofortified crops in 2014: maize, wheat, sweet potato and rice. Our perspective Nestlé is committed to helping address micronutrient deficiencies through fortification of affordable, nutritious foods and beverages. Developing new varieties of biofortified staple food crops is one way we can improve the nutritional content of our products and address micronutrient deficiencies in the diets of local communities at the same time. But this complex process can take several years as new plant varieties must be tested for crop yield under different climatic conditions and disease resistance, and their nutritional characteristics validated. The new crop must then be approved for release by the relevant governmental authorities and a stable supply of high-quality seeds established. Farmers may need training and support to grow it with good results. Identifying ways to measure the impact of our biofortified foods remains a key focus. Our commitment Provide nutritionally sound products designed for children Our objectives By 2014 – 100% of our children’s products 5 meet Nestlé Nutritional Foundation criteria 1 for children, based on nutrition science and dietary recommendations, such as those published by the World Health Organization and the Institute of Medicine. By 2015 – Maintain at 100% our children’s products 5 that meet all Nestlé Nutritional Foundation criteria 1 for children. Our progress At the end of 2014, 98% 6 of our children’s products met all of the Nestlé Nutritional Foundation criteria 1 for children (2013: 96%). We continued to work with renowned scientists to review the strength and breadth of our Nestlé Nutritional Foundation criteria. Products that were reformulated to meet the criteria in 2014 include Milkybar cream dessert (40% reduction in saturated fat; for launch in 2015); Pirulo ice lollies (35% reduction in sugar); and Mio yoghurt (18% reduction in sugar). From January 2015, all of our children’s products will be manufactured to meet Nestlé Nutritional Foundation criteria. Our commitment Our perspective Our aim is to contribute to improving children’s food environments by assessing all children’s products 5 against international public health recommendations, such as those of the World Health Organization and the Institute of Medicine. We manufacture and sell products in many countries. This poses both nutrition and public health science challenges, and also challenges for our own Nutritional Profiling System, which must reflect changes in public health priorities. Another important hurdle we face is accurately capturing and tracking the development of all our recipes across the globe in a single IT system. Our product portfolio will continue to evolve; with more than 1 billion Nestlé servings consumed every day, this will be a significant and ongoing task. Reducing sugars in Nestlé Nesquik powder products Since 2014, the global range of Nestlé Nesquik powder products have undergone a significant sugar reduction of 1200 tonnes to achieve our Nutrition Foundation status, while still retaining consumer preference. The main challenge was to reduce the sugar content and maintain a taste preference, which was achieved by replacing sugar with cocoa. The journey continues into 2015, with newly available technical solutions allowing us to make even more substantial sugar reductions. Nestlé in society10
  • 15. Reducing salt in Tomato Mozzarella Soup We have cut the salt content of our Maggi Tomato Mozzarella Soup, sold in Germany, by 34%. Our challenge was to reduce salt without impacting on taste. Our research and development chefs overcame this challenge by selecting and optimising the best ingredients to rebalance the taste profile. At the same time, they were able to reduce sugar content by 36% and saturated fat by 53%. The new recipe achieved a consumer taste test win of 66/34, meaning 66% of people prefer it over our competitor’s alternative. The product is due to be re-launched in June 2015. Reduce sodium (salt) in our products Our objectives By 2014 – 100% of children’s products 5 meet the Nestlé Nutritional Foundation sodium criteria 1 to help promote a reduction of salt in children’s diets. By 2016 – We will further reduce salt content by 10% in all relevant 7 products that do not meet the Nestlé Nutritional Foundation criteria1, ensuring gradual salt reduction even in more challenging areas of our product portfolio. Our progress In 2014, 98% 6 of our children’s products 5 met the Nestlé Nutritional Foundation sodium criteria1 (2013: 96%). 1 The Nestlé Nutritional Foundation criteria are based on nutrition science and public health dietary recommendations, such as those of the World Health Organization (WHO), the Institute of Medicine and other global or local authorities. Our products are evaluated against these criteria, using the Nestlé Nutritional Profiling System, which determines their nutritional value and whether they achieve the Nestlé Nutritional Foundation status. 5 Products for which 50% or more of consumers are below 12 years of age, or are designed for or perceived as being designed for this age group. 6 We have identified all products in the outstanding 2%, which are at different stages of the approval and/or registration process at market level before the product can be launched. 7 Relevant products means to exclude exemptions (Nestlé Nutrition, Nestlé Health Science, Nestlé Professional, Nestlé Purina PetCare, plain water/coffee/tea, Confectionery gifting, Culinary free-dosing and table-top seasonings, and products designed for children below four years of age as other legal considerations are relevant) and where regulations are not allowed. Our commitment 98% 6 of our children’s products 5 met the Nestlé Nutritional Foundation criteria for salt We have assessed our entire product portfolio against the Nestlé Nutritional Foundation sodium criteria, and our overall sodium reduction achievement was 4.7%. We are now looking into potential solutions for those products that do not currently meet the required standards. We have already relaunched a wide range of reduced-salt products, including: • Maggi Spaghetti Bolognese ‘Fix’ in Germany (17% sodium reduction); • Maggi Juicy Chicken Garlic and Maggi Juicy Chicken Paprika in Russia (respectively 12% and 19% sodium reduction); • Maggi soup range in Austria (14.5% – 22.5% sodium reduction); and • Stouffer´s vegetable lasagna in the USA (19% sodium reduction). Our perspective Sodium is an essential mineral, but too much of the salt in our diet comes from what’s added during manufacturing, home cooking or at the table. In 2013, we pledged to accelerate salt reduction across all of our savoury food products to support the WHO salt target of no more than 5 g of salt per person per day by 2025. However, reducing the salt content in some products poses a technical challenge. Besides seasoning, salt is important for food preservation and texture. We also need to reduce salt content without consumers either adding it themselves or choosing saltier alternatives. That is why we take a gradual approach and combine reduced salt content with optimised ingredient combinations to promote taste. 11
  • 16. Nutrition There are more whole grains than any other ingredient in at least 95% of our children’s 5 and teenagers’ 8 breakfast cereal servings Reduce saturated fats and remove trans fats in our products 2 Our objectives By 2014 – 100% of children’s products 5 meet the Nestlé Nutritional Foundation saturated fats criteria 1, helping to promote a reduction in saturated fats in children’s diets. By 2016 – We will further reduce saturated fat content by 10% in all relevant 7 products that do not meet the Nestlé Nutritional Foundation criteria1 and we will remove trans fats originating from partially hydrogenated oils (PHOs), to ensure continual improvement even in more challenging areas of our product portfolio. Our progress By the end of 2014, 98% 6 of our children’s products5 met the Nestlé Nutritional Foundation saturated fats criteria 1 (2013: 96%). In total, around 10% of our products do not yet meet the Nestlé Nutritional Foundation criteria for saturated fat. We are now working to identify solutions for some of these products. In 2014, we strengthened our policy to remove all trans fats originating from PHOs from our foods and beverages. 96% of the oils we use now meet our Nestlé Policy on Trans Fats. We have re-launched a number of products with reduced saturated fat levels, including: • Bouillon in Poland (13% reduction); • Herb sauce in Germany (33% reduction); • Onion soup in France (80% reduction); and • Uncle Toby’s Le Yoghurt Topps in Australia (34% reduction). Our perspective Dietary fats are important as part of a healthy, balanced diet but too much saturated fat in the diet poses a significant risk for non-communicable diseases such as cardiovascular disease. For some products, reducing saturated fat without impacting safety, texture, appearance and taste is a challenge. Trans fats occur naturally in foods such as milk and meat, but most trans fats in the human diet come from foods containing partially hydrogenated vegetable oils, such as bakery and savoury snacks. Our objective is to complete the removal of all trans fats originating from PHOs. We are working intensively with suppliers to source and develop new ingredients where required. Removing trans fat from liquid Coffee-mate In 2014, our leading Product Technology Centre successfully challenged long- established beliefs about oil stability when they reformulated the recipe for liquid Coffee-mate. In collaboration with our oil supplier, we succeeded in replacing the partially hydrogenated soybean/cottonseed oil with a high oleic soybean oil. It was the first time this new oil crop had been grown at large scale, and it was successfully industrialised to match our quality demands. The result is already a complete replacement of 16 000 tonnes of partially hydrogenated oil per year and the removal of 6000 tonnes of trans fat from our product in 2014. This was achieved without compromising on taste and consumer’s acceptance, or increasing saturated fat content. In 2015, 26 000 tonnes of oils will be replaced and 10 000 tonnes of pure trans fats removed. The changeover will be completed by September 2015. Our commitment Reduce sugars in our products Our objectives By 2015 – Reduce the sugar content in any serving of children’s 5 or teenagers’ 8 breakfast cereal brands to 9 g or less per serving, to promote a reduction in sugar in children’s diets. By 2016 – We will further reduce sugar content by 10% in all relevant 7 products that do not meet the Nestlé Nutritional Foundation criteria 1, to ensure continual improvement even in more challenging areas of our product portfolio. Our progress By the end of 2014, 98% 6 of our children’s products 5 met the Nestlé Nutritional Foundation 1 sugars criteria (2013: 96%). We are reducing the sugar content to 9 g total sugars or less per serving (30 g) in Nestlé breakfast cereal brands such as Nesquik, Chocapic, Honey Cheerios, Lion and Milo, as well as over 15 other Nestlé branded breakfast cereals. We have already relaunched a number of other reduced- sugar products including: • Nesquik global range of powder products (sugar reduction of 1200 tonnes – see page 10); and • Belte ice tea in Italy (18% sugar reduction, 18% calorie reduction). Our perspective Public health authorities recommend a reduction in the intake of added sugars, particularly because sugar can displace other essential, nutritious foods in the diet. We know it can be a challenge getting kids to eat a balanced breakfast – or any breakfast at all – so we are taking a gradual approach to reducing sugar, to help adapt taste preferences for the long term. Sometimes, reducing sugar without affecting flavour, texture, structure, colour and preservative properties is a significant challenge. Certain products, such as sweetened condensed milk, must comply with legally set compositional requirements. For these products, we are working to improve nutritional labelling and portion guidance. Our commitment Nestlé in society12
  • 17. Our perspective We champion GDA-based labels that inform consumers about calories, sugars, fat and other nutrients and how this compares with reference daily guidelines. We believe in providing GDA percentages that are based on a serving reasonably consumed, rather than the more abstract 100 g quantity. GDA challenges include product labelling regulation. We believe in empowering consumers to make informed choices and, where allowed, we have started re- launching our children’s products 5 featuring GDA information tailored to the consumer audience. Where it is not yet allowed, we engage with authorities, nutrition experts and industry bodies to promote GDA benefits, as well as targeting consumer education and engagement. Going beyond the label Media reports last year forecast that phone users in India and China would purchase more than 500 million smartphones in 2014. India alone was predicted to be the second-largest country for smartphones worldwide. We want to make nutritional information more accessible for our consumers, and our Maggi brand is using smartphone QR codes in India to deliver it. Maggi Soups has launched a microsite (accessible by scanning on-pack QR codes with a smartphone) that contains tips on portion guidance and vegetable consumption. Deliver nutrition information and advice on all our labels Our objectives By 2016 – All our relevant 9 food and beverage products worldwide will have Guideline Daily Amount (GDA)-based labels on front of pack to inform consumers about nutritional content. By 2016 – We will introduce GDA-based labelling, based on children’s reference values, for all products designed for children5 (where regulations allow) to help parents make better nutritional choices for children. By 2016 – Make information more accessible by providing further product information and nutrition advice on pack, via Quick Response (QR) codes for smartphones. Our progress After broadly implementing GDA-based nutritional information on our products across Europe, we are now extending our approach into all other regions. At the end of 2014, 79.7% of our relevant 6 products feature front-of-pack GDA-based labels (2013: 53.5%). In 2014, 62.7% of relevant products designed for children used children’s GDA (Guideline Daily Allowances), where regulations allow in 53 countries. Product information is now being provided via more than 2000 product websites 10 covering a total of 31 brands in 43 countries, especially children’s and family brands. 1 The Nestlé Nutritional Foundation criteria are based on nutrition science and public health dietary recommendations, such as those of the World Health Organization (WHO), the Institute of Medicine and other global or local authorities. Our products are evaluated against these criteria, using the Nestlé Nutritional Profiling System, which determines their nutritional value and whether they achieve the Nestlé Nutritional Foundation status. 2 This commitment refers to trans fats originating from partially hydrogenated oils in our products. 5 Products for which 50% or more of consumers are below 12 years of age, or are designed for or perceived as being designed for this age group. 6 We have identified all products in the outstanding 2% which are at different stages of the approval and/or registration process at market level before the product can be launched. 7 Relevant products means to exclude exemptions (Nestlé Nutrition, Nestlé Health Science, Nestlé Professional, Nestlé Purina PetCare, plain water/coffee/tea, Confectionery gifting, Culinary free-dosing and table-top seasonings, and products designed for children below four years of age as other legal considerations are relevant) and where regulations are not allowed. 8 Products for which 50% or more of consumers are below 18 years of age and, within this, more teens than children. 9 Products with significant everyday usage, by humans (not pets), that deliver calories, and have sufficient pack surface to feature a GDA label. 10 In 2014, product websites are reported over product lines to provide more robust measurement. Our commitment Encourage consumption of whole grains and vegetables Our objectives By 2015 – To ensure a high nutritional content, there will be more whole grain than any other ingredient in any serving of children’s 5 or teenagers’ 8 breakfast cereals. By 2015 – Maggi Cooking Lesson Programme will be ongoing in 30 countries to promote cooking with whole grains and vegetables. By 2015 – 90% of Maggi product portfolio worldwide will be promoting home cooking and meals with vegetables. Our progress We have introduced more whole grains than any other ingredient in at least 95% of our children’s 5 and teenagers’ 8 breakfast cereal servings (2013: 74%) and have committed to including whole grain as the primary ingredient of 100% of these products by 2015. Today we help consumers identify cereal options with more than 8 g of whole grain per serving, as indicated on packaging with the Green Banner. At the end of 2014, our Maggi Cooking Lesson Programme was taking place in 20 countries (2013: 16). To date, 73% of the Maggi product portfolio promotes home cooking and meals with vegetables via packaging/promotional materials (2013: 68%). Our perspective Whole grains and vegetables are vital for a healthy diet, but many people do not consume enough. Evidence suggests that nine out of 10 people do not reach the recommended level of consumption. This is the reason why we use whole grain to make our breakfast cereals, and why our innovation and renovation programmes aim to increase the whole grain content of our recipes. We have made steady progress in this but, because adding more whole grain impacts on everything from taste and texture to shelf life, we are proceeding with care to achieve a gradual, lasting improvement. We are optimistic that we will be able to convert all our children’s 5 or teenagers’ 8 breakfast cereals to have more whole grain by the end of 2015. The challenge we face around promoting vegetable consumption is the difficulty in tracking whether our efforts translate into long-term behaviour change among consumers. Our commitment Product information is provided through QR code scanning technology on 31 Nestlé brands in 43 countries 13
  • 18. Promote healthy diets and lifestyles, including physical activity Our objective By 2015 – Nestlé Healthy Kids Global Programme will be ongoing in 80 countries, with the activation of the International Association of Athletics Federations (IAAF) Kids’ Athletics programme to improve the nutrition, health and wellness of children around the world. Our progress By the end of 2014, we were actively working with 294 partners across 73 countries to deliver our Healthy Kids Global Programme (2013: 68 countries). 67 out of a total of 77 Healthy Kids programmes contain a physical activity component, for which our main partner is the IAAF (see case study on page 15). We reached more than 7.6 million children in 2014 alone (2013: 6.9 million). Our perspective Driving behaviour change towards healthier diets and lifestyles is a global challenge. Nestlé is committed to promoting the importance of a balanced diet and regular physical activity among young people. We support initiatives that demonstrate how diet and exercise can improve health and well-being, and we are developing evidence- based, impactful initiatives that contribute to the health of local school communities. Effectively measuring the long-term success of our Healthy Kids Global Programme is a key priority, and at times a challenge. Sustained success is itself a challenge as this depends on quality partnerships and the ability of the education system to provide nutrition education and physical activity in schools. Nestlé is committed to supporting authorities globally, to help ensure children adopt appropriate nutrition and physical activity habits, which are important for their development and learning ability. Together with our partners, we need to further advocate for whole-school approaches where nutrition and health are considered an important part of children’s development. Our commitment Nutrition Portion guidance The Nestlé Pizza Portion Guide offers nutritional information and ideas for incorporating pizza into a balanced meal. Provide portion guidance for consumers Our objective By 2015 – Provide portion guidance on all children’s 5 and family products 8 to encourage healthy portion consumption. Our progress By the end of 2014, we offered specific portion guidance for an estimated 30.2% of our children’s 5 and family products 8 portfolio. Our perspective Nestlé Portion Guidance 11 is a voluntary initiative that bridges the gap between dietary recommendations and more user- friendly information to promote mindful portion size. The initiative is designed to help re-frame portion norms, particularly in energy-dense categories where habitual servings have increased over time. By providing practical on-pack portion guidance, we aim to help consumers make intuitive portion choices in terms of size and quantity. Modifying norms about portion sizes is a complex issue involving many different challenges, which requires innovative solutions and collaboration between nutrition, education and industry experts. There are also perception-related challenges. Encouraging consumers to adopt smaller portion sizes of a product may represent a cultural change that will take time to embed. And among our stakeholders, we need to build trust and understanding around our motivation to lead the industry in promoting healthier portion sizes. Our commitment Nestlé in society14
  • 19. Drink Better. Live Better. with Nestlé Waters Nestlé Waters supports the Partnership for Healthier America’s Drink Up initiative, a programme that guides people to drink more water. Nestlé Pure Life communicated the partnership on bottled water products, trucks, advertising and social media conversations with both English and Spanish-speaking audiences. Nestlé Waters also launched Drink Better. Live Better., a programme that makes drinking water more fun for families by redeeming points collected for a variety of rewards. Supporting Australian kids’ athletics In April 2014, Athletics Australia launched the IAAF Nestlé Healthy Active Kids’ Athletics to boost participation among young people. The pilot will be offered to Australian children through the national after-school care scheme, and more than 100 children attended a sports clinic run by Australian and American champions to launch the programme. 5 Products for which 50% or more of consumers are below 12 years of age, or are designed for or perceived as being designed for this age group. 8 Products for which more than 20% but less than 50% of consumers are below 18 years of age. 11 We capitalize portion guidance to distinguish and promote its consumer-engaging on-pack guidance nature compared to simple portion information. Promote healthy hydration as part of a healthy lifestyle Our objective By 2014 – Further implement our fact-based healthy hydration awareness programme for healthcare professionals, caregivers and parents worldwide, providing a better understanding of the benefits of water as key to healthy hydration. Our progress In 2014, we analysed the data of a national nutrition survey conducted in Mexico to estimate the total water intake of children aged 1–18. This work, published in a peer-reviewed journal, showed that children are not meeting their daily water needs as recommended by the Institute of Medicine. We are in the process of publishing similar research conducted in Egypt. We continue to raise awareness of healthy hydration – notably through campaigns in the USA and Turkey. Healthy hydration is now integral to the Nestlé Healthy Kids Global Programme, and Nestlé Waters has expanded the reach of Project WET (a global water education programme) modules on healthy hydration through national programmes in Nigeria, Jordan and China, and during World Water Day events globally. In 2014, our World Water Day events alone educated over 20 000 children about the benefits of healthy hydration. Our commitment to promote healthy hydration as part of a healthy lifestyle is an ongoing effort. Having fulfilled our objectives for 2014, we are working with our Markets and stakeholders to come up with objectives for 2015 and beyond, that will be communicated in next year’s report. Our perspective What you drink is as important to a healthy lifestyle as what you eat and how often you exercise. Plain water – whether from a tap or a bottle – should be the preferred choice for daily hydration, as it doesn’t add any calories to the diet. We believe healthy hydration habits start early, but our studies in four countries have shown that two-thirds of children are insufficiently hydrated when they arrive at school. We provide child-health stakeholders – including teachers, parents and educators – with the tools and information they need to ensure children learn about the benefits of healthy hydration. Our commitment Our Healthy Kids Global Programme reached more than 7.6 million children in 73 countries in 2014 15
  • 20. Ensure responsible marketing communication to children Our objective By 2015 – Implement a strengthened Policy on Marketing Communication to Children. Our progress We have ensured global compliance with responsible advertising and marketing standards for children since establishing our Corporate Communication Principles in 2002 and introducing the Policy on Marketing Communication to Children in 2008. We abide by external pledges including IFBA Commitments 12, the EU Pledge and local pledges. In 2014, 99.92% of Nestlé television advertising to children under 12 was compliant with responsible marketing policies 13 (2013: 98.3%). Our Marketing to Children Policy states that we do not direct marketing communciation to children under six. From December 2015 direct marketing communication to children 6 to 12 years of age can only be with products that achieve EU Pledge Nutrition Criteria or meet Nestlé Nutritional Foundation status where no criteria have been adopted under the EU Pledge criteria. Irrespective of the criteria being met, we do not direct any marketing communication for biscuits, sugar confectionery and chocolate confectionery products to children 14. The media channels covered by this Policy include television, radio, print, cinema, digital media, mobile, games, consumer relationship marketing, viral marketing, apps, emails/SMS, Nestlé-owned websites, movie tie-ins, promotions, contests, product sponsorship, events and sampling. With the new policy we developed a qualitative set of criteria to define the ‘appeal’ of marketing communications to children under 12. To ensure consistent and effective implementation, detailed internal guidelines have been developed and external stakeholders are encouraged to provide feedback via our ‘Tell us’ reporting mechanism (see page 32). Our perspective We are phasing out our marketing communications in schools, while strengthening our health and wellness education activities, particularly those that positively impact childrens’ development and support governments’ goals to increase physical activity, such as the Nestlé Milo sports development programmes. Our commitment ESPHGAN Goes Africa To maximise the reach of our programmes to benefit communities around the world, Nestlé supports the European Society for Paediatric Gastroenterology, Hepatology and Nutrition (ESPGHAN) with an education grant to run a Diploma course on gastroenterology and nutrition for paediatricians in Africa. Eighty seven doctors from 18 African countries have been trained since 2012, and 30 more will be trained in 2015. Our aim is to build up a critical mass of trained paediatricians in gastroenterology and nutrition who will then cascade their knowledge to others. Provide education programmes for good nutrition and feeding practices Our objectives Help guide parents and caregivers to raise healthier children, and help healthcare professionals have a greater impact on the nutritional aspects of care of future generations. Ongoing – Offer nutrition education services and programmes for healthcare professionals addressing global under- and over-nutrition problems (Nestlé Nutrition Institute). Ongoing – Provide science-based practical nutrition education for parents and caregivers that focuses on the importance of the first 1000 days (from conception to the child’s second birthday), including maternal nutrition during pregnancy and promoting breastfeeding as the best start in life (Nestlé Start Healthy Stay Healthy). By 2015 – Nestlé Nutrition Institute will reach over 1 million healthcare professionals via its online educational services in nine languages. By 2015 – Nestlé Start Healthy Stay Healthy will reach over 5 million mothers and caregivers worldwide with multi-lingual online nutrition education services. Our progress The Nestlé Nutrition Institute (NNI) offers educational services to healthcare professionals in 195 countries. More than 243 000 healthcare professionals are registered as members of its educational website. As the world’s largest private publisher of nutritional information, over 3000 publications can be downloaded free by members from the NNI website. Since its inception in 1981, the NNI has held 85 International Nutrition Workshops, over 700 online conferences and awarded 8–10 postgraduate academic fellowships per year to young medical doctors from developing regions. In 2014, by broadcasting NNI workshops live over the internet, we reached ten times more healthcare professionals than in previous years. Nestlé Start Healthy Stay Healthy is our new interactive, science-based education programme designed to help mothers and caregivers provide nutritionally and developmentally adequate nutrition in the crucial first 1000 days of life. Our perspective Nestlé believes it has a responsibility to share its expertise in nutrition and deep consumer understanding to benefit society. We place significant focus on promoting better health through nutrition in the first 1000 days of life. Poor maternal nutrition, for example, affects foetal growth and cognitive functions and increases infant morbidity and mortality. Children who suffer malnutrition in their early years fail to fully develop their physical and cognitive potential and have an increased risk of poor health later in life. Our educational programmes are targeted at the people who are most involved in implementing good practices during the first 1000 days to help guide parents and caregivers to raise healthier children, and help healthcare professionals have a greater impact on the nutritional aspects of care of future generations. One challenge we face in this objective is overcoming a perceived conflict of interest concerning our engagement with the scientific and public health communities. We address this challenge by maintaining the highest level of transparency, scientific rigour, and ethical standards in the collaboration, conduct, and dissemination of scientific research and educational programmes. Our commitment Nutrition Nestlé in society16
  • 21. Super Babies shout the benefits of breastfeeding in India During Breastfeeding Week in August 2014, Nestlé India launched a social media campaign to reinforce the importance of breastfeeding. Featuring the animated, rapping Super Babies, the 2014 campaign aimed to go beyond the half a million pledges generated the previous year, by taking public support and converting it into an action through discussions on the benefits of breastfeeding and involving the public at large. By the end of 2014, the Super Babies video had been watched more than two million times. Our progress We have been included in the FTSE4Good Index since 2011, the only global responsible investment index with clear criteria on the marketing of breast-milk substitutes (BMS) up to 12 months of age in 152 higher-risk countries. Policies and procedures applied by our Wyeth Infant Nutrition business are now aligned with the requirements stemming from the FTSE4Good BMS Marketing Criteria. In 2014, our practices were audited in 39 countries by internal auditors and in four countries by external auditors 15. Building on these and previous years’ recommendations, we have strengthened training for third-party distributors and their requirements to comply with national legislation and the Nestlé Policy and Instructions for Implementation of the WHO Code. We also enhanced our systems for the reporting of concerns, largely by external stakeholders, through the ‘Tell us’ system (see page 32). Market breast-milk substitutes responsibly Our objectives Ongoing – As part of our ongoing efforts to promote good nutrition in the first 1000 days of life and support breastfeeding, report publicly on our progress regarding the responsible marketing of breast-milk substitutes. By 2014 – Ensure our newly acquired Wyeth Nutrition Infant Formula business meets the FTSE4Good Index criteria. By 2015 – Continue to strengthen our practices to ensure both Nestlé Infant Nutrition and Wyeth Infant Nutrition consistently meet the FTSE4Good Index BMS criteria. Our commitment 12 International Food and Beverage Alliance’s Global Policy on Advertising and Marketing Communications to Children. 13 The percentage reflects Nestlé’s full-year compliance to the stricter 35% children audience threshold as redefined in September 2011. 14 Marketing communication will be deemed directed to children 6–12 years old if 35% or more of the media channel’s audience is that of that age group. In addition, we will take into account channels of placement, content and overall impression of the marketing communication. 15 As per existing company practices, internal audits of newly acquired businesses slightly differed upon acquisition to allow time for integration of policies and practices. Wyeth Nutrition will be included in the standard audit cycle along with the business starting from 2015 onwards. Our perspective We believe breast-milk is the best food for infants and this is why we promote it. However, there are still numerous barriers to breastfeeding. When, in consultation with their healthcare providers, mothers and families decide that optimal breastfeeding is not possible, infant formula – the only suitable breast-milk substitute recognised by the WHO – plays a vital role in providing essential nutrients to infants. We are committed to the highest standards of responsible marketing of BMS and comply with the WHO Code as implemented by national governments as well as the Nestlé Policy and Instructions for Implementation of the WHO Code. We pledge to apply the most rigorous policies and systems to monitor our practices. As we seek to continuously improve, we encourage stakeholders to share with us their comments. In 2015, we will pursue our efforts to create a conducive environment for our employees who breastfeed. We will also continue to engage with key stakeholders to increase collaboration, promote responsible conduct and establish an accepted standard for assessing the commercialisation of breast-milk substitutes. 17
  • 22. Roll out the Rural Development Framework to understand the needs of farmers Our objectives The Nestlé Rural Development Framework 16 helps us to identify the needs of farmers and farming communities and, therefore, to target our investments better. By 2015 – Continue to establish baseline assessments in the countries of key importance to our business that show pronounced social need to guide us in aligning our own activities with the priorities of local communities. Our progress In 2013, we piloted the Rural Development Framework in our coffee programmes in China and Vietnam, and coffee, cocoa and cassava procurement in Côte d’Ivoire. This involved conducting baseline assessments to understand current conditions and design appropriate interventions. Some common findings, published in July 2014, include poor resource management, and variable access to clean water, sanitation and nutrition. In some cases, issues concerning land tenure, the status of women and agronomy knowledge were also raised. Following stakeholder feedback on our human rights and rural development approach in April 2014, we adjusted our approach and began work across Mexico, Colombia, Kenya, Ethiopia, Indonesia and the Philippines. Some of our findings have already been incorporated into country business plans, while others require further discussions with partners, communities and government agencies to align our efforts and avoid duplication. Our perspective Nestlé has a huge stake in rural communities around the world, sourcing agricultural raw materials from millions of farmers globally. These farmers are essential to the ongoing success of our business, but the global farming population is ageing and more people are moving away to urban areas. The Nestlé Rural Development Framework helps align our business activities with local development priorities. In addition to helping farmers access financial assistance, our agripreneurship model provides a training pipeline for farmers to develop their skills. But making rural areas attractive places to live, work and invest in doesn’t just depend on our supply chain. Rural populations need access to clean energy, banking and finance, healthcare, telecommunications and other infrastructure. We are working with the World Business Council for Sustainable Development (WBCSD) and its member companies to explore how different sectors can come together to focus their investments in rural areas. We also know that for many communities, nutritional status remains a critical challenge. At this point, our Rural Development Framework may not yet address this aspect sufficiently. Developing the dairy farming sector in China Nestlé built its factory in Shuangcheng, China, in 1987. In 2012, having recognised a need to improve the sustainability of our milk supply chain, we committed to establishing the Nestlé Dairy Farming Institute. Helping farmers to increase their knowledge and skills is a key focus area of our rural development strategy. By adopting best practices, farmers are able to improve productivity, trading relations and cost control. The Institute consists of three demonstration dairy farms, where farm owners and workers attend training sessions to improve farm management skills, learn how to use the latest technology and gain practical experience in expanding their businesses. In 2014, the Institute launched training programmes covering dairy farm management and dairy cow breeding. Our commitment Rural development We depend on a secure, long-term supply of ingredients for our products and we want to ensure those ingredients are produced responsibly. By understanding where and how our raw materials are produced and aligning our business activities with local priorities, we can contribute to important issues such as rural development, eliminating child labour and promoting better agricultural practices. For all objectives, we aim to fulfil our commitment by 31 December of the year stated. Nestlé in society18
  • 23. Our progress By the end of 2014, we had audited 8700 of our 10 000 Tier 1 suppliers (2013: 6500), 73% of which fully complied with our Supplier Code. 1300 more audits are planned for 2015. If we reach 10 000 audits by the end of 2015, we will have covered over 60% of our raw and packaging material suppliers, accounting for over 95% of our overall spend. Currently, 38% of purchased volumes of our priority categories are traceable (2013: 17%), which means all farmers involved in supplying that ingredient (even via third parties) are known and identifiable by Nestlé or our suppliers. Furthermore, 28% (2013: 9%) are Responsibly Sourced, whereby the plantation or farm is either compliant with our Responsible Sourcing Guideline requirements or has an improvement plan in place, or complies with an equivalent certification scheme. With operational activities for meat, dairy, shea and fish commencing in 2014, we are confident that 40% of our priority category volumes will be traceable, and 30% Responsibly Sourced, by 2015. A global partnership for animal welfare In March 2014, Nestlé became the first major food company to form a global partnership with an international animal welfare NGO, World Animal Protection. Nestlé uses dairy, eggs, meat and poultry as ingredients in a range of products and has publicly committed to further improving farm welfare in its global supply chain. Through this partnership, World Animal Protection shares its expertise on farm animal health, care and welfare. In turn, Nestlé, through its responsible sourcing activities, provides World Animal Protection with the opportunity to further engage with suppliers and to promote good farm animal welfare practices within the food industry. 16 Created to bring all our rural development activities together, the framework – supported by our Rural Development Commitment – is composed of three pillars underpinned by alignment, collaboration and advocacy: successful farmers; productive and respected workers; and prospering communities. We have audited 8700 of our 10 000 Tier 1 suppliers and found 73% fully complied with our Supplier Code Our perspective With consumers and other stakeholders increasingly looking for information about where their food comes from and how it was produced, responsible sourcing is an important investment, in both Nestlé’s future and that of the producers we rely on. Our supply chains are complex and continuous improvement requires all parties to address social and environmental issues. We’ve made steady progress by encouraging the adoption of good agricultural practices, and engaging in capacity building, knowledge sharing and training, enabling our suppliers to reach higher levels of sustainability. As well as working alongside NGO partners such as Proforest and The Forest Trust to map our supply chains for sugar, soya, palm oil and paper, we are also taking a proactive role in assessing suppliers of animal-derived ingredients against our Responsible Sourcing Guideline on farm animal welfare, and in tackling deforestation and addressing child labour in our supply chains. Our commitment Implement responsible sourcing in our supply chain Our objectives By 2015 – To both improve and demonstrate compliance with the Nestlé Supplier Code, and complete 10 000 Responsible Sourcing audits, 70% of them with full compliance. By 2015 – 40% of the volumes of the 12 priority categories (palm oil; soya; sugar; pulp and paper; coffee; cocoa; dairy; fish and seafood; shea; vanilla; hazelnuts; and meat, poultry and eggs) to be traceable. 19
  • 24. Nestlé Cocoa Plan in Venezuela In Venezuela, we have faced a number of challenges in securing a reliable supply of some of the world’s finest cocoa; these range from a decline in the quality of native cocoa plants to the limited appeal of agricultural work to the younger generation. But through the Nestlé Cocoa Plan, we are helping to make cocoa production a livelihood of choice – one that leads to higher incomes and improved social conditions. Six hundred farmers across the country’s three main cocoa-producing regions are currently involved in the Nestlé Cocoa Plan. And since 2008, Nestlé Venezuela staff have made almost 6130 visits to their farms, distributing high-quality plantlets and organic fertilizers, offering technical assistance and providing training in good agricultural practices such as pruning, which increases yield and restricts the spread of disease. On our demo plots pod counts indicate an increase from 878 kg to over 1500 kg per hectare. Our progress In 2014, we purchased 91 801 tonnes of cocoa through the Nestlé Cocoa Plan (2013: 62 299). We trained 45 833 cocoa farmers (2013: 33 885) and built or refurbished 17 schools (2013: 13), meeting our target of building or refurbishing 40 schools in four years. In August 2014, the Fair Labor Association (FLA) published its first report on Nestlé’s cocoa supply chain in Côte d’Ivoire, highlighting areas where we need to do more to meet its Code of Conduct. We have since extended our Child Labour Monitoring and Remediation System to include another 14 co-operatives in Côte d’Ivoire (2013: eight), bringing the cumulative total to 22. Community liaison officers are selected from the farming communities to identify the children at risk, and to engage with cocoa farmers in an open and transparent way. We plan to extend the initiative to cover all 67 Nestlé Cocoa Plan co-operatives by the end of 2016. Rural development Roll out the Nestlé Cocoa Plan with cocoa farmers Our objectives The Nestlé Cocoa Plan aims to improve the lives of cocoa farming communities and the quality of the cocoa we purchase. By 2015 – Source 100 000 tonnes of cocoa through the Nestlé Cocoa Plan. By 2016 – Source 120 000 tonnes of cocoa through the Nestlé Cocoa Plan and complete the roll-out of our Child Labour Monitoring and Remediation System to identify child labour in all Nestlé Cocoa Plan co-operatives in Côte d’Ivoire. By 2017 – Source 150 000 tonnes of cocoa through the Nestlé Cocoa Plan. Our commitment For more details about the Nestlé Commitment on Child Labour in Agricultural Supply Chains and our action plans to address the issue in the supply chains of key categories, see our commitment on child labour on page 31. Our perspective The Nestlé Cocoa Plan has three pillars: enabling farmers to run profitable farms; improving social conditions; and sourcing good quality, sustainable cocoa for our products. By providing stronger plants and training farmers in better agricultural practices, we can help them improve their long-term profitability and sustainability. Better access to education and support for women involved in our supply chain is improving social conditions and reducing the risks of child labour. Nestlé is one of the largest buyers of Ivorian cocoa, working with 67 cocoa co-operatives. Our Child Labour Monitoring and Remediation System is exposing the extent of and causes behind child labour in Côte d’Ivoire’s cocoa farming industry, helping Nestlé and our partners tackle the problem in a way that meets the needs of families and communities. Nestlé in society20
  • 25. Roll out the Nescafé Plan with coffee farmers Our objectives By 2015 – To improve the sustainability of our coffee supply chain, source 180 000 tonnes of coffee from Farmer Connect 17, all of which is 100% in line with 4C’s 18 baseline sustainability standard. By 2020 – To improve the quality, quantity and sustainability of our coffee supply chain, distribute 220 million coffee plantlets 19 and source 90 000 tonnes of coffee that is compliant with the Sustainable Agriculture Network principles 20. Our progress During 2014, we further embedded the Nescafé Plan in the 14 countries where it currently operates. We also enhanced its scope in Vietnam and Colombia through initiatives related to water, coffee and rural development. By the end of 2014, Nescafé had sourced around 186 750 tonnes directly through our Farmer Connect 17 sourcing operations from about 171 900 farmers (2013: 176 040 farmers). Of this amount 130 500 tonnes (or 70%) is compliant according to the 4C standard (2013: 71 493 tonnes, 48%). The total volume of responsibly sourced coffee increased to 412 538 tonnes (2013: 366 270 tonnes). We also distributed more than 29.8 million high-yield, disease-resistant coffee plantlets to farmers in 2014 (2013: 21.4 million), taking our cumulative total to 73.8 million. Our commitment The Positive Cup In addition to our Nescafé Plan activities, in August 2014, Nespresso announced ‘The Positive Cup’, a new sustainability strategy to improve farmer welfare and drive environmental sustainability in coffee sourcing and consumption over the next six years. It sets out the steps the company will take to achieve ambitious goals in the areas of coffee sourcing and social welfare; aluminium sourcing, use and disposal; and resilience to climate change. Building on what Nespresso has already achieved over the last 11 years, Nespresso will source 100% of its permanent range of Nespresso Grands Crus coffees sustainably through its Nespresso AAA Sustainable Quality Programme, including investing in the economic and social development of coffee-farming communities in Ethiopia, Kenya and South Sudan. 17 Our programme for direct sourcing from farmers, through which we commit to the local sourcing of raw materials, offering technical assistance and ensuring cooperation to meet the highest sourcing standards. 18 The Common Code for the Coffee Community (4C) Association is a multi-stakeholder group with members across trade and industry, producers, civil society and companies active in the coffee supply chain. 19 This is an aggregate figure from 2010 to 2020. 20 An international coalition of leading conservation groups in sustainable agriculture, with standards for environmental protection, social responsibility and economic vitality. Our perspective Our long-term ability to source the right quality and quantity of coffee for our major brands depends on the sustainability of coffee farming. Ageing trees, plant diseases, declining yields, volatile prices and climate change are just some of the threats to the livelihoods of coffee farmers, the vast majority of whom are smallholders. Coffee growing is also being challenged by alternative crops, considered by growers as better commercial prospects. We are responding by helping farmers build a more robust business – offering efficient routes to market, local training, plant propagation and distribution, and technical assistance through our team of more than 300 agronomists. In 2014 Nescafé responsibly sourced 412 538 tonnes of coffee 21
  • 26. Water Work to achieve water efficiency and sustainability across our operations Our objectives We aim to minimise the impact of our operations on natural water resources and the communities they support. By 2015 – Reduce direct water withdrawals per tonne of product in every product category to achieve an overall reduction of 40% since 2005. By 2015 – Establish and implement detailed guidelines on human rights to water and sanitation due diligence. By 2016 – Define water stewardship initiatives and start implementation in five high-priority locations. By 2016 – Implement water savings projects in 100% of high-priority manufacturing facilities. By 2016 – Carry out 45 new water resources reviews in selected manufacturing facilities, and all greenfield sites. Our progress In line with our Commitment on Water Stewardship (2013), Nestlé actively seeks new opportunities to reduce, reuse and recycle water in our operations. We have introduced a global ‘Water Stewardship Master Plan’ at a corporate level, and we have started to develop local master plans in key markets, beginning with Pakistan (2014). These contain documented responsibilities, targets and deadlines that direct our improvements. Today, our people are carrying out over 376 water-saving projects in Nestlé’s factories, which will save around 1.84 million m3 of water. In 2014, we reduced direct water withdrawals per tonne of product by 6% (37% reduction since 2005). We have identified and prioritised 31 high-priority manufacturing facilities that are located in areas of severe water stress and/or represent a significant portion of our water withdrawals. By the end of 2014, we have decreased water withdrawals and improved efficiency (against 2013 levels) in 42% of these facilities. We improve local water stewardship efforts by conducting Water Resource Reviews across our factory sites, with 18 new reviews carried out this year. Water, Sanitation and Hygiene (WASH) considerations are being integrated into the process. Our perspective Nestlé welcomes the growing level of stakeholder interest in water issues, recognising that it reflects a greater awareness of the impacts of global water scarcity. We remain convinced that public debate around water use (including our own water use), leads to positive collective action. With 38% of our factories situated in water-stressed regions, responsible water stewardship rightly remains a critical issue for our business and our stakeholders. Water resource reviews help us to assess potential impacts to the Right to Water and Sanitation of local communities where we operate and they propose appropriate corrective actions, when needed. The right to water and sanitation is also systematically included in our corporate Human Rights Impact Assessment. By the end of 2014, 133 factories had undergone a Water Resources Review. We will continue to drive improvements in water efficiency and sustainability across our operations. Our commitment Cero Agua Mexico This year, in Mexico, we opened our most water-efficient factory. Over the last 60 years, water availability per person has drastically declined in the country, due to population growth. Using new processes, our Cero Agua dairy factory in the water-stressed state of Jalisco is already moving towards zero water withdrawals on-site. Instead, the factory uses the water vapour generated when we evaporate cow’s milk. This water is condensed, treated and recycled for use as potable process water, and again for cooling and cleaning. This is saving around 1.6 million litres of water a day – enough to meet the average daily consumption of 6400 people in the surrounding area 21. We are replicating the process in locations such as Nestlé South Africa, where our five-year investment plan includes converting our Mossel Bay dairy factory to ‘Zero Water’. Water, more than any other substance, is essential for human survival and cannot be replaced. The gap between the supply and demand of safe fresh water is increasing and, by 2030, water withdrawals are predicted to exceed renewals by 40% if no action is taken. Responsible water stewardship is critical for all of us and to the future of our business. We respect the human right to water and sanitation, and are helping to facilitate the sustainable management of water catchments where we source our goods, where our factories are located, and where our suppliers and consumers live. For all objectives, we aim to fulfil our commitment by 31 December of the year stated. Nestlé in society22
  • 27. Water discharges per tonne of product cut by 52% since 2005 Advocate for effective water policies and stewardship Our objectives We aim to promote water policy and management that helps towards sustainable use by industry and others, both globally and locally. By 2016 – Continue to build the 2030 Water Resources Group Public Private Partnership by adding two more countries per year and further develop and publicise the Global Catalogue on Good Practices.22 By 2016 – Support the launch of the CEO Water Mandate Guide on Good Practices for Business on the Human Right to Water and Sanitation and pilot test the Guide in our water due diligence in selected markets.23 By 2016 – Support the World Business Council for Sustainable Development (WBCSD) to achieve 50 signatories of the WASH Pledge.24 By 2016 – Initiate the roll-out process of the Alliance for Water Stewardship’s (AWS) International Water Stewardship Standard by implementing it in at least five locations.22 By 2016 – Work with the Sustainable Agriculture Initiative Platform (SAI) and the Sustainable Food Lab (SFL) to implement the Water Risk Assessment and Mitigation collaboration initiative in at least one sourcing area of agricultural raw materials.25 Our progress Nestlé maintains a strong presence in high-profile initiatives on water policy and stewardship, promoting opportunities to improve best practice. Many of our senior people, including our Chairman, play a leading role in the 2030 Water Resources Group (2030 WRG). We currently chair this public-private-civil society collaboration, which seeks to catalyse practical solutions for water resources reform in water-stressed developing economies. The WRG has been invited to work in Peru and Tanzania, and is also exploring other countries such as Bangladesh, Kenya and Lebanon. In July 2014, we welcomed the publication of the international standard ISO 14046:2014 Environmental management – Water footprint – Principles, Requirements and Guidelines. It marks the culmination of five years of collaboration between more than 90 experts and Nestlé has been an active member of the working group. We continue to support the CEO Water Mandate Public Disclosure Guidelines, released in September 2014, and champion the WBCSD Pledge in our own operations and beyond, acting as a vocal WASH Ambassador on the international platform. We have produced internal guidance on the AWS International Water Stewardship Standard (AWS Standard) to strengthen water stewardship at key Nestlé locations. A wider roll-out is planned for 2015. Promoting water stewardship at Nestlé’s Douala factory in Cameroon In 2014, we completed a Water Resources Review (WRR) at our Douala factory in Cameroon where we produce Maggi soup bases. We used the WBCSD WASH self-assessment tool to examine access to water, sanitation and hygiene for more than 500 employees, vendors and visitors to the site. The factory satisfactorily met the Pledge’s overall compliance levels, and we have developed an action plan to tackle the few improvement issues it highlighted. Communities as far as two to three kilometres away benefit from free access to water fountains on site during set hours, resulting in around 5000 litres of water being collected by local residents every day. A new CHF 474 905 wastewater drainage project is planned to help reduce the risk of flooding and improve the local environment for communities. Our commitment 21 This figure is based on use of an average daily consumption of approximately 250 l per person. Source: Tecnologías Alternativas y Ecodiseño. 22 This is an ongoing extension of our 2014 objective. 23 Our 2014 objective to contribute to the Guidelines was achieved. 24 Our 2014 objective to contribute to the ISO 14046: Water Footprint – Principles, Requirements and Guidelines was achieved. 25 Our 2014 objective to use the principles of the AWS Standard as a self-assessment guide at selected high-priority locations was achieved. Our perspective We are all facing an urgent challenge to provide safe water for and feed the world’s growing population. It calls for joint efforts and common goals going forward. We believe governments must take a systemic approach to water. They must provide strong leadership, avoid acting in ‘silos’ and ensure accountability towards political commitments. They must also strengthen institutions, particularly for community- based affordable solutions within the water safety/sanitation/poverty nexus, act as regulators (for both public and private water supply structures) and set incentives to ensure cost-effective solutions and good management of water security, water supply, sanitation and treatment. We are willing to help by advocating for effective water policies and water stewardship. Our proactive approach brings us into contact with Public Private Partnerships, industry bodies, NGOs and research institutions to learn and share best practice. The progress delivered through these relationships is communicated transparently via our website. 23
  • 28. Water Engage with suppliers, especially those in agriculture Our objective By 2015 – Define and start to implement action plans to save water in our upstream supply chain for coffee, sugar, rice and cereals in high-priority locations. Our progress Improving the water efficiency of our complex agricultural supply chain is one of our greatest challenges. Nestlé works directly with around 695 000 farmers and, through the Sustainable Agriculture Initiative at Nestlé, we promote sustainable development and offer support to farmers. The global programme focuses on a range of categories and enables us to address some key challenges in water management and irrigation, such as resilience to drought and flooding; wastewater and organic waste treatment; and farm intensification techniques. In 2014, we supported: • an integrated water management project to develop a climate-intelligent coffee sector in Colombia; • the application of the Water Footprint methodology in Colombia, to improve water use awareness, efficiency and water pollution control on dairy farms and at our factories; • a water stewardship agriculture seminar in Spain; and • new changes to irrigation methods and water management in Vietnam to produce more coffee beans with less water. Our perspective Water is a shared resource, impacted by all users in a catchment area. We believe that, sometimes, the greatest improvement to the health of a water catchment can be achieved when Nestlé invests resources in an external initiative rather than our own factory. We can achieve significant improvements in water use by introducing better agricultural techniques at a farm level, and these do not always require significant investment. We also believe there is an opportunity for businesses that purchase from large global suppliers to use their collective influence to demand better water efficiency, for example through the Sustainable Agricultural Initiative Platform. We will invest in external shared initiatives that help all catchment users to improve water efficiency. Treat the water we discharge effectively Our objective By 2016 – Implement the new and strengthened Nestlé Environmental Requirements for water quality and effluent discharge in all factories in order to help protect the environment. Our progress In 2014, we approved a spend of CHF 18 million on new and improved treatment facilities and strengthened our water quality requirements for new effluent treatment installations. At the end of 2014, we have reduced water discharges per tonne of product by 51.8% since 2005 (2013: 48.5%), with an average quality of water discharge of 72 mg COD/l (2013: 76 mg COD/l). Our commitmentOur commitment Treating waste water with bio-digestion Nestlé’s Fawdon confectionary factory in the UK has invested CHF 4.9 million in an anaerobic digestion system, completed in September 2014, which converts solid and liquid sewage waste into clean water and methane gas using natural biological digestion processes. The facility will save 1000 tonnes CO2 every year year, cut solid waste by 4000 kg per day, and reduce effluent discharges by 95%. Financial savings represent CHF 380 000 in effluent charges and CHF 600 000 in electricity charges. Our perspective We are committed to developing our business in a way that helps to safeguard biodiversity and ecosystem services. Nestlé has set ambitious targets for discharged water quality from 2016, and ensuring we meet them is a challenge. We have deployed a water and effluents dashboard focusing on water withdrawal, discharge and quality reporting to support progress. Training and raising awareness among our employees is a priority. Wherever possible, we use municipal wastewater treatment facilities. Where these are non-existent or not efficient enough, we invest in our own facilities to discharge water treated to a level that meets local legislation and/or our internal standards, whichever is more stringent. Nestlé in society24
  • 29. Raise awareness on water conservation and improve access to water and sanitation across our value chain Our objectives By 2015 – Every Nestlé employee has access to safe water, sanitation and hygiene of an appropriate standard at the workplace. By 2016 – 350 000 beneficiaries in local communities will have access to water, sanitation or hygiene projects around our manufacturing facilities and in Farmer Connect areas. Our progress We continue to work with expert partners, including the WBCSD and the International Federation of Red Cross and Red Crescent Societies (IFRC) (see case study below), to improve access to water and sanitation, and in 2014: • we tested the WBCSD self-assessment WASH tool at key manufacturing sites, and • almost 400 000 people (2013: over 300 000) had access to water, sanitation or hygiene around our manufacturing facilities and in Farmer Connect areas meaning we reached our 2016 target early. Through education initiatives, we are helping our employees, suppliers and consumers to improve their understanding of the importance of water conservation and stewardship. In addition to supplier activities (see page 24), during 2014 we have: • delivered a new training programme to our Corporate HR Team (117 people), and made course content available to all employees via the company intranet; • continued our sponsorship of the global water education programme, ‘Project WET’, which expanded its reach in Nigeria to the Osun State; and • marked World Water Day with around 650 employees helping to organise factory events for more than 22 000 children in 32 countries. Providing clean water and sanitation in Côte d’Ivoire Since 2006, the International Federation of Red Cross and Red Crescent Societies and Nestlé have been working together with a particular focus on improving rural communities’ access to water. Through the collaboration, 196 546 people in Côte d’Ivoire’s cocoa communities now have access to clean drinking water and sanitation facilities. In October 2014, we renewed our long- standing collaboration with the IFRC, and will contribute CHF 5 million over five years to the organisation to improve access to sustainable water, sanitation and hygiene services in rural areas, and to extend the project to Ghana. Nestlé was the IFRC’s first corporate partner in 2002. In addition to the ongoing collaboration on water and sanitation, we are also sponsoring the production of the IFRC’s annual World Disaster Report, engaging with national Red Cross and Red Crescent societies and supporting the IFRC’s disaster relief operations (e.g. Ebola in 2014). Our commitment 26 www.wbcsd.org/work-program/sector-projects/water/accesswatersanitation.aspx Our perspective The WHO estimates that every person needs 50 to 100 litres of fresh water per day to meet their basic daily needs. But, today, as estimated by the WBCSD, more than 1.8 billion people depend on unsafe drinking water, and an estimated 4 billion lack access to basic sanitation 26. We agree that lack of access to safe water, sanitation and hygiene can cause illness or death, impair productivity, and restrict markets for some products and services. We believe there is a clear and compelling economic case for businesses to demonstrate leadership by addressing this situation. That is why, last year, Nestlé became one of the first signatories of the WBCSD WASH Pledge, committing to providing access to safe water, sanitation and hygiene at all of our direct workplace premises within three years. By signing the pledge, we restated our own commitment and are encouraging others along the value chain to do the same. If all WBCSD member companies signed the WASH Pledge it would represent 15 million employees. 25