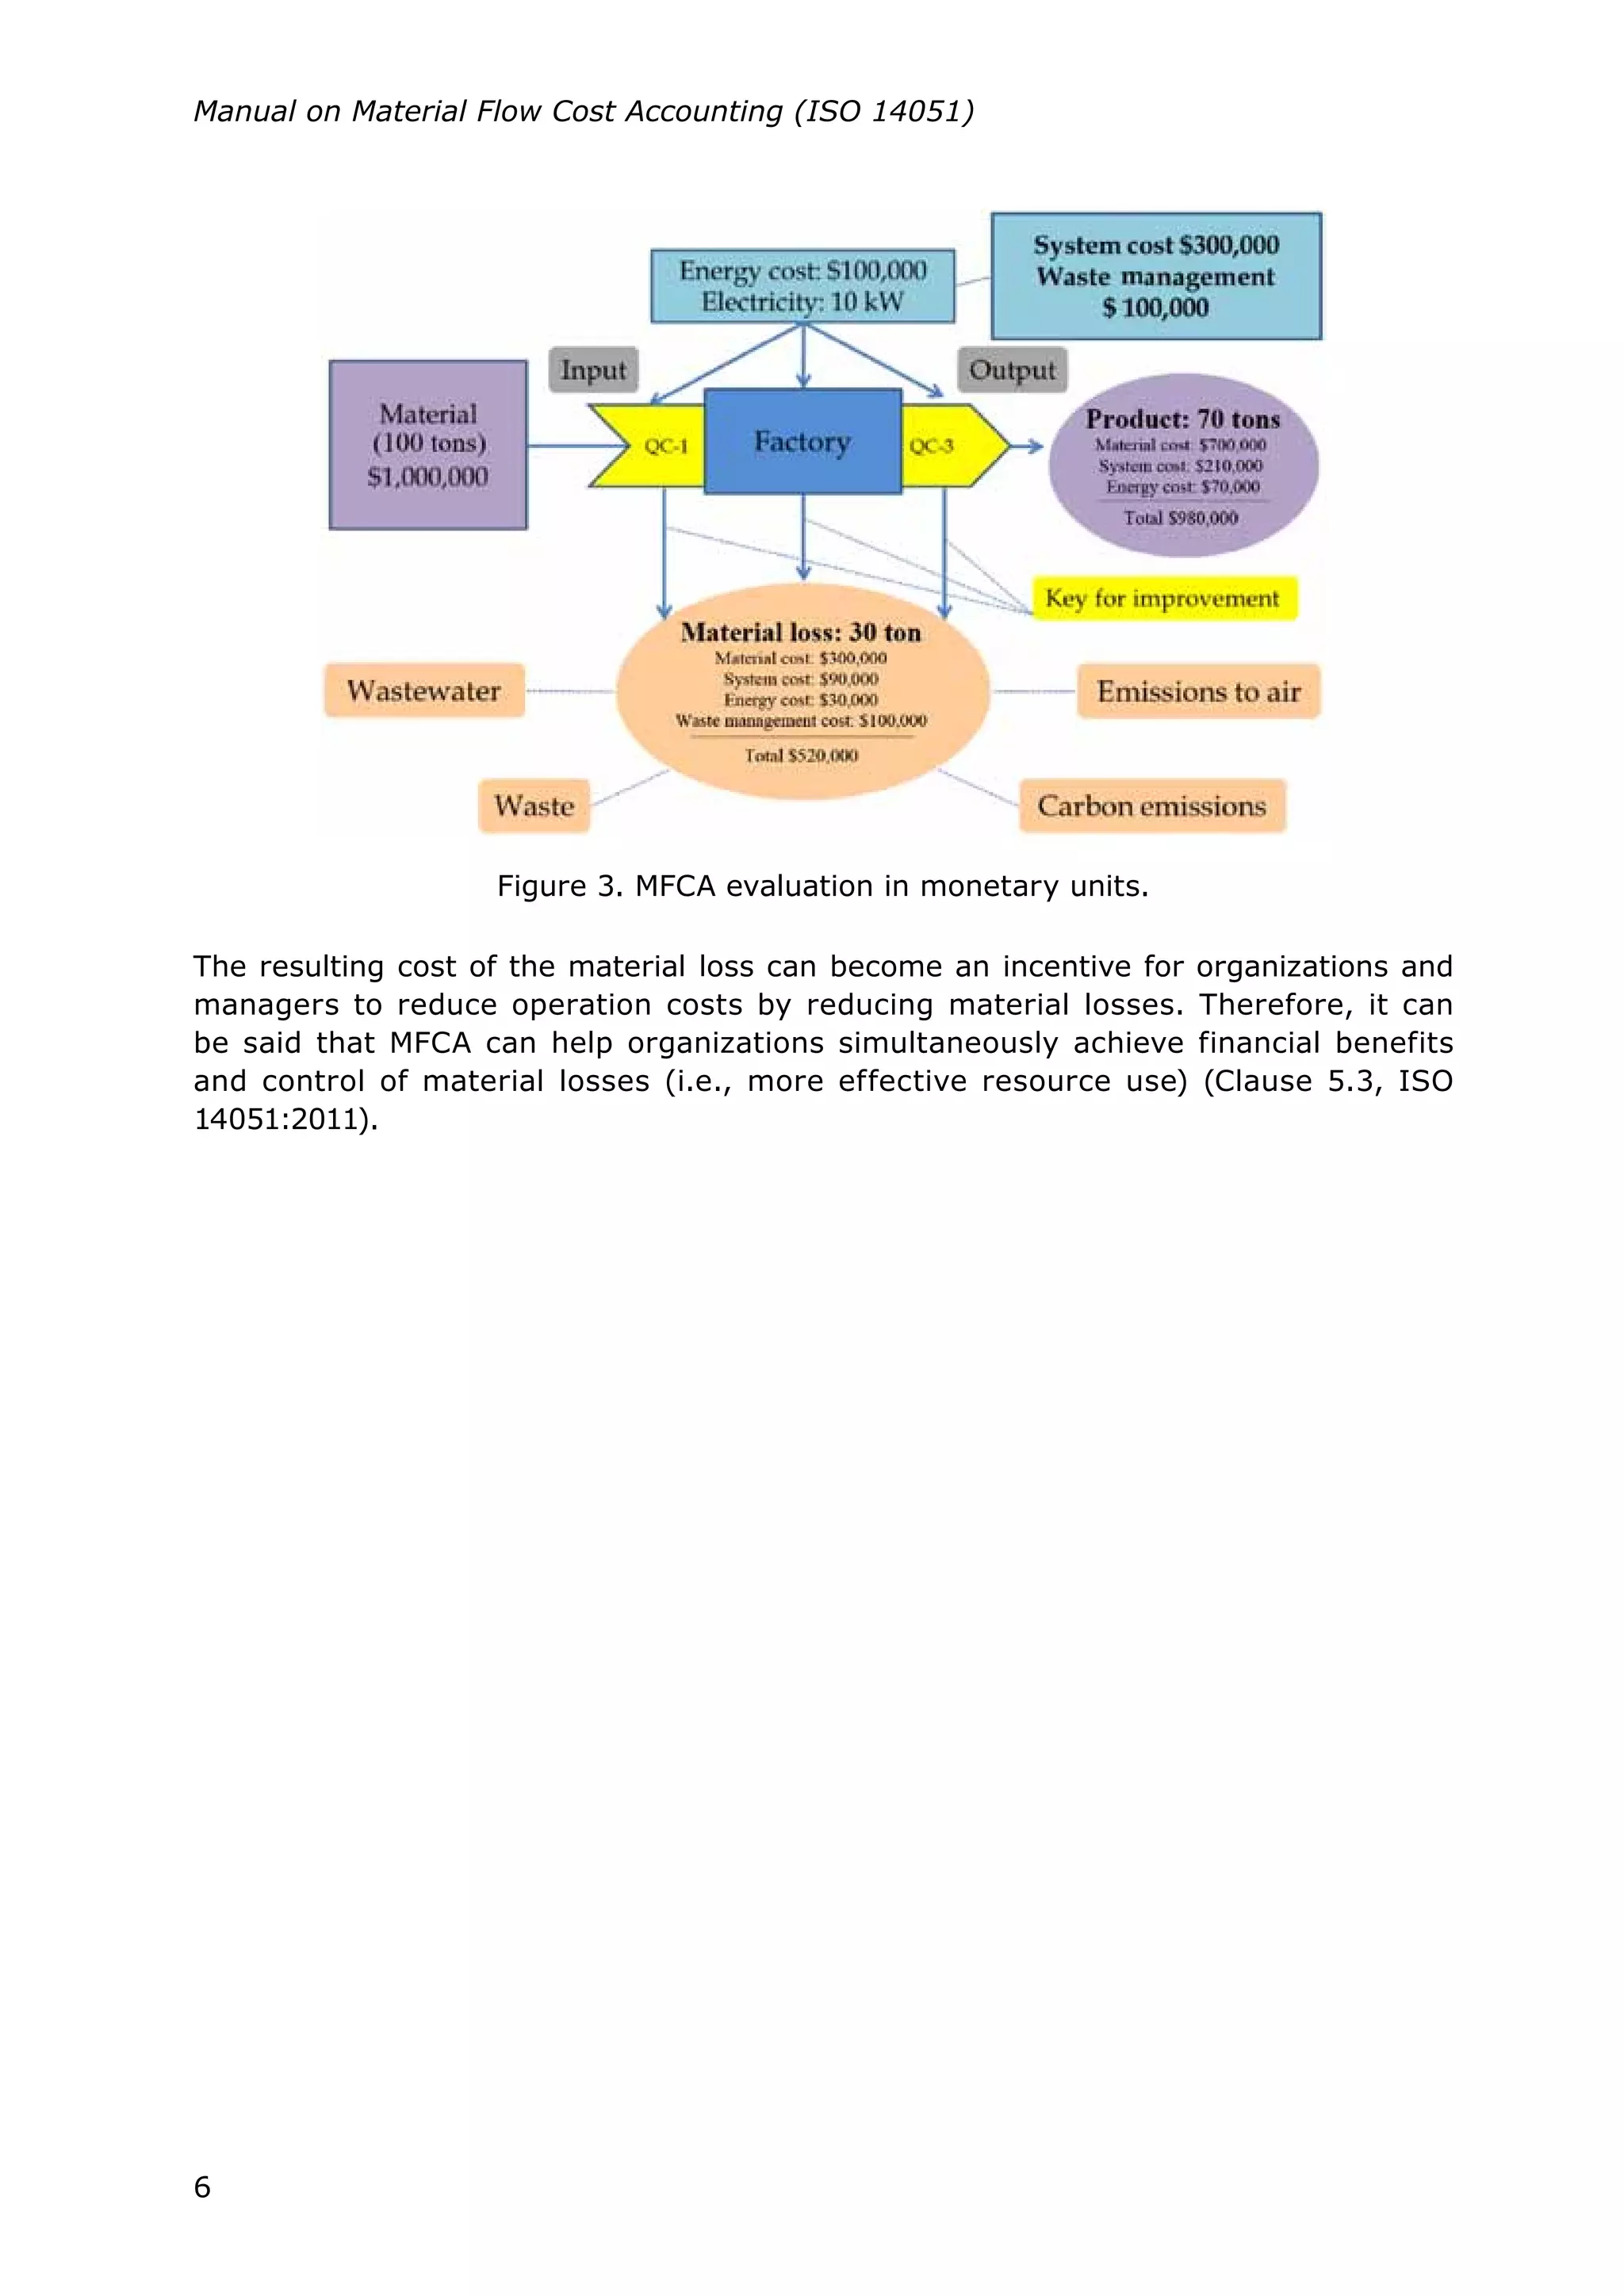
SlideShare a Scribd company logo
1 of 37
Download to read offline
TOKYO
ASIAN PRODUCTIVITY ORGANIZATION
Hiroshi Tachikawa, Japan, served as the volume editor.
First published in Japan
by Asian Productivity Organization
Leaf Sguare Hongo Building 2F
1-24-1 Hongo, Bunkyo-ku
Tokyo 113-0033, Japan
www.apo-tokyo.org
© 2014 Asian Productivity Organization
The views expressed in this publication do not necessarily reflect the official views
of the Asian Productivity Organization (APO) or any APO member. The APO is not
responsible for the accuracy, usability, and safety of its contents.
All rights reserved. None of the contents of this publication may be used, reproduced,
stored, or transferred in any form or by any means for commercial purposes without
prior written permission from the APO.
ISBN 978-92-833-2449-2 (paperback)
ISBN 978-92-833-2450-8 (PDF)
500.09.2014
Designed by Expressions, Inc.
Printed by Hirakawa Kogyosha Co., Ltd., Japan
CONTENTS
What is MFCA? 1
Module 1: General Concept of MFCA 1
Basic Manual on Material Flow Cost Accounting (ISO 14051) xii
Difference between MFCA and Conventional Cost Accounting 3
Module 2: Characteristics of MFCA 3
Terms and Basic Concepts 4
Module 3: ISO 14051: Scope, Terms, and Definitions 4
Principles of MFCA 7
Module 4: ISO 14051: Objectives and Principles of MFCA 7
Fundamental Elements of MFCA 8
Module 5: ISO 14051: Fundamental Elements of MFCA 8
Implementation Step 1: Engaging Management and Determining Roles
and Responsibilities
Implementation Step 2: Scope and Boundary of the Process and
Establishing a Material Flow Model
Implementation Step 3: Cost Allocation
Implementation Step 4: Interpreting and Communicating MFCA Results
Implementation Step 5: Improving Production Practices and Reducing
Material Loss through MFCA Results
11
12
13
14
15
Module 6: ISO 14051: MFCA Implementation Steps 11
MFCA Case Example: Nitto Denko Corporation 17
Foreword v
Introduction: Green Productivity and MFCA vii
v
Material flow cost accounting (MFCA), developed in Germany in the late 1990s and
since adopted widely in Japan, focuses on tracing waste, emissions, and nonproducts
and can help boost an organization’s economic and environmental performance. It is
one of the major tools of environmental management accounting (EMA). EMA is a set
of procedures used within enterprises for linking environmental considerations with
economic objectives. Today, organizations cannot ignore the environmental aspects
of their activities. Consequently, they seek management tools to link concern for
the environment with their bottom lines. MFCA is a management tool that promotes
the efficient use of materials more effectively, contributing to reductions in waste,
emissions, and nonproducts. MFCA increases the transparency of material flow,
which is a key to successful problem-solving and improvement. By solving problems,
organizations can increase their resource productivity and reduce costs at the same
time. This is in line with the Green Productivity (GP) concept and can be used to
implement GP in organizations and factories. The Government of Japan is currently
taking steps to enhance understanding of MFCA and to accelerate its widespread
adoption. MFCA is already in place in more than 300 Japanese companies.
To standardize MFCA practices, a working group of the ISO Technical Committee ISO/
TC 207, Environmental Management, developed ISO 14051, which complements the
ISO 14000 family of environmental management system standards, including life
cycle assessment (ISO 14040, ISO 14044) and environmental performance evaluation
(ISO 14031). The standard was published in the second half of 2011. MFCA has been
receiving increasing attention throughout the Asia-Pacific, including APO member
countries, along with national environmental management concerns. The APO
organized a series of training courses and workshops on MFCA starting from 2011 and
offered a self-learning e-course in 2013.
This Manual on Material Flow Cost Accounting was prepared based on feedback from
and needs of APO member countries. I hope that the publication will be useful to
GP/MFCA practitioners and professionals while promoting sustainable development
practices in the region.
Mari Amano
Secretary-General
Tokyo
September 2014
FOREWORD
vii
INTRODUCTION: GREEN PRODUCTIVITY AND MFCA
K. D. Bhardwaj
APO Senior Program Officer
Green Productivity (GP) was defined by a group of APO experts as “…a strategy for
enhancing productivity and environmental performance for sustainable socioeconomic
development. It is the application of appropriate productivity and environmental
management tools, techniques, and technologies to reduce the environmental impact
of an organization’s activities, products, and services.”
GP is not a new concept but has emerged gradually from the basic concept of
productivity. GP integrates the productivity and environmental concepts to produce
goods in cleaner, greener ways. This also ensures reduced environmental burden and
input costs, along with improved quality and profitability. It is especially important for
small-scale industries because it concentrates upon the preventive approach.
GP can be explained as adoption and implementation of environmentally sound
processes, practices, and procedures to optimize the utilization of resources with
minimum environmental impact. In other words, this concept focuses upon enhancing
productivity without creating adverse environmental impacts. Seen from a different
perspective, improvement of the environment should have beneficial rather than
deleterious effects on the quantity and quality of products. Thus GP stresses optimum
utilization of space, manpower, energy, and raw materials, i.e., all the factors of
production. GP aims at overall socioeconomic development that leads to a sustained
improvement in the quality of life.
NEED FOR GP
Conventional productivity improvement efforts focused on cost-effectiveness through
cost reductions, and environmental protection focused on nonproductive end-of-pipe
(EOP) solutions. With the growing awareness that quality, health, and safety aspects
were involved in productivity improvement in addition to cost, a number of programs
and techniques, like total quality maintenance and total productive maintenance for
equipment maintenance, 5S for structured, systematic housekeeping, and kaizen for
continual improvement were developed. Similarly, compared with conventional EOP
treatment alone, pollution prevention is usually more cost-effective, often resulting in
reduced energy and material usage and costs.
To some extent, productivity practices like preventive maintenance, good
housekeeping, etc. reduce environmental burdens. However, productivity practices and
pollution prevention programs alone cannot manage the total environment and sustain
development. There is a need to integrate productivity improvement into pollution
prevention and control programs for sustainability.
viii
The need for a fundamental change by moving businesses toward resource efficiency
and taking a holistic life-cycle view of products was recognized in the 1990s. Resource
efficiency not only leads to conservation of natural resources but also results in
improved productivity and environmental performance. Therefore, if development is
to be sustainable, we must move beyond preventive approaches and ensure that both
productivity improvement and environmental protection are achieved simultaneously.
Recognizing this, the APO has integrated this approach into the concept of GP.
The goal of GP is to achieve higher levels of productivity to serve the needs of society
and to protect and enhance the quality of environment both locally and globally. GP
leads to gains in profitability through improvements in productivity and environmental
performance. In other words, GP can improve the bottom line of every sector of society.
TRIPLE FOCUS OF GP
GP recognizes the importance of both the environment and development, and the
concept of GP shows that for any development strategy to be sustainable it must have
a focus on quality, profitability, and the environment. Quality is dictated by the voice of
the customer for both goods and services. GP works at ensuring quality by promoting
the use of newer, safer materials, increasing processing and production efficiency, and
improving working conditions.
The intent of GP is thus to provide the consumer with more performance and value
with the use of fewer resources, including energy, and the creation of less waste i.e.,
“doing more with less.”
This makes sense both for the environment and for business. Natural resources are
conserved, thereby reducing environmental degradation in many ways. The cost of
production is also reduced, thereby ensuring profitability. Savings may also come
from lower waste management costs or take the form of avoiding the cost of potential
environmental liabilities.
Figure 1: Triple Focus of GP
ix
BENEFITS OF GP
Implementation of the GP strategy will have both immediate and long-term benefits.
The benefits accrue to producers as well as to consumers and include increased
efficiency gains in resource use, lower costs of production, decreased costs of waste
treatment and disposal, and better quality of products.
The adoption and practice of GP will also provide businesses with a competitive
advantage. It will increase productivity growth rates in business, as a result of which
market share and profitability increase. This shift toward integrating “the environment”
and “productivity” enabled by GP has much greater implications for businesses,
particularly in developing economies due to their technological and resource
constraints. Opening of world markets and increased globalization have intensified the
pressures on businesses, as they must meet international expectations. Workers will
benefit from GP because it improves not only the workplace but also the health and
safety of the labor force.
GP METHODOLOGY
The central element of the GP methodology is the examination and reevaluation of
both production processes and products to reduce their environmental impacts and
highlight ways to improve productivity and product quality. Implementing these options
leads to another cycle of review and so promotes continuous improvement (see Fig. 2).
The GP methodology revolves around the PDCA cycle. The six principle steps of the GP
methodology are:
Step 1: Getting Started
The beginning of the GP process is marked by the formation of a GP team and a walk-
through survey to gain baseline information and identify problem areas. At this stage,
it is vital to get the support of senior management to ensure that adequate manpower
and resources are available for successful GP implementation.
Step 2: Planning
Using the information gained in the walk-through survey along with a number of
analytical tools such as material balance, benchmarking, eco-mapping, and Ishikawa
diagrams, problems and their causes are identified and analyzed. Following this,
objectives and targets are set to address the problem areas. Performance indicators
are also identified.
Step 3: Generation and Evaluation of GP Options
This stage involves the development of options to meet the objectives and targets
formulated in the planning stage. It involves both a review of pollution prevention
and control procedures that have already been devised or implemented and the
development of new options. Options are screened and prioritized in terms of their
economic and technical feasibility and potential benefits. They are then synthesized
into an implementation plan.
Step 4: Implementation of GP Options
The implementation of the selected GP options involves two steps: preparation and
execution. Preparatory steps include training, awareness building, and competence
development. They are followed by the installation of equipment and systems along
with operator instruction and hands-on training.
Step 5: Monitoring and Review
Once the selected GP options have been implemented, it is vital to check whether they
are producing the desired results. This involves monitoring the overall GP system to
ensure that it is proceeding in the right direction and that targets are being achieved
as per the implementation plan. Findings are reported for management review.
Step 6: Sustaining GP
In light of the findings of the GP evaluation, corrective actions can be taken to keep
the GP program on target. In some cases, targets and objectives themselves will have
to be modified. As the program progresses, a feedback system should be implemented
so that new problems and challenges will be highlighted and dealt with. In this way,
the GP cycle will loop back to the relevant step to implement a process of continuous
improvement and ensure the continuing relevance and effectiveness of the GP process.
Figure 2: GP Methodology
x
xi
GREEN PRODUCTIVITY AND MATERIAL FLOW COST ACCOUNTING
MFCA, developed in Germany in the late 1990s and since adopted widely in Japan,
focuses on tracing waste, emissions, and nonproducts and can help boost an
organization’s economic and environmental performance. It is one of the major tools of
environmental management accounting (EMA). EMA is a set of procedures used within
corporations and other organizations for linking environmental considerations with
economic objectives. Today, organizations cannot ignore the environmental aspects
of their activities. Consequently, they seek management tools to link concern for the
environment with economic considerations.
MFCA is a management tool that increases the transparency of material flow, which
is a key to successful problem solving and improvement. By solving problems,
organizations can increase their resource productivity and reduce costs at the
same time. This is in line with the GP concept and can be used to implement GP in
organizations and factories.
BASIC MANUAL ON MATERIAL FLOW COST ACCOUNTING
(ISO 14051)
This manual was prepared to provide basic knowledge and understanding of material
flow cost accounting (MFCA). It intends to be a manual that is comprehensive, up to
date, and consistent with ISO 14051. It is recognized that:
• This manual is not intended to be the one and only manual on learning and applying
MFCA.
• Learning levels and progress depend on the individual’s learning abilities and
exposures to the subject matter.
• Gaining practical experience through project implementation after formal training
will greatly increase the speed and level of competency.
• Sole reliance on the manual is not advisable.
• Measuring, analyzing, and applying practical solutions to problems are subject to
local conditions where MFCA is practiced and applied.
xii
1
WHAT IS MFCA?
MFCA is one of the major tools for environmental management accounting and
promotes increased transparency of material use practices through the development
of a material flow model that traces and quantifies the flows and stocks of materials
within an organization in physical and monetary units.
It is a method of environmental management accounting that simultaneously achieves
“reduced environmental impacts” and “improved business efficiency.” MFCA is
applicable to all industries that use materials and energy, of any type and scale, with
or without environmental management systems in place (Clause 1, ISO 14051:2011).
It can be seen as one alternative for organizations to consider environmental matters,
including material scarcity, climate change, and increasingly stringent environmental
regulations for any business decision and achieve sustainable development.
The method was originally developed in Germany and has been further developed in
Japan. The inclusion of MFCA in the International Organization for Standardization
(ISO) was an initiative from Japan. ISO 14051 was issued in 2011.
MFCA measures the flow and stock of all materials in the manufacturing process in
both monetary and physical terms. The materials include raw materials, parts, and
components. MFCA analysis provides an equivalent comparison of costs associated
with products and costs associated with material losses, for example, waste, air
emissions, wastewater, etc. In many cases, an organization is unaware of the full
extent of the actual cost of material losses because data on material losses and
the associated costs are often difficult to extract from conventional information,
accounting, and environmental management systems. In this way, MFCA enables
organizations to identify material use and their flows within a production process and
assign costs to all of these materials.
Organizations are required to consider the environmental impact of their operations
in every phase of said operations. Recycling, reusing, and reducing have been
actively promoted in recent years and recycling has especially gained support
among organizations trying to reduce the consumption of raw materials and their
environmental impact. Although waste recycling is an effective measure for resource
use, it is not always cost-effective as substantial inputs of energy and other expenses
are often required. From an MFCA perspective, it is essential to reduce waste
generation itself to increase resource use and cost efficiency.
MFCA identifies quantities of each material and its costs (including material,
processing, and waste treatment costs). This enables us to look at each of the sources
of waste generation in a separate way and identify improvement opportunities that
could lead to the reduction of waste generation itself.
Using this information, organizations can identify the costs of losses caused by waste
and other emissions, as well as defective products, and calculate the quantities and
resources used in each process and the costs associated with these processes. MFCA
MODULE 1: GENERAL CONCEPT OF MFCA
2
acts as a strong motivation for organizations to reduce waste and material inputs,
leading to cost reductions and increased productivity.
Reduction of waste generation leads to enhanced environmental performance in
manufacturing processes by highlighting the importance of reducing inputs of raw
materials. Hence, MFCA becomes a tool that allows organizations to establish a link
between the need to reduce resource procurement in order to increase process
efficiency of the operations and the need to reduce environmental impact at the same
time. Therefore, MFCA serves not only as a tool for environmental purposes but also
as a general management tool that helps organizations find ways to reduce their
environmental impact while increasing profitability through cost reductions (Clause 4,
ISO 14051:2011).
While MFCA is primarily designed for use within a single facility or organization, the
approach can be extended to multiple organizations within the supply chain, enabling
them to develop an integrated approach for more efficient use of materials and energy.
3
The differences between MFCA and conventional cost accounting do not mean that MFCA
cannot be applied to any organization that uses materials and energy. In other words,
MFCA does not demand any specific requirement in regard to the type of product,
service, size, structure, or location. In addition, MFCA can be expanded to multiple
organizations belonging to the supply chain. This will enable the organizations to identify
even more opportunities for material reduction as well as higher energy efficiency.
Wider MFCA scope than that for a single entity is especially helpful because waste
generation in an organization is occasionally derived from materials provided by a
supplier or demanded by customers/consumers (Clause A, ISO 14051:2011).
MODULE 2: CHARACTERISTICS OF MFCA
DIFFERENCE BETWEEN MFCA AND CONVENTIONAL COST ACCOUNTING
(Clause A.1, ISO 14051:2011)
MFCA represents a different way of management accounting. In conventional cost
accounting, the data are used to determine whether the incurred costs are recovered
from sales. It does not require determining whether material is transformed into
products, or disposed of as waste. In conventional cost accounting, even if waste is
recognized in terms of quantity, the costs to produce “material losses” are included as
part of the total output cost. On the other hand, MFCA, as explained before, focuses
on identifying and differentiating between the costs associated with “products” and
“material losses.” In this way material loss is evaluated as an economic loss, which
encourages the management to search for ways to reduce material losses and improve
business efficiency.
Table 1. Difference between MFCA and conventional cost accounting.
MFCA calculates the associated with the material losses. (Unit: USD)
MFCA Conventional accounting
Sales 15,000,000 Sales 15,000,000
Product cost 3,000,000 Cost of sales 4,500,000
Material loss cost 1,500,000 N/A N/A
Gross profit 10,500,000 Gross profit 10,500,000
Selling, general, and
administrative expenses*
8,000,000
Selling, general, and
administrative expenses*
8,000,000
Operating profit 2,500,000 Operating profit 2,500,000
4
MODULE 3: ISO 14051: SCOPE, TERMS, AND DEFINITIONS
TERMS AND BASIC CONCEPTS
(Clause 3, ISO 14051:2011)
MFCA is constituted by three main elements, as shown in Figure 1:
	
1. Material
Material refers to any raw material, auxiliary material, component, catalyzer, or part
that is used to manufacture a product. Any material that does not become part of
the final product is considered material loss. In any process, waste and resource loss
occur in different steps of the process, including:
• Material loss during processing, defective products, impurities
• Materials remaining in manufacturing equipment following set-ups
• Auxiliary materials such as solvents, detergents to wash equipment, water
• Raw material that becomes unusable for any reason
2. Flow
MFCA traces all input materials that flow through production processes and measures
products and material loss (waste) in physical units using the following equation:
Input = Products + Material loss (waste)
The starting point of MFCA is to measure the amount of material losses based on
mass balance. The concept is illustrated in Figure 2. In this case, the amount of the
material loss (30 tons) is calculated based on the amount of total input and products
in a selected part of a process in which the inputs and outputs are quantified. This
part of the process is defined as a quantity center in MFCA (i.e., Material loss = Input -
Products), as Figure 2 shows.
Figure 1. Main elements of MFCA. Each element is described below.
5
Manual on Material Flow Cost Accounting (ISO 14051)
Figure 2. Concept of material balance.
Decision-making in organizations typically involves financial considerations. MFCA
supports this point by assigning a monetary value to material losses. In detail, MFCA
allows organizations to see material losses as “products” rather than “waste” even
though they are not marketable. This indicates that costs for both products and
material losses are calculated in an equivalent manner. Therefore, all costs caused by
and/or associated with the material flows entering and leaving a quantity center must
be quantified and assigned or allocated to those material flows (Clauses 3.14, 3.16,
5.2, ISO 14051:2011).
3. Cost Accounting
Under MFCA, the flows and stocks of materials within an organization are traced and
quantified in physical units (e.g., mass, volume) and then assigned an associated cost.
Under MFCA, four types of costs are quantified: material costs, system costs, energy
costs, and waste management costs. Each cost is defined as follows:
• Material cost: cost for a substance that goes through a quantity center
(measurement unit of input and output for MFCA analysis). Typically, the purchase
cost is used as the material cost.
• Energy cost: cost for energy sources such as electricity, fuels, steam, heat,
compressed air.
• System cost: cost incurred in the course of in-house handling of the material flows,
excluding material cost, energy cost, and waste management cost.
• Waste management cost: cost for handling material losses.
Following identification of a physical unit for material flow data, material costs, energy
costs, and system costs are subsequently assigned or allocated to quantity center
outputs (i.e., products and material losses) based on the proportion of the material
input that flows into product and material loss. For example, as illustrated in Figure
3, of the 100 tons of material used, 70 tons flow into product and 30 tons flow into
material loss. Thus, the material distribution percentages of 70% and 30% are used to
allocate energy and system costs to the product and material loss, respectively. In this
example, the material distribution percentage based on mass is used to allocate these
costs. On the other hand, in Figure 3, all waste management costs of $100,000 are
attributed to material loss, since the costs are caused solely by material losses. In the
final analysis, the total cost of material losses in this example is $520,000. This cost is
not separated but included in the cost of the product in conventional costing; the cost
for material loss is not considered except in MFCA.
6
Manual on Material Flow Cost Accounting (ISO 14051)
Figure 3. MFCA evaluation in monetary units.
The resulting cost of the material loss can become an incentive for organizations and
managers to reduce operation costs by reducing material losses. Therefore, it can
be said that MFCA can help organizations simultaneously achieve financial benefits
and control of material losses (i.e., more effective resource use) (Clause 5.3, ISO
14051:2011).
7
MODULE 4: ISO 14051: OBJECTIVES AND PRINCIPLES OF MFCA
PRINCIPLES OF MFCA
(Clause 4.2, ISO 14051:2011)
MFCA can be used to increase the transparency of material flows and energy
use, along with the associated costs and environmental impacts, and to support
organizational decisions through information obtained through MFCA. This can be
achieved by following the four core principles of MFCA methodology.
1. Understand material flow and energy use
The flow of all materials and energy use for each quantity center should be traced to
understand how materials are used and transformed along the whole process.
2. Link physical and monetary data
Through MFCA, the environmental-related decision-making process can be linked
to financial information via the material flow model, which provides a better
understanding of the real costs of material and energy use and results in an improved
decision-making process.
3. Ensure accuracy, completeness, and comparability of physical data
MFCA requires that all data be verified and that all inputs and outputs be identified
and quantified. It is recommended that all data be converted to a common unit. Using
accurate and complete data is critical to identify the cause and source of any gap
between inputs and outputs.
4. Estimate and assign costs to material losses
Real costs should be assigned to all material losses and products. When exact
information is not available, the cost allocation should be as accurate and practical as
possible. In MFCA, the information on costs attributed to material losses represents
one of the main incentives for process improvement.
Figure 4. Principles of MFCA.
8
MODULE 5: ISO 14051: FUNDAMENTAL ELEMENTS OF MFCA
FUNDAMENTAL ELEMENTS OF MFCA
(Clause 5, ISO 14051:2011)
MFCA brings about both environmental and cost-reduction impacts on the organization.
In order to apply MFCA to an organization effectively, the concepts of quantity center,
material balance, cost calculation, and material flow model shown in Figure 5 need to
be incorporated.
Fundamental Element 1: Quantity center (Clause 5.1, ISO 14051:2011)
A quantity center is typically one or multiple unit process(es). The center is the point at
which the material balance will be calculated both in physical and monetary units. One
quantity center can include either a single process or multiple processes, depending on
the amount of the material losses identified at the unit of production.
Furthermore, the quantity centers within the MFCA boundary can be based on
existing production management information, cost center records, and other existing
information. Generally, quantity centers are established in all processes where relevant
material losses or system costs, such as energy for transport, oil, or air pressure
leakages, are identified, then the appropriate process is selected as an additional
quantity center and its inputs and outputs are determined. Typical examples of
quantity centers include points where materials are stocked and/or transformed, such
as storage, production units, waste management, and shipping/receiving points.
Once the inputs and outputs have been identified for each quantity center, they can
be used to connect the quantity centers within the boundary so that data from the
quantity centers can be linked and evaluated across the entire system within the
scope. It is important that material balance be ensured to evaluate material efficiency
in physical and monetary units. The concept of material balance is described in the
following section, Fundamental Element 2: Material balance.
Figure 5. Fundamental elements of MFCA.
9
Module 5: ISO 14051: Fundamental Elements of MFCA
Fundamental Element 2: Material balance (Clause 5.2, ISO 14051:2011)
In MFCA, all material that goes into and leaves the quantity center should be balanced.
Thus, to account for all the materials targeted in the MFCA analysis, the material input
and output need to be confirmed, while comparing the quantities of material inputs to
outputs and changes in the inventory to identify any data gaps. The missing materials
or other data gaps can lead organizations to identify missing points which result in
areas of improvement.
As an example, Figure 6 shows a general material balance around a quantity center. In
this example, a total of 145 kg of material enters the quantity center with an inventory
of 35 kg. Over the time period for analysis, the raw material is distributed between
product (120 kg), material loss (40 kg), and inventory (20 kg).
For each quantity center, the amounts of inputs and outputs should be quantified in
physical units. All physical units should be convertible to a single standardized unit
(e.g., mass) so that material balances can be conducted for each quantity center. It is
preferable to use existing on-site basic units for production management.
A material balance requires that the total amount of outputs (i.e., products and
material losses) be equal to the total amount of inputs, taking into account any
inventory changes within the quantity center. Ideally, all materials within the MFCA
boundary should be traced and quantified. However, in reality, materials that have
minimal environmental or financial significance can be excluded.
Fundamental Element 3: Cost Calculation (Clause 5.3, ISO 14051:2011)
During the decision-making process, financial considerations are often included.
Through MFCA, the material balance of inputs and outputs is linked to monetary units
by assigning and/or allocating costs to all products and material losses. MFCA considers
four types of cost, all of which are allocated to both products and material losses:
• Material costs;
• Energy costs;
• System costs; and
• Waste management costs.
Figure 7 shows an example of cost calculation based on the material balance at one
quantity center in which the total costs of the quantity center are allocated to the
outputs based on the proportion of inputs that becomes a product and the proportion
that becomes part of the material losses.
Figure 6. Example of material balance in a quantity center.
10
Manual on Material Flow Cost Accounting (ISO 14051)
Figure 7. Example of cost calculation in a quantity center.
Fundamental Element 4: Material Flow Model (Clause 5.2, ISO 14051:2011)
It refers to the visual representation of the process that shows all the quantity centers in
which the materials are transformed, stocked, or used, as well as the flow of these materials
within the system boundary. Figure 8 shows an example of a material flow model.
Figure 8. Example of a material flow model for a process within the MFCA boundary.
11
MODULE 6: ISO 14051: MFCA IMPLEMENTATION STEPS
To facilitate implementation, ISO 14051 proposes several MFCA implementation steps
as delineated below. The level of detail and complexity of the analysis will depend
on the size of the organization, nature of the organization’s activities and products,
number of processes, and quantity centers chosen for analysis, among other factors.
These conditions make MFCA a flexible tool that can be applied in a wide range of
organizations, regardless of size or the existence of an environmental management
system (EMS). In fact, the implementation process of MFCA is considered to move
more smoothly and faster if the organization has an existing EMS as it is probable that
material- and waste-related data EW already being collected for analysis.
Furthermore, MFCA can be easily integrated into other EMS as it incorporates the Plan-
Do-Check-Act (PDCA) continual improvement cycle, which is a common approach in many
EMS. MFCA can provide additional information in each of the stages of the PDCA cycle
and enhance the existing EMS. For example, the use of MFCA allows the organization
to include financial considerations in setting objectives and targets. The knowledge of
potential environmental impacts and financial impacts can enhance the quality of the
evaluation, providing useful information for an organization’s decision-making.
IMPLEMENTATION STEP 1: ENGAGING MANAGEMENT AND
DETERMINING ROLES AND RESPONSIBILITIES
(Clause 6.2, 6.3, ISO 14051:2011)
Successful projects usually start with support from the company’s management; MFCA
is not an exception. If the company management understands the benefits of MFCA
and its usefulness in achieving an organization’s environmental and financial targets,
it is easier to gain commitment from the whole organization. In order to be effectively
implemented, it is highly recommended that top management take the lead in MFCA
implementation by assigning roles and responsibilities, including setting up an MFCA
project implementation team, providing resources, monitoring progress, reviewing
results, and deciding on improvement measures based on the MFCA results.
In general terms, management should be engaged in all phases of MFCA implementation
and it is recommended that MFCA projects start with aggressive support from
management, followed by a bottom-up approach on-site, as shown in Figure 9.
Figure 9. Top-down and bottom-up approach.
12
Manual on Material Flow Cost Accounting (ISO 14051)
In addition, successful implementation of MFCA requires collaboration between
different departments within the organization. The reason why collaboration is needed
is because different sources of information are required to complete MFCA analysis.
Through engagement of the company management in the MFCA implementation
process, the required expertise can be determined and the correct flow of information
between all areas involved can be facilitated. The following are typical examples of
expertise that are needed for successful implementation of MFCA:
• Operational expertise on the flow of input materials and energy use throughout the
target process;
• Technical expertise on material-related implications of processes, including
combustion and other chemical reactions;
• Quality control expertise on various issues, such as frequency of product rejects,
causes, as well as rework activities, maintenance, and other quality assurance data;
• Environmental expertise on environmental impacts; and
• Accounting expertise on cost accounting data.
IMPLEMENTATION STEP 2: SCOPE AND BOUNDARY OF THE PROCESS
AND ESTABLISHING A MATERIAL FLOW MODEL
(Clauses 6.4, 6.5, ISO 14051:2011)
Based on collected material flow data, the MFCA boundary needs to be specified to
understand clearly the scale of MFCA activity. During implementation, it is usually
recommended to focus on specific products or processes at the beginning and then
expanding implementation to other products. By implementing MFCA in steps, the
analysis is simplified and better results can be achieved.
The boundary can be limited to a single process, multiple processes, an entire facility,
or a supply chain. It is recommended that the process or processes that are chosen
for initial implementation be the ones with potentially significant environmental and
economic impacts. After specifying the boundary, the process should be classified in
quantity centers using process information and procurement records. In MFCA, the
quantity center is the part of the process in which inputs and outputs are quantified.
In most cases, quantity centers represent parts of the process in which materials are
transformed. If the material flow between two processes is the source of significant
material loss, the flow can be classified as a separate material flow.
After determining the boundary and quantity centers, a time period for MFCA data
collection needs to be specified. While MFCA does not indicate the period during which
data must be collected for analysis, it should be sufficiently long to allow meaningful
data to be collected and to minimize the impact of any significant process variation
that can affect the reliability and usability of the data, such as seasonal fluctuations.
Several historical MFCA projects indicate that the appropriate data collection period
can be as short as a month, with a half-year or a year of data collection being the
most common.
In MFCA, production, recycling, and other systems are represented by visual models
that illustrate MFCA boundary and multiple quantity centers where materials are
stocked, used, or transformed, as well as the movements of materials between those
quantity centers.
13
Module 6: ISO 14051: MFCA Implementation Steps
Figure 10. Material flow model for a process within the MFCA boundary.
Figure 10 shows a general material flow system. The material flow model is useful to
provide an overview of an entire process and to identify the points where material
losses occur. Products include finished products from the entire system, intermediate
products, and material inputs to other quantity centers. For each quantity center,
material balance-based verification should be conducted to understand material-related
efficiency. The material flow model is not necessarily visualized by computer; the model
can be made on paper and with Post-It Notes for discussion among project members.
IMPLEMENTATION STEP 3: COST ALLOCATION
(Clauses 5.3, 6.8, ISO 14051:2011)
MFCA divides costs into the following categories:
• Material cost: cost for a substance that enters and/or leaves a quantity center
• Energy cost: cost for electricity, fuel, steam, heat, and compressed air
• System cost: Cost of labor, cost of depreciation and maintenance, and cost of transport
• Waste management cost: cost of handling waste generated in a quantity center
Material costs, energy costs, and system costs are assigned or allocated to either
products or material losses at each quantity center based on the proportion of the
material input that flows into product and material loss. The material costs for each
input and output flow are quantified by multiplying the physical amount of the material
flow by the unit cost of the material over the time period chosen for the analysis. When
quantifying the material costs for products and material losses, the material costs
associated with any changes in material inventory within the quantity center should
also be quantified. In contrast to material, energy, and system costs that are assigned
to products and material losses proportionally, 100% of the waste management costs
are attributed to material loss, since the costs represent the costs of managing this
material loss.
In most cases, costs such as energy costs, system costs, and waste management
costs are only available for an entire process or facility, and allocating or attributing
these costs to each specific product and material loss is challenging. If costs for each
14
Manual on Material Flow Cost Accounting (ISO 14051)
quantity center are unknown and difficult to calculate or estimate, it is possible to
distribute the total respective costs of the specific processes to the quantity centers
and subsequently allocate them to products and material losses, following the next
simple steps:
1.	 Allocation of overall (e.g., process-wide, facility-wide) costs to each quantity center; and
2.	 Allocation of costs to products and material losses
Each organization will need to decide the allocation criteria that best fits its needs
and the scope of the project. Accordingly, during each allocation step, an appropriate
allocation criterion should be selected. The criterion chosen should reflect the costs
being allocated as closely to the real process as possible.
When process-wide or facility-wide costs are being allocated to quantity centers, machine
hours, production volume, number of employees, labor hours, number of jobs performed,
or floor space can be considered as appropriate examples of allocation criteria. For the
second step, allocation of costs in a quantity center to products and material losses, it is
common to allocate costs based on the material distribution percentage. In other words,
costs follow the same ratio as the material balance in physical units.
Once costs have been allocated to all inputs, the cost analysis should be incorporated
to the material flow analysis. By doing so, the output from one quantity center
becomes the input of the following quantity center. The material cost that enters a
quantity center should reflect the combination of the material costs, energy costs,
and system costs from the previous quantity center. Carryover cost items can be
expressed separately as material cost, energy cost, and system cost.
IMPLEMENTATION STEP 4: INTERPRETING AND COMMUNICATING
MFCA RESULTS
(Clauses 6.9, 6.10, ISO 14051:2011)
MFCA implementation provides information such as material loss throughout the
process, the use of materials that do not become products, overall costs, and
energy and system costs associated with the material loss. This information brings
about multiple impacts by increasing the awareness of the company’s operations.
Managers who are aware of the costs associated with material losses can then identify
opportunities to increase efficiency in material use and improve business performance.
Through the identification of MFCA issues that lead to material losses, organizations
have a chance to identify the resulting economic loss, which is usually overlooked
when relying solely on conventional cost accounting.
While most organizations monitor the yield rate associated with the materials used
in the process, the general scope of such monitoring only covers the main materials,
processes, or losses in many cases. They often control the main materials without
monitoring the amounts of use or loss in auxiliary or operating materials. On-site
operators may see materials being lost, whereas managers of the manufacturing,
production engineering, and product design departments are not aware of such losses.
This happens because the organization’s conventional management practices only
focus on the handling of waste when there are costs associated with its management.
In such cases, MFCA helps organizations highlight uncontrolled material losses.
15
Module 6: ISO 14051: MFCA Implementation Steps
The physical and monetary quantification of the material flow can be summarized in a
format that is suitable for further interpretation, for example, in a material flow cost
matrix. The data should first be summarized for each quantity center separately. Table
2 illustrates a format of the summary of the MFCA data for a quantity center.
Table 2. Example of a material flow cost matrix for a quantity center.
Cost Material Energy System
Waste
management
Total
Product Amount
(65%)
Amount
(65%)
Amount
(65%)
N/A Total product
(60%)
Material loss
Amount
(35%)
Amount
(35%)
Amount
(35%)
Amount
(100%)
Total material
loss
(40%)
Total
Amount
(100%)
Amount
(100%)
Amount
(100%)
Amount
(100%)
Total (100%)
In general, the review and interpretation of summarized data will allow the organization
to identify quantity centers with material losses that have a significant environmental
or financial impact. These quantity centers can be analyzed in more detail (i.e., root
cause for sources of material loss). Data from individual quantity centers can also be
aggregated for the entire target process being analyzed.
After the MFCA analysis is completed, the results should be communicated to all
relevant stakeholders. In addition, management can use MFCA information to support
many different types of decisions aimed at improving both environmental and financial
performance. Communicating the results to the organization’s employees can be useful
in explaining any process or organizational changes and gain full commitment from all
members of the organization (Clauses 6.9, 6.10, ISO 14051:2011).
IMPLEMENTATION STEP 5: IMPROVING PRODUCTION PRACTICES
AND REDUCING MATERIAL LOSS THROUGH MFCA RESULTS
(Clause 6.11, ISO 14051:2011)
Once MFCA analysis has assisted an organization to understand the magnitude,
consequences, and drivers of material use and loss, the organization may review the
MFCA data and seek opportunities to improve environmental and financial performance.
The measures taken to achieve these improvements can include substitution of
materials; modification of processes, production lines, or products; and intensified
research and development activities related to material and energy efficiency.
MFCA data can be used to support the cost-benefit analysis of proposed measures,
both those requiring additional investment and those requiring little or no initial
investment (e.g., process standardization, process improvement).
Additionally, MFCA implementation can also be used as an opportunity to pursue
improvements in the organization’s accounting and information systems. After
implementing MFCA for the first time, organizations can identify ways to access more
systematized data for all future projects to avoid some manual data collection and
analysis. This can facilitate further implementation of MFCA, and system improvements
16
Manual on Material Flow Cost Accounting (ISO 14051)
can be pursued. Possible system improvements that are discovered during MFCA
implementation must be noted and included in the overall analysis.
By applying MFCA, financial costs such as processing and material losses are identified.
In many cases, the scale of the identified costs is more significant than previously
assumed. At the same time, MFCA presents an ultimate target for engineers: “the zero
material loss cost,” which can encourage the organization to make a breakthrough in
the recognition of the necessity for improvement. The typical losses identified by MFCA
include the following:
1.	 Waste treatment cost for material loss;
2.	 Procurement cost for material losses sold to external recycling contractors;
3.	 System cost for material losses (labor, depreciation, fuel, utility and other costs);
4.	 System cost required for internal recycling of materials; and
5.	 Material and system costs for in-stock products, work-in-progress materials,
materials that were disposed of due to a switch to a newer model, deterioration of
quality, or for aging stock.
Through MFCA implementation in several companies of different industries and sizes,
it has been found that only a few companies control auxiliary materials on a corporate
basis. Auxiliary and operating materials are often managed on a process or equipment
basis, and the quantities of materials input (and loss) for each model are rarely
accounted for. In some cases, such quantities are managed in the unit of production
lot. The overall waste treatment cost is generally managed on a factory basis by waste
type. However, some companies identify such cost by material type, product model,
and process type.
Furthermore, companies are often unaware of losses associated with recyclable waste
because such waste is reused as resources and sometimes sold as valuable material to
external recyclers.
17
MFCA CASE EXAMPLE: NITTO DENKO CORPORATION
This case example shows actual implementation of MFCA in accordance with the
implementation steps described in the previous section.
Nitto Denko Corporation (hereafter “Nitto”) is a leading Japanese diversified materials
manufacturer that provides a wide range of products including tapes, vinyl, LCDs,
insulation, and reverse osmosis membranes. Nitto was the first model company that
introduced MFCA with the support of the Japanese Ministry of Economy, Trade and
Industry (METI) in the early 2000s.
Step 1: Engaging Management and Determining Roles and Responsibilities
(Clause 6.2, 6.3, ISO 14051:2011)
Nitto has always been committed to enhancing efficiency and minimizing the
environmental impacts of its operations. As a part of environmental management
activities, Nitto found that its environmental accounting system was not fully
representative of the total environmental impact costs of operations. The reason was
that only environmental conservation costs were being considered, and some costs
associated with environmental impacts remained hidden. Figure 11 shows that the
environmental conservation costs used for conventional environmental accounting
only represented 1.6% of total sales in 2005. However, other costs, such as energy
consumption costs associated with environmental impacts are usually allocated to
production costs. In the case of Nitto, these costs represented around 13.6% of total
sales, which is significantly higher than the environmental conservation costs (1.6%).
Figure 11. Composition of total sales (nonconsolidated basis, FY 2005).
Source: Nitto Denko Corporation.
At the time, the company was looking for alternatives for its existing conventional
environmental accounting, when METI introduced MFCA to Nitto. At the initial phase
of the project, top management (CEO of the company) showed strong interest in and
commitment to the project. One of the reasons for the strong CEO commitment was
18
Manual on Material Flow Cost Accounting (ISO 14051)
in understanding the importance of the “mottainai” concept. Mottainai is a traditional
Japanese concept that conveys a sense of regret about waste from any activity. For
example, Japanese say mottainai when they witness waste, and therefore people make
more effort to avoid it.
For full implementation of the project, the CEO designated a main key person in the
field of the sustainability management as team leader. The implementation team
leader was in charge of providing basic training to people at the manufacturing site and
guide MFCA implementation for the target process. Actual implementation activities
are described in the following sections.
Step 2: Scope and Boundary of the Process and Establishing a Material Flow
Model (Clauses 6.4, 6.5, ISO 14051:2011)
During the target product selection process, Nitto decided to focus on a product that
showed an upward trend in the market, its production lines generated a high amount
of material losses, and had production lines that consumed substantial amounts of
energy in the manufacturing process. Based on these criteria, the adhesive tape used
in electronics produced at the Toyohashi Plant was selected as the target product for
MFCA implementation.
The adhesive tape consists of a three-layered structure composed of a base material,
an adhesive compound, and a separator. Its manufacturing process starts from
creating the adhesive compound. Sheets are then created by coating the base material
and separator with the adhesive compound. This sheet is cut to the correct length and
width based on product specifications and shipped as finished adhesive tape. Losses in
the length and width directions are incurred in the cutting process.
Figure 12. Applicable product.
Source: Nitto Denko Corporation.
As a first step, month-long data were collected for MFCA analysis. However,
recommended MFCA implementation should follow the PDCA continual cycle, and
therefore three-month and six-month data were collected and analyzed.
19
MFCA Case Example: Nitto Denko Corporation
Determination of Quantity Centers (Clause 6.5 and 6.7, ISO 14051:2011)
After selecting the target product, as suggested by the MFCA implementation steps,
quantity centers of the process were decided. Quantity centers should be established
based on loss analysis and process analysis and not purely for data collection. In
the MFCA methodology, one quantity center should usually be set up per production
process. In this process, Nitto identified some benefits in integrating several processes
into one quantity center from the perspective of the “man-hour”-“accuracy” balance.
Using the process flow from the adhesive tape production as shown in Figure 13, the
MFCA implementation team decided to divide the process into five quantity centers:
1.	 dissolution/batch blending process;
2.	 coating/drying process;
3.	 store process;
4.	 slitting process; and
5.	 inspection/packing process.
After the quantity centers were selected, Nitto collected data for verification of the
amount of inputs and outputs in physical units by doing a material balance.
Figure 13. Material flow model.
Source: Nitto Denko Corporation.
20
Manual on Material Flow Cost Accounting (ISO 14051)
Collection of energy costs, system costs, and disposal costs
Once material costs were identified and allocated to each material, energy costs,
system costs, and disposal costs for each quantity center were collected. Some of the
information is only available for the complete process and had to be allocated to each
material following the criteria shown in Table 3.
Table 3. Allocation bases.
Source: Nitto Denko Corporation.
Figure 14. Material flow model with data.
Source: Nitto Denko Corporation.
Step 3: Cost Allocation (Clause 5.3, 6.8, ISO 14051:2011)
Costs were classified into four cost elements: 1) material costs, 2) energy costs
(separate from material costs), 3) system costs, and 4) waste disposal costs (delivery/
disposal costs). To determine material costs, the physical amount of input materials
in each quantity center was multiplied by their unit costs. Material cost flows were
tracked through each quantity center, as shown in Figure 14.
Cost elements Allocation base Allocation type
Energy (electricity) Consumption B
Energy (fuel) Consumption B
Labor (regular employees) Man-hours A
Labor (part-timers) Man-hours A
Depreciation (straight-line method) Operating time B
Maintenance Expenditure C
Tools and implements Expenditure C
A:Allocation based on real data.
B:Allocation based on monthly data (as accurate as possible).
C:Apportionment based on monthly data.
21
MFCA Case Example: Nitto Denko Corporation
Table 4. Flow cost matrix. Period: from November 1 to 30, 2000 (unit: yen).
Source: Nitto Denko Corporation.
All collected costs are allocated to products and to material losses following the
material flow obtained through the material balance. In this process, Nitto decided to
allocate energy costs and system costs based on the product/material loss ratio in
physical units. Following the MFCA methodology, all disposal costs were allocated to
material loss rather than using the allocation based on the proportion of material that
becomes product and material loss, as used for energy and system costs.
Step 4: Interpreting and Communicating MFCA Results
(Clauses 6.9, 6.10, ISO 14051:2011)
After collecting all data in physical and monetary units and making the material
balance of the quantity center, the implementation team prepared a material flow cost
matrix in which all costs were classified as part of the products or material losses. The
main purpose of the matrix is to provide the results of the MFCA analysis in a format
that can be easily interpreted by the entire organization.
For the selected process, the proportion of positive products to negative products was
67.17% to 32.83%, as shown in Table 4.
Material flow profit-and-loss statement
In addition to the material flow cost matrix, Nitto used the results from the MFCA
analysis to create a new profit-and-loss (PL) statement based on MFCA. Table 5
compares material flow PL with conventional PL in which material flow PL refers to the
profit-and-loss statement using MFCA and conventional PL refers to the profit-and-loss
statement used by Nitto before MFCA implementation.
Cost Material Energy System Disposal Total
Positive
products
2,499,944
(68.29%)
57,354
(68.29%)
480,200
(68.29%) NA
3,037,498
(67.17%)
Negative
products
1,160,830
(31.71%)
26,632
(31.71%)
222,978
(31.71%)
74,030
(100%)
1,484,470
(32.83%)
Total
3,660,774
(100%)
83,986
(100%)
703,178
(100%)
74,030
(100%)
4,521,968
100%
22
Manual on Material Flow Cost Accounting (ISO 14051)
Table 5. Comparison of profit-and-loss statements.
Period: from November 1 to 30, 2000 (unit: yen).
Under material flow PL, the cost of goods sold (cost of positive products) and the cost
of waste (cost of negative products) were calculated as ¥3,037,498 and ¥1,484,670,
respectively. Assuming that total sales were ¥15,000,000 and sales and administrative
costs were ¥8,000,000, the operating income was ¥2,478,032.
In the material flow PL, a clear distinction between the cost of positive and negative
products was seen. Nitto was able to identify the real costs of the negative products
and work on strategies to increase its profits by reducing the cost of negative
products. The material flow PL was used by the implementation team as a tool to
stimulate the rest of the organization to consider how to convert the cost of negative
products into profits and to direct their attention to continuous improvement.
Under conventional cost accounting, all costs were allocated to the final product.
Conventional cost accounting considers that only finished (non-defective) products
have the capacity to recover the cost of goods that were used. Costs associated with
material loss, such as unused materials, are usually included under the production
costs. Through the conventional cost accounting, costs for the material loss remain
hidden and cannot be fully understood. Conversely, MFCA provides information not
only on the costs associated with the final product but also with the material loss. The
difference between MFCA-based PL and conventional PL is shown in Table 5.
Step 5: Improving Production Practices and Reducing Material Loss through
MFCA Results (Clause 6.11, ISO 14051:2011)
Through MFCA, Nitto was able to recognize its material losses and the costs
associated with these losses accurately. This information became an incentive for
Nitto to improve the material productivity of this manufacturing line. Thus, the
implementation team decided to set up its kaizen plan on the basis of a cost/benefit
analysis using the physical and cost data under MFCA. Figure 15 shows the cost of
negative products broken down by factor, and countermeasures were subsequently
planned and implemented.
*Provisional figure.
Source: Nitto Denko Corporation.
Material flow P/L (unit: yen) Material flow P/L (unit: yen)
Sales* 15,000,000 Sales* 15,000,000
Cost of positive products 3,037,498 Cost of sales 4,521,968
Cost of negative products 1,484,470 N/A N/A
Gross profit 10,478,032 Gross profit 10,478,032
Selling, general, and
administrative expenses*
8,000,000
Selling, general, and
administrative expenses*
8,000,000
Operating profit 2,478,032 Operating profit 2,478,032
23
MFCA Case Example: Nitto Denko Corporation
Cost of positive products (products) :
cost of negative products (material losses) = 67% : 33%
Capital investment decisions
Nitto conducted an assessment of its capital investments amid the implementation
of these measures and decided on an additional ¥700 million capital investment. The
results of the implementation of improvement measures are shown in Table 6.
The proportion of positive products increased by 10%. There was, however, much
room for improvement and the company decided to introduce a continuous MFCA
analysis in this process. Improvement targets are updated on a yearly basis.
Figure 15. Loss analysis.
Source: Nitto Denko Corporation.
24
Manual on Material Flow Cost Accounting (ISO 14051)
Table 6. Implementation results: Improvement of material productivity through MFCA by Nitto (cost basis).
Source: Nitto Denko Corporation.
2001 2004 2013 (target)
Positive products 67%
78%
(+11%)
90%
(+23%)
Negative products 33%
22%
(-11%)
10%
(-23%)
Total 100% 100% 100%
Outcome of MFCA implementation
After completing the project, Nitto recognized the potential of MFCA as a management
tool. In particular, Nitto recognized the following points:
1.	 MFCA can support the pursuit of company-wide goals.
2.	 It is necessary to convert physical and monetary data units into a standardized
unit along their flow.
3.	 It pursues the flow of materials, energy, and system costs in a process from start
to finish.
4.	 MFCA can help clarify losses in terms of cost and enables managers to set clear
targets for improvement.
5.	 MFCA provides a way to identify potential cost reductions and positive impacts on
the environment.
6.	 MFCA contributes to increased material productivity and strengthened
competitiveness.
7.	 MFCA provides relevant, useful information for equipment investment appraisal
and design for the environment.
In MFCA, processing costs and indirect costs that are included in waste, such as
system costs, are also taken into account. This enables companies to clarify the costs
associated with emissions as waste. In other words, there are no losses that are
ignored as in conventional cost accounting and all losses are within the scope targeted
for improvement.
Material flow data, which recognize the quantity and cost of waste via each quantity
center, provide a clear picture of the issues and bottlenecks in the manufacturing
process. By settling such issues and converting the flow of negative products into
positive products, companies can simultaneously achieve a reduction in environmental
impact and an increase in profit.
This also enables companies to recognize that the cost of waste will vary depending on
where it is generated, even if the total quantity of waste remains constant. From this
point of view, companies can comprehend which manufacturing processes most need
improvement or reform, and it becomes possible to estimate a pertinent investment
amount and secure funds for such investments.
25
MFCA Case Example: Nitto Denko Corporation
Figure 16 shows the summary of the implementation of MFCA and how Nitto was able
to identify material losses that served as valuable information for capital investment
decisions and achieving lower costs and fewer environmental impacts.
Figure 16. Implementation summary.
Source: Nitto Denko Corporation.
Manual on material_flow_cost_accounting_iso 14051-2014

More Related Content

What's hot

Sales & operations planning
Sales & operations planningSales & operations planning
Sales & operations planningShreyas Nair
 
Sustainable Public Procurement
Sustainable Public ProcurementSustainable Public Procurement
Sustainable Public ProcurementOECD Environment
 
Just In Time and Lean Operation Chapter Presentation
Just In Time and Lean Operation Chapter PresentationJust In Time and Lean Operation Chapter Presentation
Just In Time and Lean Operation Chapter PresentationSINGHZEE
 
ePMO Workshop - Ali Kaabi
ePMO Workshop - Ali KaabiePMO Workshop - Ali Kaabi
ePMO Workshop - Ali KaabiAli Kaabi
 
CSR MEC600 ENGINEERS IN SOCIETY DEC 2020- JAN 2021
CSR MEC600 ENGINEERS IN SOCIETY DEC 2020- JAN 2021 CSR MEC600 ENGINEERS IN SOCIETY DEC 2020- JAN 2021
CSR MEC600 ENGINEERS IN SOCIETY DEC 2020- JAN 2021 Bulan Abdullah (Ir)(Dr.)
 
Value stream mapping- lean manufacturing tool
Value stream mapping- lean manufacturing toolValue stream mapping- lean manufacturing tool
Value stream mapping- lean manufacturing toolbhanutomar
 
Restriction of hazardous substances - an overview
Restriction of hazardous substances - an overviewRestriction of hazardous substances - an overview
Restriction of hazardous substances - an overviewAmit Ghai
 
Production planning and control - Basic concepts
Production planning and control - Basic conceptsProduction planning and control - Basic concepts
Production planning and control - Basic conceptsgokulfea
 
Lean Manufacturing Overview - MBA Consulting Class
Lean Manufacturing Overview - MBA Consulting ClassLean Manufacturing Overview - MBA Consulting Class
Lean Manufacturing Overview - MBA Consulting ClassSam Bishop
 
Implementing a Project Office Management
Implementing a Project Office ManagementImplementing a Project Office Management
Implementing a Project Office ManagementRicardo Viana Vargas
 
Process planning SMED and VSM: Single minute exchange of die and Value stream...
Process planning SMED and VSM: Single minute exchange of die and Value stream...Process planning SMED and VSM: Single minute exchange of die and Value stream...
Process planning SMED and VSM: Single minute exchange of die and Value stream...Yatinkumar Patel
 
World Class Manufacturing Final June 23.pptx
World Class Manufacturing Final  June 23.pptxWorld Class Manufacturing Final  June 23.pptx
World Class Manufacturing Final June 23.pptxShantilal Hajeri
 
Principles of program governance
Principles of program governancePrinciples of program governance
Principles of program governanceGlen Alleman
 
Gilbert silvius sustainability in project management
Gilbert silvius   sustainability in project managementGilbert silvius   sustainability in project management
Gilbert silvius sustainability in project managementPMInstituteIndia
 

What's hot (20)

Sales & operations planning
Sales & operations planningSales & operations planning
Sales & operations planning
 
Heizer supp 06
Heizer supp 06Heizer supp 06
Heizer supp 06
 
Sustainable Public Procurement
Sustainable Public ProcurementSustainable Public Procurement
Sustainable Public Procurement
 
Just In Time and Lean Operation Chapter Presentation
Just In Time and Lean Operation Chapter PresentationJust In Time and Lean Operation Chapter Presentation
Just In Time and Lean Operation Chapter Presentation
 
ePMO Workshop - Ali Kaabi
ePMO Workshop - Ali KaabiePMO Workshop - Ali Kaabi
ePMO Workshop - Ali Kaabi
 
Heizer 13
Heizer 13Heizer 13
Heizer 13
 
CSR MEC600 ENGINEERS IN SOCIETY DEC 2020- JAN 2021
CSR MEC600 ENGINEERS IN SOCIETY DEC 2020- JAN 2021 CSR MEC600 ENGINEERS IN SOCIETY DEC 2020- JAN 2021
CSR MEC600 ENGINEERS IN SOCIETY DEC 2020- JAN 2021
 
Value stream mapping- lean manufacturing tool
Value stream mapping- lean manufacturing toolValue stream mapping- lean manufacturing tool
Value stream mapping- lean manufacturing tool
 
TQM & JIT
TQM & JITTQM & JIT
TQM & JIT
 
Restriction of hazardous substances - an overview
Restriction of hazardous substances - an overviewRestriction of hazardous substances - an overview
Restriction of hazardous substances - an overview
 
Production planning and control - Basic concepts
Production planning and control - Basic conceptsProduction planning and control - Basic concepts
Production planning and control - Basic concepts
 
ادارة المشاريع
ادارة المشاريعادارة المشاريع
ادارة المشاريع
 
Lean Manufacturing Overview - MBA Consulting Class
Lean Manufacturing Overview - MBA Consulting ClassLean Manufacturing Overview - MBA Consulting Class
Lean Manufacturing Overview - MBA Consulting Class
 
What is lean management?
What is lean management?What is lean management?
What is lean management?
 
Implementing a Project Office Management
Implementing a Project Office ManagementImplementing a Project Office Management
Implementing a Project Office Management
 
Process planning SMED and VSM: Single minute exchange of die and Value stream...
Process planning SMED and VSM: Single minute exchange of die and Value stream...Process planning SMED and VSM: Single minute exchange of die and Value stream...
Process planning SMED and VSM: Single minute exchange of die and Value stream...
 
World Class Manufacturing Final June 23.pptx
World Class Manufacturing Final  June 23.pptxWorld Class Manufacturing Final  June 23.pptx
World Class Manufacturing Final June 23.pptx
 
Lean Production
Lean ProductionLean Production
Lean Production
 
Principles of program governance
Principles of program governancePrinciples of program governance
Principles of program governance
 
Gilbert silvius sustainability in project management
Gilbert silvius   sustainability in project managementGilbert silvius   sustainability in project management
Gilbert silvius sustainability in project management
 

Viewers also liked

Handbook on-productivity-2015
Handbook on-productivity-2015Handbook on-productivity-2015
Handbook on-productivity-2015zubeditufail
 
Green Productivity and Green Supply Chain Manual
Green Productivity and Green Supply Chain ManualGreen Productivity and Green Supply Chain Manual
Green Productivity and Green Supply Chain Manualzubeditufail
 
Productivity, economy, and role of engineers and how to business in asia
Productivity, economy, and role of engineers and how to business in asiaProductivity, economy, and role of engineers and how to business in asia
Productivity, economy, and role of engineers and how to business in asiaRojarsharin
 
K d bhardwaj green productivity presentation
K d bhardwaj green productivity presentationK d bhardwaj green productivity presentation
K d bhardwaj green productivity presentationRojarsharin
 
Cosmetics Industry
Cosmetics IndustryCosmetics Industry
Cosmetics Industrydigiqom
 
flow production excecution
flow production excecutionflow production excecution
flow production excecutionSutan_PP
 
The role and social responsibilities entrepeneur towards
The role and social responsibilities entrepeneur towardsThe role and social responsibilities entrepeneur towards
The role and social responsibilities entrepeneur towardsNATASHYA AYUNIE
 
Get your-financial-house-in-order
Get your-financial-house-in-orderGet your-financial-house-in-order
Get your-financial-house-in-orderzubeditufail
 
The Egg and I: How to Make Incredible Omelets and Frittatas
The Egg and I: How to Make Incredible Omelets and FrittatasThe Egg and I: How to Make Incredible Omelets and Frittatas
The Egg and I: How to Make Incredible Omelets and FrittatasThe Prepared Pantry
 
Working Manual on Energy Auditing in industries
Working Manual on Energy Auditing in industriesWorking Manual on Energy Auditing in industries
Working Manual on Energy Auditing in industrieszubeditufail
 
Interview success stories
Interview success storiesInterview success stories
Interview success storieszubeditufail
 
Northern areas strategy
Northern areas strategyNorthern areas strategy
Northern areas strategyzubeditufail
 
E book puttingthecustomer_atthecenter_accountplanningstrategies_togrowrevenue...
E book puttingthecustomer_atthecenter_accountplanningstrategies_togrowrevenue...E book puttingthecustomer_atthecenter_accountplanningstrategies_togrowrevenue...
E book puttingthecustomer_atthecenter_accountplanningstrategies_togrowrevenue...zubeditufail
 
25 sales strategies and activities
25 sales strategies and activities25 sales strategies and activities
25 sales strategies and activitieszubeditufail
 
What i wish_i_knew_when_i_was_20
What i wish_i_knew_when_i_was_20What i wish_i_knew_when_i_was_20
What i wish_i_knew_when_i_was_20zubeditufail
 
A guide to Intended Nationally Determined Contributions (INDCs) by Least Deve...
A guide to Intended Nationally Determined Contributions (INDCs) by Least Deve...A guide to Intended Nationally Determined Contributions (INDCs) by Least Deve...
A guide to Intended Nationally Determined Contributions (INDCs) by Least Deve...zubeditufail
 
Seven steps-to-marketing-success
Seven steps-to-marketing-successSeven steps-to-marketing-success
Seven steps-to-marketing-successzubeditufail
 

Viewers also liked (20)

Handbook on-productivity-2015
Handbook on-productivity-2015Handbook on-productivity-2015
Handbook on-productivity-2015
 
Green Productivity and Green Supply Chain Manual
Green Productivity and Green Supply Chain ManualGreen Productivity and Green Supply Chain Manual
Green Productivity and Green Supply Chain Manual
 
Productivity, economy, and role of engineers and how to business in asia
Productivity, economy, and role of engineers and how to business in asiaProductivity, economy, and role of engineers and how to business in asia
Productivity, economy, and role of engineers and how to business in asia
 
K d bhardwaj green productivity presentation
K d bhardwaj green productivity presentationK d bhardwaj green productivity presentation
K d bhardwaj green productivity presentation
 
Cosmetics Industry
Cosmetics IndustryCosmetics Industry
Cosmetics Industry
 
Scm
Scm Scm
Scm
 
PLM N&R Master
PLM N&R MasterPLM N&R Master
PLM N&R Master
 
flow production excecution
flow production excecutionflow production excecution
flow production excecution
 
The role and social responsibilities entrepeneur towards
The role and social responsibilities entrepeneur towardsThe role and social responsibilities entrepeneur towards
The role and social responsibilities entrepeneur towards
 
Get your-financial-house-in-order
Get your-financial-house-in-orderGet your-financial-house-in-order
Get your-financial-house-in-order
 
The Egg and I: How to Make Incredible Omelets and Frittatas
The Egg and I: How to Make Incredible Omelets and FrittatasThe Egg and I: How to Make Incredible Omelets and Frittatas
The Egg and I: How to Make Incredible Omelets and Frittatas
 
Working Manual on Energy Auditing in industries
Working Manual on Energy Auditing in industriesWorking Manual on Energy Auditing in industries
Working Manual on Energy Auditing in industries
 
Interview success stories
Interview success storiesInterview success stories
Interview success stories
 
Northern areas strategy
Northern areas strategyNorthern areas strategy
Northern areas strategy
 
E book puttingthecustomer_atthecenter_accountplanningstrategies_togrowrevenue...
E book puttingthecustomer_atthecenter_accountplanningstrategies_togrowrevenue...E book puttingthecustomer_atthecenter_accountplanningstrategies_togrowrevenue...
E book puttingthecustomer_atthecenter_accountplanningstrategies_togrowrevenue...
 
25 sales strategies and activities
25 sales strategies and activities25 sales strategies and activities
25 sales strategies and activities
 
What i wish_i_knew_when_i_was_20
What i wish_i_knew_when_i_was_20What i wish_i_knew_when_i_was_20
What i wish_i_knew_when_i_was_20
 
Taz report
Taz reportTaz report
Taz report
 
A guide to Intended Nationally Determined Contributions (INDCs) by Least Deve...
A guide to Intended Nationally Determined Contributions (INDCs) by Least Deve...A guide to Intended Nationally Determined Contributions (INDCs) by Least Deve...
A guide to Intended Nationally Determined Contributions (INDCs) by Least Deve...
 
Seven steps-to-marketing-success
Seven steps-to-marketing-successSeven steps-to-marketing-success
Seven steps-to-marketing-success
 

Similar to Manual on material_flow_cost_accounting_iso 14051-2014

Asian Productivity Organization (APO) Green Productivity manual
Asian Productivity Organization (APO) Green Productivity manualAsian Productivity Organization (APO) Green Productivity manual
Asian Productivity Organization (APO) Green Productivity manualzubeditufail
 
Unido tool kit 1-textbook
Unido tool kit 1-textbookUnido tool kit 1-textbook
Unido tool kit 1-textbookzubeditufail
 
19 hand out on cp concept and principles -samantha
19  hand out on cp concept and principles -samantha19  hand out on cp concept and principles -samantha
19 hand out on cp concept and principles -samanthazubeditufail
 
Report on cleaner production in small sector
Report on cleaner production in small sector  Report on cleaner production in small sector
Report on cleaner production in small sector Er. Rahul Jarariya
 
Factors Affecting the Implementation of Green Manufacturing- A Case Study Ana...
Factors Affecting the Implementation of Green Manufacturing- A Case Study Ana...Factors Affecting the Implementation of Green Manufacturing- A Case Study Ana...
Factors Affecting the Implementation of Green Manufacturing- A Case Study Ana...IRJET Journal
 
Lcscm synopsis- itnesh
Lcscm synopsis- itnesh Lcscm synopsis- itnesh
Lcscm synopsis- itnesh Itnesh Kumar
 
Organisational Behaviour: Business Models for a Profitable and Sustainable Fu...
Organisational Behaviour: Business Models for a Profitable and Sustainable Fu...Organisational Behaviour: Business Models for a Profitable and Sustainable Fu...
Organisational Behaviour: Business Models for a Profitable and Sustainable Fu...Ken Dooley
 
Pr 1-textbook-1-a neu
Pr 1-textbook-1-a neuPr 1-textbook-1-a neu
Pr 1-textbook-1-a neuAgus Witono
 
Project Report On GREEN HUMAN RESOURCE MANAGEMENT (GHRM)
Project Report On GREEN HUMAN RESOURCE MANAGEMENT (GHRM) Project Report On GREEN HUMAN RESOURCE MANAGEMENT (GHRM)
Project Report On GREEN HUMAN RESOURCE MANAGEMENT (GHRM) gunvender sharma
 
(Ximb)sustainability compressor industry
(Ximb)sustainability compressor industry(Ximb)sustainability compressor industry
(Ximb)sustainability compressor industrySustainabilityXIMB
 
Communicating Carbon Footprints: Product Labelling
Communicating Carbon Footprints: Product LabellingCommunicating Carbon Footprints: Product Labelling
Communicating Carbon Footprints: Product Labellingc3ventures
 
Green supply chain management
Green supply chain management Green supply chain management
Green supply chain management POOJA GOYAL
 
Cleaner Production
Cleaner ProductionCleaner Production
Cleaner ProductionNJVM
 
Gbm notes by suraj
Gbm notes by surajGbm notes by suraj
Gbm notes by surajSiraj Khan
 
H476574.pdf
H476574.pdfH476574.pdf
H476574.pdfaijbm
 

Similar to Manual on material_flow_cost_accounting_iso 14051-2014 (20)

Cleaner production
Cleaner productionCleaner production
Cleaner production
 
Business Guide EPIs
Business Guide EPIsBusiness Guide EPIs
Business Guide EPIs
 
Asian Productivity Organization (APO) Green Productivity manual
Asian Productivity Organization (APO) Green Productivity manualAsian Productivity Organization (APO) Green Productivity manual
Asian Productivity Organization (APO) Green Productivity manual
 
Cleaner production
Cleaner productionCleaner production
Cleaner production
 
Unido tool kit 1-textbook
Unido tool kit 1-textbookUnido tool kit 1-textbook
Unido tool kit 1-textbook
 
19 hand out on cp concept and principles -samantha
19  hand out on cp concept and principles -samantha19  hand out on cp concept and principles -samantha
19 hand out on cp concept and principles -samantha
 
Report on cleaner production in small sector
Report on cleaner production in small sector  Report on cleaner production in small sector
Report on cleaner production in small sector
 
Cleaner production promotion
Cleaner production promotionCleaner production promotion
Cleaner production promotion
 
Factors Affecting the Implementation of Green Manufacturing- A Case Study Ana...
Factors Affecting the Implementation of Green Manufacturing- A Case Study Ana...Factors Affecting the Implementation of Green Manufacturing- A Case Study Ana...
Factors Affecting the Implementation of Green Manufacturing- A Case Study Ana...
 
Lcscm synopsis- itnesh
Lcscm synopsis- itnesh Lcscm synopsis- itnesh
Lcscm synopsis- itnesh
 
Organisational Behaviour: Business Models for a Profitable and Sustainable Fu...
Organisational Behaviour: Business Models for a Profitable and Sustainable Fu...Organisational Behaviour: Business Models for a Profitable and Sustainable Fu...
Organisational Behaviour: Business Models for a Profitable and Sustainable Fu...
 
Pr 1-textbook-1-a neu
Pr 1-textbook-1-a neuPr 1-textbook-1-a neu
Pr 1-textbook-1-a neu
 
Project Report On GREEN HUMAN RESOURCE MANAGEMENT (GHRM)
Project Report On GREEN HUMAN RESOURCE MANAGEMENT (GHRM) Project Report On GREEN HUMAN RESOURCE MANAGEMENT (GHRM)
Project Report On GREEN HUMAN RESOURCE MANAGEMENT (GHRM)
 
(Ximb)sustainability compressor industry
(Ximb)sustainability compressor industry(Ximb)sustainability compressor industry
(Ximb)sustainability compressor industry
 
Communicating Carbon Footprints: Product Labelling
Communicating Carbon Footprints: Product LabellingCommunicating Carbon Footprints: Product Labelling
Communicating Carbon Footprints: Product Labelling
 
Green supply chain management
Green supply chain management Green supply chain management
Green supply chain management
 
Cleaner Production
Cleaner ProductionCleaner Production
Cleaner Production
 
Gbm notes by suraj
Gbm notes by surajGbm notes by suraj
Gbm notes by suraj
 
H476574.pdf
H476574.pdfH476574.pdf
H476574.pdf
 
UNIDO-Industry Partnerships, by Igor Volodin from UNIDO
UNIDO-Industry Partnerships, by Igor Volodin from UNIDOUNIDO-Industry Partnerships, by Igor Volodin from UNIDO
UNIDO-Industry Partnerships, by Igor Volodin from UNIDO
 

More from zubeditufail

International Environmental Impact Assessment - Atkins.pdf
International Environmental Impact Assessment - Atkins.pdfInternational Environmental Impact Assessment - Atkins.pdf
International Environmental Impact Assessment - Atkins.pdfzubeditufail
 
The Holy Quran with Easy Word Meaning
The Holy Quran with Easy Word MeaningThe Holy Quran with Easy Word Meaning
The Holy Quran with Easy Word Meaningzubeditufail
 
Use of fungus bricks in construction sector
Use of fungus bricks in construction sectorUse of fungus bricks in construction sector
Use of fungus bricks in construction sectorzubeditufail
 
SPMC training iso 45001 awareness
SPMC training iso 45001 awarenessSPMC training iso 45001 awareness
SPMC training iso 45001 awarenesszubeditufail
 
SPMC - Pakistan training iso 14001 EMS awareness
SPMC - Pakistan training iso 14001 EMS awarenessSPMC - Pakistan training iso 14001 EMS awareness
SPMC - Pakistan training iso 14001 EMS awarenesszubeditufail
 
SPMC - Pakistan training iso 9001 QMS awareness
SPMC - Pakistan training iso 9001 QMS awarenessSPMC - Pakistan training iso 9001 QMS awareness
SPMC - Pakistan training iso 9001 QMS awarenesszubeditufail
 
SPMC - Pakistan Training Calendar 2020
SPMC - Pakistan Training Calendar 2020SPMC - Pakistan Training Calendar 2020
SPMC - Pakistan Training Calendar 2020zubeditufail
 
ISO 9001:2015 Life Cycle
ISO 9001:2015 Life Cycle ISO 9001:2015 Life Cycle
ISO 9001:2015 Life Cycle zubeditufail
 
CODEX HACCP Short Introduction
CODEX HACCP Short Introduction CODEX HACCP Short Introduction
CODEX HACCP Short Introduction zubeditufail
 
Pakistan Income Tax Ordinance amendment 2016
Pakistan Income Tax Ordinance amendment 2016Pakistan Income Tax Ordinance amendment 2016
Pakistan Income Tax Ordinance amendment 2016zubeditufail
 
Heat stroke by SPMCpk.com
Heat stroke by SPMCpk.comHeat stroke by SPMCpk.com
Heat stroke by SPMCpk.comzubeditufail
 
APPLICATION IN FORM - I FOR PRIOR ENVIRONMENTAL CLEARANCE
APPLICATION IN FORM - I FOR PRIOR ENVIRONMENTAL CLEARANCEAPPLICATION IN FORM - I FOR PRIOR ENVIRONMENTAL CLEARANCE
APPLICATION IN FORM - I FOR PRIOR ENVIRONMENTAL CLEARANCEzubeditufail
 
Resettlement Policy Framework - Karachi Neighborhood Improvement Project (KNIP)
Resettlement Policy Framework - Karachi Neighborhood Improvement Project (KNIP)Resettlement Policy Framework - Karachi Neighborhood Improvement Project (KNIP)
Resettlement Policy Framework - Karachi Neighborhood Improvement Project (KNIP)zubeditufail
 
Environmental and Social Management Framework (ESMF) - Karachi Neighborhood I...
Environmental and Social Management Framework (ESMF) - Karachi Neighborhood I...Environmental and Social Management Framework (ESMF) - Karachi Neighborhood I...
Environmental and Social Management Framework (ESMF) - Karachi Neighborhood I...zubeditufail
 
Ohsas 18001 self assessment checklist
Ohsas 18001 self assessment checklistOhsas 18001 self assessment checklist
Ohsas 18001 self assessment checklistzubeditufail
 
Draft2 guiding principles_and_recommendations_for_businesses_in_and_around_kb...
Draft2 guiding principles_and_recommendations_for_businesses_in_and_around_kb...Draft2 guiding principles_and_recommendations_for_businesses_in_and_around_kb...
Draft2 guiding principles_and_recommendations_for_businesses_in_and_around_kb...zubeditufail
 
A global standard_for_the_identification_of_key_biodiversity_areas_final_web
A global standard_for_the_identification_of_key_biodiversity_areas_final_webA global standard_for_the_identification_of_key_biodiversity_areas_final_web
A global standard_for_the_identification_of_key_biodiversity_areas_final_webzubeditufail
 
The Daily Dawn newspaper - millineium development goals report - Pakistan
The Daily Dawn newspaper - millineium development goals report - PakistanThe Daily Dawn newspaper - millineium development goals report - Pakistan
The Daily Dawn newspaper - millineium development goals report - Pakistanzubeditufail
 
shehri Letter to sepa
shehri Letter to sepashehri Letter to sepa
shehri Letter to sepazubeditufail
 
EIA of Engro Powergen Limited 450 MW RLNG CCPP at PQA, Karachi Sep 29, 2015 b...
EIA of Engro Powergen Limited 450 MW RLNG CCPP at PQA, Karachi Sep 29, 2015 b...EIA of Engro Powergen Limited 450 MW RLNG CCPP at PQA, Karachi Sep 29, 2015 b...
EIA of Engro Powergen Limited 450 MW RLNG CCPP at PQA, Karachi Sep 29, 2015 b...zubeditufail
 

More from zubeditufail (20)

International Environmental Impact Assessment - Atkins.pdf
International Environmental Impact Assessment - Atkins.pdfInternational Environmental Impact Assessment - Atkins.pdf
International Environmental Impact Assessment - Atkins.pdf
 
The Holy Quran with Easy Word Meaning
The Holy Quran with Easy Word MeaningThe Holy Quran with Easy Word Meaning
The Holy Quran with Easy Word Meaning
 
Use of fungus bricks in construction sector
Use of fungus bricks in construction sectorUse of fungus bricks in construction sector
Use of fungus bricks in construction sector
 
SPMC training iso 45001 awareness
SPMC training iso 45001 awarenessSPMC training iso 45001 awareness
SPMC training iso 45001 awareness
 
SPMC - Pakistan training iso 14001 EMS awareness
SPMC - Pakistan training iso 14001 EMS awarenessSPMC - Pakistan training iso 14001 EMS awareness
SPMC - Pakistan training iso 14001 EMS awareness
 
SPMC - Pakistan training iso 9001 QMS awareness
SPMC - Pakistan training iso 9001 QMS awarenessSPMC - Pakistan training iso 9001 QMS awareness
SPMC - Pakistan training iso 9001 QMS awareness
 
SPMC - Pakistan Training Calendar 2020
SPMC - Pakistan Training Calendar 2020SPMC - Pakistan Training Calendar 2020
SPMC - Pakistan Training Calendar 2020
 
ISO 9001:2015 Life Cycle
ISO 9001:2015 Life Cycle ISO 9001:2015 Life Cycle
ISO 9001:2015 Life Cycle
 
CODEX HACCP Short Introduction
CODEX HACCP Short Introduction CODEX HACCP Short Introduction
CODEX HACCP Short Introduction
 
Pakistan Income Tax Ordinance amendment 2016
Pakistan Income Tax Ordinance amendment 2016Pakistan Income Tax Ordinance amendment 2016
Pakistan Income Tax Ordinance amendment 2016
 
Heat stroke by SPMCpk.com
Heat stroke by SPMCpk.comHeat stroke by SPMCpk.com
Heat stroke by SPMCpk.com
 
APPLICATION IN FORM - I FOR PRIOR ENVIRONMENTAL CLEARANCE
APPLICATION IN FORM - I FOR PRIOR ENVIRONMENTAL CLEARANCEAPPLICATION IN FORM - I FOR PRIOR ENVIRONMENTAL CLEARANCE
APPLICATION IN FORM - I FOR PRIOR ENVIRONMENTAL CLEARANCE
 
Resettlement Policy Framework - Karachi Neighborhood Improvement Project (KNIP)
Resettlement Policy Framework - Karachi Neighborhood Improvement Project (KNIP)Resettlement Policy Framework - Karachi Neighborhood Improvement Project (KNIP)
Resettlement Policy Framework - Karachi Neighborhood Improvement Project (KNIP)
 
Environmental and Social Management Framework (ESMF) - Karachi Neighborhood I...
Environmental and Social Management Framework (ESMF) - Karachi Neighborhood I...Environmental and Social Management Framework (ESMF) - Karachi Neighborhood I...
Environmental and Social Management Framework (ESMF) - Karachi Neighborhood I...
 
Ohsas 18001 self assessment checklist
Ohsas 18001 self assessment checklistOhsas 18001 self assessment checklist
Ohsas 18001 self assessment checklist
 
Draft2 guiding principles_and_recommendations_for_businesses_in_and_around_kb...
Draft2 guiding principles_and_recommendations_for_businesses_in_and_around_kb...Draft2 guiding principles_and_recommendations_for_businesses_in_and_around_kb...
Draft2 guiding principles_and_recommendations_for_businesses_in_and_around_kb...
 
A global standard_for_the_identification_of_key_biodiversity_areas_final_web
A global standard_for_the_identification_of_key_biodiversity_areas_final_webA global standard_for_the_identification_of_key_biodiversity_areas_final_web
A global standard_for_the_identification_of_key_biodiversity_areas_final_web
 
The Daily Dawn newspaper - millineium development goals report - Pakistan
The Daily Dawn newspaper - millineium development goals report - PakistanThe Daily Dawn newspaper - millineium development goals report - Pakistan
The Daily Dawn newspaper - millineium development goals report - Pakistan
 
shehri Letter to sepa
shehri Letter to sepashehri Letter to sepa
shehri Letter to sepa
 
EIA of Engro Powergen Limited 450 MW RLNG CCPP at PQA, Karachi Sep 29, 2015 b...
EIA of Engro Powergen Limited 450 MW RLNG CCPP at PQA, Karachi Sep 29, 2015 b...EIA of Engro Powergen Limited 450 MW RLNG CCPP at PQA, Karachi Sep 29, 2015 b...
EIA of Engro Powergen Limited 450 MW RLNG CCPP at PQA, Karachi Sep 29, 2015 b...
 

Recently uploaded

MENTAL STATUS EXAMINATION format.docx
MENTAL     STATUS EXAMINATION format.docxMENTAL     STATUS EXAMINATION format.docx
MENTAL STATUS EXAMINATION format.docxPoojaSen20
 
The Most Excellent Way | 1 Corinthians 13
The Most Excellent Way | 1 Corinthians 13The Most Excellent Way | 1 Corinthians 13
The Most Excellent Way | 1 Corinthians 13Steve Thomason
 
Introduction to AI in Higher Education_draft.pptx
Introduction to AI in Higher Education_draft.pptxIntroduction to AI in Higher Education_draft.pptx
Introduction to AI in Higher Education_draft.pptxpboyjonauth
 
Interactive Powerpoint_How to Master effective communication
Interactive Powerpoint_How to Master effective communicationInteractive Powerpoint_How to Master effective communication
Interactive Powerpoint_How to Master effective communicationnomboosow
 
Introduction to ArtificiaI Intelligence in Higher Education
Introduction to ArtificiaI Intelligence in Higher EducationIntroduction to ArtificiaI Intelligence in Higher Education
Introduction to ArtificiaI Intelligence in Higher Educationpboyjonauth
 
Call Girls in Dwarka Mor Delhi Contact Us 9654467111
Call Girls in Dwarka Mor Delhi Contact Us 9654467111Call Girls in Dwarka Mor Delhi Contact Us 9654467111
Call Girls in Dwarka Mor Delhi Contact Us 9654467111Sapana Sha
 
Software Engineering Methodologies (overview)
Software Engineering Methodologies (overview)Software Engineering Methodologies (overview)
Software Engineering Methodologies (overview)eniolaolutunde
 
Paris 2024 Olympic Geographies - an activity
Paris 2024 Olympic Geographies - an activityParis 2024 Olympic Geographies - an activity
Paris 2024 Olympic Geographies - an activityGeoBlogs
 
_Math 4-Q4 Week 5.pptx Steps in Collecting Data
_Math 4-Q4 Week 5.pptx Steps in Collecting Data_Math 4-Q4 Week 5.pptx Steps in Collecting Data
_Math 4-Q4 Week 5.pptx Steps in Collecting DataJhengPantaleon
 
SOCIAL AND HISTORICAL CONTEXT - LFTVD.pptx
SOCIAL AND HISTORICAL CONTEXT - LFTVD.pptxSOCIAL AND HISTORICAL CONTEXT - LFTVD.pptx
SOCIAL AND HISTORICAL CONTEXT - LFTVD.pptxiammrhaywood
 
Sanyam Choudhary Chemistry practical.pdf
Sanyam Choudhary Chemistry practical.pdfSanyam Choudhary Chemistry practical.pdf
Sanyam Choudhary Chemistry practical.pdfsanyamsingh5019
 
Presentation by Andreas Schleicher Tackling the School Absenteeism Crisis 30 ...
Presentation by Andreas Schleicher Tackling the School Absenteeism Crisis 30 ...Presentation by Andreas Schleicher Tackling the School Absenteeism Crisis 30 ...
Presentation by Andreas Schleicher Tackling the School Absenteeism Crisis 30 ...EduSkills OECD
 
Contemporary philippine arts from the regions_PPT_Module_12 [Autosaved] (1).pptx
Contemporary philippine arts from the regions_PPT_Module_12 [Autosaved] (1).pptxContemporary philippine arts from the regions_PPT_Module_12 [Autosaved] (1).pptx
Contemporary philippine arts from the regions_PPT_Module_12 [Autosaved] (1).pptxRoyAbrique
 
URLs and Routing in the Odoo 17 Website App
URLs and Routing in the Odoo 17 Website AppURLs and Routing in the Odoo 17 Website App
URLs and Routing in the Odoo 17 Website AppCeline George
 
Class 11 Legal Studies Ch-1 Concept of State .pdf
Class 11 Legal Studies Ch-1 Concept of State .pdfClass 11 Legal Studies Ch-1 Concept of State .pdf
Class 11 Legal Studies Ch-1 Concept of State .pdfakmcokerachita
 

Recently uploaded (20)

Model Call Girl in Bikash Puri Delhi reach out to us at 🔝9953056974🔝
Model Call Girl in Bikash Puri  Delhi reach out to us at 🔝9953056974🔝Model Call Girl in Bikash Puri  Delhi reach out to us at 🔝9953056974🔝
Model Call Girl in Bikash Puri Delhi reach out to us at 🔝9953056974🔝
 
9953330565 Low Rate Call Girls In Rohini Delhi NCR
9953330565 Low Rate Call Girls In Rohini  Delhi NCR9953330565 Low Rate Call Girls In Rohini  Delhi NCR
9953330565 Low Rate Call Girls In Rohini Delhi NCR
 
MENTAL STATUS EXAMINATION format.docx
MENTAL     STATUS EXAMINATION format.docxMENTAL     STATUS EXAMINATION format.docx
MENTAL STATUS EXAMINATION format.docx
 
The Most Excellent Way | 1 Corinthians 13
The Most Excellent Way | 1 Corinthians 13The Most Excellent Way | 1 Corinthians 13
The Most Excellent Way | 1 Corinthians 13
 
Introduction to AI in Higher Education_draft.pptx
Introduction to AI in Higher Education_draft.pptxIntroduction to AI in Higher Education_draft.pptx
Introduction to AI in Higher Education_draft.pptx
 
Código Creativo y Arte de Software | Unidad 1
Código Creativo y Arte de Software | Unidad 1Código Creativo y Arte de Software | Unidad 1
Código Creativo y Arte de Software | Unidad 1
 
Interactive Powerpoint_How to Master effective communication
Interactive Powerpoint_How to Master effective communicationInteractive Powerpoint_How to Master effective communication
Interactive Powerpoint_How to Master effective communication
 
Introduction to ArtificiaI Intelligence in Higher Education
Introduction to ArtificiaI Intelligence in Higher EducationIntroduction to ArtificiaI Intelligence in Higher Education
Introduction to ArtificiaI Intelligence in Higher Education
 
Call Girls in Dwarka Mor Delhi Contact Us 9654467111
Call Girls in Dwarka Mor Delhi Contact Us 9654467111Call Girls in Dwarka Mor Delhi Contact Us 9654467111
Call Girls in Dwarka Mor Delhi Contact Us 9654467111
 
TataKelola dan KamSiber Kecerdasan Buatan v022.pdf
TataKelola dan KamSiber Kecerdasan Buatan v022.pdfTataKelola dan KamSiber Kecerdasan Buatan v022.pdf
TataKelola dan KamSiber Kecerdasan Buatan v022.pdf
 
Software Engineering Methodologies (overview)
Software Engineering Methodologies (overview)Software Engineering Methodologies (overview)
Software Engineering Methodologies (overview)
 
Paris 2024 Olympic Geographies - an activity
Paris 2024 Olympic Geographies - an activityParis 2024 Olympic Geographies - an activity
Paris 2024 Olympic Geographies - an activity
 
_Math 4-Q4 Week 5.pptx Steps in Collecting Data
_Math 4-Q4 Week 5.pptx Steps in Collecting Data_Math 4-Q4 Week 5.pptx Steps in Collecting Data
_Math 4-Q4 Week 5.pptx Steps in Collecting Data
 
SOCIAL AND HISTORICAL CONTEXT - LFTVD.pptx
SOCIAL AND HISTORICAL CONTEXT - LFTVD.pptxSOCIAL AND HISTORICAL CONTEXT - LFTVD.pptx
SOCIAL AND HISTORICAL CONTEXT - LFTVD.pptx
 
Sanyam Choudhary Chemistry practical.pdf
Sanyam Choudhary Chemistry practical.pdfSanyam Choudhary Chemistry practical.pdf
Sanyam Choudhary Chemistry practical.pdf
 
Presentation by Andreas Schleicher Tackling the School Absenteeism Crisis 30 ...
Presentation by Andreas Schleicher Tackling the School Absenteeism Crisis 30 ...Presentation by Andreas Schleicher Tackling the School Absenteeism Crisis 30 ...
Presentation by Andreas Schleicher Tackling the School Absenteeism Crisis 30 ...
 
Contemporary philippine arts from the regions_PPT_Module_12 [Autosaved] (1).pptx
Contemporary philippine arts from the regions_PPT_Module_12 [Autosaved] (1).pptxContemporary philippine arts from the regions_PPT_Module_12 [Autosaved] (1).pptx
Contemporary philippine arts from the regions_PPT_Module_12 [Autosaved] (1).pptx
 
Staff of Color (SOC) Retention Efforts DDSD
Staff of Color (SOC) Retention Efforts DDSDStaff of Color (SOC) Retention Efforts DDSD
Staff of Color (SOC) Retention Efforts DDSD
 
URLs and Routing in the Odoo 17 Website App
URLs and Routing in the Odoo 17 Website AppURLs and Routing in the Odoo 17 Website App
URLs and Routing in the Odoo 17 Website App
 
Class 11 Legal Studies Ch-1 Concept of State .pdf
Class 11 Legal Studies Ch-1 Concept of State .pdfClass 11 Legal Studies Ch-1 Concept of State .pdf
Class 11 Legal Studies Ch-1 Concept of State .pdf
 

Manual on material_flow_cost_accounting_iso 14051-2014

  • 1.
  • 3. Hiroshi Tachikawa, Japan, served as the volume editor. First published in Japan by Asian Productivity Organization Leaf Sguare Hongo Building 2F 1-24-1 Hongo, Bunkyo-ku Tokyo 113-0033, Japan www.apo-tokyo.org © 2014 Asian Productivity Organization The views expressed in this publication do not necessarily reflect the official views of the Asian Productivity Organization (APO) or any APO member. The APO is not responsible for the accuracy, usability, and safety of its contents. All rights reserved. None of the contents of this publication may be used, reproduced, stored, or transferred in any form or by any means for commercial purposes without prior written permission from the APO. ISBN 978-92-833-2449-2 (paperback) ISBN 978-92-833-2450-8 (PDF) 500.09.2014 Designed by Expressions, Inc. Printed by Hirakawa Kogyosha Co., Ltd., Japan
  • 4. CONTENTS What is MFCA? 1 Module 1: General Concept of MFCA 1 Basic Manual on Material Flow Cost Accounting (ISO 14051) xii Difference between MFCA and Conventional Cost Accounting 3 Module 2: Characteristics of MFCA 3 Terms and Basic Concepts 4 Module 3: ISO 14051: Scope, Terms, and Definitions 4 Principles of MFCA 7 Module 4: ISO 14051: Objectives and Principles of MFCA 7 Fundamental Elements of MFCA 8 Module 5: ISO 14051: Fundamental Elements of MFCA 8 Implementation Step 1: Engaging Management and Determining Roles and Responsibilities Implementation Step 2: Scope and Boundary of the Process and Establishing a Material Flow Model Implementation Step 3: Cost Allocation Implementation Step 4: Interpreting and Communicating MFCA Results Implementation Step 5: Improving Production Practices and Reducing Material Loss through MFCA Results 11 12 13 14 15 Module 6: ISO 14051: MFCA Implementation Steps 11 MFCA Case Example: Nitto Denko Corporation 17 Foreword v Introduction: Green Productivity and MFCA vii
  • 5. v Material flow cost accounting (MFCA), developed in Germany in the late 1990s and since adopted widely in Japan, focuses on tracing waste, emissions, and nonproducts and can help boost an organization’s economic and environmental performance. It is one of the major tools of environmental management accounting (EMA). EMA is a set of procedures used within enterprises for linking environmental considerations with economic objectives. Today, organizations cannot ignore the environmental aspects of their activities. Consequently, they seek management tools to link concern for the environment with their bottom lines. MFCA is a management tool that promotes the efficient use of materials more effectively, contributing to reductions in waste, emissions, and nonproducts. MFCA increases the transparency of material flow, which is a key to successful problem-solving and improvement. By solving problems, organizations can increase their resource productivity and reduce costs at the same time. This is in line with the Green Productivity (GP) concept and can be used to implement GP in organizations and factories. The Government of Japan is currently taking steps to enhance understanding of MFCA and to accelerate its widespread adoption. MFCA is already in place in more than 300 Japanese companies. To standardize MFCA practices, a working group of the ISO Technical Committee ISO/ TC 207, Environmental Management, developed ISO 14051, which complements the ISO 14000 family of environmental management system standards, including life cycle assessment (ISO 14040, ISO 14044) and environmental performance evaluation (ISO 14031). The standard was published in the second half of 2011. MFCA has been receiving increasing attention throughout the Asia-Pacific, including APO member countries, along with national environmental management concerns. The APO organized a series of training courses and workshops on MFCA starting from 2011 and offered a self-learning e-course in 2013. This Manual on Material Flow Cost Accounting was prepared based on feedback from and needs of APO member countries. I hope that the publication will be useful to GP/MFCA practitioners and professionals while promoting sustainable development practices in the region. Mari Amano Secretary-General Tokyo September 2014 FOREWORD
  • 6. vii INTRODUCTION: GREEN PRODUCTIVITY AND MFCA K. D. Bhardwaj APO Senior Program Officer Green Productivity (GP) was defined by a group of APO experts as “…a strategy for enhancing productivity and environmental performance for sustainable socioeconomic development. It is the application of appropriate productivity and environmental management tools, techniques, and technologies to reduce the environmental impact of an organization’s activities, products, and services.” GP is not a new concept but has emerged gradually from the basic concept of productivity. GP integrates the productivity and environmental concepts to produce goods in cleaner, greener ways. This also ensures reduced environmental burden and input costs, along with improved quality and profitability. It is especially important for small-scale industries because it concentrates upon the preventive approach. GP can be explained as adoption and implementation of environmentally sound processes, practices, and procedures to optimize the utilization of resources with minimum environmental impact. In other words, this concept focuses upon enhancing productivity without creating adverse environmental impacts. Seen from a different perspective, improvement of the environment should have beneficial rather than deleterious effects on the quantity and quality of products. Thus GP stresses optimum utilization of space, manpower, energy, and raw materials, i.e., all the factors of production. GP aims at overall socioeconomic development that leads to a sustained improvement in the quality of life. NEED FOR GP Conventional productivity improvement efforts focused on cost-effectiveness through cost reductions, and environmental protection focused on nonproductive end-of-pipe (EOP) solutions. With the growing awareness that quality, health, and safety aspects were involved in productivity improvement in addition to cost, a number of programs and techniques, like total quality maintenance and total productive maintenance for equipment maintenance, 5S for structured, systematic housekeeping, and kaizen for continual improvement were developed. Similarly, compared with conventional EOP treatment alone, pollution prevention is usually more cost-effective, often resulting in reduced energy and material usage and costs. To some extent, productivity practices like preventive maintenance, good housekeeping, etc. reduce environmental burdens. However, productivity practices and pollution prevention programs alone cannot manage the total environment and sustain development. There is a need to integrate productivity improvement into pollution prevention and control programs for sustainability.
  • 7. viii The need for a fundamental change by moving businesses toward resource efficiency and taking a holistic life-cycle view of products was recognized in the 1990s. Resource efficiency not only leads to conservation of natural resources but also results in improved productivity and environmental performance. Therefore, if development is to be sustainable, we must move beyond preventive approaches and ensure that both productivity improvement and environmental protection are achieved simultaneously. Recognizing this, the APO has integrated this approach into the concept of GP. The goal of GP is to achieve higher levels of productivity to serve the needs of society and to protect and enhance the quality of environment both locally and globally. GP leads to gains in profitability through improvements in productivity and environmental performance. In other words, GP can improve the bottom line of every sector of society. TRIPLE FOCUS OF GP GP recognizes the importance of both the environment and development, and the concept of GP shows that for any development strategy to be sustainable it must have a focus on quality, profitability, and the environment. Quality is dictated by the voice of the customer for both goods and services. GP works at ensuring quality by promoting the use of newer, safer materials, increasing processing and production efficiency, and improving working conditions. The intent of GP is thus to provide the consumer with more performance and value with the use of fewer resources, including energy, and the creation of less waste i.e., “doing more with less.” This makes sense both for the environment and for business. Natural resources are conserved, thereby reducing environmental degradation in many ways. The cost of production is also reduced, thereby ensuring profitability. Savings may also come from lower waste management costs or take the form of avoiding the cost of potential environmental liabilities. Figure 1: Triple Focus of GP
  • 8. ix BENEFITS OF GP Implementation of the GP strategy will have both immediate and long-term benefits. The benefits accrue to producers as well as to consumers and include increased efficiency gains in resource use, lower costs of production, decreased costs of waste treatment and disposal, and better quality of products. The adoption and practice of GP will also provide businesses with a competitive advantage. It will increase productivity growth rates in business, as a result of which market share and profitability increase. This shift toward integrating “the environment” and “productivity” enabled by GP has much greater implications for businesses, particularly in developing economies due to their technological and resource constraints. Opening of world markets and increased globalization have intensified the pressures on businesses, as they must meet international expectations. Workers will benefit from GP because it improves not only the workplace but also the health and safety of the labor force. GP METHODOLOGY The central element of the GP methodology is the examination and reevaluation of both production processes and products to reduce their environmental impacts and highlight ways to improve productivity and product quality. Implementing these options leads to another cycle of review and so promotes continuous improvement (see Fig. 2). The GP methodology revolves around the PDCA cycle. The six principle steps of the GP methodology are: Step 1: Getting Started The beginning of the GP process is marked by the formation of a GP team and a walk- through survey to gain baseline information and identify problem areas. At this stage, it is vital to get the support of senior management to ensure that adequate manpower and resources are available for successful GP implementation. Step 2: Planning Using the information gained in the walk-through survey along with a number of analytical tools such as material balance, benchmarking, eco-mapping, and Ishikawa diagrams, problems and their causes are identified and analyzed. Following this, objectives and targets are set to address the problem areas. Performance indicators are also identified. Step 3: Generation and Evaluation of GP Options This stage involves the development of options to meet the objectives and targets formulated in the planning stage. It involves both a review of pollution prevention and control procedures that have already been devised or implemented and the development of new options. Options are screened and prioritized in terms of their economic and technical feasibility and potential benefits. They are then synthesized into an implementation plan.
  • 9. Step 4: Implementation of GP Options The implementation of the selected GP options involves two steps: preparation and execution. Preparatory steps include training, awareness building, and competence development. They are followed by the installation of equipment and systems along with operator instruction and hands-on training. Step 5: Monitoring and Review Once the selected GP options have been implemented, it is vital to check whether they are producing the desired results. This involves monitoring the overall GP system to ensure that it is proceeding in the right direction and that targets are being achieved as per the implementation plan. Findings are reported for management review. Step 6: Sustaining GP In light of the findings of the GP evaluation, corrective actions can be taken to keep the GP program on target. In some cases, targets and objectives themselves will have to be modified. As the program progresses, a feedback system should be implemented so that new problems and challenges will be highlighted and dealt with. In this way, the GP cycle will loop back to the relevant step to implement a process of continuous improvement and ensure the continuing relevance and effectiveness of the GP process. Figure 2: GP Methodology x
  • 10. xi GREEN PRODUCTIVITY AND MATERIAL FLOW COST ACCOUNTING MFCA, developed in Germany in the late 1990s and since adopted widely in Japan, focuses on tracing waste, emissions, and nonproducts and can help boost an organization’s economic and environmental performance. It is one of the major tools of environmental management accounting (EMA). EMA is a set of procedures used within corporations and other organizations for linking environmental considerations with economic objectives. Today, organizations cannot ignore the environmental aspects of their activities. Consequently, they seek management tools to link concern for the environment with economic considerations. MFCA is a management tool that increases the transparency of material flow, which is a key to successful problem solving and improvement. By solving problems, organizations can increase their resource productivity and reduce costs at the same time. This is in line with the GP concept and can be used to implement GP in organizations and factories.
  • 11. BASIC MANUAL ON MATERIAL FLOW COST ACCOUNTING (ISO 14051) This manual was prepared to provide basic knowledge and understanding of material flow cost accounting (MFCA). It intends to be a manual that is comprehensive, up to date, and consistent with ISO 14051. It is recognized that: • This manual is not intended to be the one and only manual on learning and applying MFCA. • Learning levels and progress depend on the individual’s learning abilities and exposures to the subject matter. • Gaining practical experience through project implementation after formal training will greatly increase the speed and level of competency. • Sole reliance on the manual is not advisable. • Measuring, analyzing, and applying practical solutions to problems are subject to local conditions where MFCA is practiced and applied. xii
  • 12. 1 WHAT IS MFCA? MFCA is one of the major tools for environmental management accounting and promotes increased transparency of material use practices through the development of a material flow model that traces and quantifies the flows and stocks of materials within an organization in physical and monetary units. It is a method of environmental management accounting that simultaneously achieves “reduced environmental impacts” and “improved business efficiency.” MFCA is applicable to all industries that use materials and energy, of any type and scale, with or without environmental management systems in place (Clause 1, ISO 14051:2011). It can be seen as one alternative for organizations to consider environmental matters, including material scarcity, climate change, and increasingly stringent environmental regulations for any business decision and achieve sustainable development. The method was originally developed in Germany and has been further developed in Japan. The inclusion of MFCA in the International Organization for Standardization (ISO) was an initiative from Japan. ISO 14051 was issued in 2011. MFCA measures the flow and stock of all materials in the manufacturing process in both monetary and physical terms. The materials include raw materials, parts, and components. MFCA analysis provides an equivalent comparison of costs associated with products and costs associated with material losses, for example, waste, air emissions, wastewater, etc. In many cases, an organization is unaware of the full extent of the actual cost of material losses because data on material losses and the associated costs are often difficult to extract from conventional information, accounting, and environmental management systems. In this way, MFCA enables organizations to identify material use and their flows within a production process and assign costs to all of these materials. Organizations are required to consider the environmental impact of their operations in every phase of said operations. Recycling, reusing, and reducing have been actively promoted in recent years and recycling has especially gained support among organizations trying to reduce the consumption of raw materials and their environmental impact. Although waste recycling is an effective measure for resource use, it is not always cost-effective as substantial inputs of energy and other expenses are often required. From an MFCA perspective, it is essential to reduce waste generation itself to increase resource use and cost efficiency. MFCA identifies quantities of each material and its costs (including material, processing, and waste treatment costs). This enables us to look at each of the sources of waste generation in a separate way and identify improvement opportunities that could lead to the reduction of waste generation itself. Using this information, organizations can identify the costs of losses caused by waste and other emissions, as well as defective products, and calculate the quantities and resources used in each process and the costs associated with these processes. MFCA MODULE 1: GENERAL CONCEPT OF MFCA
  • 13. 2 acts as a strong motivation for organizations to reduce waste and material inputs, leading to cost reductions and increased productivity. Reduction of waste generation leads to enhanced environmental performance in manufacturing processes by highlighting the importance of reducing inputs of raw materials. Hence, MFCA becomes a tool that allows organizations to establish a link between the need to reduce resource procurement in order to increase process efficiency of the operations and the need to reduce environmental impact at the same time. Therefore, MFCA serves not only as a tool for environmental purposes but also as a general management tool that helps organizations find ways to reduce their environmental impact while increasing profitability through cost reductions (Clause 4, ISO 14051:2011). While MFCA is primarily designed for use within a single facility or organization, the approach can be extended to multiple organizations within the supply chain, enabling them to develop an integrated approach for more efficient use of materials and energy.
  • 14. 3 The differences between MFCA and conventional cost accounting do not mean that MFCA cannot be applied to any organization that uses materials and energy. In other words, MFCA does not demand any specific requirement in regard to the type of product, service, size, structure, or location. In addition, MFCA can be expanded to multiple organizations belonging to the supply chain. This will enable the organizations to identify even more opportunities for material reduction as well as higher energy efficiency. Wider MFCA scope than that for a single entity is especially helpful because waste generation in an organization is occasionally derived from materials provided by a supplier or demanded by customers/consumers (Clause A, ISO 14051:2011). MODULE 2: CHARACTERISTICS OF MFCA DIFFERENCE BETWEEN MFCA AND CONVENTIONAL COST ACCOUNTING (Clause A.1, ISO 14051:2011) MFCA represents a different way of management accounting. In conventional cost accounting, the data are used to determine whether the incurred costs are recovered from sales. It does not require determining whether material is transformed into products, or disposed of as waste. In conventional cost accounting, even if waste is recognized in terms of quantity, the costs to produce “material losses” are included as part of the total output cost. On the other hand, MFCA, as explained before, focuses on identifying and differentiating between the costs associated with “products” and “material losses.” In this way material loss is evaluated as an economic loss, which encourages the management to search for ways to reduce material losses and improve business efficiency. Table 1. Difference between MFCA and conventional cost accounting. MFCA calculates the associated with the material losses. (Unit: USD) MFCA Conventional accounting Sales 15,000,000 Sales 15,000,000 Product cost 3,000,000 Cost of sales 4,500,000 Material loss cost 1,500,000 N/A N/A Gross profit 10,500,000 Gross profit 10,500,000 Selling, general, and administrative expenses* 8,000,000 Selling, general, and administrative expenses* 8,000,000 Operating profit 2,500,000 Operating profit 2,500,000
  • 15. 4 MODULE 3: ISO 14051: SCOPE, TERMS, AND DEFINITIONS TERMS AND BASIC CONCEPTS (Clause 3, ISO 14051:2011) MFCA is constituted by three main elements, as shown in Figure 1: 1. Material Material refers to any raw material, auxiliary material, component, catalyzer, or part that is used to manufacture a product. Any material that does not become part of the final product is considered material loss. In any process, waste and resource loss occur in different steps of the process, including: • Material loss during processing, defective products, impurities • Materials remaining in manufacturing equipment following set-ups • Auxiliary materials such as solvents, detergents to wash equipment, water • Raw material that becomes unusable for any reason 2. Flow MFCA traces all input materials that flow through production processes and measures products and material loss (waste) in physical units using the following equation: Input = Products + Material loss (waste) The starting point of MFCA is to measure the amount of material losses based on mass balance. The concept is illustrated in Figure 2. In this case, the amount of the material loss (30 tons) is calculated based on the amount of total input and products in a selected part of a process in which the inputs and outputs are quantified. This part of the process is defined as a quantity center in MFCA (i.e., Material loss = Input - Products), as Figure 2 shows. Figure 1. Main elements of MFCA. Each element is described below.
  • 16. 5 Manual on Material Flow Cost Accounting (ISO 14051) Figure 2. Concept of material balance. Decision-making in organizations typically involves financial considerations. MFCA supports this point by assigning a monetary value to material losses. In detail, MFCA allows organizations to see material losses as “products” rather than “waste” even though they are not marketable. This indicates that costs for both products and material losses are calculated in an equivalent manner. Therefore, all costs caused by and/or associated with the material flows entering and leaving a quantity center must be quantified and assigned or allocated to those material flows (Clauses 3.14, 3.16, 5.2, ISO 14051:2011). 3. Cost Accounting Under MFCA, the flows and stocks of materials within an organization are traced and quantified in physical units (e.g., mass, volume) and then assigned an associated cost. Under MFCA, four types of costs are quantified: material costs, system costs, energy costs, and waste management costs. Each cost is defined as follows: • Material cost: cost for a substance that goes through a quantity center (measurement unit of input and output for MFCA analysis). Typically, the purchase cost is used as the material cost. • Energy cost: cost for energy sources such as electricity, fuels, steam, heat, compressed air. • System cost: cost incurred in the course of in-house handling of the material flows, excluding material cost, energy cost, and waste management cost. • Waste management cost: cost for handling material losses. Following identification of a physical unit for material flow data, material costs, energy costs, and system costs are subsequently assigned or allocated to quantity center outputs (i.e., products and material losses) based on the proportion of the material input that flows into product and material loss. For example, as illustrated in Figure 3, of the 100 tons of material used, 70 tons flow into product and 30 tons flow into material loss. Thus, the material distribution percentages of 70% and 30% are used to allocate energy and system costs to the product and material loss, respectively. In this example, the material distribution percentage based on mass is used to allocate these costs. On the other hand, in Figure 3, all waste management costs of $100,000 are attributed to material loss, since the costs are caused solely by material losses. In the final analysis, the total cost of material losses in this example is $520,000. This cost is not separated but included in the cost of the product in conventional costing; the cost for material loss is not considered except in MFCA.
  • 17. 6 Manual on Material Flow Cost Accounting (ISO 14051) Figure 3. MFCA evaluation in monetary units. The resulting cost of the material loss can become an incentive for organizations and managers to reduce operation costs by reducing material losses. Therefore, it can be said that MFCA can help organizations simultaneously achieve financial benefits and control of material losses (i.e., more effective resource use) (Clause 5.3, ISO 14051:2011).
  • 18. 7 MODULE 4: ISO 14051: OBJECTIVES AND PRINCIPLES OF MFCA PRINCIPLES OF MFCA (Clause 4.2, ISO 14051:2011) MFCA can be used to increase the transparency of material flows and energy use, along with the associated costs and environmental impacts, and to support organizational decisions through information obtained through MFCA. This can be achieved by following the four core principles of MFCA methodology. 1. Understand material flow and energy use The flow of all materials and energy use for each quantity center should be traced to understand how materials are used and transformed along the whole process. 2. Link physical and monetary data Through MFCA, the environmental-related decision-making process can be linked to financial information via the material flow model, which provides a better understanding of the real costs of material and energy use and results in an improved decision-making process. 3. Ensure accuracy, completeness, and comparability of physical data MFCA requires that all data be verified and that all inputs and outputs be identified and quantified. It is recommended that all data be converted to a common unit. Using accurate and complete data is critical to identify the cause and source of any gap between inputs and outputs. 4. Estimate and assign costs to material losses Real costs should be assigned to all material losses and products. When exact information is not available, the cost allocation should be as accurate and practical as possible. In MFCA, the information on costs attributed to material losses represents one of the main incentives for process improvement. Figure 4. Principles of MFCA.
  • 19. 8 MODULE 5: ISO 14051: FUNDAMENTAL ELEMENTS OF MFCA FUNDAMENTAL ELEMENTS OF MFCA (Clause 5, ISO 14051:2011) MFCA brings about both environmental and cost-reduction impacts on the organization. In order to apply MFCA to an organization effectively, the concepts of quantity center, material balance, cost calculation, and material flow model shown in Figure 5 need to be incorporated. Fundamental Element 1: Quantity center (Clause 5.1, ISO 14051:2011) A quantity center is typically one or multiple unit process(es). The center is the point at which the material balance will be calculated both in physical and monetary units. One quantity center can include either a single process or multiple processes, depending on the amount of the material losses identified at the unit of production. Furthermore, the quantity centers within the MFCA boundary can be based on existing production management information, cost center records, and other existing information. Generally, quantity centers are established in all processes where relevant material losses or system costs, such as energy for transport, oil, or air pressure leakages, are identified, then the appropriate process is selected as an additional quantity center and its inputs and outputs are determined. Typical examples of quantity centers include points where materials are stocked and/or transformed, such as storage, production units, waste management, and shipping/receiving points. Once the inputs and outputs have been identified for each quantity center, they can be used to connect the quantity centers within the boundary so that data from the quantity centers can be linked and evaluated across the entire system within the scope. It is important that material balance be ensured to evaluate material efficiency in physical and monetary units. The concept of material balance is described in the following section, Fundamental Element 2: Material balance. Figure 5. Fundamental elements of MFCA.
  • 20. 9 Module 5: ISO 14051: Fundamental Elements of MFCA Fundamental Element 2: Material balance (Clause 5.2, ISO 14051:2011) In MFCA, all material that goes into and leaves the quantity center should be balanced. Thus, to account for all the materials targeted in the MFCA analysis, the material input and output need to be confirmed, while comparing the quantities of material inputs to outputs and changes in the inventory to identify any data gaps. The missing materials or other data gaps can lead organizations to identify missing points which result in areas of improvement. As an example, Figure 6 shows a general material balance around a quantity center. In this example, a total of 145 kg of material enters the quantity center with an inventory of 35 kg. Over the time period for analysis, the raw material is distributed between product (120 kg), material loss (40 kg), and inventory (20 kg). For each quantity center, the amounts of inputs and outputs should be quantified in physical units. All physical units should be convertible to a single standardized unit (e.g., mass) so that material balances can be conducted for each quantity center. It is preferable to use existing on-site basic units for production management. A material balance requires that the total amount of outputs (i.e., products and material losses) be equal to the total amount of inputs, taking into account any inventory changes within the quantity center. Ideally, all materials within the MFCA boundary should be traced and quantified. However, in reality, materials that have minimal environmental or financial significance can be excluded. Fundamental Element 3: Cost Calculation (Clause 5.3, ISO 14051:2011) During the decision-making process, financial considerations are often included. Through MFCA, the material balance of inputs and outputs is linked to monetary units by assigning and/or allocating costs to all products and material losses. MFCA considers four types of cost, all of which are allocated to both products and material losses: • Material costs; • Energy costs; • System costs; and • Waste management costs. Figure 7 shows an example of cost calculation based on the material balance at one quantity center in which the total costs of the quantity center are allocated to the outputs based on the proportion of inputs that becomes a product and the proportion that becomes part of the material losses. Figure 6. Example of material balance in a quantity center.
  • 21. 10 Manual on Material Flow Cost Accounting (ISO 14051) Figure 7. Example of cost calculation in a quantity center. Fundamental Element 4: Material Flow Model (Clause 5.2, ISO 14051:2011) It refers to the visual representation of the process that shows all the quantity centers in which the materials are transformed, stocked, or used, as well as the flow of these materials within the system boundary. Figure 8 shows an example of a material flow model. Figure 8. Example of a material flow model for a process within the MFCA boundary.
  • 22. 11 MODULE 6: ISO 14051: MFCA IMPLEMENTATION STEPS To facilitate implementation, ISO 14051 proposes several MFCA implementation steps as delineated below. The level of detail and complexity of the analysis will depend on the size of the organization, nature of the organization’s activities and products, number of processes, and quantity centers chosen for analysis, among other factors. These conditions make MFCA a flexible tool that can be applied in a wide range of organizations, regardless of size or the existence of an environmental management system (EMS). In fact, the implementation process of MFCA is considered to move more smoothly and faster if the organization has an existing EMS as it is probable that material- and waste-related data EW already being collected for analysis. Furthermore, MFCA can be easily integrated into other EMS as it incorporates the Plan- Do-Check-Act (PDCA) continual improvement cycle, which is a common approach in many EMS. MFCA can provide additional information in each of the stages of the PDCA cycle and enhance the existing EMS. For example, the use of MFCA allows the organization to include financial considerations in setting objectives and targets. The knowledge of potential environmental impacts and financial impacts can enhance the quality of the evaluation, providing useful information for an organization’s decision-making. IMPLEMENTATION STEP 1: ENGAGING MANAGEMENT AND DETERMINING ROLES AND RESPONSIBILITIES (Clause 6.2, 6.3, ISO 14051:2011) Successful projects usually start with support from the company’s management; MFCA is not an exception. If the company management understands the benefits of MFCA and its usefulness in achieving an organization’s environmental and financial targets, it is easier to gain commitment from the whole organization. In order to be effectively implemented, it is highly recommended that top management take the lead in MFCA implementation by assigning roles and responsibilities, including setting up an MFCA project implementation team, providing resources, monitoring progress, reviewing results, and deciding on improvement measures based on the MFCA results. In general terms, management should be engaged in all phases of MFCA implementation and it is recommended that MFCA projects start with aggressive support from management, followed by a bottom-up approach on-site, as shown in Figure 9. Figure 9. Top-down and bottom-up approach.
  • 23. 12 Manual on Material Flow Cost Accounting (ISO 14051) In addition, successful implementation of MFCA requires collaboration between different departments within the organization. The reason why collaboration is needed is because different sources of information are required to complete MFCA analysis. Through engagement of the company management in the MFCA implementation process, the required expertise can be determined and the correct flow of information between all areas involved can be facilitated. The following are typical examples of expertise that are needed for successful implementation of MFCA: • Operational expertise on the flow of input materials and energy use throughout the target process; • Technical expertise on material-related implications of processes, including combustion and other chemical reactions; • Quality control expertise on various issues, such as frequency of product rejects, causes, as well as rework activities, maintenance, and other quality assurance data; • Environmental expertise on environmental impacts; and • Accounting expertise on cost accounting data. IMPLEMENTATION STEP 2: SCOPE AND BOUNDARY OF THE PROCESS AND ESTABLISHING A MATERIAL FLOW MODEL (Clauses 6.4, 6.5, ISO 14051:2011) Based on collected material flow data, the MFCA boundary needs to be specified to understand clearly the scale of MFCA activity. During implementation, it is usually recommended to focus on specific products or processes at the beginning and then expanding implementation to other products. By implementing MFCA in steps, the analysis is simplified and better results can be achieved. The boundary can be limited to a single process, multiple processes, an entire facility, or a supply chain. It is recommended that the process or processes that are chosen for initial implementation be the ones with potentially significant environmental and economic impacts. After specifying the boundary, the process should be classified in quantity centers using process information and procurement records. In MFCA, the quantity center is the part of the process in which inputs and outputs are quantified. In most cases, quantity centers represent parts of the process in which materials are transformed. If the material flow between two processes is the source of significant material loss, the flow can be classified as a separate material flow. After determining the boundary and quantity centers, a time period for MFCA data collection needs to be specified. While MFCA does not indicate the period during which data must be collected for analysis, it should be sufficiently long to allow meaningful data to be collected and to minimize the impact of any significant process variation that can affect the reliability and usability of the data, such as seasonal fluctuations. Several historical MFCA projects indicate that the appropriate data collection period can be as short as a month, with a half-year or a year of data collection being the most common. In MFCA, production, recycling, and other systems are represented by visual models that illustrate MFCA boundary and multiple quantity centers where materials are stocked, used, or transformed, as well as the movements of materials between those quantity centers.
  • 24. 13 Module 6: ISO 14051: MFCA Implementation Steps Figure 10. Material flow model for a process within the MFCA boundary. Figure 10 shows a general material flow system. The material flow model is useful to provide an overview of an entire process and to identify the points where material losses occur. Products include finished products from the entire system, intermediate products, and material inputs to other quantity centers. For each quantity center, material balance-based verification should be conducted to understand material-related efficiency. The material flow model is not necessarily visualized by computer; the model can be made on paper and with Post-It Notes for discussion among project members. IMPLEMENTATION STEP 3: COST ALLOCATION (Clauses 5.3, 6.8, ISO 14051:2011) MFCA divides costs into the following categories: • Material cost: cost for a substance that enters and/or leaves a quantity center • Energy cost: cost for electricity, fuel, steam, heat, and compressed air • System cost: Cost of labor, cost of depreciation and maintenance, and cost of transport • Waste management cost: cost of handling waste generated in a quantity center Material costs, energy costs, and system costs are assigned or allocated to either products or material losses at each quantity center based on the proportion of the material input that flows into product and material loss. The material costs for each input and output flow are quantified by multiplying the physical amount of the material flow by the unit cost of the material over the time period chosen for the analysis. When quantifying the material costs for products and material losses, the material costs associated with any changes in material inventory within the quantity center should also be quantified. In contrast to material, energy, and system costs that are assigned to products and material losses proportionally, 100% of the waste management costs are attributed to material loss, since the costs represent the costs of managing this material loss. In most cases, costs such as energy costs, system costs, and waste management costs are only available for an entire process or facility, and allocating or attributing these costs to each specific product and material loss is challenging. If costs for each
  • 25. 14 Manual on Material Flow Cost Accounting (ISO 14051) quantity center are unknown and difficult to calculate or estimate, it is possible to distribute the total respective costs of the specific processes to the quantity centers and subsequently allocate them to products and material losses, following the next simple steps: 1. Allocation of overall (e.g., process-wide, facility-wide) costs to each quantity center; and 2. Allocation of costs to products and material losses Each organization will need to decide the allocation criteria that best fits its needs and the scope of the project. Accordingly, during each allocation step, an appropriate allocation criterion should be selected. The criterion chosen should reflect the costs being allocated as closely to the real process as possible. When process-wide or facility-wide costs are being allocated to quantity centers, machine hours, production volume, number of employees, labor hours, number of jobs performed, or floor space can be considered as appropriate examples of allocation criteria. For the second step, allocation of costs in a quantity center to products and material losses, it is common to allocate costs based on the material distribution percentage. In other words, costs follow the same ratio as the material balance in physical units. Once costs have been allocated to all inputs, the cost analysis should be incorporated to the material flow analysis. By doing so, the output from one quantity center becomes the input of the following quantity center. The material cost that enters a quantity center should reflect the combination of the material costs, energy costs, and system costs from the previous quantity center. Carryover cost items can be expressed separately as material cost, energy cost, and system cost. IMPLEMENTATION STEP 4: INTERPRETING AND COMMUNICATING MFCA RESULTS (Clauses 6.9, 6.10, ISO 14051:2011) MFCA implementation provides information such as material loss throughout the process, the use of materials that do not become products, overall costs, and energy and system costs associated with the material loss. This information brings about multiple impacts by increasing the awareness of the company’s operations. Managers who are aware of the costs associated with material losses can then identify opportunities to increase efficiency in material use and improve business performance. Through the identification of MFCA issues that lead to material losses, organizations have a chance to identify the resulting economic loss, which is usually overlooked when relying solely on conventional cost accounting. While most organizations monitor the yield rate associated with the materials used in the process, the general scope of such monitoring only covers the main materials, processes, or losses in many cases. They often control the main materials without monitoring the amounts of use or loss in auxiliary or operating materials. On-site operators may see materials being lost, whereas managers of the manufacturing, production engineering, and product design departments are not aware of such losses. This happens because the organization’s conventional management practices only focus on the handling of waste when there are costs associated with its management. In such cases, MFCA helps organizations highlight uncontrolled material losses.
  • 26. 15 Module 6: ISO 14051: MFCA Implementation Steps The physical and monetary quantification of the material flow can be summarized in a format that is suitable for further interpretation, for example, in a material flow cost matrix. The data should first be summarized for each quantity center separately. Table 2 illustrates a format of the summary of the MFCA data for a quantity center. Table 2. Example of a material flow cost matrix for a quantity center. Cost Material Energy System Waste management Total Product Amount (65%) Amount (65%) Amount (65%) N/A Total product (60%) Material loss Amount (35%) Amount (35%) Amount (35%) Amount (100%) Total material loss (40%) Total Amount (100%) Amount (100%) Amount (100%) Amount (100%) Total (100%) In general, the review and interpretation of summarized data will allow the organization to identify quantity centers with material losses that have a significant environmental or financial impact. These quantity centers can be analyzed in more detail (i.e., root cause for sources of material loss). Data from individual quantity centers can also be aggregated for the entire target process being analyzed. After the MFCA analysis is completed, the results should be communicated to all relevant stakeholders. In addition, management can use MFCA information to support many different types of decisions aimed at improving both environmental and financial performance. Communicating the results to the organization’s employees can be useful in explaining any process or organizational changes and gain full commitment from all members of the organization (Clauses 6.9, 6.10, ISO 14051:2011). IMPLEMENTATION STEP 5: IMPROVING PRODUCTION PRACTICES AND REDUCING MATERIAL LOSS THROUGH MFCA RESULTS (Clause 6.11, ISO 14051:2011) Once MFCA analysis has assisted an organization to understand the magnitude, consequences, and drivers of material use and loss, the organization may review the MFCA data and seek opportunities to improve environmental and financial performance. The measures taken to achieve these improvements can include substitution of materials; modification of processes, production lines, or products; and intensified research and development activities related to material and energy efficiency. MFCA data can be used to support the cost-benefit analysis of proposed measures, both those requiring additional investment and those requiring little or no initial investment (e.g., process standardization, process improvement). Additionally, MFCA implementation can also be used as an opportunity to pursue improvements in the organization’s accounting and information systems. After implementing MFCA for the first time, organizations can identify ways to access more systematized data for all future projects to avoid some manual data collection and analysis. This can facilitate further implementation of MFCA, and system improvements
  • 27. 16 Manual on Material Flow Cost Accounting (ISO 14051) can be pursued. Possible system improvements that are discovered during MFCA implementation must be noted and included in the overall analysis. By applying MFCA, financial costs such as processing and material losses are identified. In many cases, the scale of the identified costs is more significant than previously assumed. At the same time, MFCA presents an ultimate target for engineers: “the zero material loss cost,” which can encourage the organization to make a breakthrough in the recognition of the necessity for improvement. The typical losses identified by MFCA include the following: 1. Waste treatment cost for material loss; 2. Procurement cost for material losses sold to external recycling contractors; 3. System cost for material losses (labor, depreciation, fuel, utility and other costs); 4. System cost required for internal recycling of materials; and 5. Material and system costs for in-stock products, work-in-progress materials, materials that were disposed of due to a switch to a newer model, deterioration of quality, or for aging stock. Through MFCA implementation in several companies of different industries and sizes, it has been found that only a few companies control auxiliary materials on a corporate basis. Auxiliary and operating materials are often managed on a process or equipment basis, and the quantities of materials input (and loss) for each model are rarely accounted for. In some cases, such quantities are managed in the unit of production lot. The overall waste treatment cost is generally managed on a factory basis by waste type. However, some companies identify such cost by material type, product model, and process type. Furthermore, companies are often unaware of losses associated with recyclable waste because such waste is reused as resources and sometimes sold as valuable material to external recyclers.
  • 28. 17 MFCA CASE EXAMPLE: NITTO DENKO CORPORATION This case example shows actual implementation of MFCA in accordance with the implementation steps described in the previous section. Nitto Denko Corporation (hereafter “Nitto”) is a leading Japanese diversified materials manufacturer that provides a wide range of products including tapes, vinyl, LCDs, insulation, and reverse osmosis membranes. Nitto was the first model company that introduced MFCA with the support of the Japanese Ministry of Economy, Trade and Industry (METI) in the early 2000s. Step 1: Engaging Management and Determining Roles and Responsibilities (Clause 6.2, 6.3, ISO 14051:2011) Nitto has always been committed to enhancing efficiency and minimizing the environmental impacts of its operations. As a part of environmental management activities, Nitto found that its environmental accounting system was not fully representative of the total environmental impact costs of operations. The reason was that only environmental conservation costs were being considered, and some costs associated with environmental impacts remained hidden. Figure 11 shows that the environmental conservation costs used for conventional environmental accounting only represented 1.6% of total sales in 2005. However, other costs, such as energy consumption costs associated with environmental impacts are usually allocated to production costs. In the case of Nitto, these costs represented around 13.6% of total sales, which is significantly higher than the environmental conservation costs (1.6%). Figure 11. Composition of total sales (nonconsolidated basis, FY 2005). Source: Nitto Denko Corporation. At the time, the company was looking for alternatives for its existing conventional environmental accounting, when METI introduced MFCA to Nitto. At the initial phase of the project, top management (CEO of the company) showed strong interest in and commitment to the project. One of the reasons for the strong CEO commitment was
  • 29. 18 Manual on Material Flow Cost Accounting (ISO 14051) in understanding the importance of the “mottainai” concept. Mottainai is a traditional Japanese concept that conveys a sense of regret about waste from any activity. For example, Japanese say mottainai when they witness waste, and therefore people make more effort to avoid it. For full implementation of the project, the CEO designated a main key person in the field of the sustainability management as team leader. The implementation team leader was in charge of providing basic training to people at the manufacturing site and guide MFCA implementation for the target process. Actual implementation activities are described in the following sections. Step 2: Scope and Boundary of the Process and Establishing a Material Flow Model (Clauses 6.4, 6.5, ISO 14051:2011) During the target product selection process, Nitto decided to focus on a product that showed an upward trend in the market, its production lines generated a high amount of material losses, and had production lines that consumed substantial amounts of energy in the manufacturing process. Based on these criteria, the adhesive tape used in electronics produced at the Toyohashi Plant was selected as the target product for MFCA implementation. The adhesive tape consists of a three-layered structure composed of a base material, an adhesive compound, and a separator. Its manufacturing process starts from creating the adhesive compound. Sheets are then created by coating the base material and separator with the adhesive compound. This sheet is cut to the correct length and width based on product specifications and shipped as finished adhesive tape. Losses in the length and width directions are incurred in the cutting process. Figure 12. Applicable product. Source: Nitto Denko Corporation. As a first step, month-long data were collected for MFCA analysis. However, recommended MFCA implementation should follow the PDCA continual cycle, and therefore three-month and six-month data were collected and analyzed.
  • 30. 19 MFCA Case Example: Nitto Denko Corporation Determination of Quantity Centers (Clause 6.5 and 6.7, ISO 14051:2011) After selecting the target product, as suggested by the MFCA implementation steps, quantity centers of the process were decided. Quantity centers should be established based on loss analysis and process analysis and not purely for data collection. In the MFCA methodology, one quantity center should usually be set up per production process. In this process, Nitto identified some benefits in integrating several processes into one quantity center from the perspective of the “man-hour”-“accuracy” balance. Using the process flow from the adhesive tape production as shown in Figure 13, the MFCA implementation team decided to divide the process into five quantity centers: 1. dissolution/batch blending process; 2. coating/drying process; 3. store process; 4. slitting process; and 5. inspection/packing process. After the quantity centers were selected, Nitto collected data for verification of the amount of inputs and outputs in physical units by doing a material balance. Figure 13. Material flow model. Source: Nitto Denko Corporation.
  • 31. 20 Manual on Material Flow Cost Accounting (ISO 14051) Collection of energy costs, system costs, and disposal costs Once material costs were identified and allocated to each material, energy costs, system costs, and disposal costs for each quantity center were collected. Some of the information is only available for the complete process and had to be allocated to each material following the criteria shown in Table 3. Table 3. Allocation bases. Source: Nitto Denko Corporation. Figure 14. Material flow model with data. Source: Nitto Denko Corporation. Step 3: Cost Allocation (Clause 5.3, 6.8, ISO 14051:2011) Costs were classified into four cost elements: 1) material costs, 2) energy costs (separate from material costs), 3) system costs, and 4) waste disposal costs (delivery/ disposal costs). To determine material costs, the physical amount of input materials in each quantity center was multiplied by their unit costs. Material cost flows were tracked through each quantity center, as shown in Figure 14. Cost elements Allocation base Allocation type Energy (electricity) Consumption B Energy (fuel) Consumption B Labor (regular employees) Man-hours A Labor (part-timers) Man-hours A Depreciation (straight-line method) Operating time B Maintenance Expenditure C Tools and implements Expenditure C A:Allocation based on real data. B:Allocation based on monthly data (as accurate as possible). C:Apportionment based on monthly data.
  • 32. 21 MFCA Case Example: Nitto Denko Corporation Table 4. Flow cost matrix. Period: from November 1 to 30, 2000 (unit: yen). Source: Nitto Denko Corporation. All collected costs are allocated to products and to material losses following the material flow obtained through the material balance. In this process, Nitto decided to allocate energy costs and system costs based on the product/material loss ratio in physical units. Following the MFCA methodology, all disposal costs were allocated to material loss rather than using the allocation based on the proportion of material that becomes product and material loss, as used for energy and system costs. Step 4: Interpreting and Communicating MFCA Results (Clauses 6.9, 6.10, ISO 14051:2011) After collecting all data in physical and monetary units and making the material balance of the quantity center, the implementation team prepared a material flow cost matrix in which all costs were classified as part of the products or material losses. The main purpose of the matrix is to provide the results of the MFCA analysis in a format that can be easily interpreted by the entire organization. For the selected process, the proportion of positive products to negative products was 67.17% to 32.83%, as shown in Table 4. Material flow profit-and-loss statement In addition to the material flow cost matrix, Nitto used the results from the MFCA analysis to create a new profit-and-loss (PL) statement based on MFCA. Table 5 compares material flow PL with conventional PL in which material flow PL refers to the profit-and-loss statement using MFCA and conventional PL refers to the profit-and-loss statement used by Nitto before MFCA implementation. Cost Material Energy System Disposal Total Positive products 2,499,944 (68.29%) 57,354 (68.29%) 480,200 (68.29%) NA 3,037,498 (67.17%) Negative products 1,160,830 (31.71%) 26,632 (31.71%) 222,978 (31.71%) 74,030 (100%) 1,484,470 (32.83%) Total 3,660,774 (100%) 83,986 (100%) 703,178 (100%) 74,030 (100%) 4,521,968 100%
  • 33. 22 Manual on Material Flow Cost Accounting (ISO 14051) Table 5. Comparison of profit-and-loss statements. Period: from November 1 to 30, 2000 (unit: yen). Under material flow PL, the cost of goods sold (cost of positive products) and the cost of waste (cost of negative products) were calculated as ¥3,037,498 and ¥1,484,670, respectively. Assuming that total sales were ¥15,000,000 and sales and administrative costs were ¥8,000,000, the operating income was ¥2,478,032. In the material flow PL, a clear distinction between the cost of positive and negative products was seen. Nitto was able to identify the real costs of the negative products and work on strategies to increase its profits by reducing the cost of negative products. The material flow PL was used by the implementation team as a tool to stimulate the rest of the organization to consider how to convert the cost of negative products into profits and to direct their attention to continuous improvement. Under conventional cost accounting, all costs were allocated to the final product. Conventional cost accounting considers that only finished (non-defective) products have the capacity to recover the cost of goods that were used. Costs associated with material loss, such as unused materials, are usually included under the production costs. Through the conventional cost accounting, costs for the material loss remain hidden and cannot be fully understood. Conversely, MFCA provides information not only on the costs associated with the final product but also with the material loss. The difference between MFCA-based PL and conventional PL is shown in Table 5. Step 5: Improving Production Practices and Reducing Material Loss through MFCA Results (Clause 6.11, ISO 14051:2011) Through MFCA, Nitto was able to recognize its material losses and the costs associated with these losses accurately. This information became an incentive for Nitto to improve the material productivity of this manufacturing line. Thus, the implementation team decided to set up its kaizen plan on the basis of a cost/benefit analysis using the physical and cost data under MFCA. Figure 15 shows the cost of negative products broken down by factor, and countermeasures were subsequently planned and implemented. *Provisional figure. Source: Nitto Denko Corporation. Material flow P/L (unit: yen) Material flow P/L (unit: yen) Sales* 15,000,000 Sales* 15,000,000 Cost of positive products 3,037,498 Cost of sales 4,521,968 Cost of negative products 1,484,470 N/A N/A Gross profit 10,478,032 Gross profit 10,478,032 Selling, general, and administrative expenses* 8,000,000 Selling, general, and administrative expenses* 8,000,000 Operating profit 2,478,032 Operating profit 2,478,032
  • 34. 23 MFCA Case Example: Nitto Denko Corporation Cost of positive products (products) : cost of negative products (material losses) = 67% : 33% Capital investment decisions Nitto conducted an assessment of its capital investments amid the implementation of these measures and decided on an additional ¥700 million capital investment. The results of the implementation of improvement measures are shown in Table 6. The proportion of positive products increased by 10%. There was, however, much room for improvement and the company decided to introduce a continuous MFCA analysis in this process. Improvement targets are updated on a yearly basis. Figure 15. Loss analysis. Source: Nitto Denko Corporation.
  • 35. 24 Manual on Material Flow Cost Accounting (ISO 14051) Table 6. Implementation results: Improvement of material productivity through MFCA by Nitto (cost basis). Source: Nitto Denko Corporation. 2001 2004 2013 (target) Positive products 67% 78% (+11%) 90% (+23%) Negative products 33% 22% (-11%) 10% (-23%) Total 100% 100% 100% Outcome of MFCA implementation After completing the project, Nitto recognized the potential of MFCA as a management tool. In particular, Nitto recognized the following points: 1. MFCA can support the pursuit of company-wide goals. 2. It is necessary to convert physical and monetary data units into a standardized unit along their flow. 3. It pursues the flow of materials, energy, and system costs in a process from start to finish. 4. MFCA can help clarify losses in terms of cost and enables managers to set clear targets for improvement. 5. MFCA provides a way to identify potential cost reductions and positive impacts on the environment. 6. MFCA contributes to increased material productivity and strengthened competitiveness. 7. MFCA provides relevant, useful information for equipment investment appraisal and design for the environment. In MFCA, processing costs and indirect costs that are included in waste, such as system costs, are also taken into account. This enables companies to clarify the costs associated with emissions as waste. In other words, there are no losses that are ignored as in conventional cost accounting and all losses are within the scope targeted for improvement. Material flow data, which recognize the quantity and cost of waste via each quantity center, provide a clear picture of the issues and bottlenecks in the manufacturing process. By settling such issues and converting the flow of negative products into positive products, companies can simultaneously achieve a reduction in environmental impact and an increase in profit. This also enables companies to recognize that the cost of waste will vary depending on where it is generated, even if the total quantity of waste remains constant. From this point of view, companies can comprehend which manufacturing processes most need improvement or reform, and it becomes possible to estimate a pertinent investment amount and secure funds for such investments.
  • 36. 25 MFCA Case Example: Nitto Denko Corporation Figure 16 shows the summary of the implementation of MFCA and how Nitto was able to identify material losses that served as valuable information for capital investment decisions and achieving lower costs and fewer environmental impacts. Figure 16. Implementation summary. Source: Nitto Denko Corporation.