Download to read offline
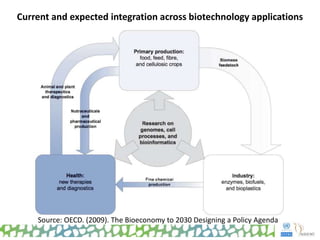
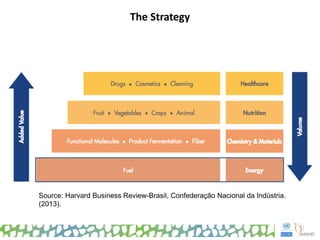
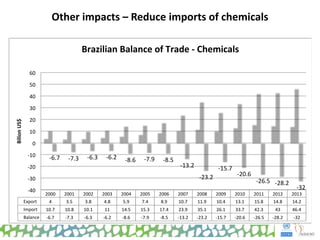
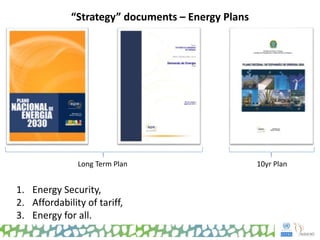
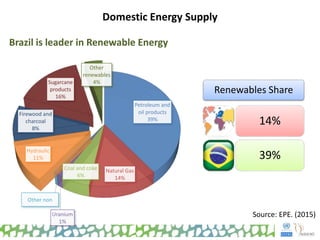
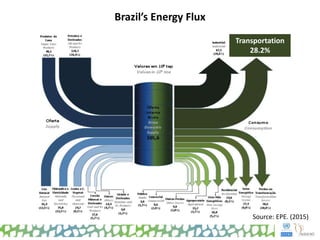
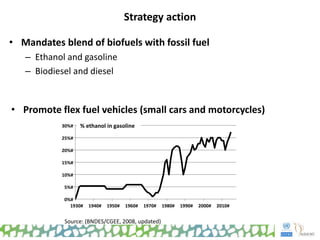
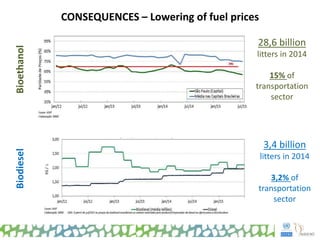


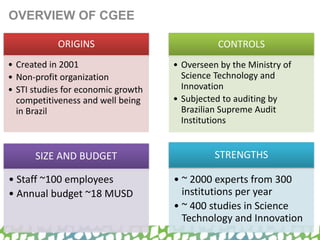
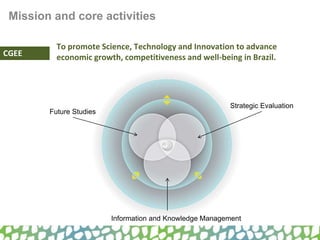


The document discusses Brazil's strategy for developing its bioeconomy, highlighting the role of biotechnology in economic output and energy production. It emphasizes the integration of renewable energy sources and biofuels, particularly bioethanol and biodiesel, in transportation, while noting Brazil's position as a leader in renewable energy. Furthermore, it outlines governance challenges within various institutions and the mission of the Centre for Strategic Studies and Management (CGEE) to promote science and technology for economic growth.


