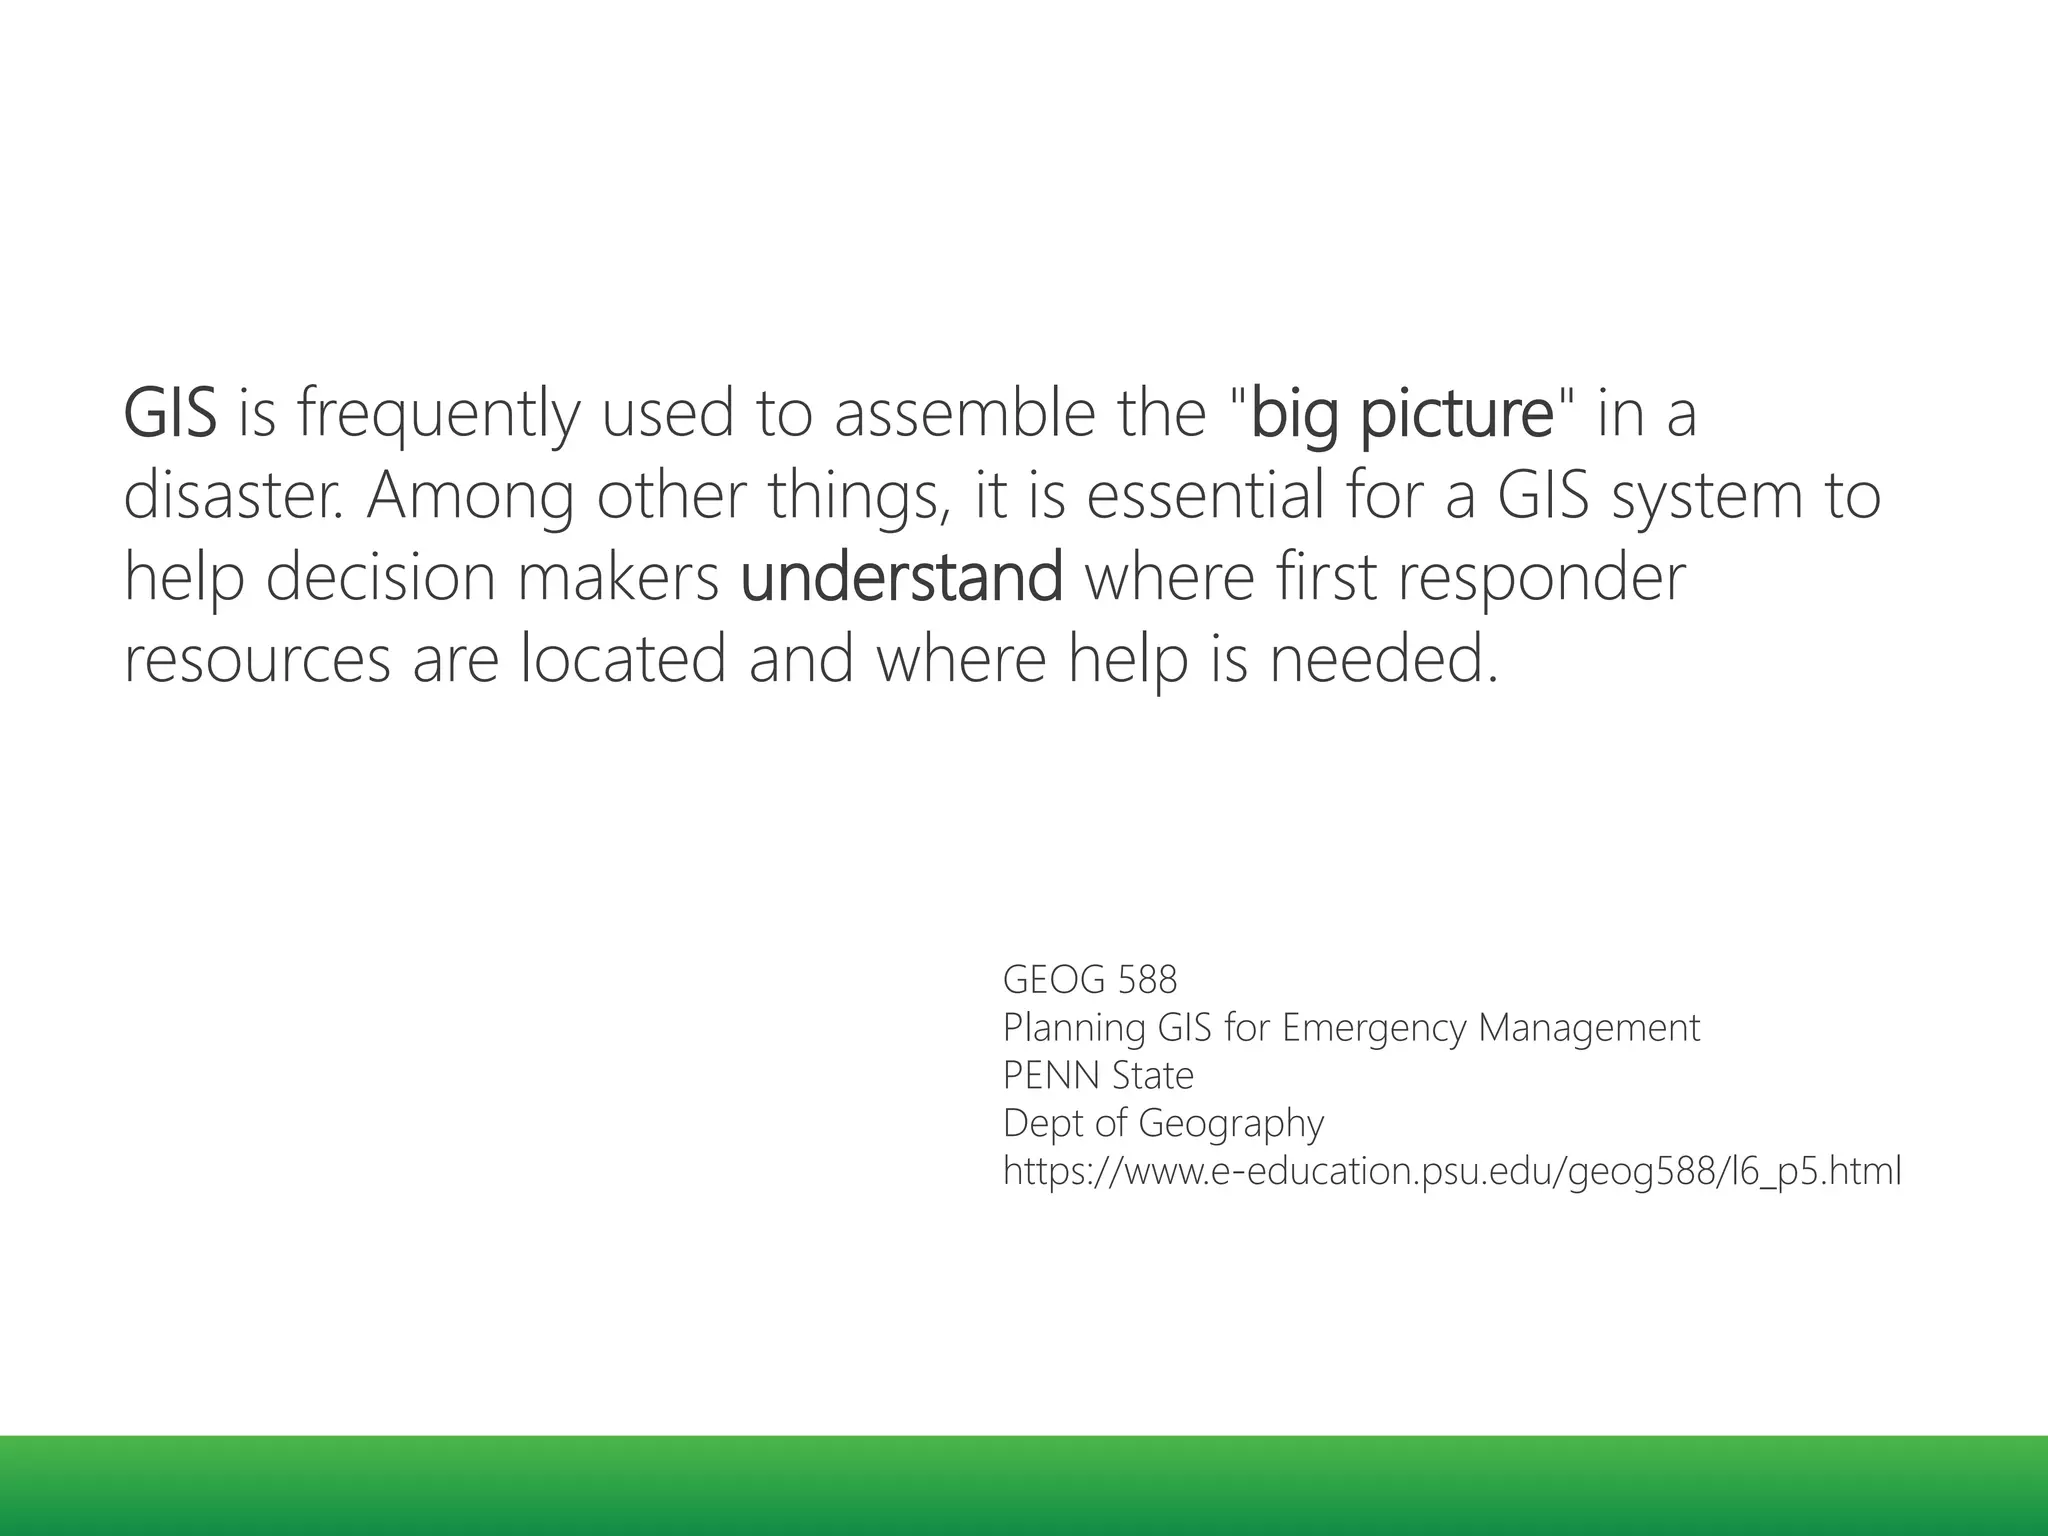
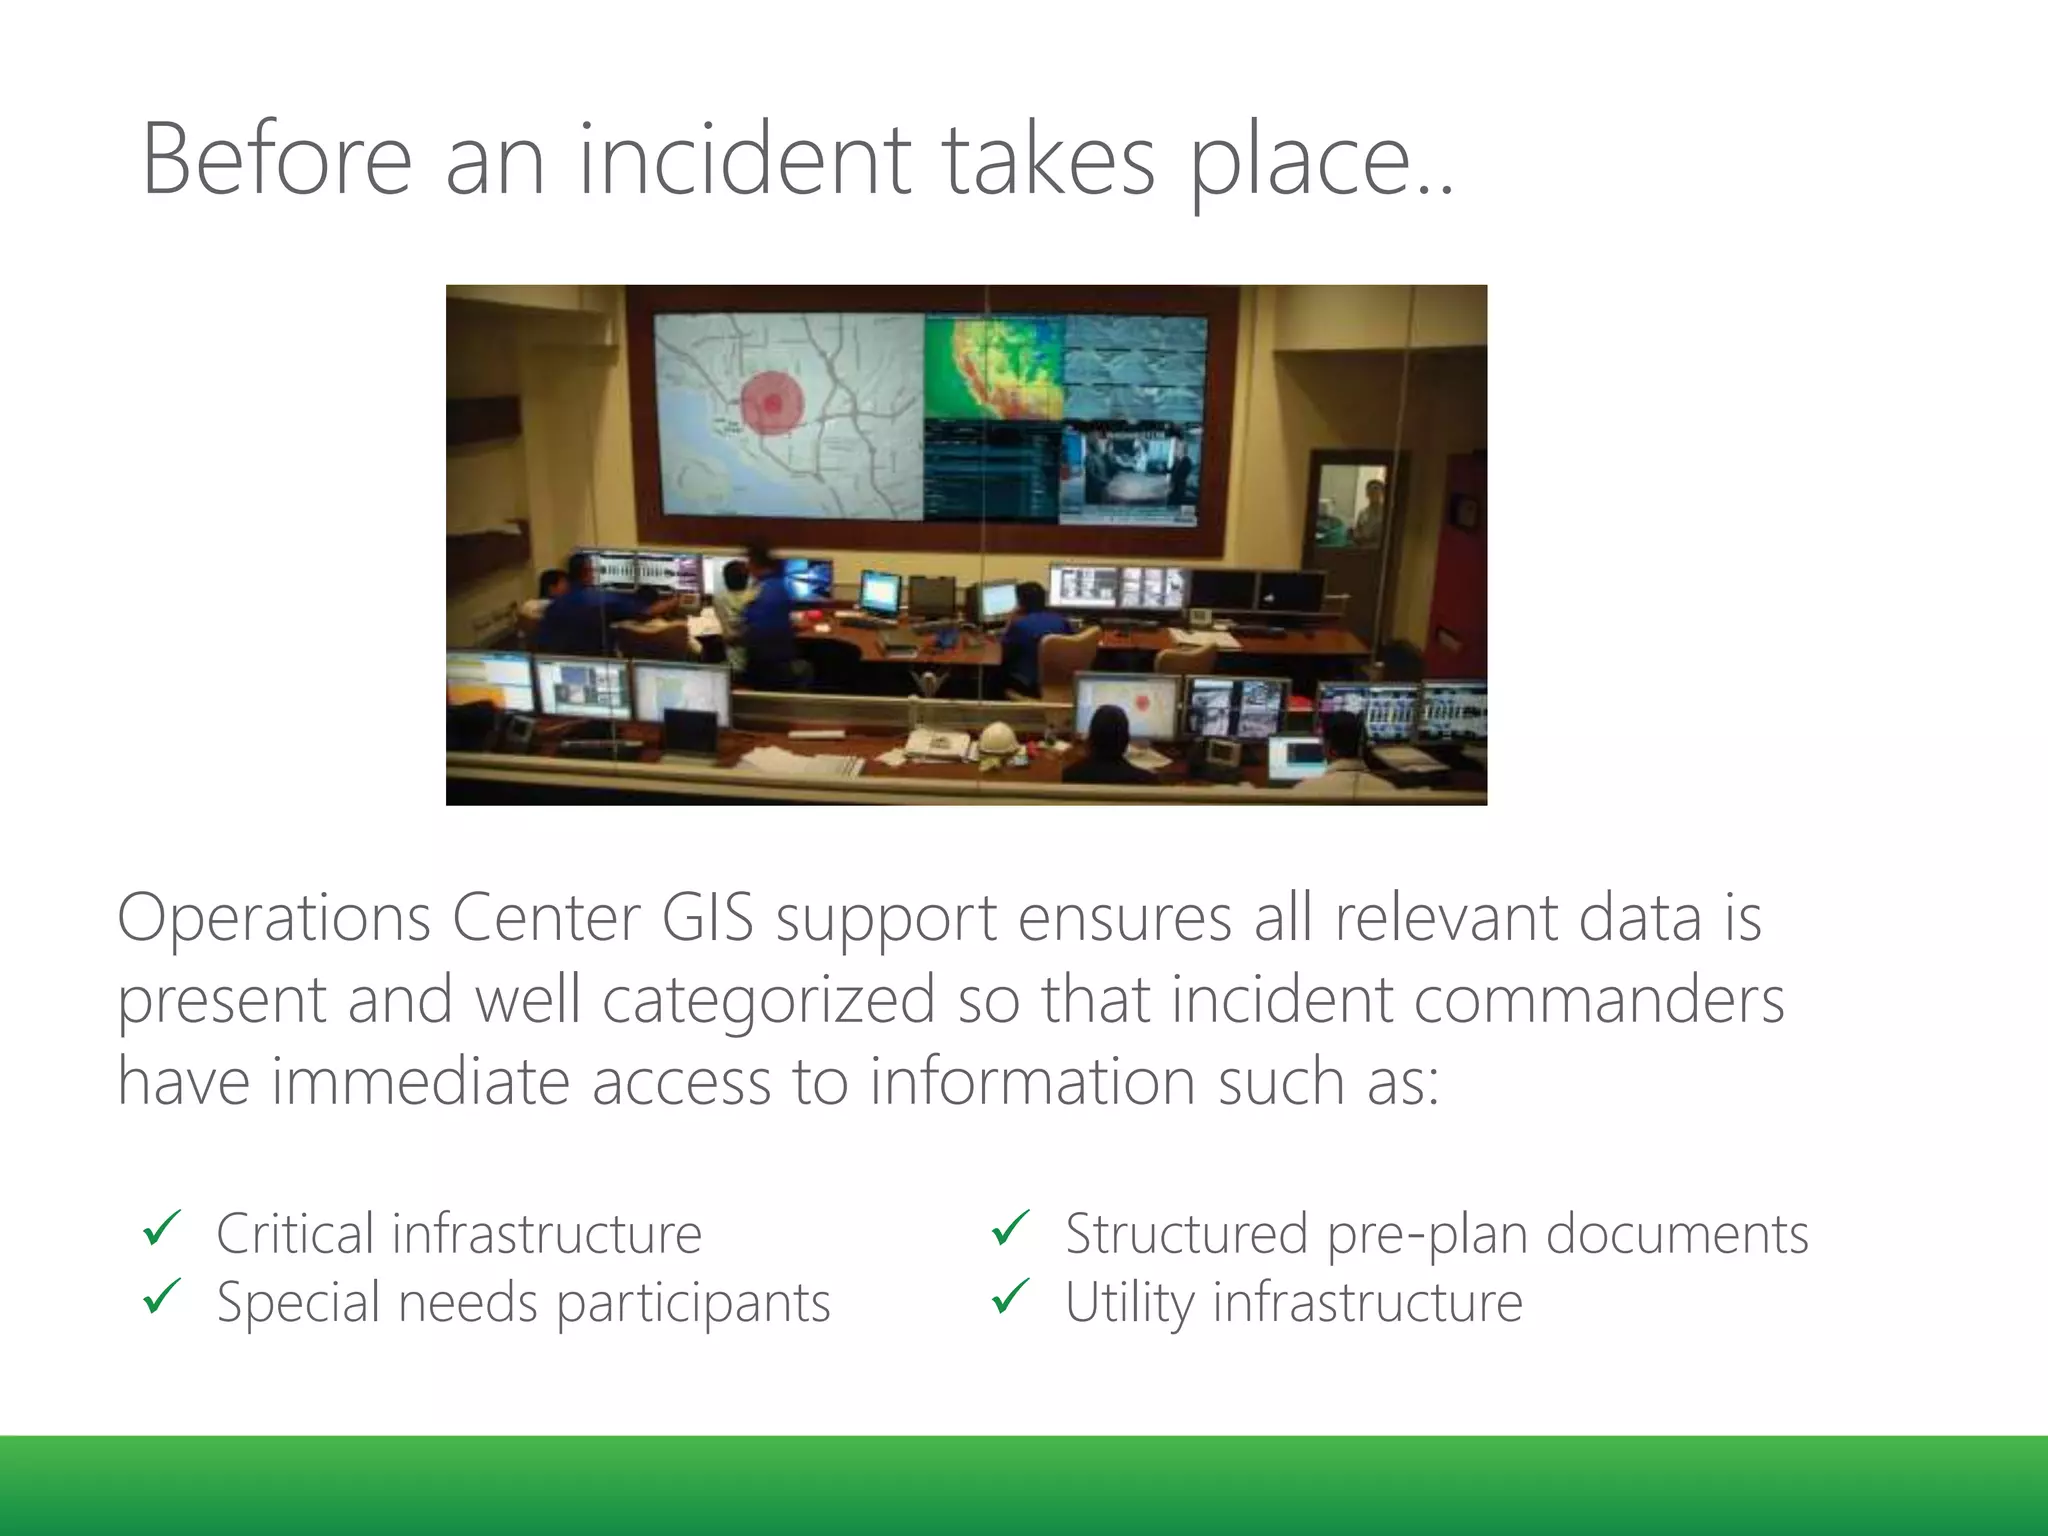
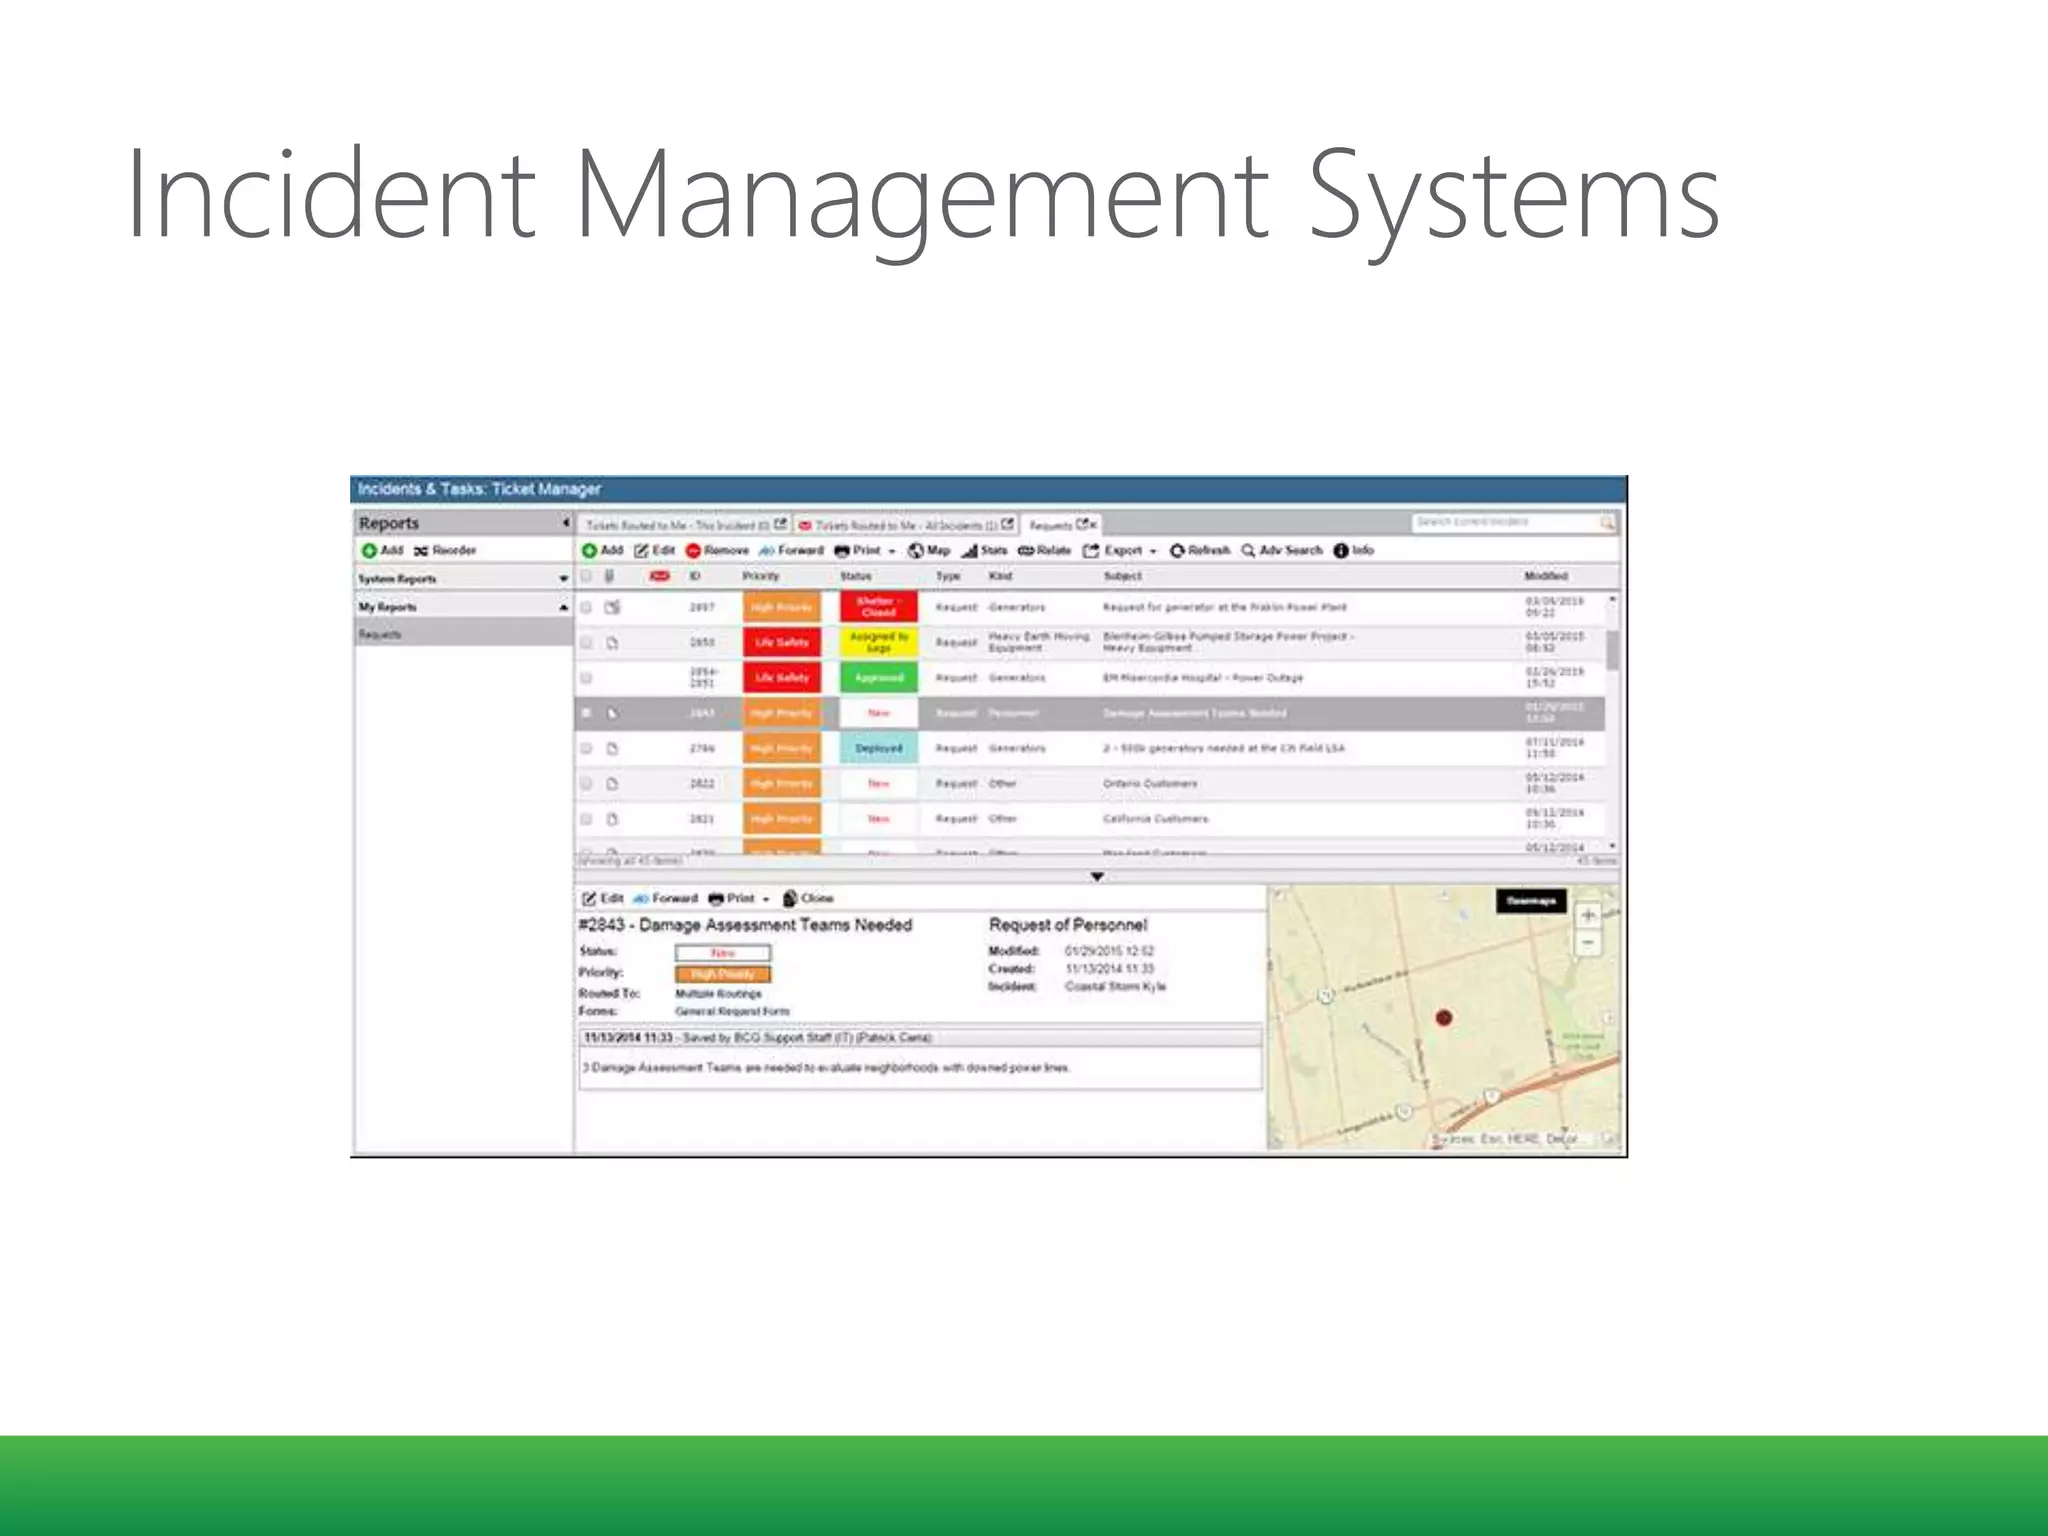
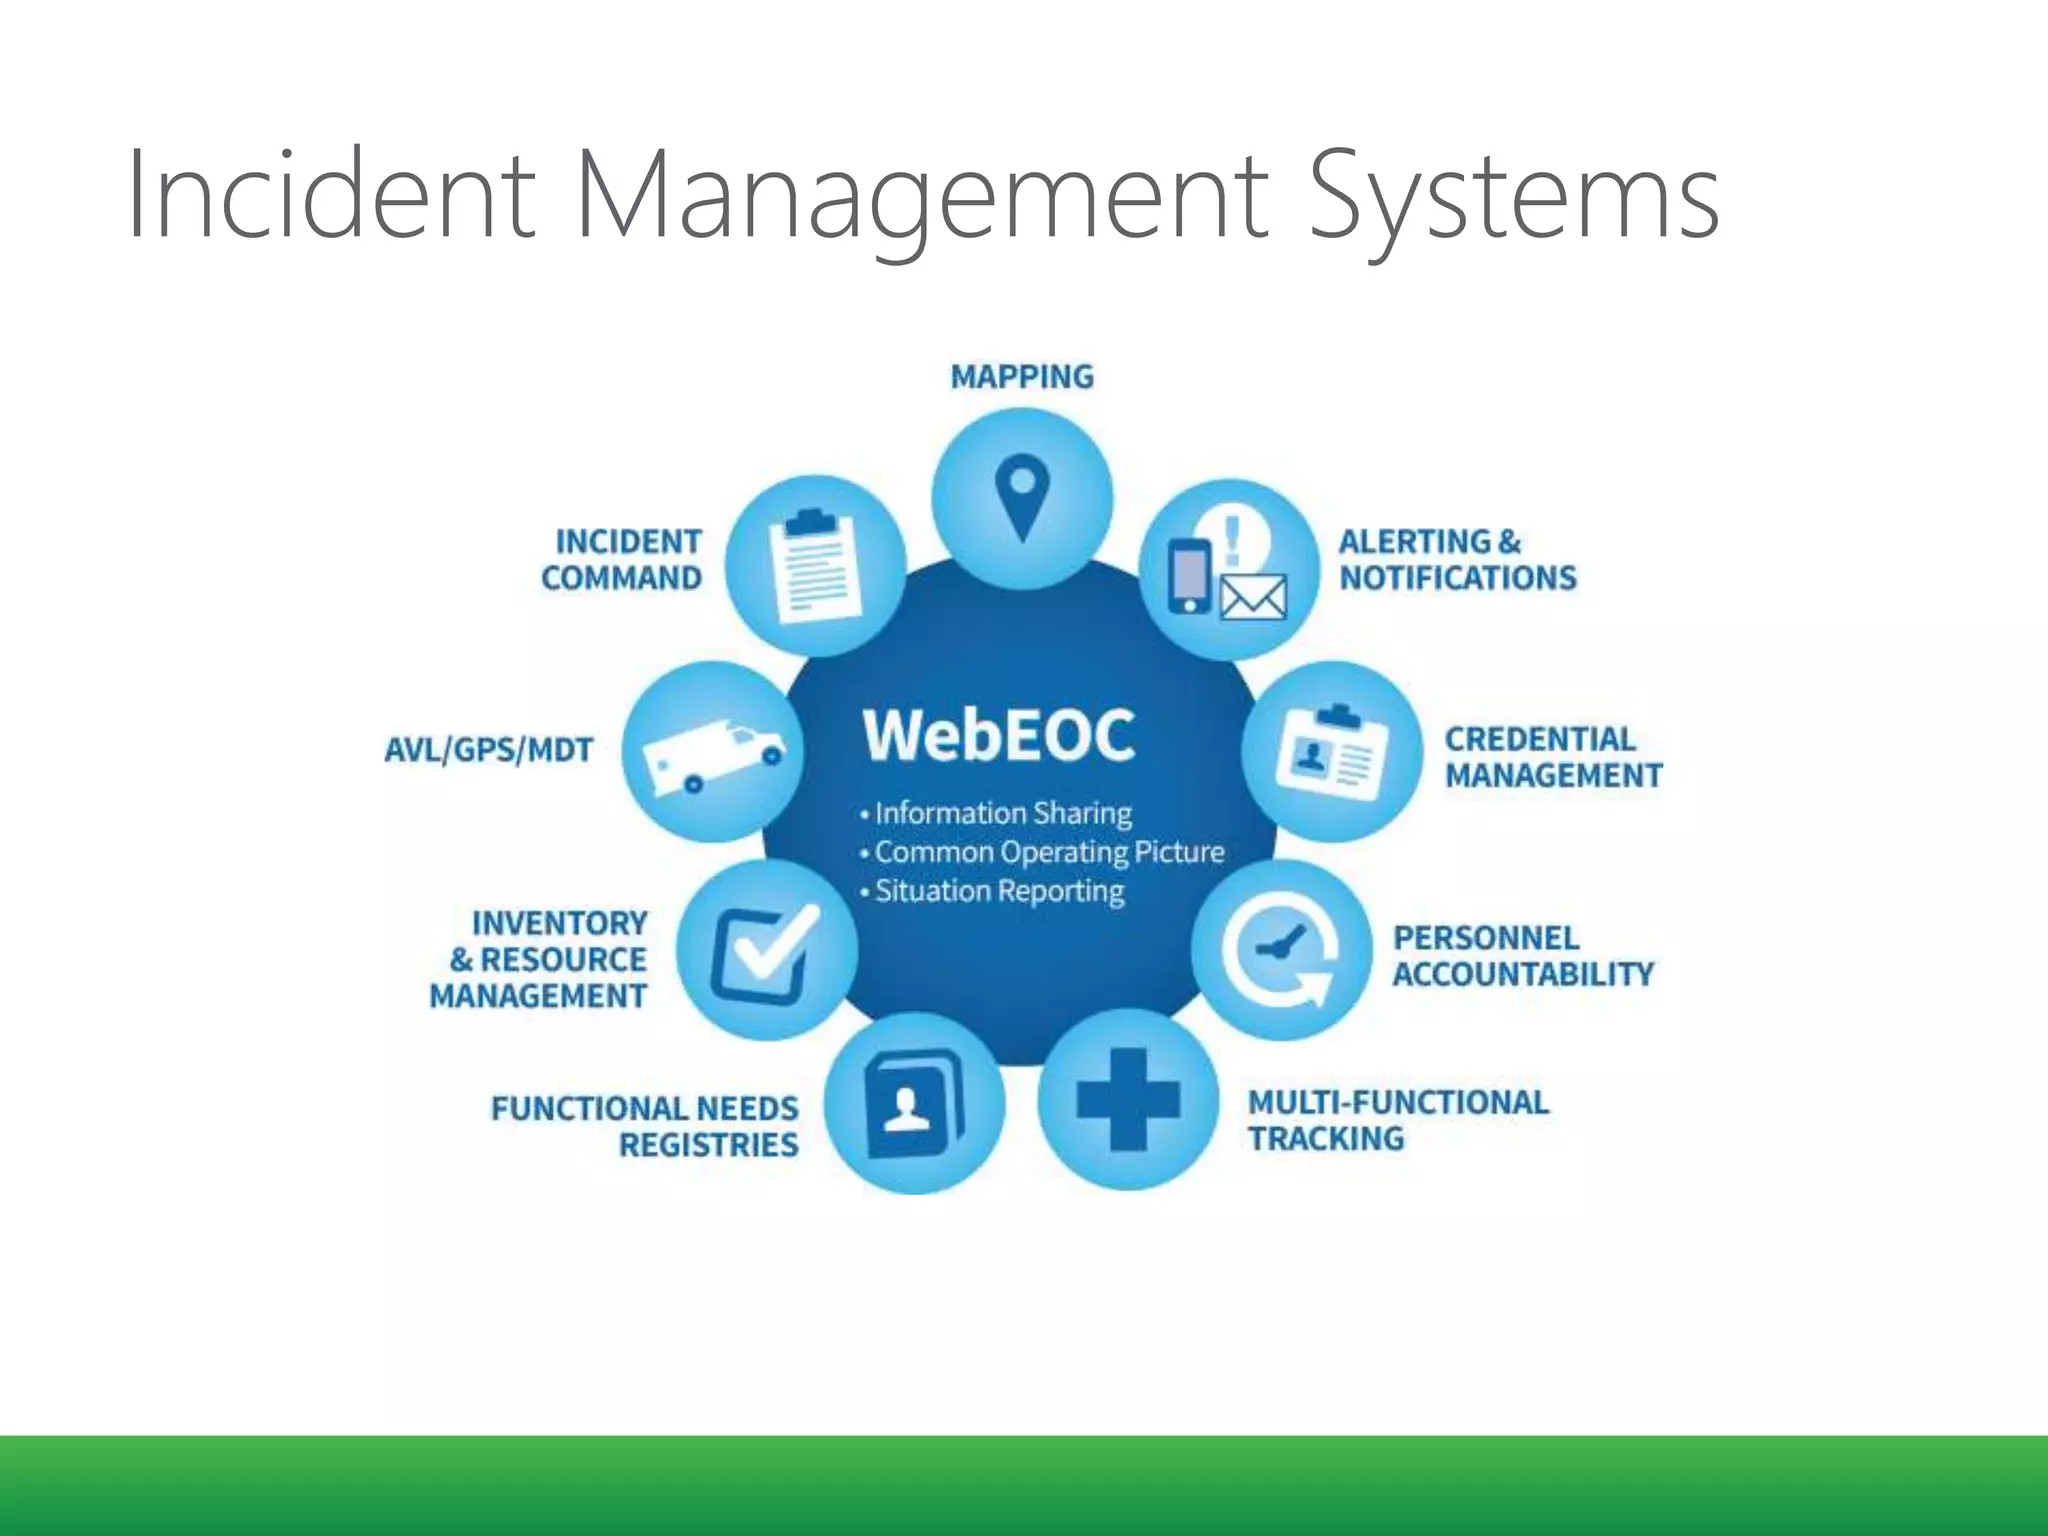
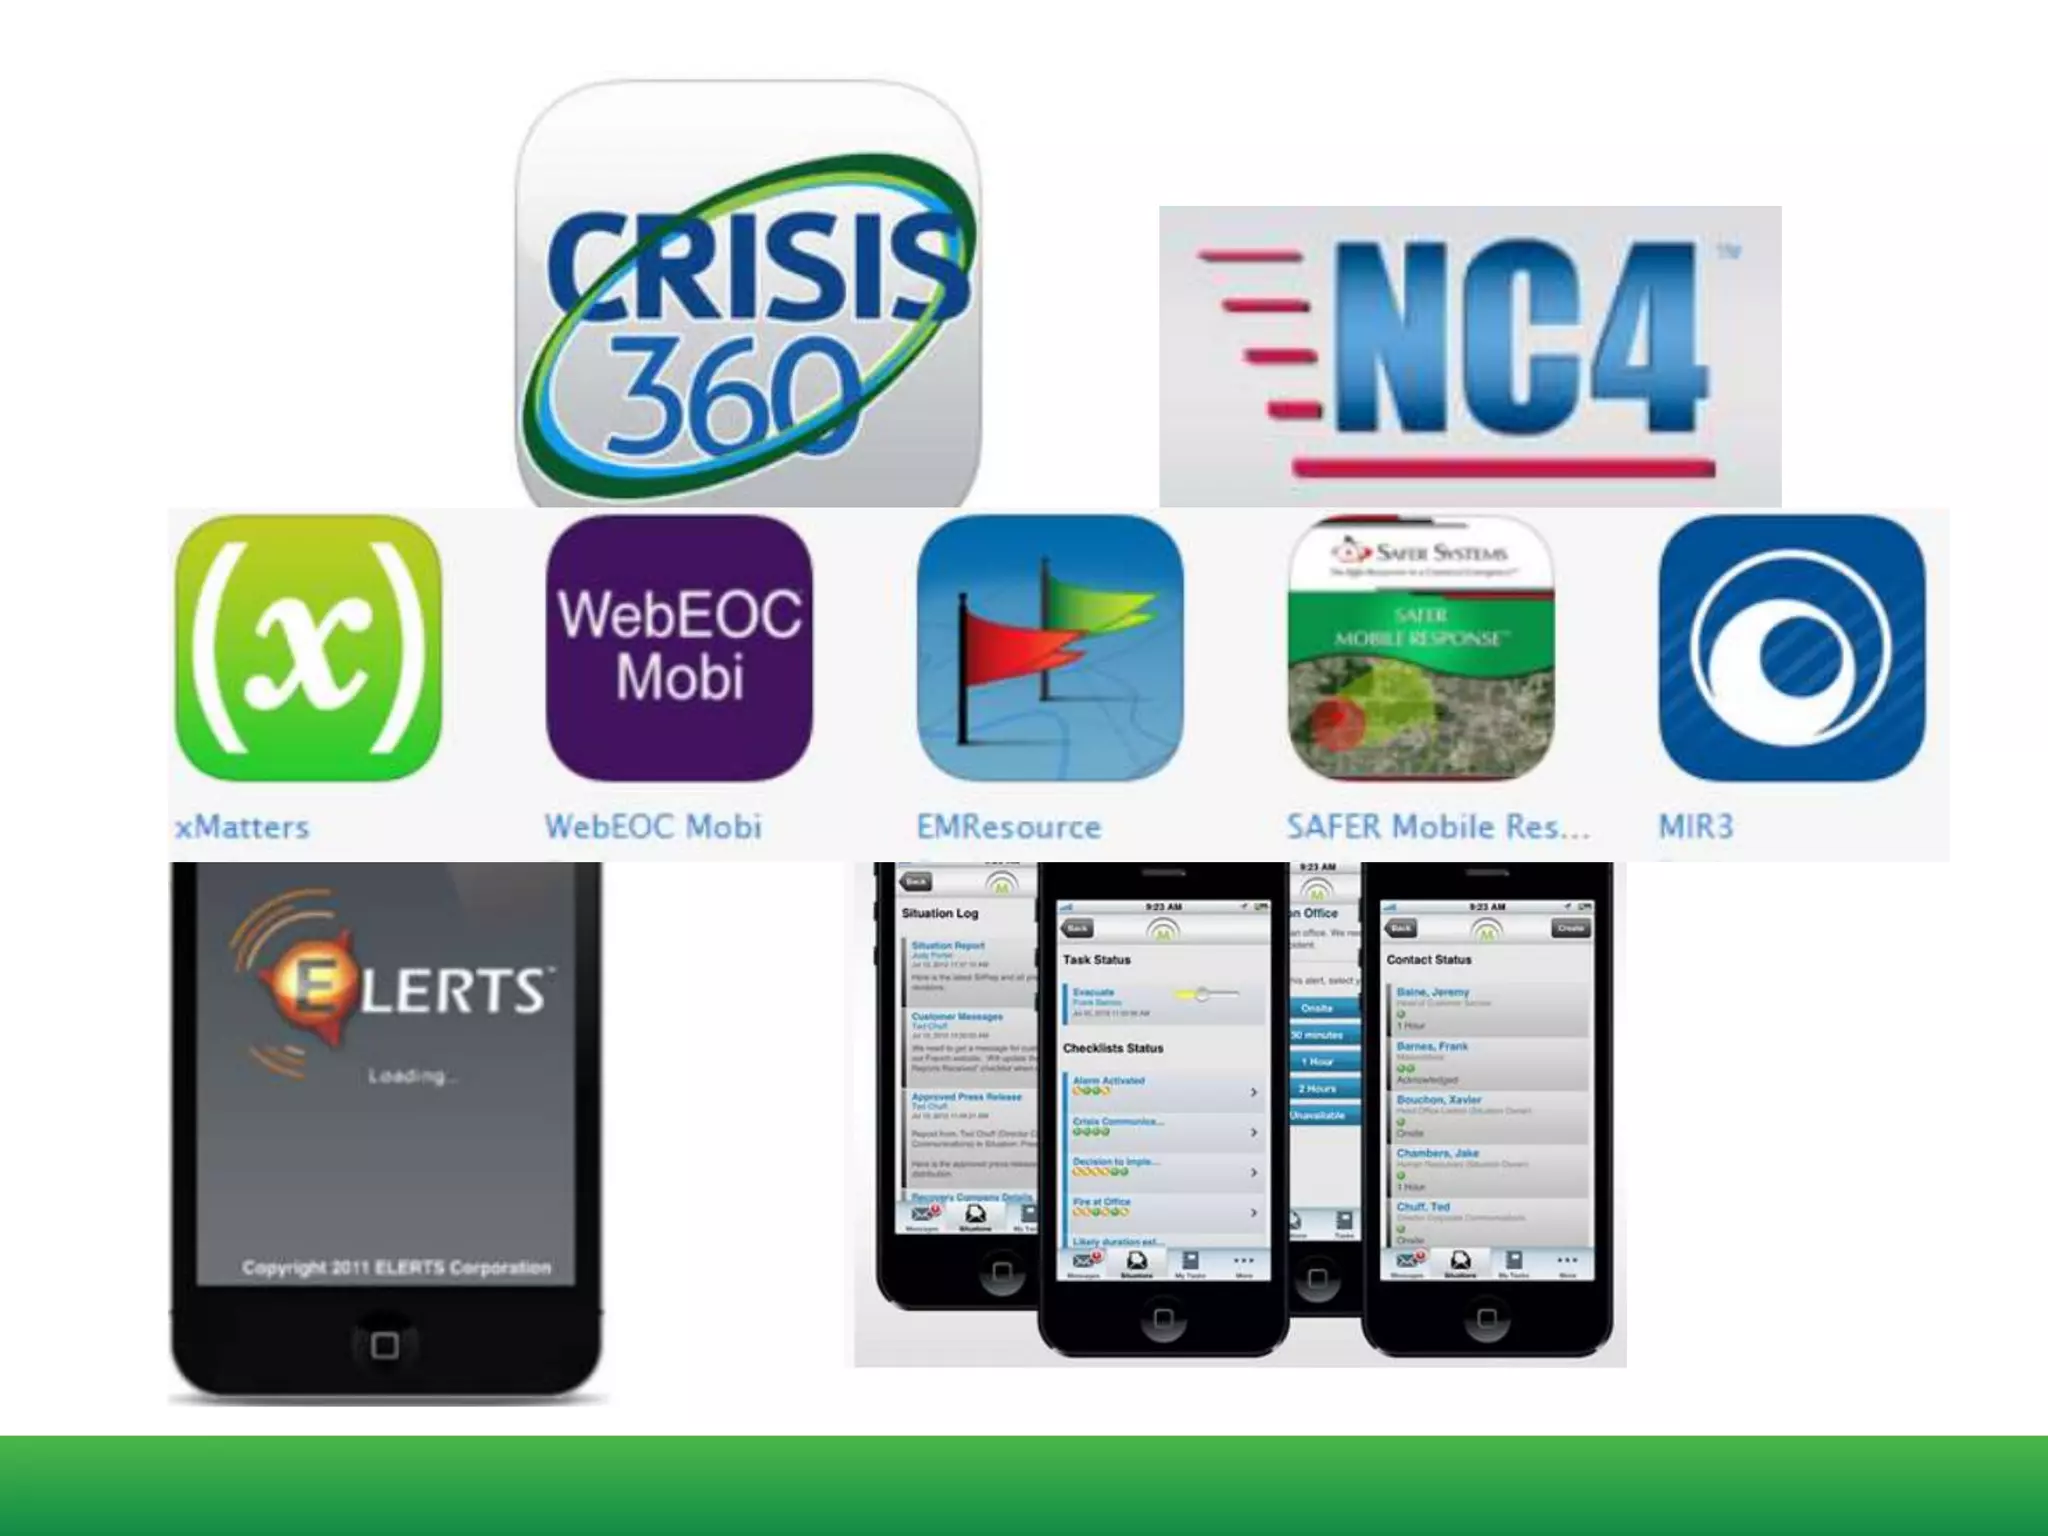
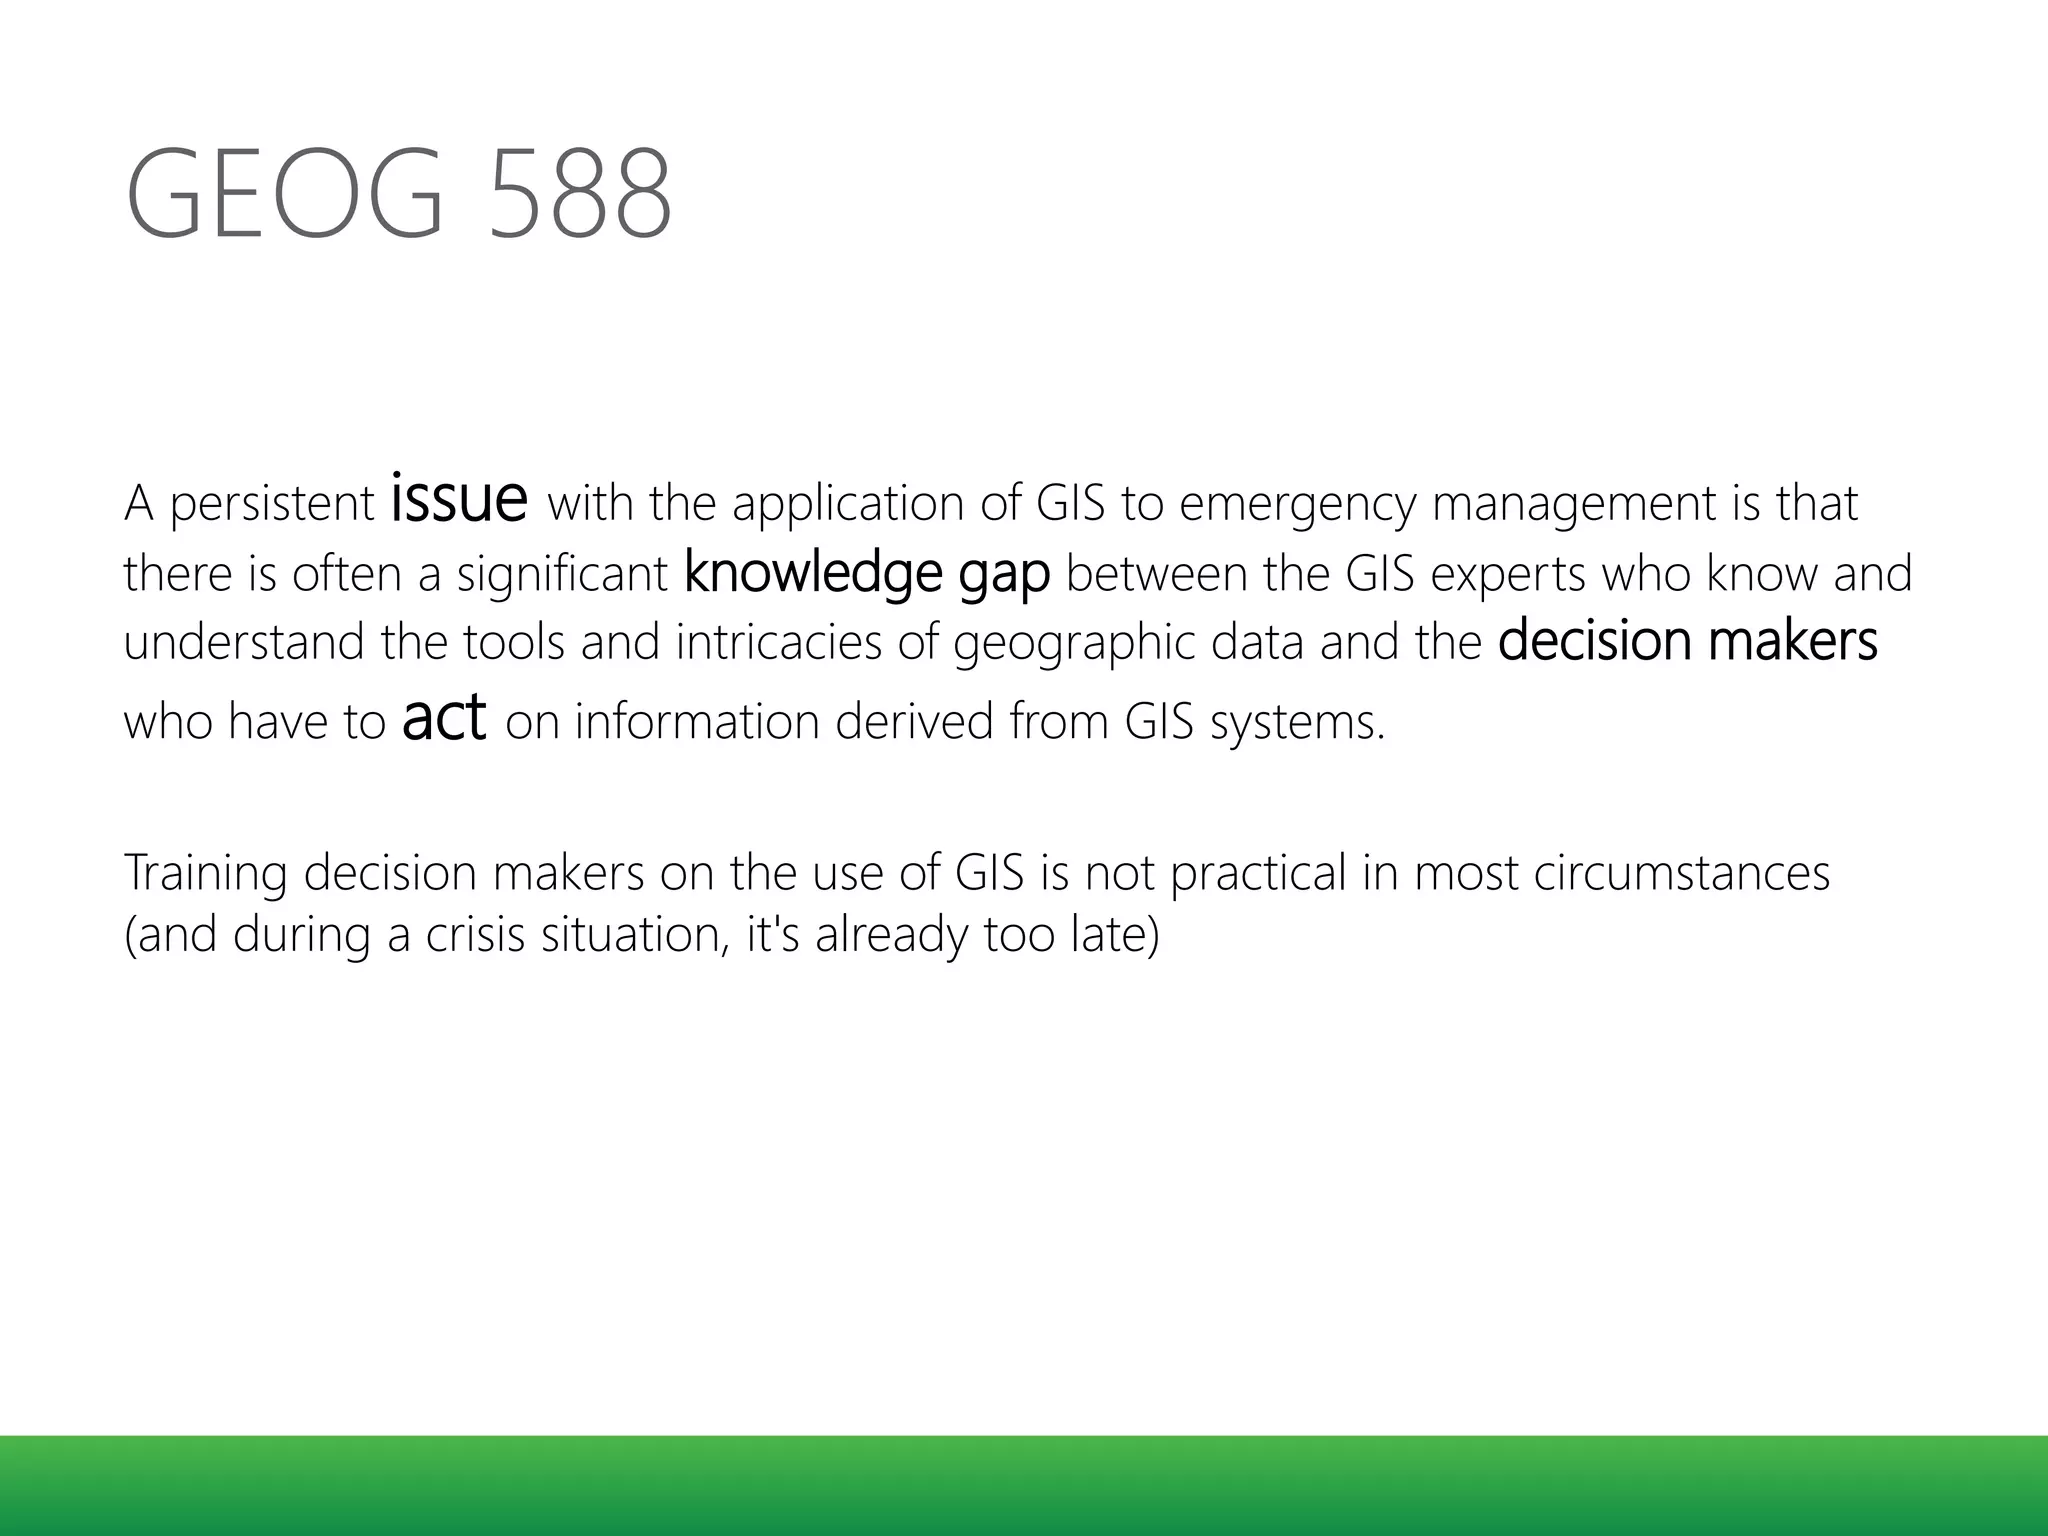
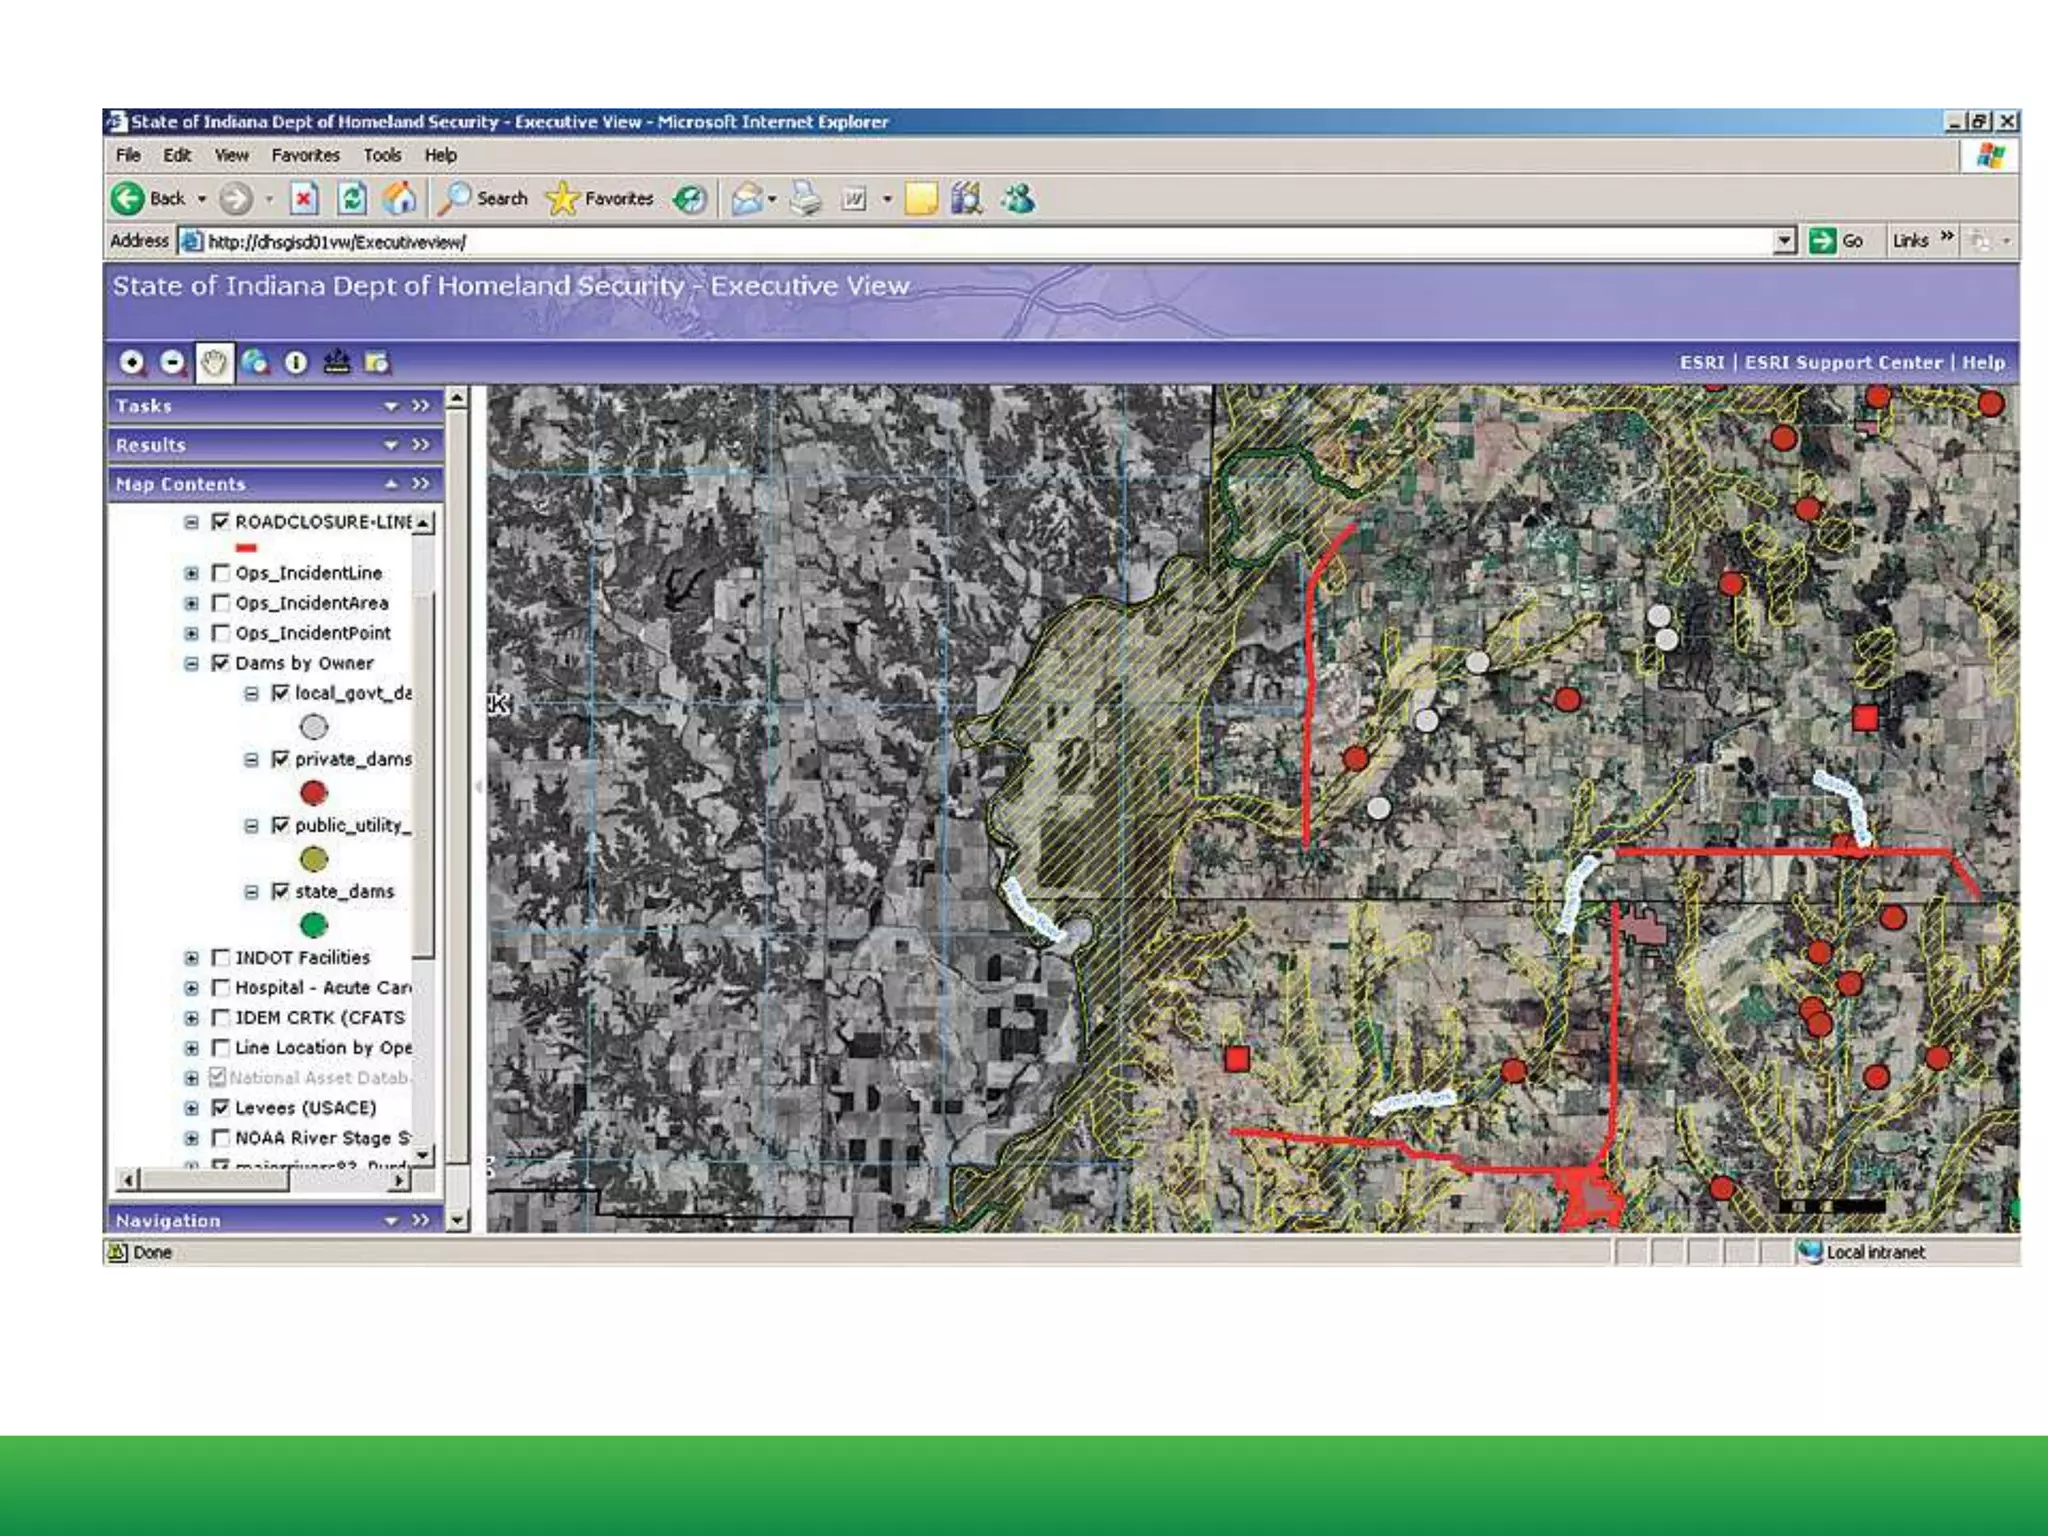
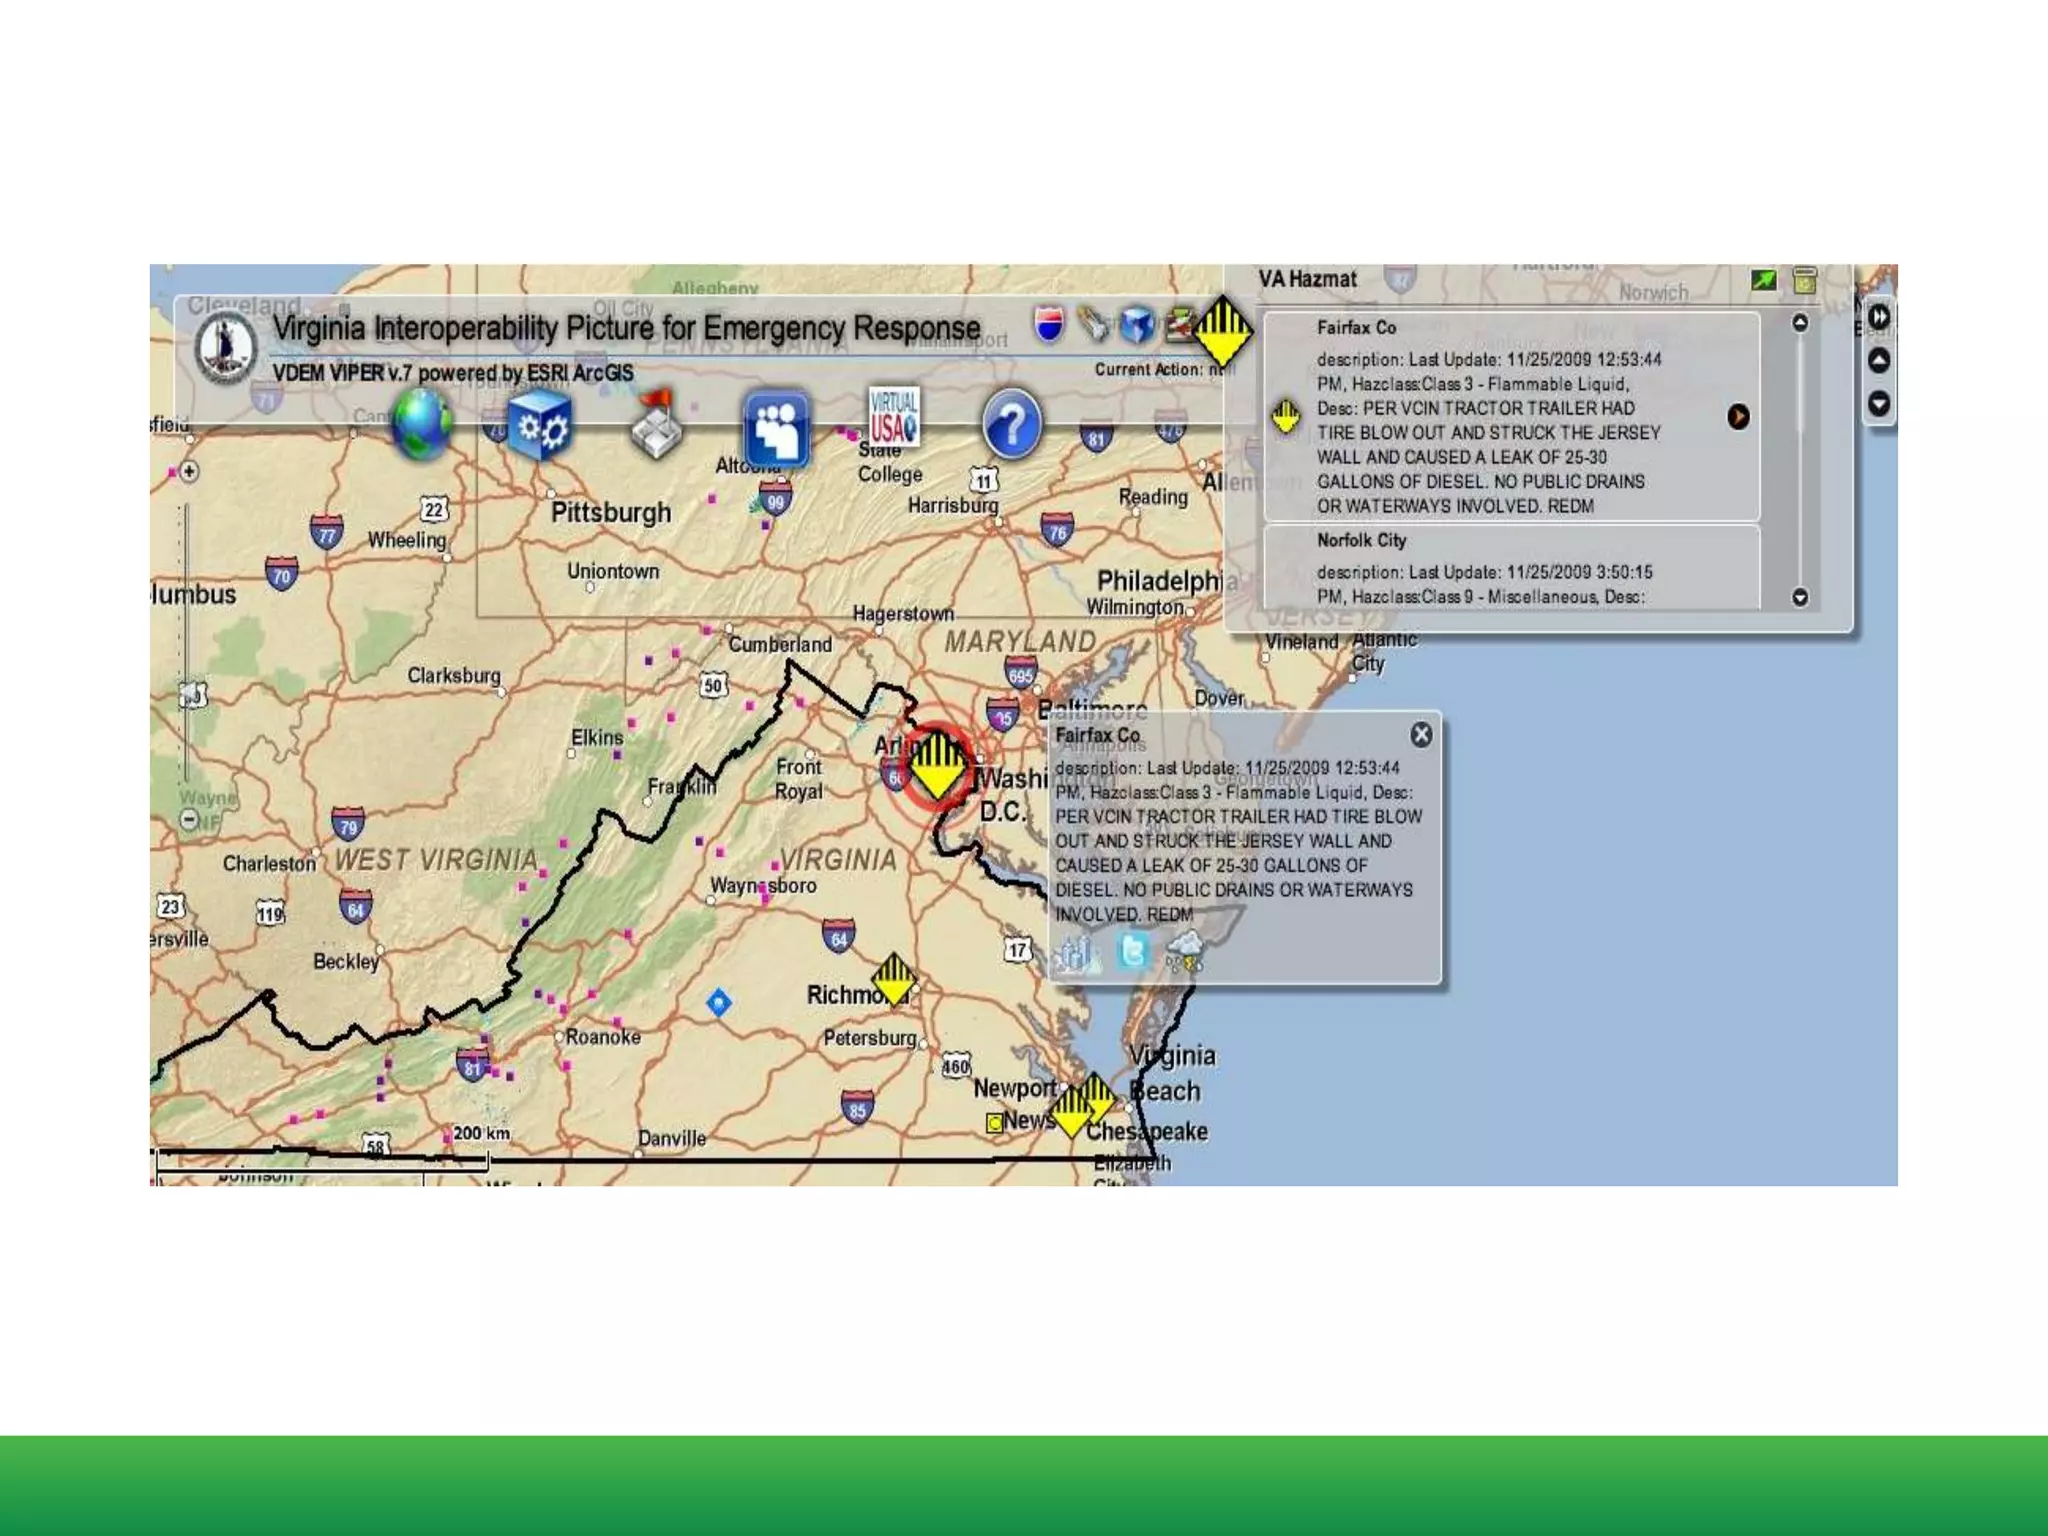
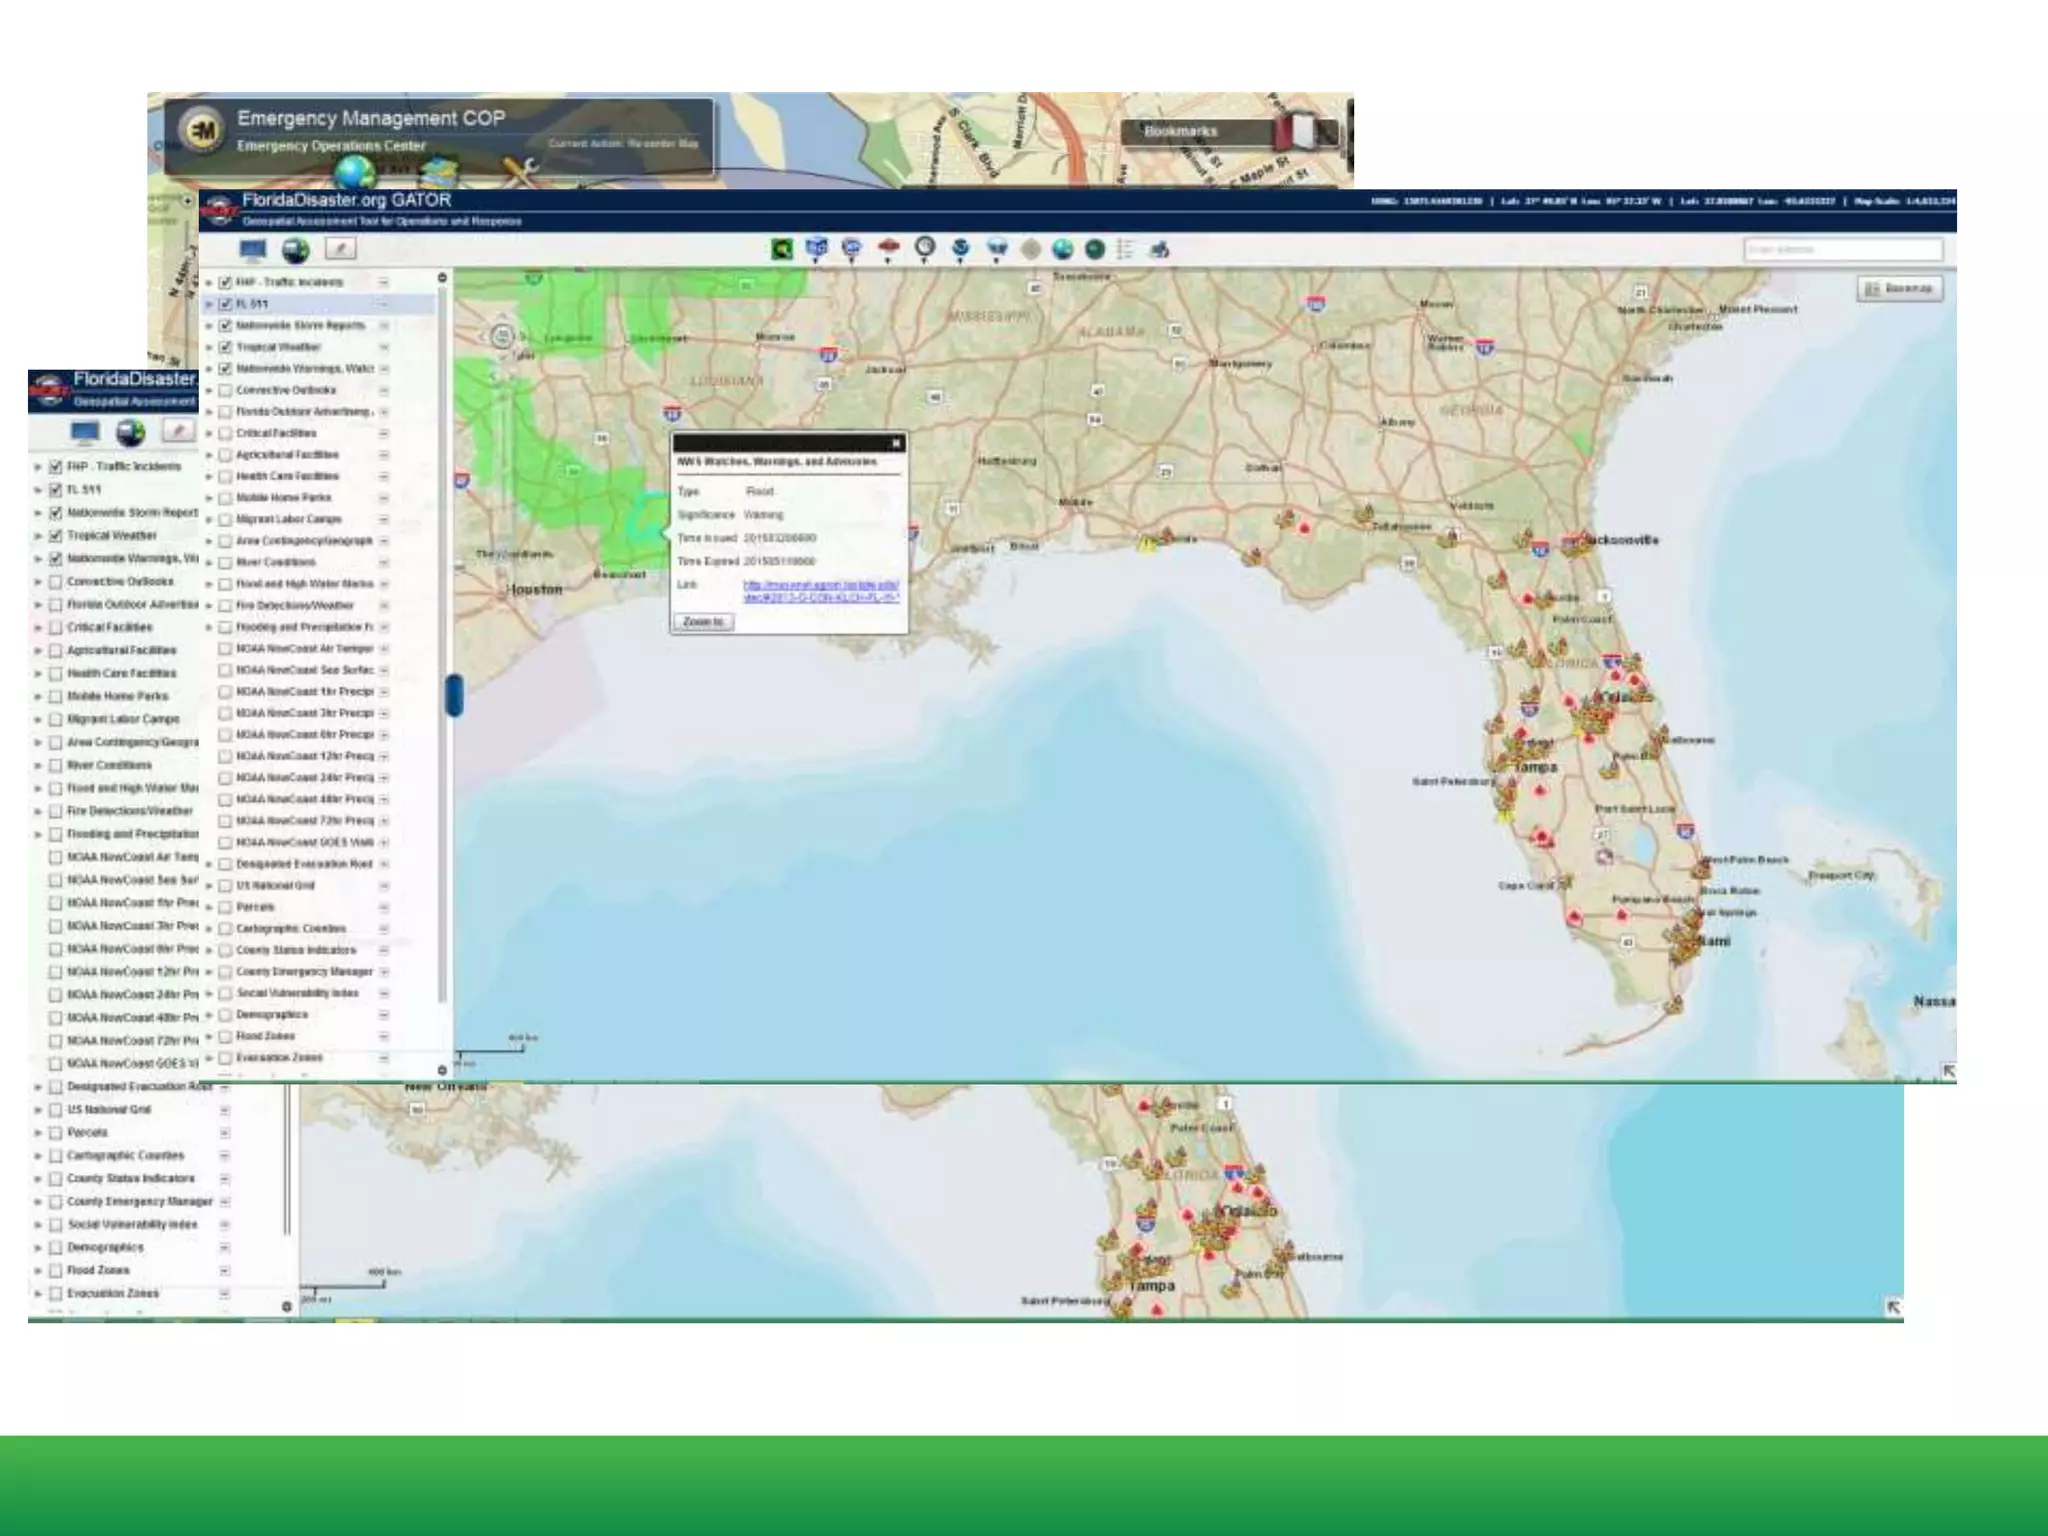
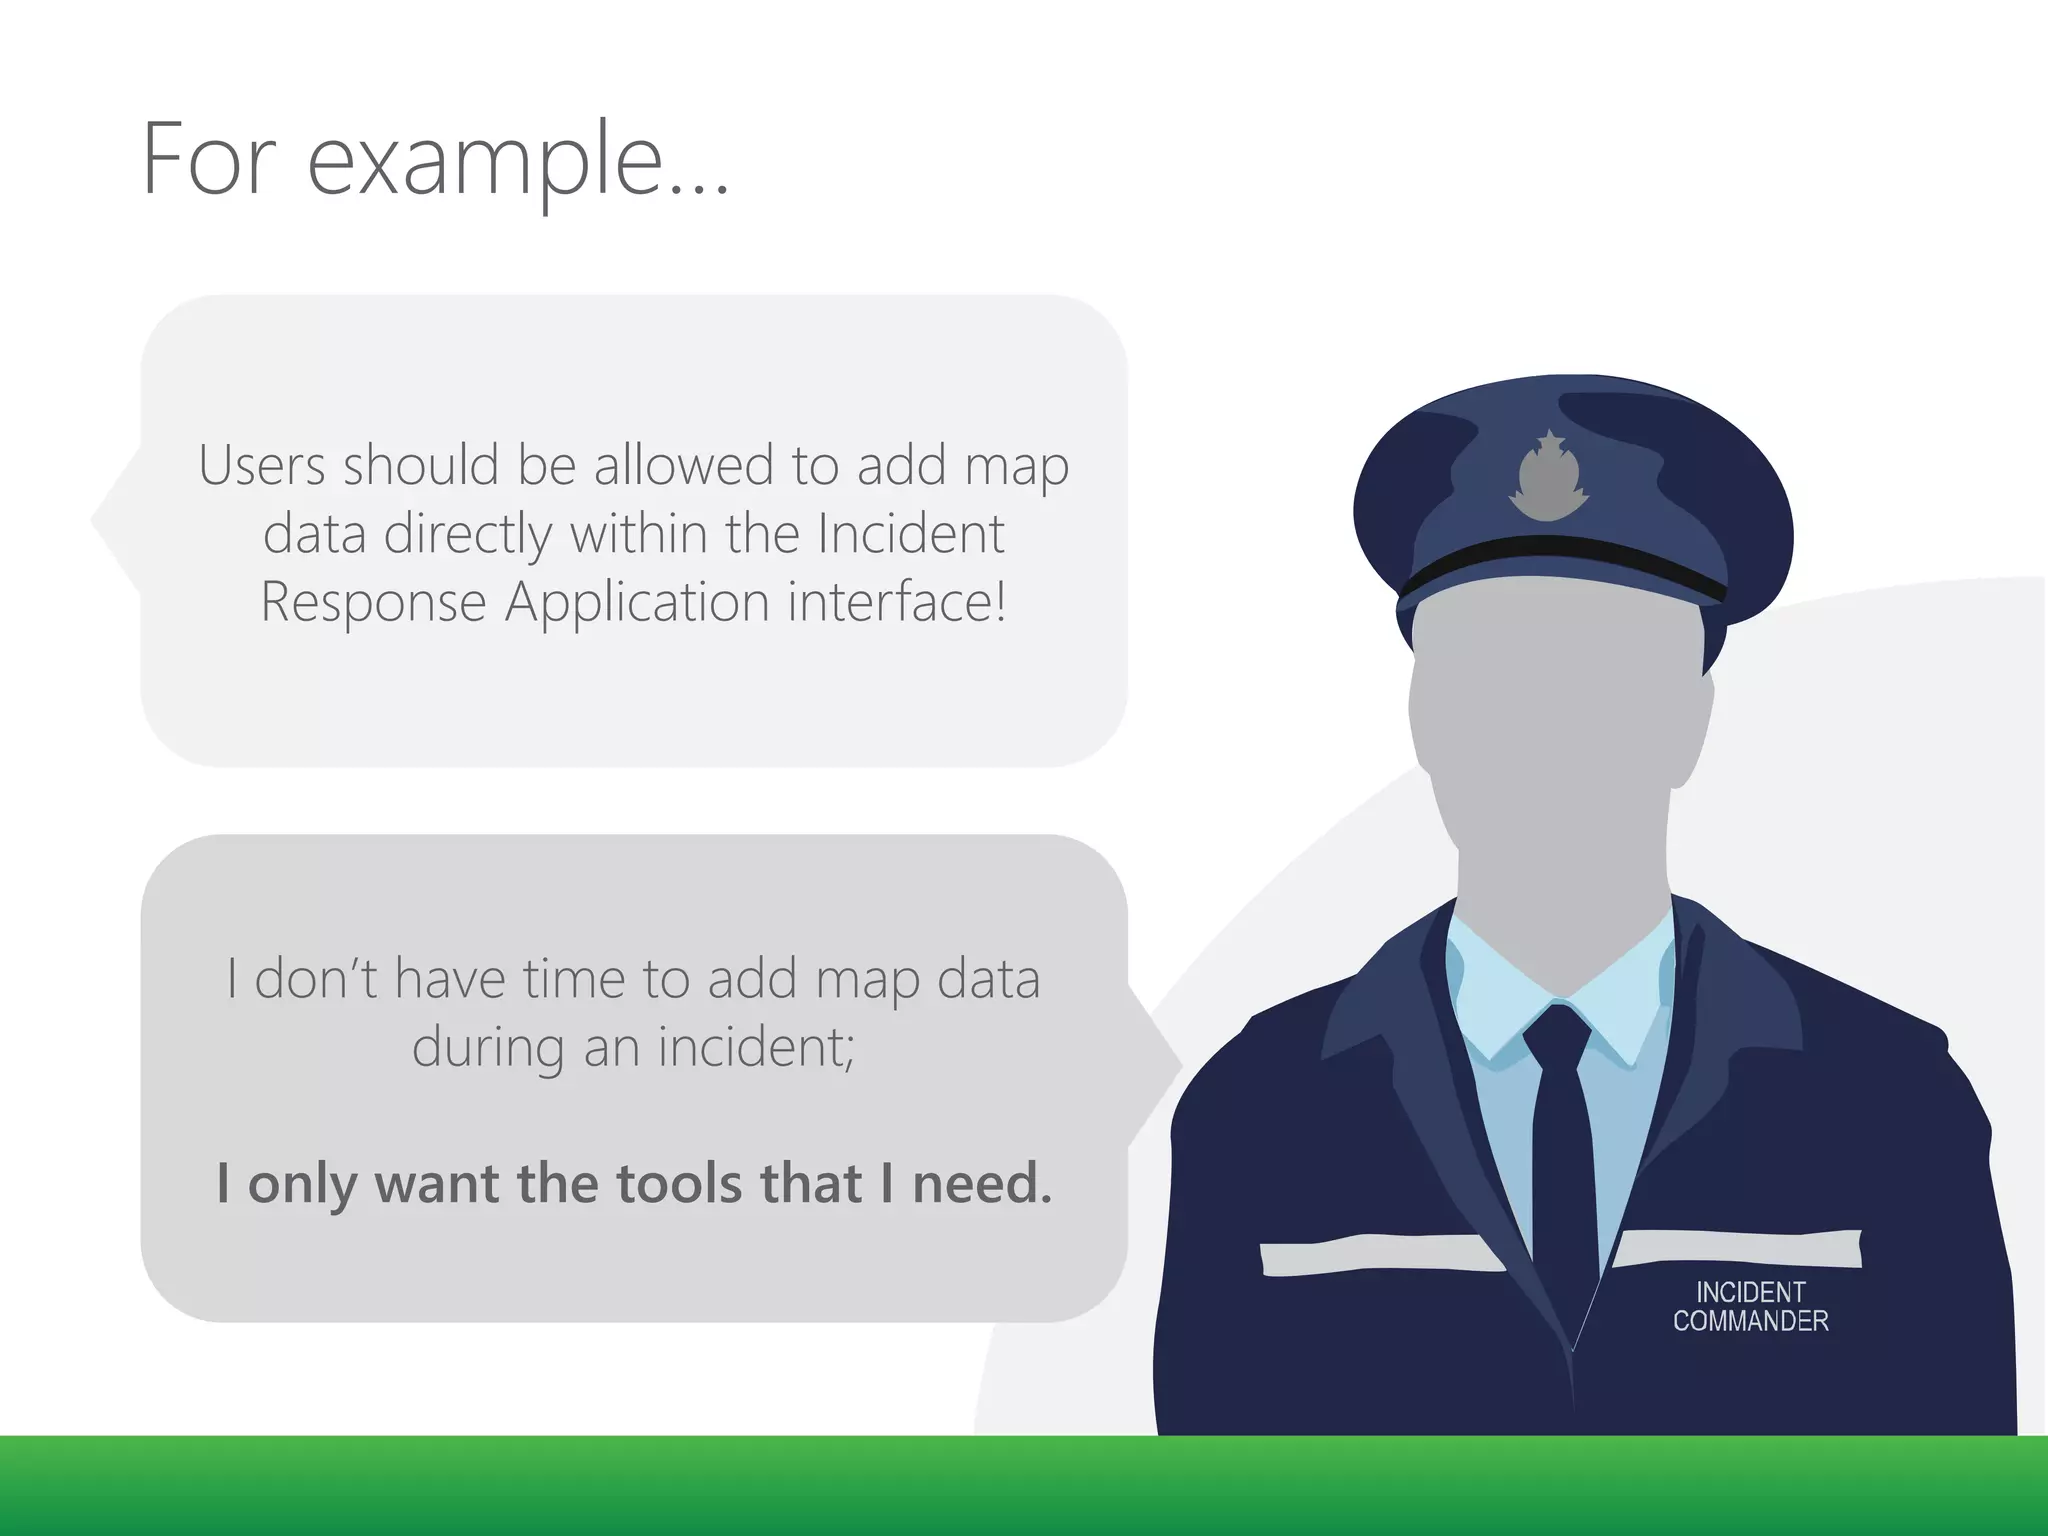
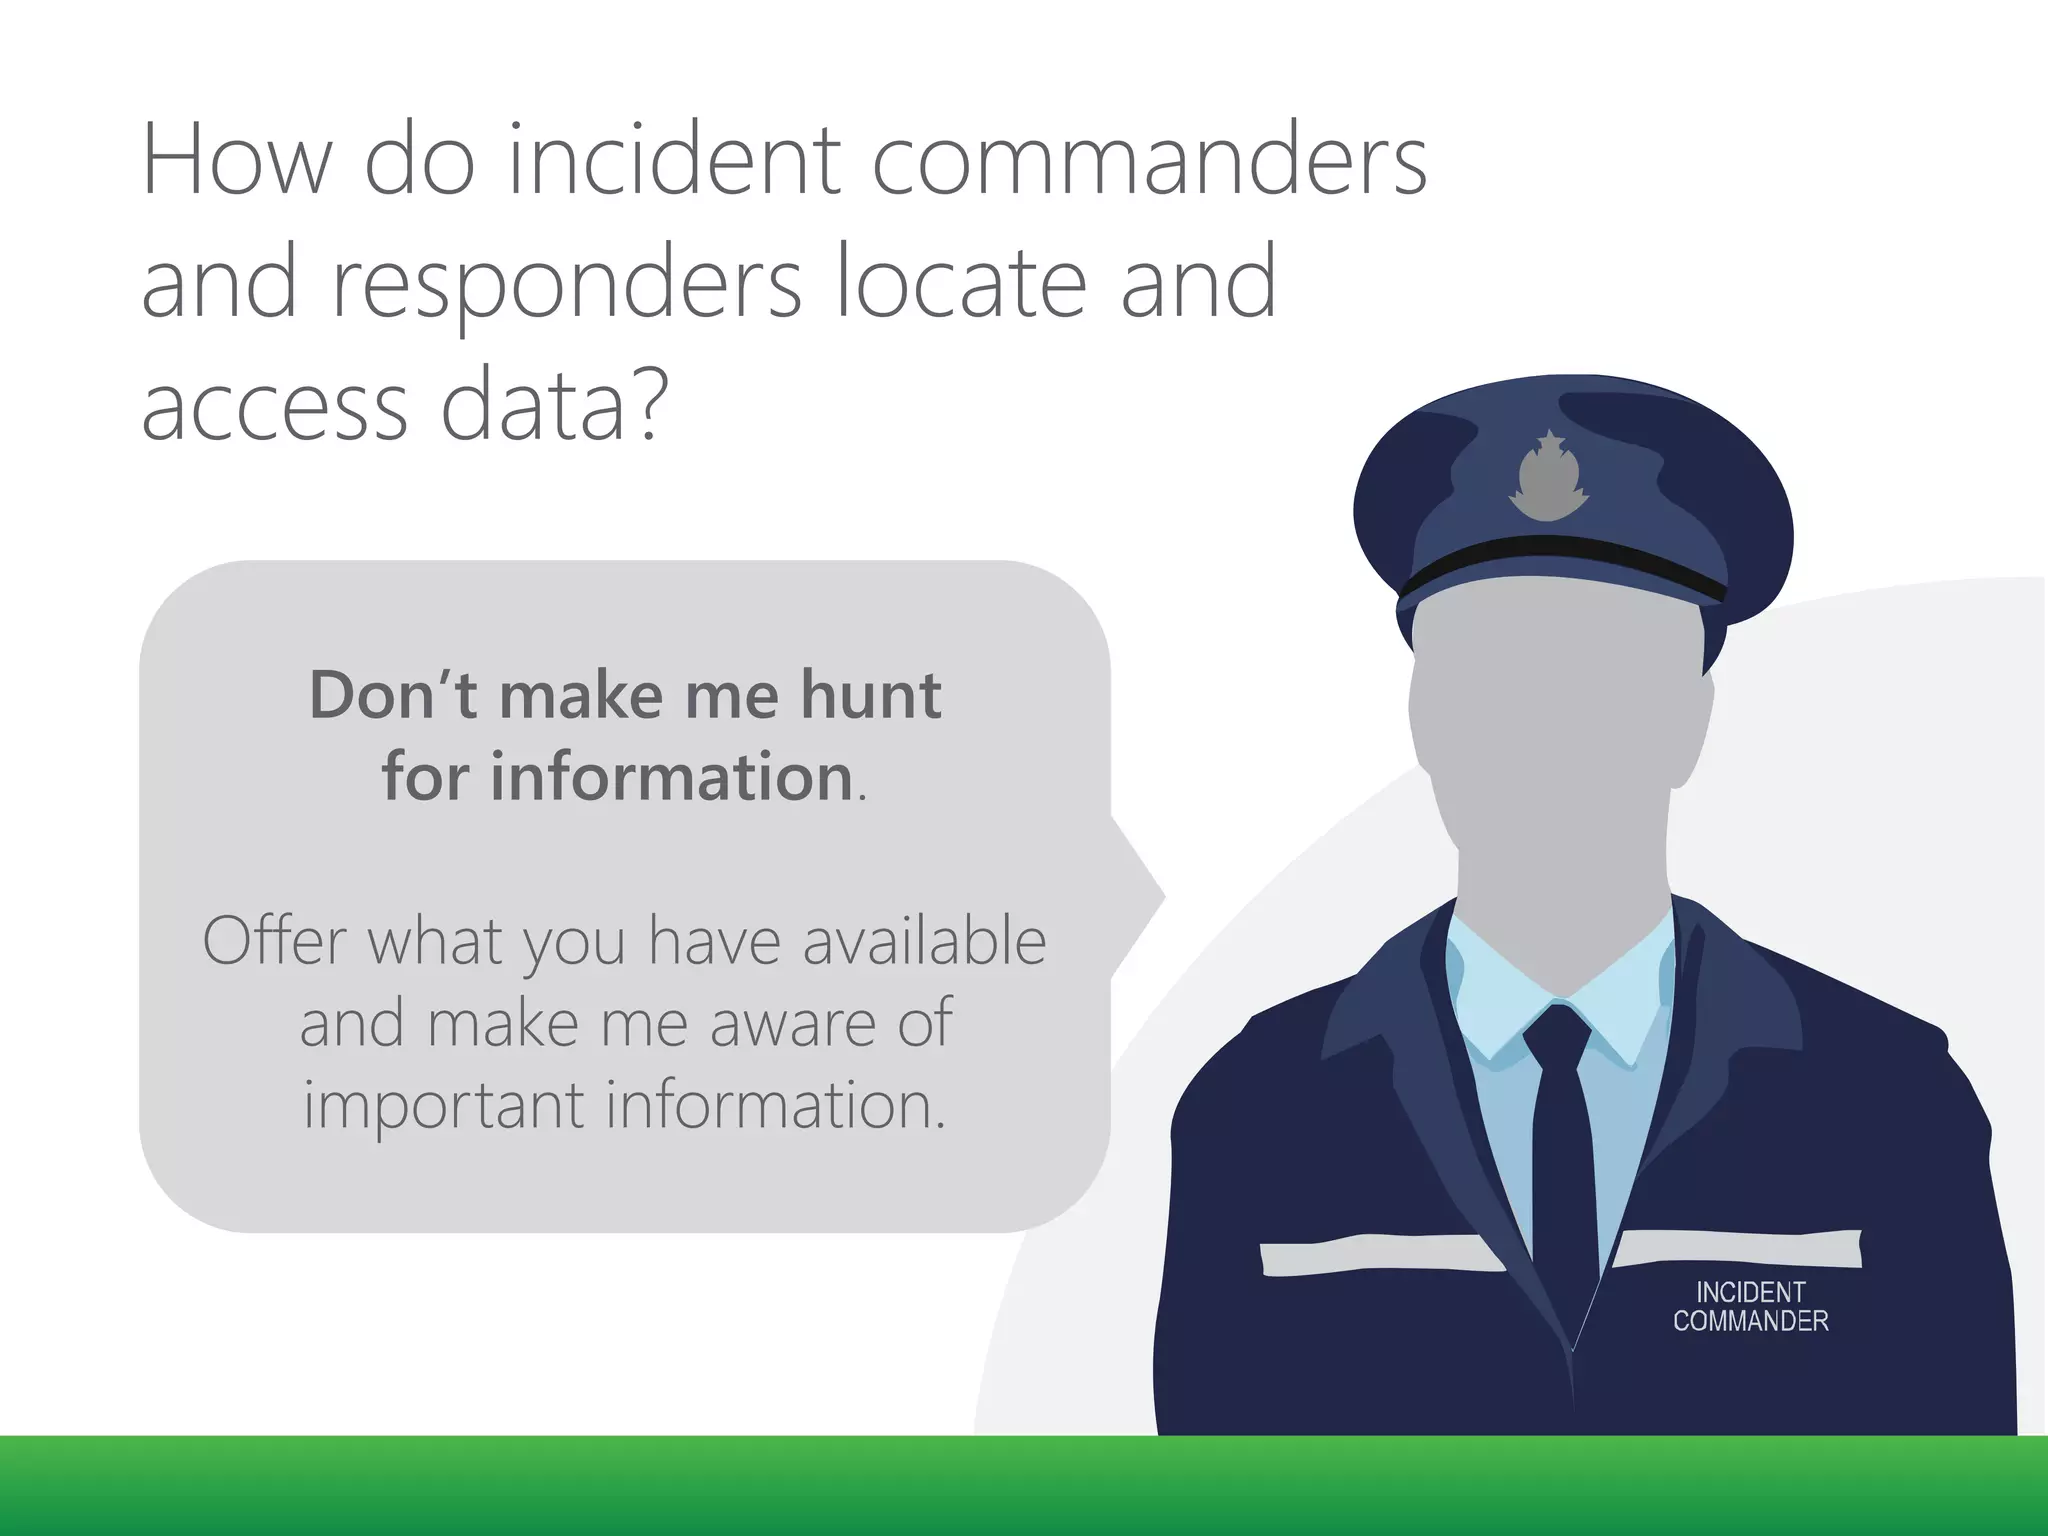
This document discusses the use of GIS systems to support emergency management and response. It outlines how GIS is used to provide decision makers with information on first responder resources and areas that need assistance. It also describes how GIS can be used before and during an incident to provide access to critical infrastructure data, special needs participants, and utility maps. The document notes that effective response depends on quickly analyzing information and sharing it with responders in the field. It discusses challenges in training decision makers on GIS and the need for dashboard designs that are readily understandable without training. Finally, it presents strategies for building configurable GIS software to support emergency management.
2018 GIS in Recreation: The Latest Trail Technology Crowdsourcing Maps and AppsGIS in the Rockies
Americans are increasingly recognizing the health, quality of life, environmental, and economic benefits that trails and active transportation offer. As a result, now more than ever it’s important to connect people to our trails, improve the planning of new trails, and better understand how visitors use trails.
For this session, we’ll explore what role technology plays in how people engage with trails. How can land managers utilize technology to publish better information to their visitors and also understand who’s engaging with their recreational infrastructure? Learn how to reach and understand new audiences, using everything from apps that get people outdoors to crowdsourced data.
Data Innovation: Generating Climate Solutions EventUN Global Pulse
This high-level event will jump-start proceedings of the Sustainable Innovation Forum with discussions and examples of data-driven innovations to accelerate climate solutions and the Sustainable Development Agenda.
Prepared for the Voting Information Technology Summit, Leslie Bradshaw of JESS3 walks through some of the fundamentals of creating compelling and engaging content that is still informative through data visualization.
Presentation was originally delivered in Austin, TX on December 10, 2010.
S595 APA 2011 session, What's Next for Planning Technology presented by Crystal Wilson, Chris Haler, and Ben Berkowitz. We had text voting on each topic. Voted as one of the best presentations at the conference!
Messagestock.com is a stock of Text Sms and can Share SMS Messages On Facebook, Birthday Greetings, Funny, Romantic, Condolence, Patriotic, Christmas, Ramadhan, Eid and almost all Occasional
Bill Miller
MAGIC, Homer Babbidge Library, University of Connecticut
This presentation shows developments in MAGIC’s collection of digital air photography.
<meta>Messagestock.com is a stock of Text Sms and can Share SMS Messages On Facebook, Birthday Greetings, Funny, Romantic, Condolence, Patriotic, Christmas, Ramadhan, Eid and almost all Occasional
Jennifer Gazzillo
UMassSafe Traffic Safety Research Program
The goal of this research effort was to produce a ranked list of Massachusetts roadway corridors, weighted by crash frequency and severity. An Equivalent Property Damage Only (EPDO) crash weighting formula was derived to equate the cost to society by using the maximum personal injury level in the crash. Analysis was conducted across all major Massachusetts roadways in one-mile segments, followed by the completion of a rolling-corridor statistical analysis which looked at ten consecutive one-mile segments. Tools that had been utilized previously for similar analysis were not successful in this case, so the research team developed a unique methodology, requiring the manual splitting of all roads into similarly sized segments, then using a “join” command to sum the EPDO value of any crash within the designated buffer. Although improvements of the methodology are ongoing, the research team is successfully implementing the results in a targeted enforcement safety campaign being undertaken by the state police.
Messagestock.com is a stock of Text Sms and can Share SMS Messages On Facebook, Birthday Greetings, Funny, Romantic, Condolence, Patriotic, Christmas, Ramadhan, Eid and almost all Occasional
The Critical Role of Spatial Data in Today's Data EcosystemSafe Software
In today's data-driven landscape, integrating spatial data is becoming increasingly crucial for organizations aiming to harness the full potential of their data. Spatial data offers unique insights based on location, making it a fundamental component for addressing various challenges across different sectors, including urban planning, environmental sustainability, public health, and logistics.
Our webinar delves into the indispensable role of spatial data in data management and analysis. We'll showcase how omitting spatial data from your data strategy not only weakens your data infrastructure, but also limits the depth of your insights. Through real-world case studies, we'll highlight the transformative impact of spatial data, demonstrating its ability to uncover complex patterns, trends, and relationships.
Join us for this introductory-level webinar as we explore the critical importance of spatial data integration in driving strategic decision-making processes. By the end of the webinar, you'll gain a renewed perspective on how spatial data is essential for confronting and overcoming challenges across various domains.
Messagestock.com is a stock of Text Sms and can Share SMS Messages On Facebook, Birthday Greetings, Funny, Romantic, Condolence, Patriotic, Christmas, Ramadhan, Eid and almost all Occasional
Bill Miller
MAGIC, Homer Babbidge Library, University of Connecticut
This presentation shows developments in MAGIC’s collection of digital air photography.
<meta>Messagestock.com is a stock of Text Sms and can Share SMS Messages On Facebook, Birthday Greetings, Funny, Romantic, Condolence, Patriotic, Christmas, Ramadhan, Eid and almost all Occasional
Jennifer Gazzillo
UMassSafe Traffic Safety Research Program
The goal of this research effort was to produce a ranked list of Massachusetts roadway corridors, weighted by crash frequency and severity. An Equivalent Property Damage Only (EPDO) crash weighting formula was derived to equate the cost to society by using the maximum personal injury level in the crash. Analysis was conducted across all major Massachusetts roadways in one-mile segments, followed by the completion of a rolling-corridor statistical analysis which looked at ten consecutive one-mile segments. Tools that had been utilized previously for similar analysis were not successful in this case, so the research team developed a unique methodology, requiring the manual splitting of all roads into similarly sized segments, then using a “join” command to sum the EPDO value of any crash within the designated buffer. Although improvements of the methodology are ongoing, the research team is successfully implementing the results in a targeted enforcement safety campaign being undertaken by the state police.
Messagestock.com is a stock of Text Sms and can Share SMS Messages On Facebook, Birthday Greetings, Funny, Romantic, Condolence, Patriotic, Christmas, Ramadhan, Eid and almost all Occasional
The Critical Role of Spatial Data in Today's Data EcosystemSafe Software
In today's data-driven landscape, integrating spatial data is becoming increasingly crucial for organizations aiming to harness the full potential of their data. Spatial data offers unique insights based on location, making it a fundamental component for addressing various challenges across different sectors, including urban planning, environmental sustainability, public health, and logistics.
Our webinar delves into the indispensable role of spatial data in data management and analysis. We'll showcase how omitting spatial data from your data strategy not only weakens your data infrastructure, but also limits the depth of your insights. Through real-world case studies, we'll highlight the transformative impact of spatial data, demonstrating its ability to uncover complex patterns, trends, and relationships.
Join us for this introductory-level webinar as we explore the critical importance of spatial data integration in driving strategic decision-making processes. By the end of the webinar, you'll gain a renewed perspective on how spatial data is essential for confronting and overcoming challenges across various domains.
Hazards Reporting Based On Real-Time Field Data Collection Using Personal Mob...IJARIIT
Hazard is a situation or thing that has the potential to harm people's, property or the environment. Hazardous area cause many people health. So we must to prevent from it. We are develop hazard reporting system to prevent from hazard prob- lem. Important task of the Reporting is Data Collection.The Geo-spatial Data is used to Indicate the Data along with the geographic component.This means that the data set have loca- tion information tied to them such as geographical data in the form of coordinates,address,city,or ZIP code.User report to the organization by using the same data and organization solve that problem.
http://spr.ly/Finance_PM - Explore how three key attributes of "Big Data" – volume, velocity, and variety – have a profound impact on financial planning. Explore how technology developments are converging to create the Big Data rush and can assist with planning and performance management (Beyond Budgeting, 2013).
React’s suitability to develop Geospatial solutions.pdfMindfire LLC
Application development is a critical necessity for many firms that seek to create unique user experiences. This can range from a simple interface that provides relatively specialized access to data, such as data monetization, to a more comprehensive solution that supports complicated business decisions, such as site selection. According to 182 Pages Report, the worldwide geospatial solutions market is expected to reach USD 502.6 billion by 2024, up from USD 239.1 billion in 2019, at a CAGR of 13.2 percent over the forecast period. In this article, we will discuss the significance of react in geospatial solutions.
This PPT provides you the essential information about the emerging technologies in the field of computer science.
Data Mining,Cloud Computing, Artificial Intelligence,Internet of Things and many more.
If you took a Geography course over 20 years ago, you might recall the subject involving little more than memorizing the locations of continents, countries, cities, as well as climate and cultural facts. In that time, many universities have expanded their geography programs by entering the world of Geographic Information Systems, or GIS for short. In the beginning GIS was an obscure field of specialized hardware, software, and cryptic keyboard commands that allowed a skilled professional to query data to get answers to geographic-based inquiries. Queries, such as the quantity of forested acres within an area, were the beginning of the geographicbased analysis revolution that has since unfolded. But today’s leading geography programs are teaching students more than just the where, what, who, and why of our world, but also bring to the table an interdisciplinary approach to solving today’s local, regional, national, and global problems. Many of these programs are not limited to just universities, now involving the K-12 space, tapping into young people’s minds to unleash innovative ideas in what is now an interdisciplinary field. To maintain a competitive advantage in today’s world, leading countries, companies, and research organizations are embracing these new capabilities and the talent that is available in the marketplace.
Towards Cartographic Standards for Web-Based Flood Hazard Mapsnacis_slides
NACIS 2016 Presentation
Eben Dennis, Icon Engineering, Inc.
Robert Soden, University of Colorado
Online, interactive web-maps are rapidly becoming important tools in the communication of flood hazards and the visualization of risk information more generally. Although there is a wealth of study and information available guiding the design of traditional cartographic products, there is comparatively little research available that is solely focused on web-mapping formats. This presentation will discuss initial findings of ongoing research being conducted in partnership between Icon Engineering and the University of Colorado, Boulder. Outcomes of the work will lead towards the development of design heuristics and best practices for visualizing flood data through interactive web-mapping products.
A "how-to" guide on creating successful websites or Apps. The three elements are (1) Design for User Tasks (2) Design for Flexibility (3) Design for Measurement. The presentation introduces numerous practical methodologies, e.g., The Application Mountain, The Water Mill Development Model, Onion Governance, and the User Task Matrix. Practical examples are taken from work at Scandinavian Airlines, Tryg Insurance, and Maersk.
Similar to Data Management in Emergency Prevention and Response (20)
Geospatial Condition Analysis: A new tool to assess the condition of northeast terrestrial and aquatic habitats
Mark Anderson, Melissa Clark, Charles Ferree, Alexandra Jospe, and Arlene Olivero Sheldon
The Nature Conservancy
We created a GIS tool to assess the condition of 116 terrestrial and aquatic habitats in the Northeast at state and regional scales. The tool is based on the newly released Northeast Terrestrial Habitat Map and the Northeast Aquatic Habitat Classification and their accompanying datasets. It allows each habitat to be evaluated across its entire range in the region or within a single state for condition factors such as predicted loss to development, securement from development, forest stand age, habitat patch size, amount of core area and others. For aquatic systems, users can summarize the number of dams, length of connected network, impervious surfaces in the watershed and other factors. The talk will illustrate how the tool works and summarize some of the findings for the fourteen ecological condition metrics, and comparative results of the metric as applied to the terrestrial and aquatic habitats across the region.
Michael Olkin
Town of Amherst, MA
Do you ever have the need to directly connect to a “non-spatial” database and display this data in a spatial format? Are you tired of copying and converting data in order to show it on a map? Query Layers and Spatial Views provide some powerful ways to directly display enterprise data in a spatial format. The purpose of this presentation is to demonstrate how to make use of these methods for spatially empowering your data.
More from Northeast Arc Users Group Presentations (6)
Builder.ai Founder Sachin Dev Duggal's Strategic Approach to Create an Innova...Ramesh Iyer
In today's fast-changing business world, Companies that adapt and embrace new ideas often need help to keep up with the competition. However, fostering a culture of innovation takes much work. It takes vision, leadership and willingness to take risks in the right proportion. Sachin Dev Duggal, co-founder of Builder.ai, has perfected the art of this balance, creating a company culture where creativity and growth are nurtured at each stage.
Accelerate your Kubernetes clusters with Varnish CachingThijs Feryn
A presentation about the usage and availability of Varnish on Kubernetes. This talk explores the capabilities of Varnish caching and shows how to use the Varnish Helm chart to deploy it to Kubernetes.
This presentation was delivered at K8SUG Singapore. See https://feryn.eu/presentations/accelerate-your-kubernetes-clusters-with-varnish-caching-k8sug-singapore-28-2024 for more details.
Key Trends Shaping the Future of Infrastructure.pdfCheryl Hung
Keynote at DIGIT West Expo, Glasgow on 29 May 2024.
Cheryl Hung, ochery.com
Sr Director, Infrastructure Ecosystem, Arm.
The key trends across hardware, cloud and open-source; exploring how these areas are likely to mature and develop over the short and long-term, and then considering how organisations can position themselves to adapt and thrive.
Connector Corner: Automate dynamic content and events by pushing a buttonDianaGray10
Here is something new! In our next Connector Corner webinar, we will demonstrate how you can use a single workflow to:
Create a campaign using Mailchimp with merge tags/fields
Send an interactive Slack channel message (using buttons)
Have the message received by managers and peers along with a test email for review
But there’s more:
In a second workflow supporting the same use case, you’ll see:
Your campaign sent to target colleagues for approval
If the “Approve” button is clicked, a Jira/Zendesk ticket is created for the marketing design team
But—if the “Reject” button is pushed, colleagues will be alerted via Slack message
Join us to learn more about this new, human-in-the-loop capability, brought to you by Integration Service connectors.
And...
Speakers:
Akshay Agnihotri, Product Manager
Charlie Greenberg, Host
Smart TV Buyer Insights Survey 2024 by 91mobiles.pdf91mobiles
91mobiles recently conducted a Smart TV Buyer Insights Survey in which we asked over 3,000 respondents about the TV they own, aspects they look at on a new TV, and their TV buying preferences.
Neuro-symbolic is not enough, we need neuro-*semantic*Frank van Harmelen
Neuro-symbolic (NeSy) AI is on the rise. However, simply machine learning on just any symbolic structure is not sufficient to really harvest the gains of NeSy. These will only be gained when the symbolic structures have an actual semantics. I give an operational definition of semantics as “predictable inference”.
All of this illustrated with link prediction over knowledge graphs, but the argument is general.
The Art of the Pitch: WordPress Relationships and SalesLaura Byrne
Clients don’t know what they don’t know. What web solutions are right for them? How does WordPress come into the picture? How do you make sure you understand scope and timeline? What do you do if sometime changes?
All these questions and more will be explored as we talk about matching clients’ needs with what your agency offers without pulling teeth or pulling your hair out. Practical tips, and strategies for successful relationship building that leads to closing the deal.
Slack (or Teams) Automation for Bonterra Impact Management (fka Social Soluti...Jeffrey Haguewood
Sidekick Solutions uses Bonterra Impact Management (fka Social Solutions Apricot) and automation solutions to integrate data for business workflows.
We believe integration and automation are essential to user experience and the promise of efficient work through technology. Automation is the critical ingredient to realizing that full vision. We develop integration products and services for Bonterra Case Management software to support the deployment of automations for a variety of use cases.
This video focuses on the notifications, alerts, and approval requests using Slack for Bonterra Impact Management. The solutions covered in this webinar can also be deployed for Microsoft Teams.
Interested in deploying notification automations for Bonterra Impact Management? Contact us at sales@sidekicksolutionsllc.com to discuss next steps.
UiPath Test Automation using UiPath Test Suite series, part 4DianaGray10
Welcome to UiPath Test Automation using UiPath Test Suite series part 4. In this session, we will cover Test Manager overview along with SAP heatmap.
The UiPath Test Manager overview with SAP heatmap webinar offers a concise yet comprehensive exploration of the role of a Test Manager within SAP environments, coupled with the utilization of heatmaps for effective testing strategies.
Participants will gain insights into the responsibilities, challenges, and best practices associated with test management in SAP projects. Additionally, the webinar delves into the significance of heatmaps as a visual aid for identifying testing priorities, areas of risk, and resource allocation within SAP landscapes. Through this session, attendees can expect to enhance their understanding of test management principles while learning practical approaches to optimize testing processes in SAP environments using heatmap visualization techniques
What will you get from this session?
1. Insights into SAP testing best practices
2. Heatmap utilization for testing
3. Optimization of testing processes
4. Demo
Topics covered:
Execution from the test manager
Orchestrator execution result
Defect reporting
SAP heatmap example with demo
Speaker:
Deepak Rai, Automation Practice Lead, Boundaryless Group and UiPath MVP
Epistemic Interaction - tuning interfaces to provide information for AI supportAlan Dix
Paper presented at SYNERGY workshop at AVI 2024, Genoa, Italy. 3rd June 2024
https://alandix.com/academic/papers/synergy2024-epistemic/
As machine learning integrates deeper into human-computer interactions, the concept of epistemic interaction emerges, aiming to refine these interactions to enhance system adaptability. This approach encourages minor, intentional adjustments in user behaviour to enrich the data available for system learning. This paper introduces epistemic interaction within the context of human-system communication, illustrating how deliberate interaction design can improve system understanding and adaptation. Through concrete examples, we demonstrate the potential of epistemic interaction to significantly advance human-computer interaction by leveraging intuitive human communication strategies to inform system design and functionality, offering a novel pathway for enriching user-system engagements.
Encryption in Microsoft 365 - ExpertsLive Netherlands 2024Albert Hoitingh
In this session I delve into the encryption technology used in Microsoft 365 and Microsoft Purview. Including the concepts of Customer Key and Double Key Encryption.
Encryption in Microsoft 365 - ExpertsLive Netherlands 2024
Data Management in Emergency Prevention and Response
1. Data Management in Emergency Prevention and
Response
NEARC Spring Conference - 2015
Michael Funaro, Latitude Geographics
2. GIS is frequently used to assemble the "big picture" in a
disaster. Among other things, it is essential for a GIS system to
help decision makers understand where first responder
resources are located and where help is needed.
GEOG 588
Planning GIS for Emergency Management
PENN State
Dept of Geography
https://www.e-education.psu.edu/geog588/l6_p5.html
3.
4. Before an incident takes place..
48° 25’ 32 N
123° 22’ 11” W
Operations Center GIS support ensures all relevant data is
present and well categorized so that incident commanders
have immediate access to information such as:
Critical infrastructure
Special needs participants
Structured pre-plan documents
Utility infrastructure
8. GEOG 588
Effective response to a disaster depends on quickly
synthesizing actionable information and disseminating that
information to responders in the field.
https://www.e-education.psu.edu/geog588/l6_p5.html
9. Today…
1. Trends for web technologies
2. Strategies for building web applications
10. GEOG 588
A persistent issue with the application of GIS to emergency management is that
there is often a significant knowledge gap between the GIS experts who know and
understand the tools and intricacies of geographic data and the decision makers
who have to act on information derived from GIS systems.
Training decision makers on the use of GIS is not practical in most circumstances
(and during a crisis situation, it's already too late)
11.
12.
13.
14. GEOG 588
Some design criteria for GIS-enabled dashboards could include:
The system must allow non-programmer analysts to quickly customize
the map/app
Tools and graphics must be readily understandable by decision makers
who have no GIS training.
Tools and graphics should focus on strategic objectives and the "big
picture.
15. Future COP designs must solve a different problem: how to
dynamically collect and situationally organize information in a
way that is relevant to the commander’s decision process
Hence, future COP designs will be “concept-driven” as much as
they are “data-driven”
Dennis K. Leedom, Ph.D.
Evidence Based Research, Inc
16. Reimagining Focus
Persona: a fictional representative
of the user you are building the
application for.
The protector and defender of
your interface.
17. Incident Commanders
What are their
capabilities?
What are their biases?
What are their goals?
What tasks do they
regularly perform?
18. For example…
Users should be allowed to add map
data directly within the Incident
Response Application interface!
I don’t have time to add map data
during an incident;
I only want the tools that I need.
19. How do incident commanders
and responders locate and
access data?
Don’t make me hunt
for information.
Offer what you have available
and make me aware of
important information.
23. Connect with Any Type of Streaming Data Feed
In Vehicle GPS
Mobile Devices
Social Media Providers
Other Web Services
Detect and focus on IMPORTANT event, locations, thresholds
Track dynamic assets (Vehicles, People); or stationary assets (Weather,
Environmental Monitors)
Send ALERTS, update map, append database, interact with other systems
GeoEvent Extension for Server
24. Input Connectors create a standard integration interface specification for:
• EM Systems (WebEOC, NC4, Disaster LAN)
• Dispatch (CAD) Systems (Intrado, …)
• EM Network feeds (MASAS-X, UCIDS)
• Vehicle GPS Systems (Vehicles)
• Radio GPS Systems (Responders)
• Sensors (wind, water level, etc.)
• GeoRSS feeds
• Social Media (Twitter, Instagram, DataSift)
GeoEvent Extension for Server
25. Real time data and interactions
• Stream Services
• WebSockets
27. Social Feeds
Multiplayer Games
Collaborative editing/coding
Clickstream Data
Financial Tickers
Sports Updates
Multimedia Chat
Online Education
Location-based Apps
Determining whether to use WebSockets for the Job at hand:
• Does your app involve multiple users communicating with
each other?
• Is your app a window into server-side data that’s constantly
changing?
28.
29.
30. In Person Map InteractionSee this
block here?
Yes
I need you to
approach
through the
park from the
west and look
for any injured. OK
Check in when
you arrive
here.
OK
31. Collaboration
Engaging in map-and-
marker conversations
when geographically
separated is difficult
See the large park in
quadrant E7?
The one south of
E7?
Roger. Enter from 9th
St. on the west side.
Near the
intersection of pine?
Roger. Sweep the
park for evacuation.
Roger.
Check in when you
reach the
intersection of 11th
and Spruce
Roger. Is that still
outside the hazmat
zone?
Affirmative.
33. Making collaboration technology
work in real-world scenarios
Web meeting patterns:
Finicky
Too long to set up
Instant messaging patterns:
Need pre-established
connections
Not good for visual information
My tactical radio
works great!
34. Collaboration Channels
Same “feel” as tactical radio
Can support many participants
Map immediately shows same
extent and scale that others see in
the channel
Members can observe while
listening to radio and participate
with the draw tool when needed
Long before an incident takes place, the planning can be done by the publics safety team and Operations Centre GIS support, to ensures that relevant local data is present and well categorized so our incident commander receives all available information in a compact, filterable, miniature briefing book. This often includes information such as:* Critical Infrastructure* Special Needs Registry Participants* Structure Pre-Plan Documents (access, egress, hazardous materials storage, emergency action plans)
This is where your previous investment in GIS data shines, as you can tie your relevant existing data to this communication system and disseminate it as reuqired
The Operations Center , or Incident Command Center, becomes a node for this information being quickly shared in the field. Interoperability and collaboration can be realized during the emergency situation
If providing easy, relevant access to traditional map data can be re-imagined in this way … anything is possible!
One of the first areas that needed re-imagining was the way in which incident commanders and incident responders locate and access data. Our market research and our persona Larry were clearly telling us: “Don’t make me hunt for information; offer what you have available and make me aware of important information”
Communication is eased when everyone is gathered together
Anyone who has been involved in field incident response is familiar with the sight of a group of people gathered around a paper map, pointing, marking, discussing, and planning.
Even with identical maps and a good grid coordinate reference system, engaging in a map-and-marker conversations is really difficult, and even more difficult when geographically separated .
Once again using modern HTML5 web socket technologies we were able to enable virtual map-and-marker collaboration between a group of geographically separated responders. One shared map extent that tracks adjustments, and a finger-friendly red pen to sketch on the map.
We got the technology working for nearly instantaneous virtual map-and-marker collaboration among field responders and incident commanders … but we still had a problem
Have you joined a web meeting lately with several participant where everyone arrived without challenge, could be heard clearly, and could make all the technology work? Neither have we. Yet we needed to ensure this interaction was quick and reliable for our incident commander and field responders to use.
We looked at web meeting patterns … but they can be finicky, involve several steps to setup, and require you to identify, select, and add each individual … something that clearly wasn’t going to work in a time-critical incident situation.
We looked at instant messaging patterns … but they required pre-established connections between individuals and weren’t particularly good at sharing visual information.
Then we went back to Larry, our persona, and we took another long hard look at the world from his perspective and we realized there is a communications device that Larry knows well and uses daily …
His tactical radio
Leaving the voice communication to pre-established mechanisms we created map-collaboration channels based upon the same ‘feel’ as a tactical radio.
Collaboration channels can be pre-assigned or open for general use, and can support many, many participants.
When the incident commander radios a field team and tell them he wants them to join map collaboration channel 1 to do some planning each field responder accesses the list of map collaboration channels, and taps the desired channel to enter. Enter the wrong channel? No problem just tap “leave channel” to return to the list of channels and re-enter the correct channel. Their map immediately shows the same extent and scale as the others in the collaboration channel and they can observe the planning activity while listening to their radio and participate with their red pen if needed.
Can describe the deployment of an app for the Washington slide, within a few days of the event
Less to purchase – not requiring custom development cost up front
When investing in a COTS – ongoing cost is small, and new features continue to evolve over time,