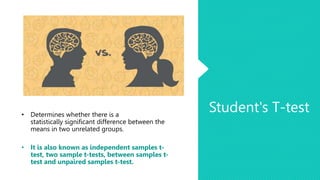
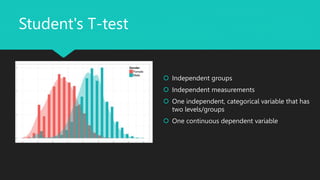
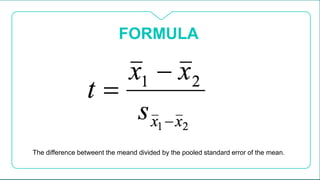
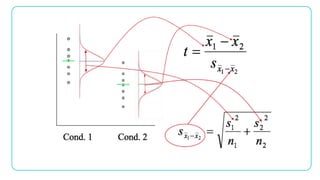
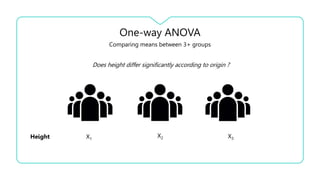
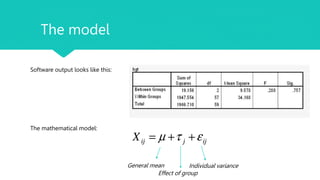
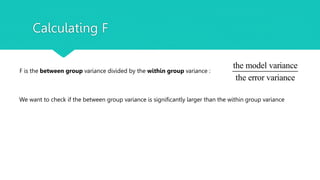
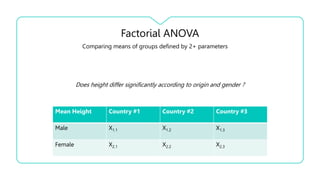
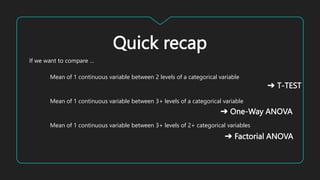
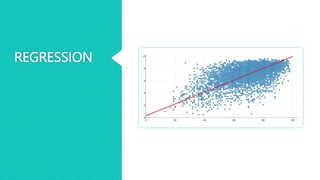
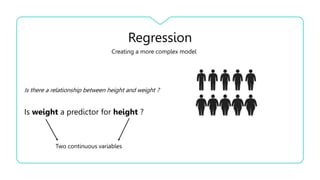
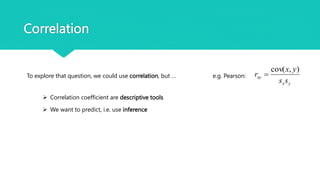
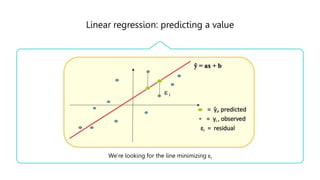
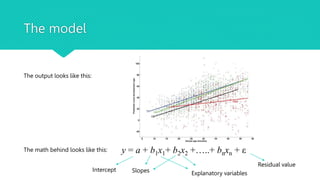
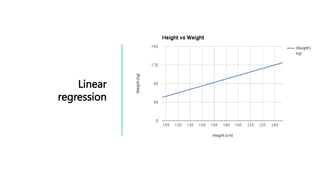
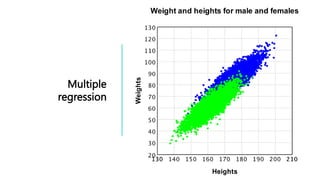
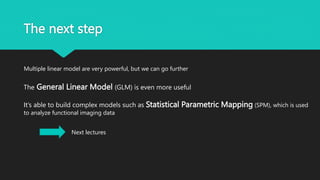
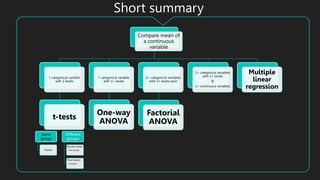
T-tests, ANOVAs and Regression
T
General
Assumptions
 Normal distribution
 There should be no significant outliers
 Homogenity of variance
 Independence (in most cases)
Parametric testing
Testing the assumptions
 Data collection & study design
 Histogram & Q-Q plot
 Levene’s test
• Independence
• Normality of distribution
• Similar variance across groups
T-TESTS
T-tests
 The t test is one type of inferential,
parametric statistic
 Determine whether there is a
significant difference between the
means of two groups / conditions
 There are three main types
Student's T-test
How can we determine, to a reasonable
degree of scientific certainty, if one
variety of barley yields more than
another?
William Sealy Gosset
1908
Student's T-test
• Determines whether there is a
statistically significant difference between the
means in two unrelated groups.
• It is also known as independent samples t-
test, two sample t-tests, between samples t-
test and unpaired samples t-test.
 Independent groups
 Independent measurements
 One independent, categorical variable that has
two levels/groups
 One continuous dependent variable
Student's T-test
FORMULA
The difference betweent the meand divided by the pooled standard error of the mean.
Field 1 Field 2
15.2 15.9
15.3 15.9
16.0 15.2
15.8 16.6
15.6 15.2
14.9 15.8
15.0 16.2
15.4 15.6
15.6 15.6
15.7 15.8
15.5 16.2
15.2 15.6
15.5 15.8
15.2 15.5
15.5 15.5
15.1 15.5
15.3 14.9
15.0 15.9
15.38125 15.68125
• Critical Value: 2.042
• T-Value: 2.3
• We reject H0
• Significance level: 0.05
• Degrees of freedom: (n1 + n2 ) - 2
• Degrees of freedom: (16 + 16 ) - 2 = 30
P-value: .026
T test
One-tailed and two-tailed tests
P= ≤ 0.05
Which intervention is more effective in lowering
cholesterol levels in overweight males: Exercise or weight
loss?
This study found that overweight,
physically inactive male participants
had statistically significantly lower
cholesterol concentrations (5.80 ±
0.38 mmol/L) at the end of an
exercise-training programme
compared to after a calorie-
controlled diet (6.15 ± 0.52
mmol/L), t(38) = 2.428, p = 0.020.
Paired T-test
 Estimate whether the means of two related
measurements are significantly different from one
another
 Used when two continuous variables are related
 Same participant at different times
 Different sites on the same person
 Cases and their matched controls.
 Also known as within-subjects, repeated-measures
and dependent-samples.
Paired T-test
 The outcome variable has a continuous
scale
 The differences between the pairs of
measurements are normally distributed
 The interest is on the difference in the
outcome measurements between each pair
One sample T-test  There is only one group which is to be compared to a set
value or a known population mean.
T-tests
Means come
from the same
group?
Yes
Paired t-test
No
Comparing
means of 2
groups?
Student's T-test
Comparing
mean of a group
against a known
mean?
One-sample T-
test
ANOVA
• One-way ANOVA
• Two-way ANOVA
Analysis of Variance - ANOVA
2 Groups
1 Parameter
➔ ?
3+ groups
2+ parameters
➔ t-test
ANOVA
One-way ANOVA
Comparing means between 3+ groups
Does height differ significantly according to origin ?
Height X1 X3
X2
The model
Software output looks like this:
The mathematical model:
General mean
Effect of group
Individual variance
Calculating F
F is the between group variance divided by the within group variance :
the model variance
the error variance
We want to check if the between group variance is significantly larger than the within group variance
Factorial ANOVA
Comparing means of groups defined by 2+ parameters
Mean Height Country #1 Country #2 Country #3
Male X1.1 X1.2 X1.3
Female X2.1 X2.2 X2.3
Does height differ significantly according to origin and gender ?
The model
Software output looks like this:
The mathematical model:
Xijk=µ+αi+βj+αβij+εijk
General mean
Effect of variable 1 Effect of variable 2
Effect of interaction between 1 & 2
Individual variation
Post-Hoc tests
If the test proves significant, we can expect an effect, but which one ?
Several tests can be run after the ANOVA :
• Conservative tests include Bonferroni correction
• Liberal tests include Student-Newman-Keuls test
They tell us which groups are significantly different, and how they are different.
What one-way ANOVAs can tell us
What can we conclude from a one-way ANOVA ?
The mean value of group #1 is significantly higher than that of population #2 & 3
In a paper:
There was a statistically significant difference between groups as determined by one-way ANOVA
(F(2,27) = 4.467, p = .021). A Tukey post hoc test revealed that the time to complete the problem was
statistically significantly lower after taking the intermediate (23.6 ± 3.3 min, p = .046) and advanced
(23.4 ± 3.2 min, p = .034) course compared to the beginners course (27.2 ± 3.0 min). There was no
statistically significant difference between the intermediate and advanced groups (p = .989).
The short way:
What factorial ANOVAs can tell us
There is an effect of the interaction between variables #2&3 on the mean value of the continuous variable.
The short way:
In a paper:
A two-way ANOVA was conducted that examined the effect of gender and education level on interest in
politics. There was a statistically significant interaction between the effects of gender and education level on
interest in politics, F (2, 54) = 4.643, p = .014.
Simple main effects analysis showed that males were significantly more interested in politics than females
when educated to university level (p = .002), but there were no differences between gender when educated
to school (p = .465) or college level (p = .793).
Quick recap
If we want to compare …
Mean of 1 continuous variable between 2 levels of a categorical variable
Mean of 1 continuous variable between 3+ levels of a categorical variable
Mean of 1 continuous variable between 3+ levels of 2+ categorical variables
➔ T-TEST
➔ One-Way ANOVA
➔ Factorial ANOVA
REGRESSION
Regression
Is there a relationship between height and weight ?
Creating a more complex model
Is weight a predictor for height ?
Two continuous variables
Correlation
To explore that question, we could use correlation, but …
 Correlation coefficient are descriptive tools
 We want to predict, i.e. use inference
e.g. Pearson:
y
x
xy
s
s
y
x
r
)
,
cov(

Linear regression: predicting a value
We’re looking for the line minimizing εi
The model
The output looks like this:
The math behind looks like this: y = a + bx
y = a + b1x1+ b2x2 +…..+ bnxn + ε
Intercept Slopes Explanatory variables
Residual value
Linear
regression
Multiple
regression
The next step
Multiple linear model are very powerful, but we can go further
Next lectures
The General Linear Model (GLM) is even more useful
It’s able to build complex models such as Statistical Parametric Mapping (SPM), which is used
to analyze functional imaging data
Short summary
Compare mean of
a continuous
variable
1 categorical variable
with 2 levels
t-tests
1 categorical variable
with 3+ levels
One-way
ANOVA
2+ categorical variables
with 3+ levels each
Factorial
ANOVA
2+ categorical variables
with 3+ levels
&
2+ continuous variables
Multiple
linear
regression
Same
group
Paired
Different
groups
Known mean
• One sample
Two means
• Unpaired
Questions?
References
 Bozeman Science. (2016). Student's t test. [Video].
Available at: https://www.youtube.com/watch?v=pTmLQvMM-1M. (Accessed: 25 October 2018)
 Peat, J., & Barton, B.(2005). Medical Statistics. A Guide to Data Analysis and Critical Appraisal.
Sydney: Blackwell Publishing.
 University of Wisconsin. (2017) T test. Available at: https://researchbasics.education.uconn.edu/t-
test/. (Accessed: 22 October 2018)
 https://statistics.laerd.com/

Lec1_Methods-for-Dummies-T-tests-anovas-and-regression.pptx

  • 1.
  • 2.
    T General Assumptions  Normal distribution There should be no significant outliers  Homogenity of variance  Independence (in most cases) Parametric testing
  • 3.
    Testing the assumptions Data collection & study design  Histogram & Q-Q plot  Levene’s test • Independence • Normality of distribution • Similar variance across groups
  • 4.
  • 5.
    T-tests  The ttest is one type of inferential, parametric statistic  Determine whether there is a significant difference between the means of two groups / conditions  There are three main types
  • 6.
    Student's T-test How canwe determine, to a reasonable degree of scientific certainty, if one variety of barley yields more than another? William Sealy Gosset 1908
  • 8.
    Student's T-test • Determineswhether there is a statistically significant difference between the means in two unrelated groups. • It is also known as independent samples t- test, two sample t-tests, between samples t- test and unpaired samples t-test.
  • 9.
     Independent groups Independent measurements  One independent, categorical variable that has two levels/groups  One continuous dependent variable Student's T-test
  • 10.
    FORMULA The difference betweentthe meand divided by the pooled standard error of the mean.
  • 12.
    Field 1 Field2 15.2 15.9 15.3 15.9 16.0 15.2 15.8 16.6 15.6 15.2 14.9 15.8 15.0 16.2 15.4 15.6 15.6 15.6 15.7 15.8 15.5 16.2 15.2 15.6 15.5 15.8 15.2 15.5 15.5 15.5 15.1 15.5 15.3 14.9 15.0 15.9 15.38125 15.68125
  • 13.
    • Critical Value:2.042 • T-Value: 2.3 • We reject H0 • Significance level: 0.05 • Degrees of freedom: (n1 + n2 ) - 2 • Degrees of freedom: (16 + 16 ) - 2 = 30 P-value: .026 T test
  • 14.
    One-tailed and two-tailedtests P= ≤ 0.05
  • 15.
    Which intervention ismore effective in lowering cholesterol levels in overweight males: Exercise or weight loss? This study found that overweight, physically inactive male participants had statistically significantly lower cholesterol concentrations (5.80 ± 0.38 mmol/L) at the end of an exercise-training programme compared to after a calorie- controlled diet (6.15 ± 0.52 mmol/L), t(38) = 2.428, p = 0.020.
  • 16.
    Paired T-test  Estimatewhether the means of two related measurements are significantly different from one another  Used when two continuous variables are related  Same participant at different times  Different sites on the same person  Cases and their matched controls.  Also known as within-subjects, repeated-measures and dependent-samples.
  • 17.
    Paired T-test  Theoutcome variable has a continuous scale  The differences between the pairs of measurements are normally distributed  The interest is on the difference in the outcome measurements between each pair
  • 18.
    One sample T-test There is only one group which is to be compared to a set value or a known population mean.
  • 19.
    T-tests Means come from thesame group? Yes Paired t-test No Comparing means of 2 groups? Student's T-test Comparing mean of a group against a known mean? One-sample T- test
  • 20.
  • 21.
    Analysis of Variance- ANOVA 2 Groups 1 Parameter ➔ ? 3+ groups 2+ parameters ➔ t-test ANOVA
  • 22.
    One-way ANOVA Comparing meansbetween 3+ groups Does height differ significantly according to origin ? Height X1 X3 X2
  • 23.
    The model Software outputlooks like this: The mathematical model: General mean Effect of group Individual variance
  • 24.
    Calculating F F isthe between group variance divided by the within group variance : the model variance the error variance We want to check if the between group variance is significantly larger than the within group variance
  • 25.
    Factorial ANOVA Comparing meansof groups defined by 2+ parameters Mean Height Country #1 Country #2 Country #3 Male X1.1 X1.2 X1.3 Female X2.1 X2.2 X2.3 Does height differ significantly according to origin and gender ?
  • 26.
    The model Software outputlooks like this: The mathematical model: Xijk=µ+αi+βj+αβij+εijk General mean Effect of variable 1 Effect of variable 2 Effect of interaction between 1 & 2 Individual variation
  • 27.
    Post-Hoc tests If thetest proves significant, we can expect an effect, but which one ? Several tests can be run after the ANOVA : • Conservative tests include Bonferroni correction • Liberal tests include Student-Newman-Keuls test They tell us which groups are significantly different, and how they are different.
  • 28.
    What one-way ANOVAscan tell us What can we conclude from a one-way ANOVA ? The mean value of group #1 is significantly higher than that of population #2 & 3 In a paper: There was a statistically significant difference between groups as determined by one-way ANOVA (F(2,27) = 4.467, p = .021). A Tukey post hoc test revealed that the time to complete the problem was statistically significantly lower after taking the intermediate (23.6 ± 3.3 min, p = .046) and advanced (23.4 ± 3.2 min, p = .034) course compared to the beginners course (27.2 ± 3.0 min). There was no statistically significant difference between the intermediate and advanced groups (p = .989). The short way:
  • 29.
    What factorial ANOVAscan tell us There is an effect of the interaction between variables #2&3 on the mean value of the continuous variable. The short way: In a paper: A two-way ANOVA was conducted that examined the effect of gender and education level on interest in politics. There was a statistically significant interaction between the effects of gender and education level on interest in politics, F (2, 54) = 4.643, p = .014. Simple main effects analysis showed that males were significantly more interested in politics than females when educated to university level (p = .002), but there were no differences between gender when educated to school (p = .465) or college level (p = .793).
  • 30.
    Quick recap If wewant to compare … Mean of 1 continuous variable between 2 levels of a categorical variable Mean of 1 continuous variable between 3+ levels of a categorical variable Mean of 1 continuous variable between 3+ levels of 2+ categorical variables ➔ T-TEST ➔ One-Way ANOVA ➔ Factorial ANOVA
  • 31.
  • 32.
    Regression Is there arelationship between height and weight ? Creating a more complex model Is weight a predictor for height ? Two continuous variables
  • 33.
    Correlation To explore thatquestion, we could use correlation, but …  Correlation coefficient are descriptive tools  We want to predict, i.e. use inference e.g. Pearson: y x xy s s y x r ) , cov( 
  • 34.
    Linear regression: predictinga value We’re looking for the line minimizing εi
  • 35.
    The model The outputlooks like this: The math behind looks like this: y = a + bx y = a + b1x1+ b2x2 +…..+ bnxn + ε Intercept Slopes Explanatory variables Residual value
  • 36.
  • 37.
  • 38.
    The next step Multiplelinear model are very powerful, but we can go further Next lectures The General Linear Model (GLM) is even more useful It’s able to build complex models such as Statistical Parametric Mapping (SPM), which is used to analyze functional imaging data
  • 39.
    Short summary Compare meanof a continuous variable 1 categorical variable with 2 levels t-tests 1 categorical variable with 3+ levels One-way ANOVA 2+ categorical variables with 3+ levels each Factorial ANOVA 2+ categorical variables with 3+ levels & 2+ continuous variables Multiple linear regression Same group Paired Different groups Known mean • One sample Two means • Unpaired
  • 40.
  • 41.
    References  Bozeman Science.(2016). Student's t test. [Video]. Available at: https://www.youtube.com/watch?v=pTmLQvMM-1M. (Accessed: 25 October 2018)  Peat, J., & Barton, B.(2005). Medical Statistics. A Guide to Data Analysis and Critical Appraisal. Sydney: Blackwell Publishing.  University of Wisconsin. (2017) T test. Available at: https://researchbasics.education.uconn.edu/t- test/. (Accessed: 22 October 2018)  https://statistics.laerd.com/

Editor's Notes

  • #29 Insert total sentence
  • #30 First pay attention to interaction effects > simple main effects