This document contains a statistics reviewer with multiple choice questions and answers about statistical concepts such as:
- Levels of measurement (nominal, ordinal, interval, ratio)
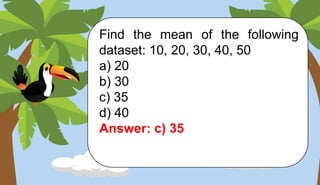
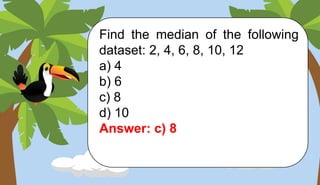
- Measures of central tendency (mean, median, mode)
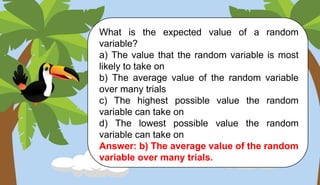
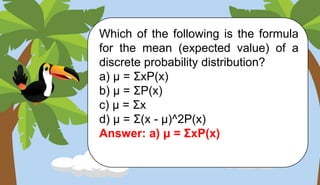
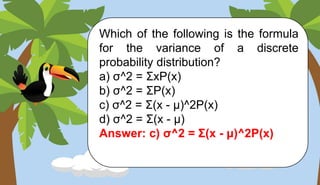
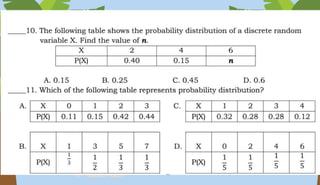
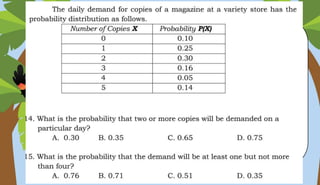
- Probability distributions and calculating expected values
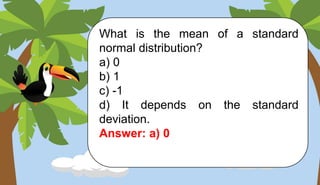
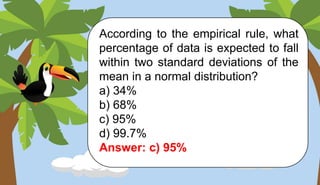
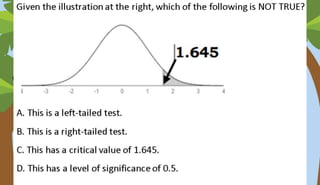
- The normal distribution and z-scores
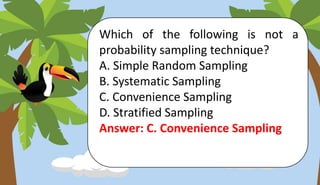
- Sampling methods (simple random sampling, stratified sampling)
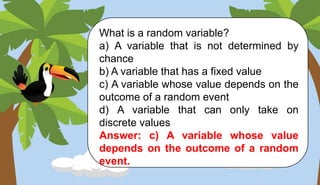
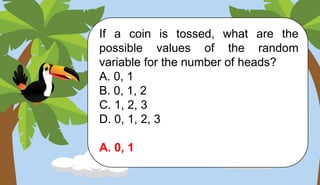
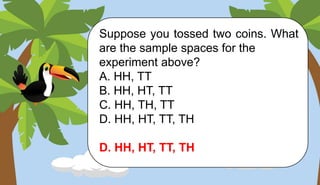
The questions cover topics like identifying different levels of measurement, calculating averages, interpreting empirical rules for the normal distribution, and defining random variables, probability distributions, and sampling techniques.